the depth distribution of seismicity at the...
TRANSCRIPT

F.A. TUGUME AND A.A. NYBLADE 261
IntroductionIn this study, data from a six-month deployment ofseismic stations around the northern end of theRwenzori mountains have been used to investigate the depth extent of seismicity and its implications forheat flow from the Western Branch of the East AfricanRift System (EARS) in Uganda. Previous seismicitystudies of the Western Branch in Uganda showearthquake nucleation at depths greater than or equal to35 km (Albaric et al., 2008; Maasha, 1975; Ochman et al.,2007), suggesting that heat flow from the rift is notelevated. The average heat flow in Proterozoic mobilebelts in East Africa away from the rift valleys is 63 mWm-2 (Nyblade, 1997), and Nyblade and Langston(1995), using a rheological model for the crust with abrittle upper crust and ductile lower crust (Brace andKohlstedt, 1980; Byerlee, 1968; Ranalli 1987), showedthat for a heat flow of 63 mWm-2, brittle deformation,and therefore seismicity, can extend to crustal depths of~30 to 35 km.
However, heat flow elsewhere along the WesternBranch is elevated (~109 mWm-2 in western Tanzania;
73 mWm-2 and 67 mWm-2 in Lakes Kivu and Tanganyika,respectively; Nyblade et al., 1990), similar to the elevatedheat flow (100 mWm-2) in the Eastern Branch of theEARS in Kenya (Wheildon et al., 1994). And for a heatflow of ~100 mWm-2, it is unlikely that brittledeformation and therefore seismicity would extendmuch deeper than about 10 km.
To investigate further the depth extent of seismicityin the Western Branch, seismic data were collected andanalysed to obtain accurate hypocenters from thenorthern part of Rwenzori Mountains. Events werelocated using both standard and double differencealgorithms, and focal mechanisms were obtained toplace constraints on the local stress regime. Results showthat seismicity, which is concentrated along the majorborder faults of the Rwenzori horst, extends to lowercrustal depths. This result is analysed using strengthenvelope models to place new constraints on heat flowfrom the Western Branch in Uganda.
Background informationThe EARS is a classic example of an active continental
THE DEPTH DISTRIBUTION OF SEISMICITY AT THE NORTHERNEND OF THE RWENZORI MOUNTAINS: IMPLICATIONS FOR HEATFLOW IN THE WESTERN BRANCH OF THE EAST AFRICAN RIFTSYSTEM IN UGANDA
F.A. TUGUMEDepartment of Geosciences, Pennsylvania State University, University Park, United States of AmericaDepartment of Geological Survey and Mines, P.O. Box 9, Entebbe Ugandae-mail: [email protected] • [email protected]
A.A. NYBLADEDepartment of Geosciences, Pennsylvania State University, University Park, United States of AmericaUniversity of the Witwatersrand, Private Bag 3, WITS, 2050 South Africae-mail: [email protected]
© 2009 December Geological Society of South Africa
Abstract
Data from a six-month deployment of seismic stations around the northern end of the Rwenzori Mountains have been used to
investigate the depth extent of seismicity and its implications for heat flow in the Western Branch of the East Africa Rift System in
Uganda. Previous seismicity studies of the Western Branch in Uganda show earthquake nucleation at depths greater than or equal
to 40 km suggesting that heat flow from the rift is not elevated. However, heat flow elsewhere in the Western Branch (e.g., western
Tanzania and Lakes Kivu and Tanganyika) is elevated, similar to the elevated heat flow in the Eastern Branch of the East African
Rift System in Kenya.
To investigate further the depth extent of seismicity in the Western Branch, seismological data were collected and analysed to
obtain accurate hypocenters using both standard and double difference location algorithms. Focal mechanisms were also obtained
to place constraints on the local stress regime. Results show that seismicity is concentrated along the major border faults of the
Rwenzori horst, suggesting an eastward dip on the Ruimi-Wasa Fault and a northwestward dip on the Toro-Bunyoro Fault.
Fault motions are predominantly normal, with possible strike slip motions between the Ruimi-Wasa and Toro-Bunyoro Faults.
The number of earthquakes increases with depth, peaking at 16 km and falling sharply by 22 km. Strength envelope models
indicate that heat flow in the range of 54 mWm-2 to 66 mWm-2 is required to explain this result. A heat flow of 54 to 66 mWm-2
is similar to heat flow in other mobile belts in East Africa away from major rift valleys, and therefore heat flow around the Rwenzori
Mountains does not appear to be elevated. This finding does not preclude the possibility of a deep seated (i.e., mantle) thermal
anomaly beneath the rift, which may not have had sufficient time to reach the surface.
SOUTH AFRICAN JOURNAL OF GEOLOGY, 2009, VOLUME 112 PAGE 261-276
doi:10.2113/gssajg.112.3-4.261

rift and represents the incipient stages of continentalbreak up (Fairhead and Stuart, 1982). The EasternBranch of the EARS extends from the Afar Depression inEthiopia, through Kenya and into Tanzania (Gregory,1921; Sikes, 1936) (Figure 1). The Western Branch of theEARS extends from southern Sudan through westernUganda, Rwanda, Burundi and Tanzania along theboundary with the Democratic Republic of Congo(Figure 1).
The EARS formed within the Precambrian basementof East Africa, which consists of the Archean Tanzania
craton in the centre of the region surrounded by a number of Proterozoic mobile belts (Figure 1). The formation of the two branches of the EARS mayhave begun at different times but both branchesexperienced significant tectonic activity in the lateCenozoic (Chorowicz, 2005; Ebinger, 1989; Maasha andMolnar, 1972).
The main geological feature within the study area isthe Rwenzori Mountains, a large horst block about 120 km long and 65 km wide (Figures 2 and 3). The mountain range consists of late Archean and early
SOUTH AFRICAN JOURNAL OF GEOLOGY
THE DEPTH DISTRIBUTION OF SEISMICITY AT THE NORTHERN END OF THE RWENZORI MOUNTAINS262
Figure 1. Tectonic map of East Africa showing the major Precambrian terrains and rift faults of the Cenozoic East African Rift System.
The small box in western Uganda shows the location of this study.
F.A. TUGUME AND A.A. NYBLADE
SOUTH AFRICAN JOURNAL OF GEOLOGY
263
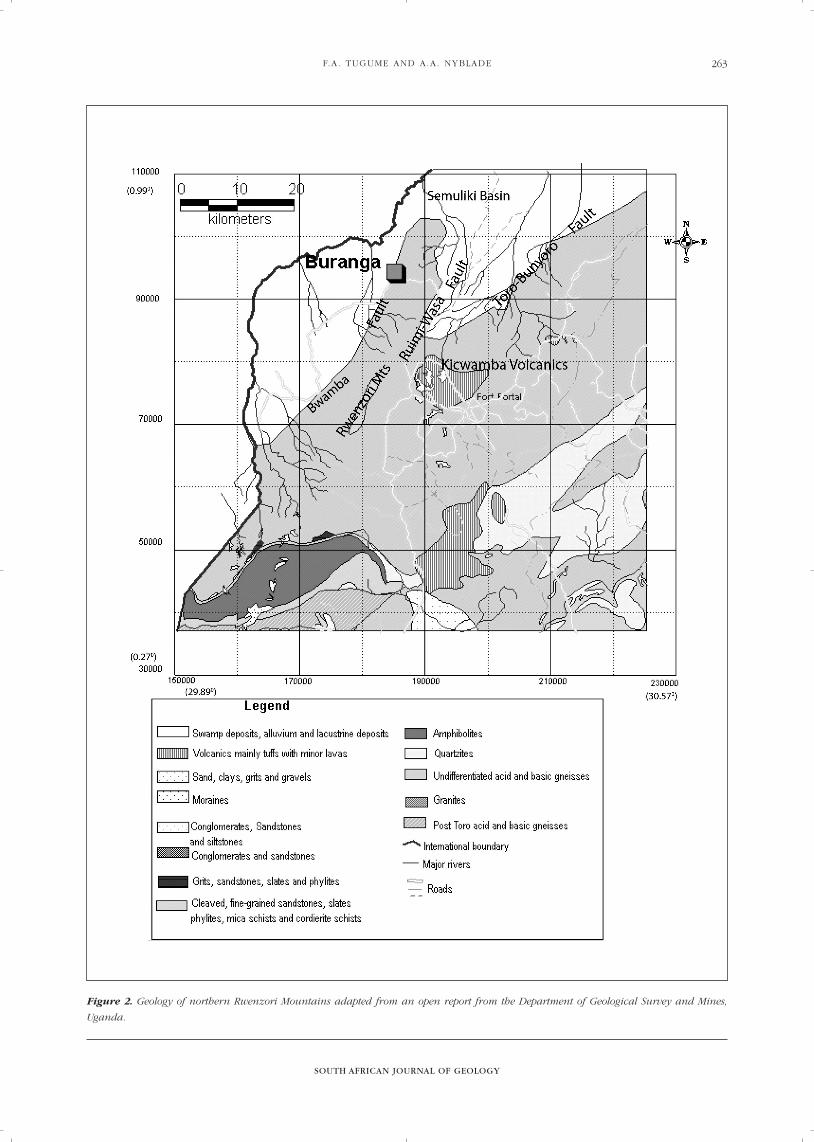
Figure 2. Geology of northern Rwenzori Mountains adapted from an open report from the Department of Geological Survey and Mines,
Uganda.

Proterozoic basement rock uplifted 5,000 m above sealevel (Tanner, 1973). The western side of the mountainrange is bounded by the Bwamba Fault, a steeplydipping normal fault (Ebinger, 1989). The eastern side ismore gradual, except for the north-northeast trendingRuimi-Wasa and Toro-Bunyoro Faults, which define thenarrow northern nose of the mountain range (McConnel,1972) (Figures 2 and 3). The Pleistocene-HoloceneKicwamba volcanic field lies just east of the Ruimi-WasaFault. Pleistocene-Holocene sediments, locally known asthe Kaiso-Kisegi beds, occupy the rift valley floor in theSemuliki basin, with thicknesses reaching 4000 to 6000metres (Figures 2 and 3).
A previous seismicity study in the region wasconducted by Maasha (1975), which employed fourshort period seismographs deployed at 28 different sitesthroughout the Rwenzori Mountains. The sites occupiedat any one time formed a quadrangle. Distancesbetween adjacent stations ranged from 5 to 20 km, and
the stations were run for 4 to 20 days at each site. Faultplane solutions from this study indicate that theRwenzori Mountains are bounded by normal faults(Maasha, 1975). The seismicity recorded was mainlyassociated with the Ruimi-Wasa Fault. Events locatedbeneath the mountain range extended to depths of 25 to40 km.
Seven moderate earthquakes in the region have beenstudied in detail using teleseismic data (Shudofsky, 1985;Shudofsky et al., 1987; Upcott et al., 1996). Earthquakefocal mechanisms show that the rift faults bordering the Semuliki basin and the southern end of the Lake Albert rift valley are oriented nearly north-south ornortheast-southwest. An exception to this general strikedirection is the north-northwest to northwest strikingKisomoro Fault, along which a M 6.2 earthquakeoccurred in February 1994. Thus, the region appears tobe under a state of east-west or northwest-southeastextension.
Figure 3. Topographic map of the study area showing major faults, the locations of seismic stations, and the Buranga hot spring.
The background topography is from 30 sec SRTM data.
SOUTH AFRICAN JOURNAL OF GEOLOGY
THE DEPTH DISTRIBUTION OF SEISMICITY AT THE NORTHERN END OF THE RWENZORI MOUNTAINS264

Data acquisition The Department of Geological Survey and Mines,Uganda, in collaboration with the Federal Institute ofGeosciences and Natural Resources (BGR), Germany,conducted a passive seismic survey around the Burangageothermal area between February and August 2006.The purpose of the seismic survey was to collect microearthquake data to aid in geothermal prospecting.Although the stations were in operation for a period ofseven months, data for only four months (March to June2006) had reliable timing and could be used in thisstudy.
Figure 3 shows the location of the seismic stations,which were arranged in a local network covering lessthan 60 square kilometers. The stations were equippedwith three component short period L4-3D Mark
seismometers. The data was recorded at a rate of 250 samples per second using 24-bit RefTek data loggersconfigured to operate in trigger mode. GlobalPositioning System clocks were used for timing.
Data analysis The data collected were analysed to obtain eventhypocenters and focal mechanisms. A standard event location programme was used to initially locatethe earthquakes, and then a double difference algorithmwas used to obtain relative event locations. Focalmechanisms were obtained using first motion polarities.
Phase pickingPg arrival times were picked for all events. Sg was notclearly seen on most seismograms and was thereforepicked for only a subset of events (74 total). A 0.5 to 5 Hz band pass filter was applied to the data prior to picking arrival times, which were picked to within0.1sec. Events with a minimum of four good qualitypicks were selected for further analysis. Figure 4 showssamples of the filtered seismograms illustrating thequality of P arrival picks.
Initial Hypocentral locationsArrival times were used with the HYPOELLIPSE program (Lahr 1998) to obtain initial hypocentral
Figure 4. Sample seismogram of an earthquake recorded by the network. The seismograms are vertical velocity records filtered between
0.5 to 5 Hz.
F.A. TUGUME AND A.A. NYBLADE
SOUTH AFRICAN JOURNAL OF GEOLOGY
265
Table 1. Velocity model used for event locations from Langston
et al. (2002).
Depth P Vel S Vel Density
(km) (km/s) (km/s) (kg/m3)
0 - 10 5.84 3.38 2.33
10 - 20 6.26 3.62 2.5
20 - 30 6.68 3.86 2.67
30 - 37 7.09 4.1 2.84
37 - 200 8.28 4.74 3.31

locations. In this programme, hypocenters are found byminimising the root-mean-square (RMS) of the travel-time residuals. Hypocenters for a total of 574 earthquakes were obtained. The velocity modelused in the analysis is from Langston et al. (2002) (Table 1), which is an average model for Precambrian terrains across eastern Africa. That model was usedbecause a local crustal model is not available for thestudy area.
For epicenters located within a radius of 40 km fromthe centre of the network, uncertainties in epicentrallocations, given by the 68% error ellipse, are ± 1 km.Uncertainties of ± 3 km are associated with epicentersmore than 40 km from the centre of the network.Uncertainties in source depth are ± 1 km within 40 kmof the centre of the network and increase to ± 5 km fordistances more than 40 km from the centre of thenetwork.
To further assess the variation of uncertainties withrespect to the velocity model, the velocities were
perturbed by ± 5% and then the events with Pg and Sgpicks were relocated. After relocation it was found thatthe epicenters shifted by no more than 0.5 km.
Relative event locationsRelative event locations were obtained by using thedouble-difference algorithm (HYPODD) of Waldehauser(2001). The advantage of the double-differencealgorithm over standard location algorithms is that whenthe difference between the hypocentral separations oftwo earthquakes is small compared to the event-stationdistance, then the ray paths between the source regionand a common station are similar along the entire path(Walderhauser and Ellsworth, 2000). The doubledifference algorithm minimises residual travel timedifferences for a pair of earthquakes at a single station.To find the optimal correlation lengths, event-stationseparation distances of 20, 30, 40, and 50 km were testedalong with event-event distances of 3, 5, 7, 10, and 15 km. Using correlation lengths of 40 km for event-
SOUTH AFRICAN JOURNAL OF GEOLOGY
THE DEPTH DISTRIBUTION OF SEISMICITY AT THE NORTHERN END OF THE RWENZORI MOUNTAINS266
Figure 5. Epicenters (black circles) obtained using P arrival times only and the HYPOELLIPSE programme.

station pairs and 5 km for event-event pairs gave thetightest clustering of events with the fewest number ofrejected events. A total of 107 events were rejected usingthese distances.
Focal mechanismsFocal mechanisms for 69 events were obtained using P motion polarities and the FOCMEC programme (Snoke 2003). In this programme, an earthquake is modeled as a point source and a grid search isperformed for all combinations of strike, dip, and raketo find all sets of the nodal planes that match thepolarities. An increment of 5° was used in the gridsearch with a zero tolerance error. Of the 69 mechanismscomputed, only nine were well constrained, giving only one set of nodal planes that matched the P polarities.
Results The distribution of epicenters from HYPOELLIPSE isshown in Figure 5. The seismicity pattern correlates withthe Ruimi-Wasa and Toro-Bunyoro Faults on the easternside of the Rwenzori Mountains (Figure 3). The greatestconcentration of events is found along the Ruimi-WasaFault south of station BUTU. The seismicity to the westof the Rwenzori Mountains falls within the SemulikiBasin rather than along the Bwamba Fault. A cluster ofevents is seen north of the Buranga hot spring at thenorthern end of the Bwamba Fault.
A plot of frequency versus depth for all earthquakeslocated using just P arrival times is shown in Figure 6.The number of earthquakes increases with depth,peaking at a depth of 16 km and falling off sharply by22 km. 90% of the hypocenters are shallower than 22 kmdepth.
To evaluate the accuracy of the hypocenters, 74 events along the Ruimi-Wasa Fault with good qualitywaveforms on which S arrivals could be easily pickedwere relocated using both P and S arrival times and theHYPOELLIPSE code. This set of events was alsorelocated using P arrival times only and the HYPODDcode. Maps showing epicentral locations using just P arrival times and HYPOELLIPSE, P and S arrival timesand HYPOELLIPSE, and P arrival times and HYPODDare shown in Figures 7, 8 and 9, respectively, togetherwith plots of focal depth versus frequency and crosssections showing earthquake depth along the strike ofthe fault.
A comparison of these figures illustrates that whilethe locations and depths of individual events can shift bya few kilometers, the overall pattern of seismicity(epicenters and depth) does not change significantly.Thus, the distribution of focal depths shown in Figure 6is fairly well resolved.
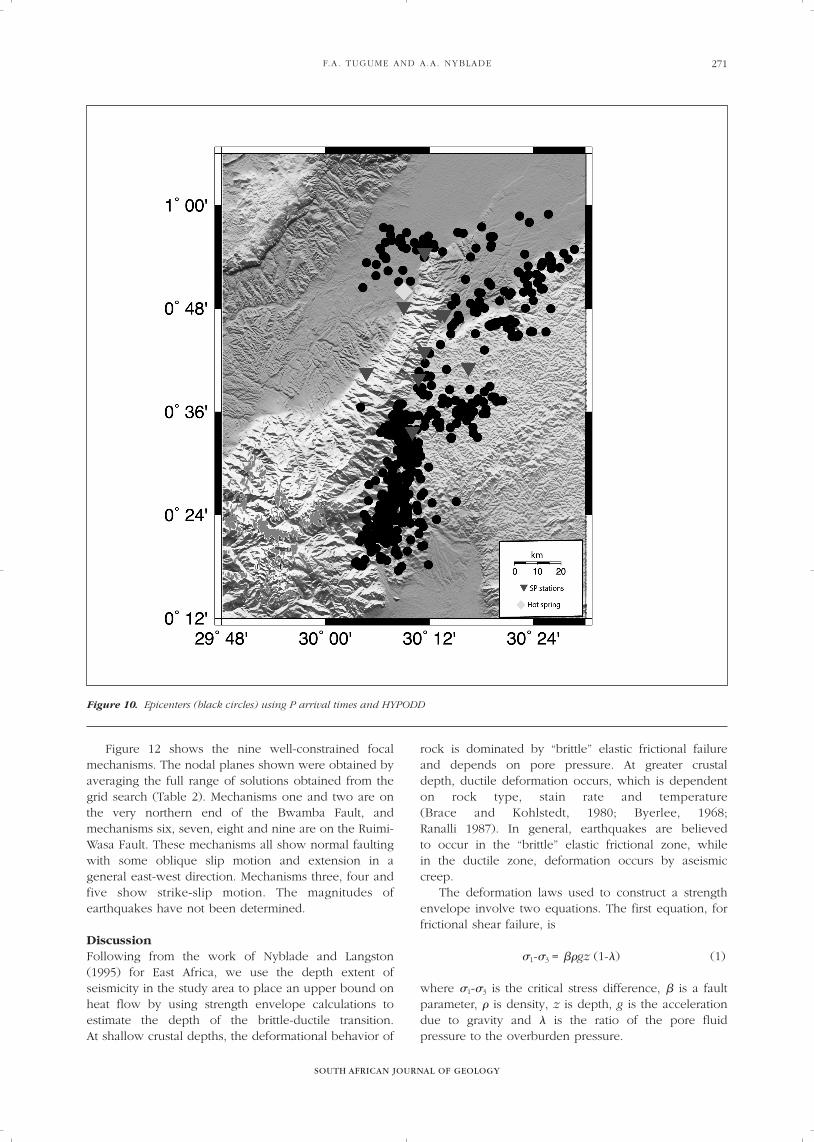
Figure 10 shows the epicenter locations afterrelocating all the events using HYPODD. The seismicitynow clusters more tightly along the Ruimi-Wasa and Toro-Bunyoro Faults. Most of the events in the Semuliki Basinwere rejected by the HYPODD algorithim, except for aswarm of events just north of the Buranga hot springs.
Cross-sections through the southern and northernparts of the Ruimi-Wasa Fault and through the Toro-Bunyoro Fault are shown in Figure 11. For the southernpart of the Ruimi-Wasa Fault, hypocenters shift to theeast with depth, suggesting an east-south-eastward dipat an angle of about 40o. A similar east-south-eastwardshift of hypocenters is found for the northern segment ofthe fault. For the Toro-Bunyoro Fault, the hypocentersare aligned almost vertically. None of the seismicityaligns along a plane.
F.A. TUGUME AND A.A. NYBLADE
SOUTH AFRICAN JOURNAL OF GEOLOGY
267
Figure 6. Plot of focal depth versus frequency for earthquakes located with HYPOELLIPSE and P arrival times.

SOUTH AFRICAN JOURNAL OF GEOLOGY
THE DEPTH DISTRIBUTION OF SEISMICITY AT THE NORTHERN END OF THE RWENZORI MOUNTAINS268
Figure 7. Plot of 74 events along the Ruimi-Wasa Fault located using only P arrival times and HYPOELLIPSE. (a) Map showing epicenter
locations. (b) Plot of focal depth versus number of events. (c) Cross-section showing earthquake depths along the strike of the fault. The
location of the cross-section is shown by the black line in (a).
a
b
c

F.A. TUGUME AND A.A. NYBLADE
SOUTH AFRICAN JOURNAL OF GEOLOGY
269
Figure 8. Plot of 74 events along the Ruimi-Wasa Fault located using P and S arrival times and HYPOELLIPSE. (a) Map showing epicenter
locations. (b) Plot of focal depth versus number of events. (c) Cross-section showing earthquake depths along the strike of the fault.
The location of the cross-section is shown by the black line in (a).
a
b
c

SOUTH AFRICAN JOURNAL OF GEOLOGY
THE DEPTH DISTRIBUTION OF SEISMICITY AT THE NORTHERN END OF THE RWENZORI MOUNTAINS270
Figure 9. Plot of 74 events along the Ruimi-Wasa Fault located using only P arrival times and HYPODD. (a) Map showing epicenter
locations. (b) Plot of focal depth versus number of events. (c) Cross-section showing earthquake depths along the strike of the fault.
The location of the cross-section is shown by the black line in (a).
a
b
c
F.A. TUGUME AND A.A. NYBLADE
SOUTH AFRICAN JOURNAL OF GEOLOGY
271
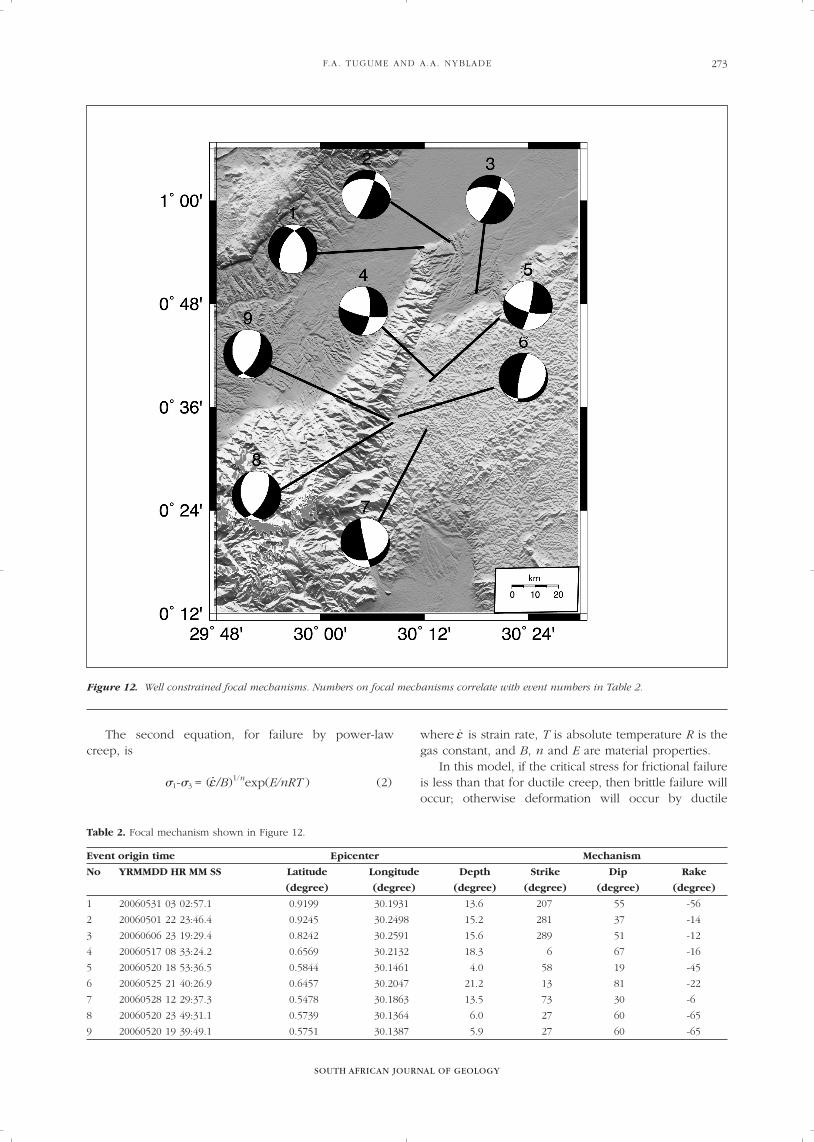
Figure 12 shows the nine well-constrained focalmechanisms. The nodal planes shown were obtained byaveraging the full range of solutions obtained from thegrid search (Table 2). Mechanisms one and two are onthe very northern end of the Bwamba Fault, andmechanisms six, seven, eight and nine are on the Ruimi-Wasa Fault. These mechanisms all show normal faultingwith some oblique slip motion and extension in ageneral east-west direction. Mechanisms three, four andfive show strike-slip motion. The magnitudes ofearthquakes have not been determined.
Discussion Following from the work of Nyblade and Langston(1995) for East Africa, we use the depth extent ofseismicity in the study area to place an upper bound onheat flow by using strength envelope calculations toestimate the depth of the brittle-ductile transition. At shallow crustal depths, the deformational behavior of
rock is dominated by “brittle” elastic frictional failure and depends on pore pressure. At greater crustal depth, ductile deformation occurs, which is dependenton rock type, stain rate and temperature (Brace and Kohlstedt, 1980; Byerlee, 1968; Ranalli 1987). In general, earthquakes are believed to occur in the “brittle” elastic frictional zone, while in the ductile zone, deformation occurs by aseismiccreep.
The deformation laws used to construct a strengthenvelope involve two equations. The first equation, forfrictional shear failure, is
�1-�3 = ��gz (1-�) (1)
where �1-�3 is the critical stress difference, � is a faultparameter, � is density, z is depth, g is the accelerationdue to gravity and � is the ratio of the pore fluidpressure to the overburden pressure.
Figure 10. Epicenters (black circles) using P arrival times and HYPODD

SOUTH AFRICAN JOURNAL OF GEOLOGY
THE DEPTH DISTRIBUTION OF SEISMICITY AT THE NORTHERN END OF THE RWENZORI MOUNTAINS272
Figure 11. Map and cross-sections showing epicenters (black circles) for three clusters (a1) along the southern part of Ruimi-Wasa Fault,
(a2) along the middle part of Ruimi-Wasa Fault, (a3) along the Toro-Bunyoro Fault. The locations of the cross sections are shown by
the grey lines.
F.A. TUGUME AND A.A. NYBLADE
SOUTH AFRICAN JOURNAL OF GEOLOGY
273
The second equation, for failure by power-law creep, is
�1-�3 = (.ε /B)1/nexp(E/nRT ) (2)
where .ε is strain rate, T is absolute temperature R is the
gas constant, and B, n and E are material properties.In this model, if the critical stress for frictional failure
is less than that for ductile creep, then brittle failure willoccur; otherwise deformation will occur by ductile
Figure 12. Well constrained focal mechanisms. Numbers on focal mechanisms correlate with event numbers in Table 2.
Table 2. Focal mechanism shown in Figure 12.
Event origin time Epicenter Mechanism
No YRMMDD HR MM SS Latitude Longitude Depth Strike Dip Rake
(degree) (degree) (degree) (degree) (degree) (degree)
1 20060531 03 02:57.1 0.9199 30.1931 13.6 207 55 -56
2 20060501 22 23:46.4 0.9245 30.2498 15.2 281 37 -14
3 20060606 23 19:29.4 0.8242 30.2591 15.6 289 51 -12
4 20060517 08 33:24.2 0.6569 30.2132 18.3 6 67 -16
5 20060520 18 53:36.5 0.5844 30.1461 4.0 58 19 -45
6 20060525 21 40:26.9 0.6457 30.2047 21.2 13 81 -22
7 20060528 12 29:37.3 0.5478 30.1863 13.5 73 30 -6
8 20060520 23 49:31.1 0.5739 30.1364 6.0 27 60 -65
9 20060520 19 39:49.1 0.5751 30.1387 5.9 27 60 -65

creep. The brittle-ductile transition is the depth at whichthe two equations are equal.
Estimates of crustal temperatures are required forsolving equation (2). With constraints on surface heatflow, crustal heat production and the thermalconductivity of crustal rocks, geotherms can becalculated. However, because there are no heat flow estimates or heat production measurements for the Western Branch in Uganda, we simply assume alinear geothermal gradient and proceed with thecalculation. We also assume a quartz diorite lithology forthe crust and use the rheological parameters fromHansen and Carter (1982) and Shelton and Tullis
(1981); B (MPa-ns-1) = 1.3 x 10⁻³, n = 2.4 and E(kJmol-1)= 219.
Other parameters used include a strain rate of 10-15s-1, a crustal density of 2800 kgm-3, a � value of 0.75,which is appropriate for normal faulting, and � = 0.36(i.e., pore pressure equal to hydrostatic pressure). A strain rate of 10-15s-1 is constrained by estimates ofcrustal extension in the East African rift valleys, andaway from the rifts the strain rates may be lower thanthat (Nyblade and Langston 1995).
Figure 13 shows strength envelopes for a range ofdifferent geothermal gradients that place the brittle-ductile transition at depths of 16 to 22 km, which is
SOUTH AFRICAN JOURNAL OF GEOLOGY
THE DEPTH DISTRIBUTION OF SEISMICITY AT THE NORTHERN END OF THE RWENZORI MOUNTAINS274
Figure 14. Strength envelopes calculated using a quartz lithology and a linear geothermal gradient (dT/dz in K). The corresponding heat
flow (Q in mWm-2) is based on a thermal conductivity of 3 W m-1K-1.
Figure 13. Strength envelopes calculated using a quartz diorite lithology and a linear geothermal gradient (dT/dz in K). The corresponding
heat flow (Q in mWm-2) is based on a thermal conductivity of 3 W m-1K-1.

F.A. TUGUME AND A.A. NYBLADE
SOUTH AFRICAN JOURNAL OF GEOLOGY
275
roughly consistent with the depth at which seismicity inthe study area decreases dramatically. If we assume athermal conductivity of 3 W/mK for upper crustal rock, then from Fourier’s law of conductive heat flow, Q = kdT/dz, heat flow can be estimated, where Q is theheat flow, k is the thermal conductivity and dT/dz is the assumed linear geothermal gradient. A range of heatflow between 54 and 66 mWm-2 is indicated by thedepth at which the brittle ductile transition correspondsto the depth at which seismicity falls off significantly(Figure 13). A thermal conductivity of 3 W m-1K-1 is areasonable average value for felsic rocks typically foundin the upper crust (Nyblade and Langston, 1995). In comparison, the strength envelope for a high heatflow of ~100 mWm-2 gives a brittle-ductile transition thatis too shallow (~10 km depth) to explain the observeddepth extent of seismicity (Figure 13).
Strength envelopes using a quartz rheology areshown in Figure 14, illustrating that heat flow of 54 to 66 mWm-2 is an upper bound. If a quartz rheologyis used, then much lower heat flow would be needed toexplain the observed depth extent of seismicity.
Is heat flow between 54 and 66 mWm-2 elevated, asone might expect to find in a rift valley? As mentionedin the introduction, Nyblade (1997) reported a meanheat flow of 63 mWm-2 for all Proterozoic mobile beltsin East Africa away from the main rift valleys. The heatflow estimated here for the study areas is thus similar toheat flow from other Proterozoic mobile belts and doesnot appear to be anomalously high. A heat flow of 54 to66 mWm-2 is also consistent with average heat flow fromProterozoic terrains globally (Nyblade and Pollack,1993). In contrast, a heat flow of 54 to 66 mWm-2 issomewhat lower than the heat flow in Lakes Tanganyika(73 mWm-2) and Kivu (67 mWm-2) (Nyblade et al., 1990),and considerably lower than a heat flow of 109 mWm-2
reported in the Western Branch in Tanzania (Nyblade et al., 1990) and a heat flow of 100 mWm-2 reported inthe Eastern Branch of the EARS in Kenya (Wheildon et al., 1994). The finding that heat flow is not elevatedin the study area, however, does not preclude thepossibility of a deep seated (mantle) thermal anomalybeneath the Western Branch in Uganda that has not hadsufficient time to reach the upper crust.
Summary In summary, seismicity at the northern end of theRwenzori Mountains correlates well with the majorborder faults, suggesting an eastward dip on the Ruimi-Wasa Fault and a northwestward dip on the Toro-Bunyoro Fault. Fault motions are predominantly normal,with strike slip motions in between the Ruimi-Wasa andToro-Bunyoro Faults.
The observed depth distribution of seismicity peaksat 16 km and falls off sharply by 22 km. Strengthenvelope models show that heat flow in the range of 54 mWm-2 to 66 mWm-2 is consistent with the depthdistribution of seismicity. This heat flow range is similarto heat flow in other mobile belts in East Africa away
from major rift valleys and is lower than the high heatflow (~70-100 mWm-2) reported for the Eastern Branchin Kenya and the Western Branch in Tanzania. A heatflow of 54 to 66 mWm-2 is also consistent with averageheat flow from Pretorozoic terrains globally. Therefore,heat flow in the Western Branch around the northernnose of the Rwenzori Mountains is not elevated.
AcknowledgementsWe extend sincere appreciation to the GeothermalProject under the Department of Geological Survey andMines, Uganda for providing the seismological data. We thank Charles Ammon and Sridhar Anandakrishnanfor providing helpful comments on an earlier version ofthis paper and Geoffrey King, Katie Keranen and MikeJones for constructive reviews. This research has beensupported by the United States National ScienceFoundation (grant OISE 0530062).
ReferencesAlbaric, J., Deverchere, J., Petit, C., Perrot, J. and Le Gall, B. (2008).
Crustal rheology and depth distribution of earthquakes; Insights from
central and southern East Africa Rift System, Tectonophysics,
doi:10.1016/j.tecto.2005.05.021.
Brace, W.F. and Kohlstedt, D.L. (1980). Limits on the lithospheric stress
imposed by laboratory experiments, Journal of Geophysical Research,
85, 6248–6252.
Byerlee, J.D. (1968). Brittle-ductile transition in rocks, Journal of Geophysical
Research 73, 4741–4750.
Chorowizic, J. (2005). The East African rift system, Journal of African Earth
Sciences, 43, 379–410.
Ebinger, C.J. (1989). Tectonic development of western branch of the East
Africa Rift System, Geological Society of American Bulletin, 101, 885–903.
Gregory, J.W. (1922). The rift valleys and Geology of East Africa, The
Geographical Journal, 59, 141–142.
Hansen, F.D. and Carter, N.L. (1982). Creep of selected crustal rocks at
1000MPa., Transactions of the American Geophysical Union, 63, 43pp.
Kreuser, T. (1995). Rift to drift evolution in Permian-Jurassic basins of East
Africa, Geological Society, London Special Publication, 8, 297–325.
Lahr, C.J. (1999). HYPOELLIPSE: A Computer Program for Determining Local
Earthquake Hypocentral Parameters, Magnitude, and First-Motion Pattern,
United States Geological Survey Open-File Report 99–23.
Langston, C.A., Brazier, R., Nyblade, A.A. and Owens, T.J. (1998). Local
Magnitude Scale and Seismicity Rate for Tanzania, East Africa, Bulletin of
the Seismological Society of America, 88, 712–721.
Maasha, N. and Molnar, P. (1972). Earthquake fault parameters and tectonics
in Africa, Journal of Geophysical Research, 80, 1485–1496.
Maasha N. (1975). The Seismicity of the Rwenzori Region in Uganda, Journal
of Geophysical Research, 80 1485–1496.
McConnel, R.B. (1972). Geological development of the rift system of eastern
Africa, Geological Society of America Bulletin, 83, 2549–2572.
Nyblade, A.A. and Langston, C.A. (1995). East African earthquakes below
20 km and their implications for crustal structure. Geophysical Journal
International,, 121, 49–62.
Nyblade, A.A. (1997). Heat flow across the east African Plateau, Geophysical
Research Letters, 24, 2083–2086.
Nyblade, A.A. and Pollack, H.N. (1993). A global analysis of heat flow from
Precambrian terrains: implications for the thermal structure of Archean
and Proterozoic lithosphere, Journal of Geophysical Research,
98, 12207–12218.
Nyblade A.A, Pollack, H.N., Jones D.L., Podmore F. and Mushayandebvu, M.
(1990). Terrestrial heat flow east and southern Africa, Journal of
Geophysical Research, 95, 17371–17384.
Ochmann N., Lindenfeld M., Babirye P. and Stadler, C. (2007).
Microearthquake survey at the Buranga geothermal prospect, western
Uganda, Proceedings of the 32nd Workshop on Geothermal Reservoir

Engineering, Stanford University, Stanford, California, January
22–24.
Ranalli. G. (1987). Rheology of the Earth. Allen and Unwin Inc, Boston,
United States of America, 366pp.
Ritsema, J., Nyblade, A.A., Owens, T.J., Langston, C.A. and VanDecar, J.
(1998). Upper mantle seismic velocity structure beneath Tanzania, East
Africa: Implications for the stability of cratonic lithosphere, Journal of
Geophysical Research, 103, 21201–21213.
Shelton, G. and Tullis, J.A. (1981). Experimental flow laws for crustal rocks,
Transactions of the American Geophysical Union, 62, 396pp.
Shodofsky, G. (1985). Source mechanism and focal depth of East African
earthquakes using Rayleigh-wave inversion and body wave modeling,
Geophysical Journal International, 83, 563–614.
Shudofsky. G., Cloetingh, S., Stein. S., and Wortel, R. (1987). Unusually deep
earthquakes in East Africa: Constraints on the thermo-mechanical
structure of a continental rift system, Geophysical Research Letters,
14, 741–744.
Sikes, H.L. (1926). The structure of the Eastern Flank of the Rift Valley near
Nairobi, The Geographical Journal, 68, 38–402.
Snoke, J.A. (2002). FOCMEC: Focal Mechanism Determinations:
International Handbook of Earthquake and Engineering, ISBN
0124406580, 9780124406582, Chapter 85. 12, 1629pp.
Tanner. P.W.G. (1973). Orogenic Cycles in East Africa, Geological Society of
America Bulletin, 84, 2839–2850.
Walderhauser, F. and Ellsworth, W.L. (2000). A double-difference earthquake
location algorithm: Method and application to the northern Hayward fault,
Bulletin of Seismological Society of America, 90, 1353–1368.
Walderhauser, F. (2001). HypoDD – A program to compute Double-
Difference Locations. USGS open File Report 01–113.
Wheildon J., Morgan P., William K.H., Evans T.R. and Swanberg, C.A. (1994).
Heat flow in the Kenya rift zone, Tectonophysics, 236, 131–149.
Editorial handling: R.J. Durrheim
SOUTH AFRICAN JOURNAL OF GEOLOGY
THE DEPTH DISTRIBUTION OF SEISMICITY AT THE NORTHERN END OF THE RWENZORI MOUNTAINS276