the decay of k43 - digitool.library.mcgill.cadigitool.library.mcgill.ca/thesisfile48482.pdf · o ,...
TRANSCRIPT

. " ,
e-
/
e·
.e
1\ '1, .
-....... ,7'
... THE DECAY OF K43
<""' 1
, by
Kerry Burns
1
j
.""""""
~
.'
A fhesis submitted +0 the Faculty ot Graduate
Studies and Research in partial tulti Iment of
the requirements for the degree of
Department of Chemistry McGi Il University Montrea., Canada
Master of Science
--~- - .....
Kerry Burns 197,8
)
..
. .
,
, , Apr i 1 t 975

•
/
. ,
,.
J
A8STRACT
. The Decay of K43
~K43 was produced from tha Ca44 (p,2P)K43 reactlon on' mat~ral CaO. Fvaluation of the ~-ray spectrum yieldAd N-rays with energtes:~
220.6,396.8,404.5,593.3,617.3,801.1,990.0, 1021.7, and 1394.7
keV, which were assigned ta K43 • The branching-ratio and relative
intensity of each transition was determined. The half-life of K43
.was
determined tram the decay of the four most abundant ~-rays which
resulted in a half-lite ot 22.44± .02 hours.
/
J ,.
.t'
,
"
Il

/
•• (
) /
1 , 1
. o ,
\ ,
" "
/
. -,
RESUME
D • K43 ecrolssance de
\
;;, une clbJ$ de C~O naturel. l'~nalyse du spectre ~ reSult8nt ~ conduit
a l'Identification de~ reles ay~nts les~ner9ies suivantes: 220.6,
396.8,404'.5,593.3,617.3,,801.1,990.0,1021.7, et 1394.7 KeV. r.es
.~ 43 ' raies ont été attribuées a K • tes facteurs ae branchement et les
intenslties relatives de ch8que tr8nsition ont été determlnés. la
.. per j ode de décro i ssance '(je K43 ~ge 1 e a 22.44 t .02 fleures, a été mes~rée ..
/', 1-
en suivent la décroissance des quatres raies ~ les pl~ abOUQa~tes.
\ 1 \ ..
7

/
. "
&
•
,)
o
, ,
ACKNOWLEDGEtvlE NTS
( wish to thank nr. J.J. Hogan for suggesting This work. and
for his help and encou~agement during the co~rse of this work. ,
r wish to thank Dr. ~irko Oiksic for many helpful suggestions
and discussions and .. his help in the comouter .analysis of the data.
1 ~m grateful to the staff of the Foster Dadiation Lab for the ..
." the irradiations.
1 wish to thank Jean-Louis Galinier for his work in translating .. the abstract.
1 wish to thank Martti Kantelo who suppl ied ~e with the
efficiency data for our detectors.
who spent
especial Iy wish to~ank my fiancea, Mi:S Janet Mes~. many long and tires e hours typing the thesis. . .
'1
, "
)
1

"
1
1
...... \
/
l
1: TAoLE oF' CO~JTENTS
List 'of P'i gures f .
Li st of Tab les " .
• ' Chapter 1." 1 n'troduct i on
Chapter 2. Experimental Procedures,
1 .Target Materials (and Irradiations Il Potassium ChemjÇtry tll.Measurement of Activlty and Oecay Analysi~ IV Summing Effeè~s V Calculation of Decay Scheme Vl Rubidium Analysis VII Error Analysis
1 r r.haptet" 3.
Pesults
Chapter 4. f Discussion ?
" 1 Review of Prevlous Work, 1 1 Presént Work .. ~
References'
\ / l'
, ,
c..;
/
1
J . ' "
t: . t
.~
,
,ù
'.
i i i
iv
7 7 7 8
'9 14 18 20 21
23 23
31 31 31 38
43

. i i i
-e LI ST OF FI GLRES
• figure 1. Assembly of 'Target and Target Holde!:", 7a
• CLSQ Decay Curve A~31 ysi s of the Gamma-Figures 2-6. Trans i t i.ons in K 308 .-
, \ -
Figure 2. 220 and 372 keV trans It ions J
/,
, Figuré 3. 397 aQd 404 k'eV iranc:;itionc;
• Fi Qur p 4. - ,
593 and 616 keV transiTions
Figure 5. 800 and 990 keV transitions
Figure 6: 1021 and 1393 keV transitIons
" ...
Figure 7. Jhe Decay Scheme of K43
Figure 8. Gamma-Ray Spectrum of K43
- r
, , , "
..
,-
-e

_e ',,- -
~
/
....
r
Table 1.
Tab~e 2.
..
(; "LIST OF TABLES
Energy of g:3mma-ray transitions ,in th-e d6!('ay of K43
" 1.' Half-lives of transit~ons trom CLSQ
Table 3. Branching Ratios /
'Table 4.< Ca43 level feeding from the decay of K43
,
Table 5. Absolute gemma-ray intensities in the decay of K43
Table 5. Relative intensities of gamma-transitions' in the decay of K43 •
r
Table--1~-'Jnt~nsities of ~3ta-transitrons in the decay ,of K
Table 8,. Identification of the gamma-tra,lsitions observed in the decay of K43
'"
r
.'
f
iv
26
27
f 28
'1..9·
30
40
41
42

/
CHAPTER 1 l
1 N.TROOLr:T 1 Oi'J \
\
The determinat10n of the complete decay scheme of a
radioactive nuclelde involves the inv€stigation of ail the
possible modes of decay of the nucleide, their intensities,
the energies of the radiations emitted, the order in which the
radiations nre emitted and the half-lives of arïy intermecH~te
states. The spins and parities of the energy levels under
investigation should be determined whenever possrble.
The half-life of any newly dls2overed'isotope is usual Iy
determi~ed first. The possible modes of decay may'be inVèstigated
with ~and ~ counters, and ~-tran~itions by means of scintl rlation
or soli d state detectors.
Sample~ for decay scheme studies are usu~1 Iy produced by
exposing a target to high energy particles in the flux of a
cyclotron. Targets should be of the highest purity avai lable
ta minimi7e the amount of activity coming from side reactions
with impuri!ies •. In addit~o~ chemical ~eparations may be
performed after irradiation, to remove unwanted activities trom
products of other reactions with the target.
~-ra~ were the first radiations, resul~jng tram the, decay , '+.)
of a rad i oact i va nuc 1 e ide, whos~ e~,erg i es and i ntens it i es were
measured. The energies and intensities were first measured
trom the energy and intensity of electrons emitted tram the
interaction of a ~-ray with an electron in the K or L shel 1 of
an external radiator of high Z. The energy Ee with which an
1

/
-,
elec'tron " with binding en~rgy EB, wi 1 1 be emitted after ,
i nteract) 1'19 wi th a '6-ray of energy Et,' is gi ven by the relation
Ee = Elf -ES
The energy of th~ electrons (which were illono-energet i c) resu 1+ i ng " . - .
from the ~-transition, was measured with a magnetic spec~ogra~h.
The en~rgy of the ~-tronsition could then be determined trom a
knowledge of the binding energy of the'electron. The relative
intensity of the ~-transitions wa~ determined from the relatJve
intensity of, the corresponding photo-electron and a knowledge
of the photo-electron cross sections for the particular
radiator and energy of transition.
The investigation of parti~les directly emitted by the
radioactive nucleus was carried out next. Absorbers (AI and Pb),
and cloud chambers, in conjunction with çoincidence techniques,
were used to study these partic1es. The study of B-rays emitted, ,
showed that They nad a conti nous energy di?tribution ending at
a maximum energy. Further studies showed that severa 1 B-group~
may be associated with the decay of a radioactive nucleide, and
that the end-point energies of these groups could be correlated ,
with the t-transitions observed in the radioactive decay. A
complete decay scheme would then involve the determination of the
intensities and energies of the f3 and ~~radiati6ns emitted.
The end-point anergies and intensities of the ~-ray groups
were determined froT the S-ray spectrum. The ~-ray spectrum waS
measured with a magnetic spectrograph (photographie plate) or
maggetic spectrometer (GM counter) which swept through the
2 ,

t
/
•
momAntum distribution of the electrons by adjusting the (
mag~etjc field strength. The 'a~alysis of the B-rày spectru~ ("
inv61ved the cemparison of the expérimental Iy determined spactrum
with the results from th8 theory of B-decay. If th~~pectrum
had severa 1 B components~ the resolution of th~ components
depended on the shape analysis of the components. Th~s special
care was necessary i~ the deter~ination of the ?-ray spectrum ta .) . .
avoid its distortion. \
The most serious distortions of 'the ~-ray spectrum arose
at low energies from the 1055 of energy of electrons due to their .
scatter in trav~rsing the source. This nec,ssitated the preparation
of extremely thin sources. The backing of the sources also
contributed to the distortion, by back-scattering electrons into .
the detector. The problem was overcome by evaporating the source
(in vacuo) onto thtn aluminum backing, or- evaporating a solution of r the source onto a thin backing mater.ial. The windows of the
detector also contributed to the distortion of the spectrum.
Th!3 windows stopped any electrons below a certain "eut-off"
energy from getting through to the datector. The t~ansmission of. ~
3
the windows gradually n"rereased unti 1 100% transmission was achieved •
at approx i mate 1 y four t i mes the "cut-off" energy. The th i ckness of
the wi ndow thus di storted the shape of the spectruill unt i 1 fu Il . -
(
transmittance was achieved. The problem of window thickness was
essentially eli<ninated by replacing the conventional mica or
aluminum windows with fi Ims of lapon or formvar which al lowed '.
transmission of electrons with energy less than l~keV.
The theoretical treayment of the theory of beta decay led to
l,

•
/ t , -J
. the pred 1 dl 0n .of a f5-ray spect,rum of the form:(4)
? :: .iL:
21T3
'2 F <Z, W) p'tHltlo -Iv) 5 n (~I) dl'I
.., ~I(I,1) = ntJr:1hers' of electrons with energy
betwepn W and W~dW F (Z ,Iv) = Co'o'lomb correct i::ln factor.
p = momentum (relativistic) of lhe electron
Wo = total dislntegratidn energy (end-point eneray)
= shap~ factor for forbidden ,of arder n
transitions
which can be re-aFranged to
(N(W)lF(Z,W)pWSn(\l/»~ = _:J?CWo-W) 2Tr3
If the funct~ort on the left hand side was plotted against,t~e l'
~-energy ~, a straight line would resu!t with intercept Wo on the W
axis. Su rh a plot was cal led a Fermi-Kurie plot. The correct choice
of the form factor Sn(W) for forbidden trêlnsitions was necps<'tr-'rv
if thp pxperimenta~ data was ta yield a straight 1 ine. With the
inclusion of the form factor for, fhe forbidden transitions, a Fermi-
Kur 1 e plot of a mu 1 t 1 -component ~-r'ay spectrum wou 1 d reSLt 1 t in a
4
series of intersecting straight )ines of dijferent slope corresponding
to the dlfferent intensities. The end-pol~t en~rgy for each transition ,
could IMan be obtained by extrapolatina the straight lines unti 1
they fntersected with the W axis, which corresp~nded to the end-
point energy fbr that transition. The ihtensi~y of each,-transitfon
could then be determined by calculating the number of counts pér
unit mome~tum interval for each point of each transiti~R on t~e Fermi" \
plot. The area under the curve of the number of count~ versus
mùmen~um, w~ t'hen yi e·[d the number of counTs from that part i cu 1 or
transition, 'which, when divided by the Total number of counts for aIl
•

/
..
;1 s. CL., s ~
".
the trans,itions, would yield the rela+ive·inrensity of each
~-transition. ïhe method of dètermining the end-point energies and
i~tensities of ,-tr3ns~tions by Fermi-Kuria plots became progressivAly
worse for the res01ution of the next ~-transition in the series.
Once the intensities of the ~-ray trarsi ~ions were determined,
the p~rt;al halt-life of each transition could be determined trom
t-he relation:
.693 = À{i)
, . . t. (i) = partial half-life of transition X (i) = decay constant for transition i l(f) ;;; intensity of transition i
À = total decay constant for the décay of the nucleide.
The parity and spin change corresponding to each ~ and
~-tr-ansition coutd be determined from the energy and intensity of the
transitions, whic~ together with a knowledge of the ground state
parities of the ~~rent or daughter, could be used to determine the J
parity and spin of the levels in the daughter.
,Present day studies usuaJ Iy use sol id state germanium and
si lieon detectors or Nal (TI) scintillation detectors, and multl-
channel analysers to determine the complete decay schema of a
radioactiv~ nucleide. The detectors al low better resolution of the
transitio~s.resulting in much better determinatio~s of ~he energies
and intensities of the transitions.
The use of two detector~ in conjunction, for (S-2C and ~-~
coincidence studies and 2l-2$ and ~-~,.angu>lar ëorrelation measurements
greatly inrreases the amount of information which can beJobtained
concérning the spin and parity changes in addition to the intensities
1 ~
5
. * •
(

and energies. The order of levels rn the d~ughter nuclelde "\
from tr~ éol~ide~~e st~dies. In edditi on, if ..
can be determlned
e ~-transltion' 15 in colncldence~ith only one ,-transl~lon, then
,- ~ col nci dance mel!!lsurements on thet ~-spectrum (usl ng thl!Jlt ~ for
coïncidence) would show thet ,- compone nt only. Th~s would al low
the determination of the end-point energy end shape of thet spectrum
without the errors of the Ferml-Kurle analysis. The intensity of
the ,-tr~nsltlon could be determlned more accurately, and the change
ln pl!Jlrlty end spin predlcted wlth 8 greater degree~f confidence from
the shepe analysis.
X-J correlation studies may be performed with the eld of two
detectors: A ~-transition may consist of transitions of dlfferent
multipole order. The percent of each multipolar transition may be
celrulated by comparlng the results of ~-t correlation experiments
with theoretiral ra4culations of 6-~ correl~tion for a part}cular'
mixing of multipolar transitions.
The introduction ~f solid state detectors and mulfi-channel
analysers has greatly Improved the methods for determination of a
decay schema. Wi th 2S-2S, l!JInd ,"";~ co i nci dence measurements on hi gh
.resolution detectors, even the mo~t compJex decay scheme may be
unravelled. yiel'ding ell the information necessary to determine a
complete dacay scheme.
,
,
6

e •
/
CHAPTER 2 .;
EXPER 1 r·1ENTAL ffiOCEDLRES
t. 'cTarget ~4aterials and Irradiations:
The 'target material was CaO (natural abundance) which was
prepared by igniting reagent CaC03
in a crucible at IOOOo
C for one
half hour. CaO was used instea~f Car03 in order to ~ave a I~;ger percentage of Ca in the target. The CaO was ground to a fine powdèr
in a mortar and pestel and stored in a tightly capped bottle l in a
dessicator. A finely powdered sample al lowed easy loading of the
target, whi le storage in the bottle prevented the CaO trom reacting
with any CO2 and picking up any moisture.
The target was prepared by loading CaO (~30mg) into an
alumi.['lum tube (outside diameter .0625", wall thickness .0015")
7 j
which was crimped at one end. The other end was crimped and the whole
tube was flattened to spread the sample smoothly. The target was
mounted on an aluminum target holder which was then mounted into
a slot on the the ~kGi Il cyclotron probe (Fig. 1 - ).
d from the (p,2p) reaction on Ca44 (2.08$
abundant ). of Ca44 necessitated. long irradiation
times and chemical separation of potassium from the target to
obtain good counting statistics and a clean spectrum for K43
•
The bombarding energy was selec~ed by adjusting the probe. radius
between the "dees ll of the McGi Il cyclotr6n. Sev~ral trial runs
I~dicated that the Ca4~(p,2p)K43 reaction peaked' around 35·MeV.
This energy was then used for the three runs reported here. The
! ~ï
1 1
! 1
1
.1
~ 1

7a,
" \ ,
.., ~\
1 \ p '(
J /
FlGLREl
_Assembley of target and tar~et holder
.<1
• ,
L
• 7

, -
. -/
..
Target clampmg
screw
1 -J~ -
End of cyclotron probe
AlumJnum
target halder
Target

*j,
-irradiations lasted for three hours with a proton beam intensity
of approximately 10 12 protons par second.
U. Potassium :hemistry.(12),
8
After the irradiation, the target wi Il not only contain K43 , )
but other radioactive n.ucleides, whic:h might interfere 'IIi th the' counting
~ -'~ J of K ln p~rticular, Sc would be present trom the (p,2n) reaction.
44 43 . 43 on Ca and the (p,n) reaction on Ca • Sc decays ta the same
daughter (Ca43 ) as does K43 , fee ding the 372 keV 1 e~e 1 i n Ca43 •
The peak observ~d at 372 keV would then be a two component peak
and would necessitate the resolution of the decay of the 37Z'keV
transition 'into two components. T~is would approximately double the
error in the estimation of the intensity of the 372 transition in the
decay of K43 and cause a further error in the estimation of the
half-I ife of that transition. This necessitated the)chem~cal .,
separation of potassium from the target. The chemical separation
of potassium thus allowed us to follow the decay of K43 with a
minimum of Interference from other radioactive nueleides.
Mter irradiation, the target was put aside for t~ hours
to al low short-livod activities to decay. The aluminum tube
containing the sa~ple was removed from the target holder and
placed in a centrifuge tube. The aluminum tube and sample
were di sso 1 ved in 1 ml. 0 f concentrated HC'. 5mg each of i nact ive
lanthanum, sodium, manganese, iron, zinc and copper along with 3Omg.
of potassium were added. Approximately 10 ml. of concentrated HCI04 , was added to precj~itate KC104 alon9 with the other alkali perchlorates.
"

.. "
/
1
'The solution was cooled~in ice for 30 minutes (this gave time for
the precipitate to form and cool i~g minimized the solubi 1 ity of the
preeipitate). The alkali p~chlorates were centrifuged off and the
super~atant discarded. The precipi+ate was washed with absolute
ethanol which dissolved the NaCI04 and separated any radioactive
sodium from the potassium sample. The,KC104 was dissolved in 2 ml.
water witQ heating. Ail the above carriers except potassium were
again added. 10 ml. perchloric acid was added, the solution was
cooled in ice and the alkal i perchlorates were centrifuged off.
The percipttate was washed with absolute ethanol, centrifuged and
the supernatant containing the NaC~04 was discarded. Tbe KCI04 was
di sso 1 ved a~ n in 2 ml. H:z0 with heat i ng, carr i ers added, and
precipitation with perchloric acid and washing with ethanol was
repeated. The KCI04 was then transferred with absolute ethanol to
a glass fibre dise clamped between a fi Iter chimney and a mil lipore ~
li . fi Iter under suction. The dise was dried in an oven at llOoC for
five minutes and then mounted on the centre of a piece of eardboard 1
with scotch tape, for counting.
111 . Measurement of Activity and Decay Analysis.
A radioactive nucleus wi Il dècay to another nucl_eus which
may or may not itself be radioactive. The deeay may leave the
product nucleus in-an excited state from which it may de-excite by
gamma-;ay transitions. If the gamma-ray transitions are fast
compared with the parent decay, then the parent decay is the rate
control ling process. The gamma-rays from the transitions in the
product nucleus wi Il thus follow the decay of the parenT. Gamma-ray
9
,>
•

detectors cen be used to fo Ilow the g~mfM-trans It Ions 1 n the product
nucleus and thus the dec~y of the parent can be fol lowed. In the
present work, K43 dec&ys to Ca43 by neg~tron emlsslon,whlch then
de-excites to st~ble Ca43 by gamma-ray transitions.
The probabl f Ity thet an exclted nucleus wJ Il decay par unit
time 15 ~ cOnst~nt~ and Independent of tlme. This leeds to the
relationship between the decay nlte and number of atoms present:
N = number of atoms present. ~ = decay constant. t = time.
(1)
10
Th i sis e fi rst order 1 i neer di Herent 1 a 1 equet Ion wh i ch may be so 1 yed
to yield:
, ,
-At N • Noe
No • number of r~dioactiye atoms et ~ -. o.
or for ~ctlvlty A IlÀN.
A :: AOe -At
• , AO = ~ctivlty ~t t = O.
The half-life of a radi~actiYe nucleide, the tlme it tekes
C2 )
(3)
for one-haIt bf the r~dioactive nuclei to decay, ls a con~tant and
related to the decey constant by the relatlonshlp:
~ ',Tl: ~ 1 f the' act 1 v 1 t,y of " part leu 1 ar gall'W'na -trans 1 t Ion i n the ., .
(4 )
, produet nucleus Is followed as a functlon of time, it should decay
'with the same half-IHe es the parent. I-bwever, If. a different
nucleide with decey constant X , dec~ys, tollowed by a transition
with the sema energy as the nueleide ot interest, the activity of
this tr~nsltlon will fol low the refationshi P:(7)
(

/
\
.
A = Al + A2 = (5 ) • -,
Theoretic~lly, oniy two determif"ations of +l.~,,*,ctivity af
o different Times would be n~ress~ry .~ de+ermire the unknowns A and
JI. in ~qui'jtion(3)for a single C0mponènt traf1SiTion. Similariy,only i
four de:crminat-ions of the activity at different times would be
r~ec:eS5ary +0 determi ne th8 four unknowns i n e,~~a~ a
two '~component transiTion. f-bwever, due ta the finite number of
radioactive nuclei, the finite duration of The êount l and the
randomness of the process, some scatter abour the theoretical ,
precfidion would be expected. A large number of adivity
measurements over a time should be made, trom which a "best"
o Va 1 ue of Jo.. and A can be determ i ned for a si n9 1 e compone nt and
A" À', Ar and A~ for a doub 1 e component dera~'. A computer pro gram,
CLSQ (4.). was used to ana 1 y7e the data and determi ne the "besT"
va 1 ues al the constants for si n9 le and doub le compone nt decays.
Three sepè'lrate experirnents were performed (Runl, Run Il,
Run 1 Il ) fro~ whiêh a statistical Iy weighted average set of results
could be obtained. Run 1 and RunllJ1were carried OUT on a 40 cm~
1 ithium-drifted germanium (Ge (Li »detector (mode 1 8101-0725) with
a Victoreen Scipp-1600 channel analyser (mode 1 SD-2P). The analyser 1
was connec:--cd~o a fv1onroe printer which printed out the gamma-ray
spectrum. 1600 channels, listing the channel num'Jer and number.of
rounts in each êhannel on il paper printout. A conversion gatn of
1 keV/channel was used, which permitted the identification of any
gamma-ray energy by reference to its channel number (je. a 1200 keV , ,
gamma ray wou 1 d appear as p peak 1 n channe 1 1 ZOO. ) The ana 1 yser
, t

1
..
"
had to be menua Il y reset for each cou nt: the memory h3d to be .. erased, the durat i on of t.h8 count se 1 eCTed anèl the count- started.
, Bath samples were counted on sh<llf 2 (10 mm fr~m detedor can)
on Itl~ve" ti~e. The samples l'lere counted at various tiITll:ls over a
-per i od of seven ha-I f- 1 ives oor i ng wh i ch t i me t'he ac t i vi ty decreased'
by a factor of nne-hundred-f i ft y •
The gamma-rays emittp.d from a source of radioactive nuclei
(
undergoing a partlcular iransition will be recorded in severa 1
channels of the memory of a multi channel analyser. This necessit~
ates the summing of a series of severa 1 individual records to obtain
the total number of events recorded for a partÎcular transition.
The sum will include the background radiation due to Compton
scattering. This background must be subtracted from-the total
number of events to obtai n the number of events recorded which are
due to the transition.
The data from the 40 cm3 detector necessitated manual
12
integration of the peaks. The total are a under the peak wa~ obtained
by summing ,the contents of the channels containin~ the peak. The
background under the peak was estimated by taking the average of . ten channels (five'on each\ side of the peak) and multiplylng by
the number of channe 1 sin the peak. 1 n the case of two gamma-rays
which were close in energy, but resolved by the detector, five
-
chan ne 1 s on the left of the f irst peak, and f ive channe 1 s on the
right ci the second alon9 with a channel between the peaks Ccontain,ing
the lowest count close to background) were used to average the
! -..

e-
'.
/
13
background for both peaks. The resolution of the 40cm3 Ge(Li)
datector was appr0ximatel~ .5% (FWHM) in the energy range of
• interest. ~
Run 1 T was carried out on CI 30 cm3 Ge(Li) detector (mode 1
8001-5026) which was connecte~ ta a 4096 mul~i-chan~el analyser with
magnetic tape drive. A conversion gain of approximately .5 keV/channel ,
was used. The analyser was plôced on automatic recycle which would
count the sample for the set time, then "dump" the contents of the
memory (the spectrum) onto the magnetic tape along with th.e tirne for
the end of the count, the duration of the count and the spectrum
identification tagword number. The analyser would Theo erase the
memory, increment the tagword number and start the next count. The
resolution of the 30 cm3 Gé(Li)1 detector was approximately .5% ~
(FWHM) in the energy rage of interest. The sample was counted on ,
shelf 1 (10 ~ from the detector housing) contin~usly over a period
of six half-I ives.
The 30 cm3 data was analysed with the help of a computer
programme ca lied IIGammana 1" ( 8). The I_ocat ion (channe 1 number)
of severa 1 peaks of known energy was fed i nto the program" as an
energy ca 1 i brat ion. The program fit a th i rd degree po Iynomi al
functioh to the calibration data from which it could calculate the
energy of a peak in a spectrum from i ts 1 ocat i on (channe 1 number).
The pro gram locates the peaks. in a spectrum, i ntegrates them,
calculates the background from severa 1 channels on either sida,
using a log interpolation, and subtracts the two to gi~e the area
of the photo-peak. The program "dumps" the spectra onto computer
printout along with the analysis of each spectrum. The analysis

•
1
14
prinTout ,ansists of rhe channel number of each peak, the total number
or coun~s in ea,h peak, the standard deviation ot the count~ the peak
height, the energy of ea,h peak, and the relative intensity of eaéh
peak based on the most intense pe~k in the spe,trum. The computer
i~!~grated pe1ks werA rhecked by hand for severa! cases and were
f9~hd to agree with the hand i~tegration ta within .5 to 1%. ~
The decay curve for each tran~ition and for each run'was
ana!ysed with a 1 inear-Ieast square program CLSQ. The program used
matrix inversion to solve the set of simultaneous equatio~s relating
the activity as a function of time. A point was rejected if it was
more tha.n three standard deviations from the "best" fit, and the
calculation was performed again without t~is point. The half-
life was also allowed to vary 50 that the "best" fit half-lite
for each transition was calculated. The weighte~ average gt the
half-lives \'18S then calculated for each run and the data was "force" J,
fit ta the weighted halt-I ife. Points were again rejected if they
were more than three standard deviations from the "best" fit. In ,. .. the case of a two component decay curve 0021 'transiTion), the
half-lives 6f the t~o components were fed in and the amount of
each component WffS calculated. The program also gave the
intercept, the activity et time zero (usually the time of 'the
end of the bombardment), and its estimated error,which were used
to calculate the decay scheme of K43 •
IV. Summing Effects.
The agreement between the data on the two de'ectors was
very consistent except for the 990 transition. Part of'he
activity of the 990 transition could be due to summing effects in
the detector. Summing effects were original Iy considered to be
,e
•
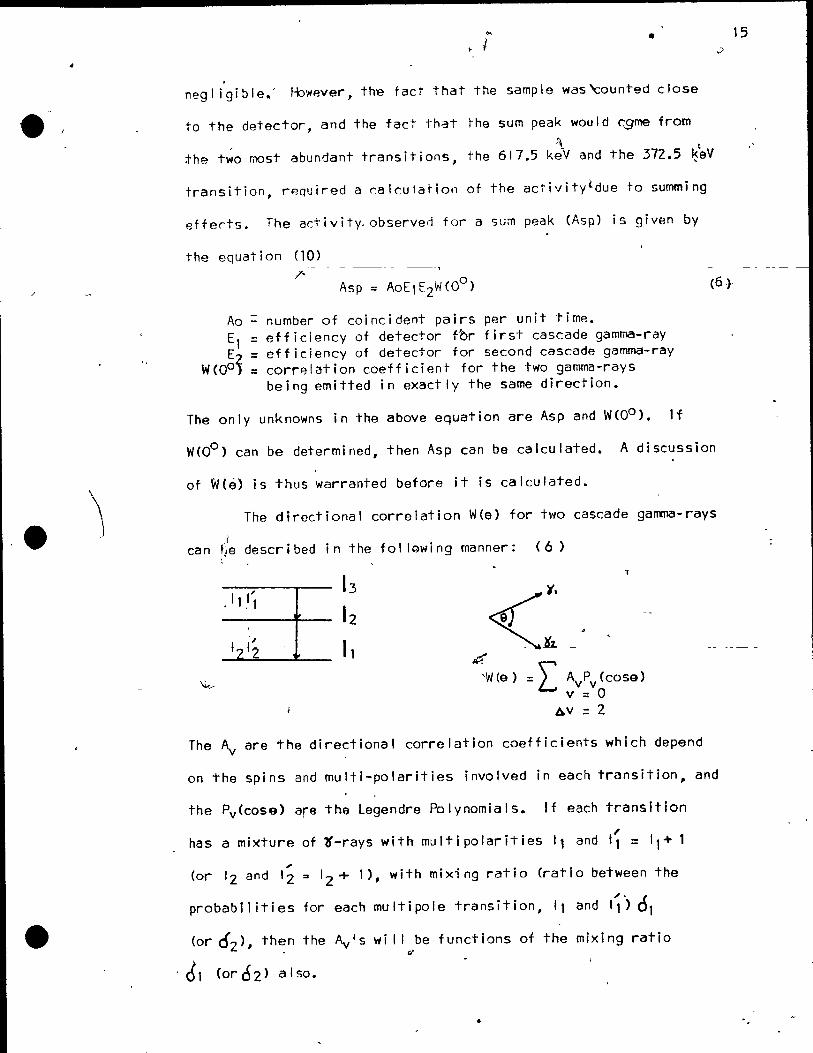
negl igible.' I-bwever~ th-e fact that the sampis was'counted close
to the detector, and the fact that rhe sum peak would c9me trom , \ e
the two most abundant transitions, the 617.5 keV and the 372.5 ~éV
transition, required a calculation of the adivitytdue to summing
efferts. The a~tivity.observed for a SUffi peak (Asp) is given by
the equation (10)
Ao El E
W(Oo~
--= = =
r
number of coincident pairs per unit time. efficiency of detector f~r first cascade gamma-ray efficiencyof detector for second cascade gamma-ray correlation coefficient for the two gamma-rays being emitted in exactly the same direction.
The only unknowns in the above equation are Asp and WCOo ). If
W(Oo) can be determined~ then Asp can be calculated. A discussion
of W(è) is thus warranted before it is calculated.
The directional correlation W(e) for two cascade gamma-rays
1 can ~le descr i bed in the fo 1 IQwi ng manner: ( 6 )
~'t,
-~& ~
'W (e) = L AvPv (cose) v = 0
AV = 2
The Ay are the directional correlation coefficients which depend
on the spins and multi-polarities involved in each transition~ and
the Pv(cose) are the Legendre Polynomials. If each transition
has a mÎ)(ture of b'-rays with multipolarities Il and I~ = 11+ 1
" (or 12 and 12 = 12 + 1), with mixing ratio (ratio between the
probabilities for each multipole transition, '1 and I~) 61
(or 02)' th~n the
'61 (or02) also.
Ayls wi 1 1 be functions of the mixing ratio ri
•
15

.e
/
arises:
Referring ta the~decay scheme of K43# the fol lowing case
----..-- ~/2 +
617.5 -----'-- 5/2 -
372.5 ___ I-- 7/2"-
16
----Th~ 617.5 keV transition is an ET transi+,ron wlHTe the 37Z.5Î<eV---------
transition is an Ml transition with E2 posslbly competing. To
determine the mixing ratio of E2 to Ml )or the 372.5 keV tran~ition
the probabi lit y per unit time for each multipolar transition is
calculated by ~eans of the formulas: (17)
'À(E, 1 >: 4(1+1) {.l} 2(L)21.' A21
/3 ~
1 ( (21+ 1 ) ! ~ ) 2 3+ 1 < 140 Tl
À(M, I):i .OS8( 1+1) (2.'}2{.I..) 21+1 ~21-2Y3(2. 79..._'_12~ I«ZI+1)!!)22+1 140 2 1+1 Tl
À(x, 1) = probabi 1 ity per uni't time for a particular transition X (electron E or magnetic M) with angular momentum 1 to occur.
= angular momentum quantum number. = energy of the gamma,transition a 'ff
= mass of the prodUët-nucleus in ~ - electron rest mass .51 1 MeV = ---vI anlf's-constanf:--;---- --
From the abova formula we find that:_
(E,2) (M,l )
= 1.5 x 10⁸
2.3 x 10'1 "
sec. sec.
The percentage '(or mixing ratio) of E2.would be expect.~d
to be smal 1 and 50 was neglected for the calculation of W(Oo).
'The nuclear data tables (19) were then used to calculate ,
W(OO). To use the tables,'the transitions must be put into their
notation which for the above case is 3/2 (1) 5/2 <1,2)7/2 with
a positive mixing ratio or 7/2(1,2)5/2(7)3/2 with a negative
mixing ratio; From this table with a mixing ratio of zero, the
value of the correlation coefficients were A2 - .05 and A4 = O.
(8)
,

/
\
\ 1" , :
.. W(Oo) may now be calcuiated irom the expansion:
W(è) = + AZP2(coS e) -+ !\4P4(coS é)
= + AZP2 kos e)
For the Legendre ~0lynomÎal5 we have:
PZ(C05 e) = !(3 c05Ze-l)
and for e = 00 we have:
Pz~cos 0) = t(3 c052 (0)-I)
': t(3-1)
= 1.
Thus for the present case, the value of W(OO) ÎsQgiven by:
wcoo) = 1 + AZPZ<Cos 0°)
= 1 +.05(1)
- 1.05 '-l
The cortribution to the activity of the 990 transition due to
(9 )
(10)
(lU
the activity of the summing effect may be calculated by equation 11
for each rune The activity which has been observed as ô summing
effect, has actua 1 Iy been due to two separate gamma':'rays. The
summing activity has thus been lost for both gamma-rays ~
should be added to each activity to produce the true activity
w~ich WQuid have been observed if summing had not taken place.
The above'method of estimating summing de pends o~ how wei 1 known /'
the spins of the states are, the calculation of the mixing ratio,
and how a~urate the correlation coefficients are known.
Experimentally, summing effects can be removed by doing coincident
studies. Another method would be to fol low the relative intensity
of the 990 transition' (relative to the 617 transition) as a sample
was rroved further from the detector. The i n'tens i ty of the rea 1
17
'1
J

/
. .
18
transition would drop off as the efficiency for each distance, wh~ le
the sum component,wOuld drop off as, essentially, the efficiency squared.
FinAl Iy, a distance would be reached where summing would become
negilgible and only the pure transition would be observed. Neither )
of these techniques were used due iO thp. fact that the discrepancy
~ in The resulrs did not show up unti 1 the anatysis of data was complete.
~ , V. Calculatjoo of the Dpêay Scheme .
The decay scheme of a radioactiv~ nucleus can be calculated
trom a knowledge of the level scheme of the product nucleus, the
percent age of decays which resu/f f~om ground state parent to
, ground state daughter transi-ti~s, and the relative intensity of
each gamma-transition. The energy level scheme of the daughter
allows the calculation of ail possible gamma-ray energies which can
be "Iooked for in the spectrum and fi tted i nto the decay sCheme~' The decay of ail the peaks in the sample spectrum were
followed, and those with the correct half-life assigned by energy
to the prope~ transition between levels in the daughtet. No
gamma.transltions w~re observed which decayed with the proper
half-life but could not be fitted into the decay schema. Once
ail the transitio~s for each lev~1 were assigned, t~e percentage
"branch" of a gamma-ray from a 1 eve 1 wa5- ca leu 1 ated from the
a€tivity of that transition at the end of bombardment (from CLSQ).
The percentage branching (bri (1) for a particul~r transition
~ "i" from a level "1" was calculated from the equation:
br i ( 1 ) = (1 +d. j ) d j ( 1 ) / E pt sq ,..100 L(l"c(j )dj (1 )!Ejltsrj ~ j
( 12)

'It.
OCi = total interna 1 conversion coaf fic i ent frcm K, land M shell.
Er = eff ic i ency of Ge(Li) detector for a " particular shelf.
Sr' - sh'e 1 f ratio to convert efficiency to the J -
eff ici el"'ry on the shelf wh~re the counting was done.
di (1 ) = art iv i ty al" end of bombardme nt for the tr3nsition "i" from level " 1 Il.
j = dummy index in the sum which runs over ail the transitions "j" ,from the level "1".
The percentage branching for each transition was calculated 4
< for ail the transitions in each level and for each rune The
conversion coefficients were estimated from an extrapolatiun of
a' graph of log (li as a function ofZ for the type (MI,Et eTc.)
and energy of the transition. Nuclear data tables listingOCi(9)
for each type of transition ~nd a range of energies for Z ranging .
trom 30 to 100 were used to moke the graphe The graph of logotj
v~rsus Z proved' alrro:s,t linear, and the value of rLj w~s obtained ,
by 1 i near extrapo 1 at i on. The va 1 ues of t<, 50 obta i ned ranged frqm \
Hbwever, the' estimated error in the activity at the
19
end of bombardment was an order of magnitude higher than the conversion
coefficient and the correction due to conversion was not made.
Once the percentage branching for each transition was
calculated, the percentage ~ed (;(1» to each level in the daughter
from the paré nt was calculated from the equations:
(13 )
(14)

/
d(l) =-~ctivity corning tram level "1" alone no teed from level above).
,di (1) LEi~sri i(1)
= total disintegration rate trom level "I" summed over ail the transitions
\,dj(I') . LEjxsr j J,l';t!
trom t-he level. = total disintegration rate feeding level
from transitions summed overal 1 levels "1" above.
The absolute intensity of each gamma transition (number oi
gemmas observed per 100 decays of parent) was calculated trom the
equation
Ai ( 1 ) ::: f ( 1 ) br 1 ( 1 )~ ~) (1 , ) br j ( l ' ) J( ,'''1)
Ai (1) = number of gammas observed for transition for each 100 decays.
f ( 1 ) br: ( 1 )2 n umber 0 f gammas resu 1 t'i ng from direct t 13-feeding of level "1" from parent.
~(t')b~(I').number of gemmas- resulting from the jO',tJ) feed i ng of 1 eve l "1" from ';Cascad i ng
" gammas from levels "1" above. .
VI. Rubidium Analysis.
"i"
The spectrum ot K43 contains peaks due ta K42 and Rb82m •
The CaO used was reagent, but- would contain trace amounts of Sr.
82m 84 Rb would be formed from a (p,2pn) re~ction on Sr and would
05 )
ultimately show up in the KCI04 sample because rubidium follows the
same cbemisi-ry as potassium. An estimation of the amount of Sr in . .. ....
the CaO can be obtained from the activity of the rubidium in
the KCr04• The amount' of Rb82Mproduced from 51"'84 by the irradiation
Is given by:
(6) . ,
20

)
/
d
o = disintegration rate observed at EOB 1 = Intensity of t~ beam n = number of target atoms of Sr par square
cm of target ~= cross-section for the reaction ~= deray constant for Rb t = time of bombardment
• The above equation can be solved for n providing ail the
other variables are known. The total amount of Sr in the CaO
can be calculared by dividing 0 by the abundance of Sr84 • A
chemical yield of 65% for pofassium was assumed based on previous
experiments and a beam lntensity of 5 x 10¹² protons per second.
The reaction cross sections for the reaetion was estimated from (16)
(p,2pn) on Sr88 which has a value of 10mb at 35MeV. The
disintegration rate 0 was calculated from the equation:
o = count rate at EOB detector efficlency intensity of r-transltion
~
~
chem. yiela
The percent Sr in the reagent CaC03 was found to be
approximately .1%.
VII. Error Analysis.
The errors quoted in the results are only random errors
-resulting from fhe CLSQ fit tà the experimental data. The errors
do not include any systematic error resulting from the uncertatnity
in the efficiéncy calibration of the detectors (2 - 4% over the
energy range of interest).
The error in the addition or subtraction of activities was
21
taken as the square~root of the sum of the squares of the estimated errors
on each activity. The relative error in the multiplication or
division of activities was taken as the square-root of the sum of the

/
.. squares of the éstimated relative error in each activity.
The relative error in,the activity of the 990 keV transition
due to estimation of summing effects, was estlmated at plus or . minus 50%. The estimated error in th~ activity of the sum
contribution to the 990 keV transition, which must be added to the
--activity of each cascade gamma-ray (372 and 617 keV transitions), <
was directly added to the estimated error determined from CLSQ.
l' '
1
22
/
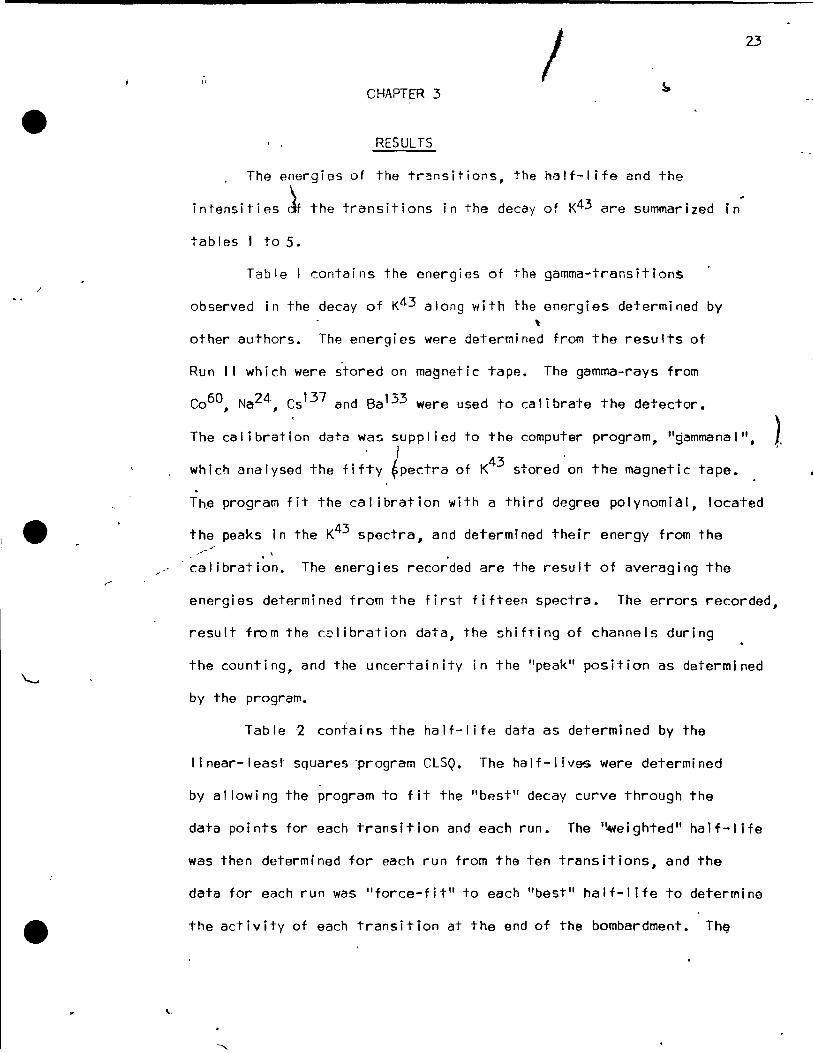
/1 1 CHAPTER 3
RESULTS
. The energies of the transitions, the halt-life and the
intensities1 the transitions in the decay of K43 are summarized in
tables 1 to 5.
Table 1 contains the energies of the gamma-transitions
observed in the decay of K43 along with the energies determined by ~
other authors. The energies were determined from the results of
Run Il which were stored on ma~netic tape. The gamma-rays from
Co60 Na24 Cs137 and Ba133 were used to calibrate the detector. , ,
23
The calibration data was supplied to the computer program, "gammanal", }
which analysed the fifty ~pectra of K43 stored'on the magnetic tape.
Th~ program fit the cal ibration with a third degree polynomial, located
the peaks ln the K43 spectra, and determlned their energy from the - .
- calibration. The energies recorded are the result of averaging the
energies determÎned from the first fifteen spectra. The errors recorded,
result fram the cclibration data, the shifting of channels during
the counting, and the uncertainity in the "p~ak" position as determined
by the program.
Table ,2 contains the half-life data as determined by the
Ilnear-least squares -program CLSQ. The half-lives were determined
by allowi ng the program to fit the "best" decay curve through the
data po i nts for each trans i t i on and each run. The '~e i ghted" ha 1 f-I i fe
was then determined for each run from the ten transitions, and the
data for each run was "force-fit" to each "best" half-I ife to determine
the activity of each transition at the end of the bombardment. ThQ

• ,.
-'
•
/
.e
weighted half-life for K43
was then determi~ed by avera~ing the
half-I ives from the four most abundànt transitions from each rune
The errors reported are thos~ estimated by CLSQ. The JI\'/e i ghted ,
average" of a resu 1 t R (denoted R) and the standard error
(denoted cr:) ... Iere determ i ned for ail the resu 1 ts recorded from
the ~formula (2)
R = one particular determination of R. a = estimated error in value R
Table 3: contains the branching ratios of the transitions
k3 for each level in Ca (determined for each run), alon9 with the
weighted average. The errors quoted only include the error from •
·CLSQ and do not include the error in the efficiency ,calibration of
the detectors.
Table 4 contains the percent beta-feed to each level in Ca43
from the decay~of K4~ (determined for each run), along with the
weighted average. A 1.5% ground state to ground state feed was
assJmed in order to obtain the results. The 1.5% feed was obtained
by averag i ng the resu 1 ts of Li ndqv i st et al (13) and Benczer-'
Koller et al (1) which were 1.7 and t .3% respectively. The errors
quoted only include random errors.
Table 5 contains the absolute intensities of the gamma-
transitions as observed for the three experiments, along with the
wer~hted average. The errors quoted only include the random errors
24
resulting from the uncertainity in the value of the activity obtained •
by the extrapolation of the decay of the samples back to the time
at~the end of the bombardment.

T
25
The agreement between The 30cc data end the 40cc data is
very good. (The estimated error is the lower Itmit to the true
error due ta the fa,t that the possible error in the efflciency
cal ibration has been negleded). Consideri ng only random errors,
the results of the three experiments usual Iy agree to within
the estimated error.
The ClSQ fit of-the- wei~ht~d ha 1 f-I i fe ~t 22-.AEL11OUC5.-- --
" ta the decay of each gamma tr~nsition, (determined from the 30cm3
Ge (Li )Idata) is reproduced in Figures 2-6. The Figure 6
"" contai ni ng the 1021 transit i on shows the two component fit to the
data. The half-life fits most of the data Bxtremely wei 1 except
for the weakest tran~iti~n~ due to the s~ of data points. The
spectrum of KCI04 obtained on the 30c~ Ge(Li) detector, four hours
after ~he end of bombardment, for a 4000 second count on shelf , <'u
one, is reproduced in figure 8 • In Table 8, each peak in the
spectrum of KCI04 is identified by its energy and its corresponding
radioactive nucleide. Figure 7 il lustrates the decay schema of K43
determined from the results of the three experiments •
. " ---
•

e
,
i 1
J Present work Energy{keV)
220.6 ± .4
372. 7 ~ .6
396.8 :t .4
404.5 ± .4
593.3 ~ .3
617.3 :t .3
801. 1 t..3
990.0 '! .2
1021.7 :!: .2 ..j
1394.7.!,,;3
'----'
e ,
" TABLË t
ENERGY OF GAMMA-RAY TRANSITIONS IN THE DECAY OF ~3.
'''' •
Waters Energy (keV)
~
221.'-± .2
372.9 ± .2
397.0 ± .2
405.6 1: .2
593.6 ~ .2
617.8 ± .2
802.4 :t .2
988.2 ±. .2
1 022. 1. "t • 2
1392.6 ! 1.0
" r / -../
Larson et al Energy (keV)
•
220.6 ± .7
372.9 Z .5
396.8 :t .5 .(.~~
593.4 '! .4
617.3 ! .4
800.8 ~ 1.0
989.9 "t .6
1021.8 ±' .5
1394.2 -t. .7
~
\
~
('
Taylor. et al Energy (keV)
219.2!; .7
373.0 ± .5
397.0 1:. 1.0
592.5 ± 1.2
617.2 j: .5
"- e '"
/
'" Chasman et al Energy (keV) .
0
• 222 1: 2
372 ±.
396 :t 2
404 r 2
594 :t 2
616 ± 2 .)
800 ± 2 • 990 ± 2
1021 ± 2
1393 ± 2
~
(

/
c
27
TABLE 2
~ HALF-LIVES OF TRANSITIONS FROM CLSQ.
En(keV) Run 1 Run 1 1 Run 'II
220.6 22.30:t .\6 22.56:! .09 22.46:t • Il
372.7 22.4\ ±. .03 22.48 ~ .02 22.38:t .02
----- ~- ---::-::-:;--::-;------::=--------1 22.46:t .04 22.521:.05 396.8
404.5
593.3
617 .3
801.1
990.0
1021.7
1394.7
22.32 1: .. 08
22.3\ ± 1.06
22.27 ± .08
22.44 1: .06
22.02 ~ 1.11
22. 1 5 :!: .2 1
22.50 :t .27
22.49 .! .83
22.39 :1". •• 04
22.75 :!: .55 22.80:2: .73
22.531: .04 22.44± .d5
22.46 :!: .03 22.46 t .04
22 .5 1 :!: .67 24 • 15 :t .96
22.30:!: .11 22.08± .14
22.48 ~ .14 22.89"!: .25
21 .40 ~.41 22.61-.t .53
22.43 ± .92 22 • 48 '!:. .02
From four most abundant rays, 372.7,396.8,593.3, 617.3
tî = 22.44:t .02
From previous work
Taylor etai v/aters
(1969)
, 22 22.6"! .2
Overstreet et aL
( 1949)
22.4
\
LI ndqvi st et al
( 1954)
22.0
o

• Ji:
Leve 1 Energy (keV)
1394.7
990.0'
593.3 - .(
372.7
Gamma Energy (keV)
404.5
BOI.I
.1021-.7
1394.7'
"
396.8
617.3
990.0
220.6
593.3Q
372.7
.,.
-----
-TABLE 3
BRANCHING RATIOS
Run 1
14.0~ .B
5.1 ±.3
74.6~ 1.5 .-
iJ.3 :!: .3
12.B"t. .1
86.6"!:. 1.2
.6 ± .3
28.5 -t .3
71.5 ± .4
100.0
% BFanching Run Il
1"3.B ± .4
S..2~.2
75.2"t .8
5.B:!: .2
12.9±.1
86.6 ±. 7
.5 :!: .2
29.3 ±.2
70.7±.2
100.0
'-
..,.
" .
Run 1111
14.5 ! .7
, ~ 5.2 - .3
74.2 1.3
6.2 .2
12.6 t:t .1
86.6
29.2 I:t. .2
70.81'±: .3
100.0
6
e
% Br~ching Weighted Avg.
14.0± .3
5.1 ± .2
74.9=.6
6.01:.2
12.8"!.1
86.6 ±.6
.61..2
29.2"t..1
70.81:.2
100.0
.,
•
N CD

e
;;.;?
'l'
\ )
,-'
Leve 1 Energy (keV)
1394.7
990.0
593.3
. 372.3
o
Q ..
.....
-,
TABLE 4
Ca43 IEVEl FEEDING FROM THE DECAY OF, K43
Run
2.63:t .04
89.6:t 1. 1
4.23 ± .08
2.1 1::. .7
1.5
% Feed Run Il
2.76 ± .03
89.2 :t ,.8
4.02 :t .06 .
2.5 ~ .5
1.5
v
•
Run III
.. , 2.55:t .04
<, '
90.0 1: .5
4.38 ± .07
1.6:!: .6
1.5
'f, Feed Will i ghted Avg.
" 2.67 ± .03
89.8:!. .4
4.19±.05
2.1±' 0.4
1.5
e r ..;
N \0

e
0-
../
•
. . "
. ,.
;-.
Energy (kéV)
220.6
372.7 -396/8
404.5
593.3 .
617.3
~':80 1. 1
990.0
"1021.7
1394.7
e \1
TARLE 5
~ 43 ABSOLUTE GAMMA-RAY INTENSITIES IN THE DECAY OF K
Absolute lntensity (No. of Gammas' /100 K43 deJays)
Run 1 Run Il Ruh III ~
4.52 ± .08 4.62 :t .05 - 4.65 1: .07
86.5 ± 1.7 - 86.8 ± ~
1 • l 86.4 ± 1 • 1 -
, Il.S±'.2 Il.6 :t • 1 1 1.4 :t- .2
.368±.022 .381 ± .012 .370 ± .019
Il.3 ± .2 1 1 • 1 ± • 1 Il.3 j:, .2
77. 9± 1.5 77.6 ± .9 78.3 1: .9
• 1 34t.008 .144 ±. .006 : 133 ±. "" 008 oi
.5 ± .3 .4 ± .2 .7 -+- .4 -,.
1. 96± .05 2.08 '± .03 1.89 ± .04
.1651:.006 .160.± .006 .158 ± .OOQ
..
.-/ .. "
"--
"-
'-
'"" 1 :.1
Absolute lntensity Weigh~ed Average
4.61 ~ .04
86.6 :t .7
Il.6.:!: • 1
• .38 :!:, .01
Il.2 ± • 1
77.9 :t .6
.138 ± .004
.5 ± .2 ~~
2.00 ± .02
.161 t .004
e
r---#
, 0
~

30a ."
J
/
g.- - ,.
0
FI GrnES 2-6 .
CLSQ decay curve analysiS ofc the
" in K43 i -trans i t ions
Figure 2. 220 and 372 keV ·transitions
( e Fl'g~re 3. 397 and 404 keV transitions
Figure ~. 593 and 616 keV transitions
Figure 5. 800 and 990 keV tral'lsiti'ons ~
Figure 6. 1021 and 1393 keV transi,tions -., '- J
1 •
. . ,
' .
....

e"
/
J
<II
• •
'b
••
'b
'b
.... . ...
.... .... . ...
III III
_us: E t_ L
K-43 TIECRT SCHEME 220 KEV
..
, •• 1 ID , Il • DD ... ~o 11"[ AFlE/I Eaa. DATS ,
1 10 1 ...
K-4~ DECRI SCHEME 372 KEV
I.H '1 .. 1 •• ' 1." • Il 1 Il '.11 •••• l'"E ArTEft Eae. oATS
2~a S2U
• Il s.~o llO ... •• 0
'.11 .... .... . ... . ... '.1'

o / "' L U
.,; i v ~ .. u
'b
'b
1& ... u
...
'b
•••
. .... • •• 1." lU
1 •• 1." (
K-43 DECR, SCHEME 397 KEV
1." 1 •• '" 1." '" ... .1 J"[ ArtEl! EU DAT'
K-43 OECR, SCHEME 40'4 KEV
-1 •• . ...
'.
... • .. ' "1
. ... '.11 '.11
..i
.... .. ... . ... . ... 1.H
l
.... . ... • •• ••

/
\
f u
..; ... ~ .. z
'b
'b
\
.... .... III 1."
..
\,
K-43 OEÇRY SCHEME 593 KEV
K-43 DE CRY SCHEME 616 KEV
••• .... .... , . I.H . ... • •• • •

/
... i 1
i u ",
- Q
K-43 OECRr SCHEME'
800 KEV
• ',. ..
1
~------------------------------~---------------------------------------------------------~---,.
f u
" .. .. ~
! i LI
... . ...
<
t
••• I.H
K-43 OECRr SCHEME 9'90 KEV
1 •• 1."
, .
I.n 1.11 1." '.H TI"[ AfT[ft fOI. DAT' •••• ... I.t • 1." ••• '.11

'b
/
<1
K-43 DECRY SCHEME 1021 KEV

, /
, -
•
•
t
."
FI Gl.RE 7
The dec,ay scheme of K43 • ...
30b
J
. -

r
/ :.67l~ q "": ~ q
(3/2·. 5/2·) 'ot 1/') :'Of 0()
1394.7:f::: .3 .... " ~ ._-
-1/') --'ot
l' 0 'ot . .
89.8 i.
OC! 0() -0
,(3/2·) N .0 ci 990.0± .2 .- CIO
,
. ? e .
co "": oÔ .... 0- 0
-~.19i.
)~ M CIO
) . co
3/r ci 593.3± .3 N .....
1
<> M r... 2.1 i. è r..: ...
N ... N
~ N 0() 0
./ ! 1 1 5/r S2 372.7± .6 ...
~ ..... ..... M 0 . M .0 'ot N 0-r... ()o. 0- M
M .,., ()o.
1.5 Z
~r 1 l l ' 1 Ca43
20
e

/
J
r,HAPTER 1 V
, DI sCUSSrON
1. Rev!ew of Previous \'Iork.
. ...
31
iThe decay of KJt3 has'been investigated previously n.15,13,20,18,lT,3). '"
K43 was produced from the fol lowing rcactions, A40(~,p)K43, Ca44
(p,Zp)K43,Ca43(n,p)K43, and Ca44(~,p)K43.
K43 was first discovered by Overstre~d et al (15) from the
bombardment of natura 1 argon gas with he 1 i um ions from the 60"
cyclotron at Berkeley. The potassium produced trom the bombardment
was removed from the gas by passing it through a glass wool fi Iter
,JI
and by wash i n9 the wa 1 15 of the conta i ner of the gas where the
potassium settled. The potassium sample was fûrther purified by
pe~chlorate precipitations and separation of potassiu~ from
rubidium and cesium carriers. The decay of the potassium was
fol lo~ed by means of a Lauritsen electroscope which detected
the beta particles emitted by the source. They obtained a two
component decay curve, one component due to the 12:4 hour decay
of K42 , and the second component due to an unknown isotope of
potassÎum which decayed with a 22.4 hour half-life. They
examined the beta spectrum emitted by the'potassium sample
with a magnetic spectrograph and found three beta components wlth
maximum energies of 0.24 MeV, 0.81 MeV, and 3.5 t-1eV. The 3.5 MeV
component decayed wi th a ha 1 f-I f fe of 12.4 hours and was ass i gned
42 -to the K decay leaving the 0.24 MeV and 0.81 MeV components.
From AI and Pb absorbtion curves, They found a gamma component of

approximately 0.4 f;v\eV which decayed ·..,ith The same oalf-I i te as
the unknown isotope ot potass i ume ' They ass i gned K43 as The 22.d
hour potassium isotope, based on The possible potassium isotopes
produc-ed by The b0mb-:lrdment of aç-gon wi th he 1 i U';1 ions (produced
Li ndqv i st et· al (13) was ~he next group to i nveST i gate
the decay of K43 produced trom the bombardment of natural argon
by hel ium ions. They reduced the energy of thè helium ions unti 1
the A40 (a., pn )K42 react i on was surpressed, Thus ensur i ng t-hat the
only potassium activity would result trom K43 • The potassium was
removed by wash J ng the wal 'S of the chamber conta in i ng The argon
with distilled water and chemically separat-ing the potassium on an
r on exchange co 1 umn. They determi red the energy of the gamma
trans i t ions i n the decay of K43
by measur i ng the di str i but i on of
photo eledrons emitted trom lead and uranium radiators with a
magnetic spectrometer. They found photo electron Ilnes which
corresponded to five gamma-transitions with energies 0.219 MeY,
0.369 MeY,~ 0.393 keV, 0.627 keV, and 1.00 MeV. They eST i mated
the relative intensities of these gamma-transitions trom the
32
photoelectron cross-sections for the energies involved. They measured
the beta-ray spectrum with a magnet-ic spectromet-er and resolved
the sp~ctrum into five groups by means of Fermi-plots, determining,
end-point energies of 0.243 MeV, 460 MeV~ .827 MeV, 1.218 ~V and
1.839 MeV. They determi ned the percentage j3eta'feed to each leve 1
--43 of Ca43 and proposed a rough decay scheme for K • They di d not
observe the weaker intensity transitions due to the insensitiviTy
of their equipment~ with t-he result- that the ordering ~f levels in
.,,)

1
Ca43 1 s 1 ncorrect • However, w i th the equ 1 pme nT evelleb 1 a to
Them, they determined the dacay scheme of K43 as thoroughly es
possi bla.
Bene 1er-Ka 11er et el (1 ) undertook the re-1 nvast 1 gaT ion
of the decay of K43
wlth ttm aid Of? Nal (TI) scint'.'l)tlon
spectrometer WiTh a 20 channel analyser. They produced K43
from the reactlon A40 Ca.,p)K43 bn enrlched llrgon gas (99.6.fA40 )
aT an anergy which prohlbltted any production of K42 trom
the A40 CCl,pn)K42 reaction. They did noT perform any chemicol
33
separations. They determinad The energies of six transitions, whlch
were observed 1 n (a decay of The t r samp 1 es, by photoe 1 ectron spectro
emltted trom lead and uranium radiators. The resolution of
their spectrometer was 1.5% which eMbled them to resolve the
0.627 MeV transition observed by lindqvist et al into two tra'r,sltions.l
of energy 0.59' MeV and 0.614 MeV. The Ne(l) TI detector was not
able to resolve ail the transitions end so was used to calcut'ate , ,
the relative Intensltles of severa 1 of the transitions whlch were
difflcult to determine from photo-electron cross-sections. The
ordering of the levels ln C,,43 was determined by performing
and j3-l( coincidence measurements. Th,e beta-spectrum was measured with
a solenoid spectrometer. Fermi plot,s were.used to resolve The b,eta
groups, determine the end-point energy, and assign a relative
intensity ~o each group. Two bete-groups remained unresolved,
and thus a total relative Intenslty was asslgned to thelr transition.
Thel,. work agrees fairly weil with the·work of Lindqvlst eT al for
relative gellllTla-ray intenslties when elloWlH\CeS ~re made for the f~cT

."
/
that the .627 MeV transition was unresolved in Lindqvist's work.
They di d not observe the 0.243 MeV beta -Trans 1 tian that Li ndqv 1 st
did. They observed a 0.388 r.1eV gamma-transition which was not
observed by Lindqvist et al. The 0.338 MeV transition is subject -to debate. Due ta the tact that chemical separations were not
performad, and ha 1 f-I i ves we~ not fa Il O'.'1ed, the 0.388 MeV
87 ga~ma-transition may,have-côme from the decay of Sr produced
84 87 from the Kr (~,n'Sr reaction on trace impuritles of krypton.
~ They predicted'the order of the three first excited states of
Ca43 correctly from the coincidence measure~ents. However, due to
the 0.388 MeV transition and 'uncertainties in the gamma energies,
They incorrect 1 y pred i cted a leve 1 at 1.272 f-1eV inCa 43 from
summing the energies of coincident gamm~s. They determined The
spins and parities of the first two excited states of Ca43
from their
calculated log ft values and arguments trom shell mode 1 calculatlons.
The above work was an improvement over the previous two attempts
at determinlng the decay of K43 •. At that time, the above work
34
could only have bee~ improved upon by performing chemical separations .
~f the potassium (most likely removing the 0.388 tl\eV transition)
and determining the half-life of K43 •
Chasman et al (3) produced K43 trom the Ca 43 (1:), p )K43
reaction. They used a solid state 30cm3 Ge(Li} ~etector to obtain
the gamma-ray spectrum of K43• They did not perform any chemical
separations on the Target and only a 5mall portion of the K43 5pectrum J
was reproduced. They performed ~-~ coïncidence studies to verify
the lines found in the spectrum obtained on the 30c~ Ge(Li}
detect6r. They observed eight gamma-rays ln the decay of K43

/
with energy 0.222 MeV, 0.372 ~,leV, 0.396 MeV, 0.404 ~V, 0.593 MeV, '1 -,
0.616 MeV, 0.800 MeV, and 1.021 MeV. They calculated the branching
~. rat i os for éach i eve 1, and by assumi n9 ~% beta ground state
decay, calculated the other intensities ol the ber~-transiti~ns •
• The resu 1 ts of the i r work are sumr.mr i zed i n tab 1 es 6 and 7.
They estimated an uncertai nit y of plus or minus twenty per cent
in the intensities and determined the energies of the gamma-rays
to plus or minus two keV. They observed the 1393 keV transition
but assigned it a? a sum peak. The 388 keV transition observed
by BenC7er-Ko 11er et al was not observed in the i r work and 50 waS
om i tted from the decay scheme. Th i 5 was The fi rst attempt at
determlning The decay scheme of K43 with ~a sol in state GeCLi)
detector. f-bwev(tr, due to the fact that Their potassium source
was contaminated with other activities, t~e weaker transitions
at 990 keV and 1393 keV were not assigned and large uncertainties
in the quoted intensities of the other transitions were reported.
They di d not determi ne the ha 1 f-I i fe of K43 but determi ned the
spins and parities of the first three excited states of Ca43 based
on log ft values calculated from their experimental results. Their
intensities of bata-and gamma-transitions did not agree very weil
35
with the previous results of Lindqvist et al and B,=nczer-Koller et al • •
Taylor et al (18) produced K43 from the Ca43 (n,p)K43 reaction.
They bombarded 50g of natura 1 CaO for 40 mi nutes with 14 MeV
neutron~. They did not perform any chemical separations of
potassium, but recorded the gamma-spectrum of the target with a
20c~3 Ge(li) detector and 2048 channel analyser. They determined
. .

1
.. 1 43
the half-life of K to be 22 hours trom the decay of the twp
mostintense gamma-transitions (372 keV and 617 keV) in tha'decay ~
of K43 • They observed the five most abundant gamma-rays ~f K43
(220 keV, 373 keV, 397 keV, 593 keV, and 617 .keV) and calculated
their relative intensities. They assumed a 1.3% Beta-transitlon
to the ground state of Ca43 and calculated the intensities of the
three other mos~ intense beta-transitions. The resultS of their
work are summarized in Table 6 and 7. Their wbrk is very incompletè.
They di d not ,have a pure potass i um source and they rrœasured the
relative intensity of only the five most abundant gamma-rays from
43 the decay of K~ •
"'" Chasman et al.
Their investigat~on was not as thorough as :
Larson et al (11) produced K43 fro~ the Ca~4(~,p)K43 reaction
on a Target enriched in Ca44 • They did not perform any chemical
separat i ons of potass i um from the -target. They ëleasured t he gamma
ray spectra with a 10cm3 Ge(li) detector and a 4096 channel analyser~
They determined the energies of the gammas, with gamma-ray energy
standards. They did not ~trserve the 404 keV transition recorded by .
Chasman et' al, 1 but observed a 990 l<eV and 1393 keV trans i t Ion wh i ch
decayed with the proper half-life. They deiermined the relative'\ •
intensity of the gamma-transitions more precisely.than previous work.
The results of their work are summarized in Tables 1, 6 and 1. They
did not reproduce à spectrum from their K43 source, nor did they quote
the value of the half-I ife They used to determin~ their.results.
They al50 did not report the length of time they fol lowed the decay
of the samples. They experimental information is very sketchy, but
the quai ity of the work is an improvemen-t, over the 1'~~vious ,attempts ,

;
•
43 at determining the de~ay scheme of K
. 43 . \'iaters,(20) produced K fre." the A40C«.,p)K4:3 reaction
.:
on argon gas~ He reduced the beam energy to approximately 15 ~1eV
42 . which greatly reduced the yield of K fram the competlng reaction
A40Ccx. )K42 , pn , He trapped the potassium acttviry formed by
circul~ting the gas stream through a glass fibre fi Iter PQper.
He wash-ed the artivity from the fi Iter paper witch .001 r-1 Hel . .,
a~d reçorded th~ ~43 spectrum with a 15cm~Gff.Cti) detector and
4000 channel analyser. The en~:gies and intensities of the
gamma-transitions were detarmined fr~ the e~ergy and efficiency
calibr.ation of the detector • , 43 .
the half-life of Kwas determined
. by counting the K43 sampl,e on a Nal (TI) sciJlti lIation detector.
The activity of tQe sample was fol lowed for three hal~-lives ana
resulted tn a half-life of 22.6 ± .2 heurs. The ~esults of the ,
work ,are summarized ln tables 1,2,6, and 7. In addition TO the
, "
transition~ reported in table 1, transitions'of 184 keV and 1015 keV
were al 50 observed. The resu 1 ts ef \'iaters' work agree very we 1 1
with the previous work ~f Larson et al.
The fi na 1 paper ~ 5) pub 1 i shed on 'the dec~y of K43
was a
comptlafion of'the work done on the energy levels of nuelei with
A ~ 21 - 44. The compi lation used the results of the seven previous
37
!
papers to ~determi ne a . ,~ ,
branching rati9s"and
w.ei,ghte'd average set of"intensities of ~ransiti9ns,
halt-life for t~e decay of K43 • Except for , o
the 1 ast two papers by Waters 1 and Larson et al" the other pa'pers
are inconsistent due te the fact that elther their samples were
not clean, or their. detectors were not sensitive eneugh te' pick up t>
ail the transitions. The i~concistency in observing the weak transitions,

"
38
. ~Iong with inronsistencies in the reported relative intensities
of the gamma~transi+ions, led to tr~ present work on the investigation
43 of the decay ot K in the hope of clearing up sorne of these • i ncons i sfenc i es.
1 1 • Present "/ork. t
The present Jork produced K43 from the Ca4d (p,2p)K43
reaction on natural CaO. Perchlorate precipitations of potassium
were çarried out to obtain as "clean" a sample of potassium as
possible. The spectrum from the KCIO~ precipitate, four hours
after the end of bombardment is reproduced in Fig. 8 • Table 8
1 ists the identification of each gamma-transition by e~ergy
and radioactive nucleide. The presence of Rb82m would result
84 82m from the reaction Sr (p,2pn)Rb on trace amounts of strontiuM
in the CaO. The peaks of K43 are ail resolved, with the weakest
transitions showing up clearly. ,K42 has a transition of 1020 keV
which would interfere with the 1021 keV transition of K43 • This i •
was taken care of by performing a two compone nt decay curve
analysis on the 1021 keV transition of K43 • However, when a
two component decay curve analysis of the decay of the 617
transition was performed, a negative activity was obtained
82m for the Rb • The contribution from the 619 transition tram
Rb82m would be small (as estimated from the intensity of the 554 . and 776 transitions) and would contribuTe an activity of the arder
of the standard deviation of the àctivity of the 617 keV transition "
in the decay of K43 . The three samples were counted on a 30cm3
Ge(li) detector (one sample) and a 4096 channel.analyser and a
40c~ Ge(li )(remain!ng two samples) and a 1600 channel analyser.

/
{
-
This al lowed us to check fpr any inconsistency which might
arise from the efficlency calibraticin of ou~ detectors. The -
results of the present work are summarized in Tables l - 8 ~nd
Fig. 7
Tables 1,2,6 and 7 contain the éomparison of the present
work with previous work. The present work agrees wei 1 with
the work of Waters and Larson et al. The inTensities ot the
transitions (13 and "6) have been determ-ined more precisely than in
previous work whi le the determination of the energies of the
gamma-transitions are as precise as Water's,work. The half-lite
of K43 has been determined more precisely than in any previous 4
work.
The present work had the benefit of three separate
determinations of the deray scheme of K43 , on 30cm3 and 40cm3
Ge(Li) detectors. The SQurces were highly active, with a minimum
of interference from other radioactive nucleides. The peaks
of K43 were resolved and the decay of'the sources was fol lowed for
a period of seven half-lives. The above conditions were considered
necessary to do a thorough study of the gamma-rays resulting "
f{ from the decay of K43 • None of the previous works reported,
, fu'fil'ed al l,the above conditions" 50 it was not surprising
that the estimated error in the present work was sma'iler than in
39
any previous work. The half-lite and data associated with the intens-
ities of the gamma-transitions are more precisely defined, along
with the relative percent ~eta-feeds to the, excited states of
43 Ca Although the percent beta-feed to the ground state of
Ca43 was not determined in the present work (a 1.5t transition
was assumed trom earlier Beta-decay work), it is thought that ,)
the present work is a definite improvement on the previous works.
--)
e
Energy .
(keV)
220.6
372.7
396.8
404.5
593.3
,617.3
801.1
990.0
102J»7
1394.7 /
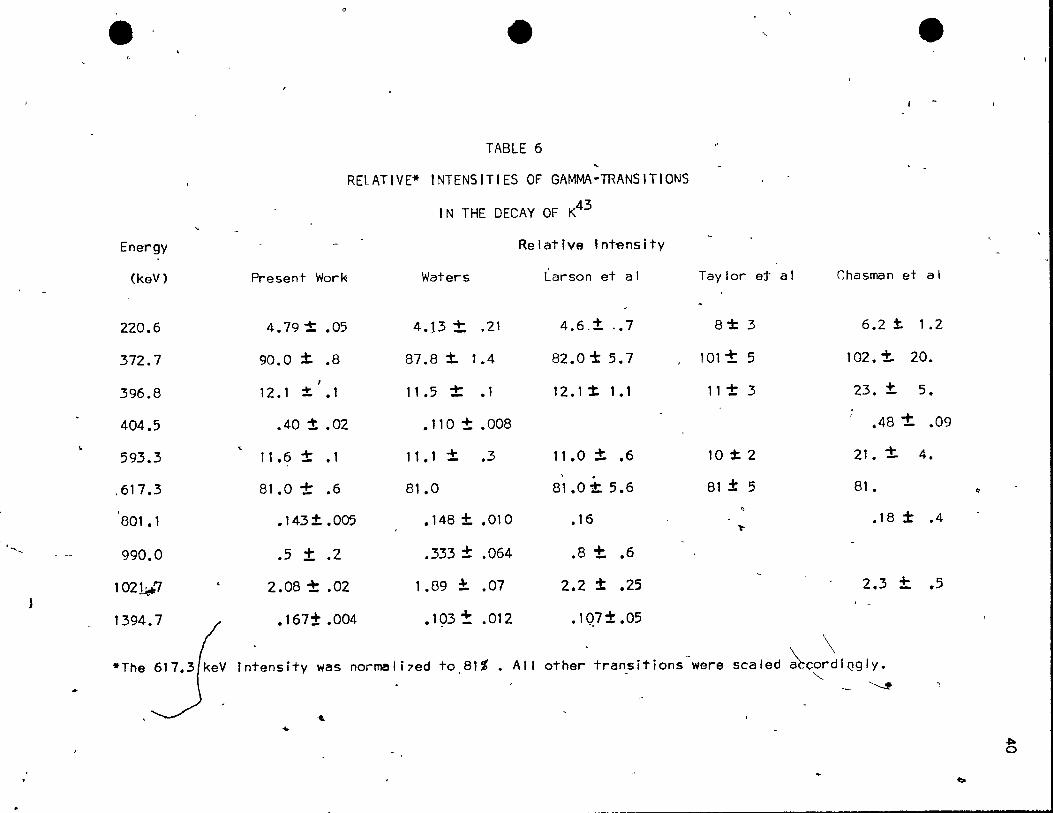
-TABLE 6
RElATIVE* INTENSITIES OF GAMMA-TRANSITIONS
IN THE DECAY OF K43
Present Work
4.79 j: .05
90.0 ± .8 1
12. 1 ~ .1
.40 j: .02
11.6 :!: .1
81.0 ± .6
.143 ± .005
.5 + .2
2.08 1; .02
.167± .004
Waters
4.J3 ± .21
87.8±.t.4
11.5 :!: • 1
.110 ± .008
11.1 ± .3
81.0
.148 ± .01 0
.333 ± .064
1.89 ±. .07
.193 ± .012
Relative Int~nsjty
Larson et al
4.6_± .• 7
82.0 ± 5.7
12.1"X 1.1
11.0 :t .6 .
81.0 t: 5.6
• 16
.8 t. .6
2.2 ± .25
.1 Q7 ± .05
'-
Taylor et al
8± 3
lOI'±: 5
11 ± 3
10 't 2
81 ± 5
l'
e
Chasman et al
6.2:t. 1.2
102. ±. 20.
23. ±. 5.
.48"±. .09
21. ± 4.
81 •
.18 ± .4
2.3 ±. .5
\ *The 617.3/keV fntensity was normeli7ed tO,81% • AIl other transitions were scaled ~çOrdfQgly.
. " '~
... ...
~
b
~ o

.. es e e i;-
'-~
/
/ TABLE 7 .'I!.'
INTENSITIES OF BETA-TRAMSITIONS IN THE DECAY OF K43
level Beta ~ntensities Present Li ndqvi st . BenC7er- -Tay for Chasman tarson Waters
Energy (keV) Work et a 1 ~ Koller et al et al et_al et al ~
1394.7 2.67'± .03 5.7 8.2 2.4 -2.4 t .4 2.2 ± • 1
990.0 89.8 ± .4 87. 87. 82. ± 5. 83.0 93. ± 3. 92. :! 3.
593.3 4.19:t .05 6.':t.4. 3.1 3.3± 1 .6 3.5 ±. • 5 • 5.7 3.5
372.3 2.1 ± .4 11.:t 7. 10.2 <2 <3
0 1.5 l .7 1.3 ,i
li'
.;
~
,
'. ~
~
'" ..


\.
/
\
FIGLRE 8
Gamma-ray spectrum of K43
"
o
42a
t'
.-r'

-e
r --' --=-=---')
~l 60'( ')
l
l
...J I&J Z Z a: ;;r: u
.. '
_p_ ....... _._4 ~--_.--
1
1 1
1 !
1

el
/
REFERENCES
1. tJ. Renczer-Koller, A. Schw3r7chi Id, and C.S. iqu: Phys. Rev. IlS, 103 (1959)
2. P.R. Reving+on, Data Reduction and Error An31ysis for the Phys;cal SCip.ncés, r~cGrpw-Hi Il, Toronto (1969)
43
3. r,. Chasman, K.W. Jones, and R:A. Ris.tinen, Phys. Rev. 169,911 (1968> ,
4. J.B. Cumming, Applications of Computers ta ~Juclear and Radiochemistry Jo- (Nat i ona 1 AC3demy o'f Sc i ences, Nat i ana 1 Research Counc i 1
tJuclear Series No. NAS-NS 3107, 1962)
5. P.M. Endt, a'd r,. Van der Leun, Nuel. Phys. A214, 508 (1973)
6. M. Férent7, and N. Rosenzweig, Alpha-, Beta-, and Gamma-ray Spectrose.opy, Vol Il (Appendix 8), (ed. E. Karlsson>, North I-b Il and, Amsterdam (19,65)
7. G. Friedlander, J. Kennedy, and J. Miller, Nuelear and Radiochemistry (ed. 2), John Wi ley and Sons Inc., New Yûrk (1966)
8. R. Gunnink, R. A. Meyer, J.B. NJday, and R.P. Anderson, Nucl. rh~tr. Methods 65, 26 (1968)
9. R.S. Hager, and LC. Seltzer, Nuel. Data A4, 1 (1968)
10. R.L. Heath, Scinti 1 lation Spectrometry Gamma-Ray Spectrum Catalo~ue AEC Research and D~velopment Report CPhysics), 100-16880-1 (ed. 2>, Vol 1 (1964)
11. R.E. Larson, and C.M. Gordon, Radiochim. Acta 13, 61 (1970)
12. G.W. Leddieotte;:and W.T. Mul lins, Oak Ridge National Laboratory, (unpublished). Quoted ln The Radiochemistry of Potassium NAS-NS 3048, USAEC (1961)
13. T. Lindqvist, and A.C.G. Mitchell, Phys. Rev. 95, 444 (1954)
"14. A.C.G. Mitchel, R. Van Lieshout, A.H. Wapstra, R.A. Ricci, and R.K. Girgus, Alpha-, Beta-, and Gamma-ray Spectroscopy Vol 1 (ed. K. Siegbahn),. 'North Holland, Amsterdam (965)
15 .. R. , Overstreet, L. Jacobson, and P.R. Stout, Phys. Rev. 75, 231 (1949)
16. D. Sachdev, N.T. Fbri le, and L.Yaffe, Cano J. Chem. 45, 1149 (1967)

44
17. E. Segre, Nuclei and PartJcles, W.A. Benjamin Inc., New ,York (1965)
18. H.W. Taylor, J.D. King, H. Ing, and R.J. Cox, Cano J. Phys. 47,~, • 1539 (1969)
19. H.W. Taylor, B. Singh, F.S. Prato, and R. MePherson, Nuel. Data A9 1 . (1968) .-
20. S.L. Waters, Radiochim. Acta 17, ~3 (1971)
/
•
\
. 'J
..
,