a structural study of the capsular antigen of klebsiella serotype k43 … · a structural study of...
TRANSCRIPT

A Structural Study Of The Capsular Antigen
Of Klebsiella Serotype K43
Thesis
Submitted in fulfilment of the requirements
for the degree of
Master of Science (Pharmacy)
M.Sc(Pharm)
of Rhodes University
by
Michael Aereboe
December 1992

ii
ACKNOWLEDGEMENTS
The author wishes to express his sincere gratitude to the following people:
Professor H. Parolis, under whose guidance this research was conducted, for his
interest, and professional business-like approach throughout the study;
Doctor L.A.S. Parol is, for invaluable help and advice on laboratory procedures, and
constructive criticism throughout the study;
Mr. D. Morley and Mr. A. Soper, for technical assistance and invaluable orientation
with regard to the word processor program used to produce this manuscript;
Mr K.1. Taylor, for time spent proof reading the manuscript.
Mrs.C. Hubbard and Mrs. C.M. Lunn, for the provision of secretarial services,
carried-out with sensitivity and interest;
Doctors F. and I. 0rskov, Statens Serum Institut, Copenhagen, for a culture of
Klebsiella serotype K43.
In addition I wish to acknowledge financial support from:
F.R.D. Pretoria; Adcock Ingram Pharmaceuticals;
Lennon Limited; Rhodes University and the
Border Pharmaceutical Society,
iii
DEDICATION
I dedicate this thesis and the enrichment of the post-graduate experience in honour
of:
Mr John.C. Waberski. (dip.Pharm)
on the occasion of his 61 st birthday, (24/0611992).
iv
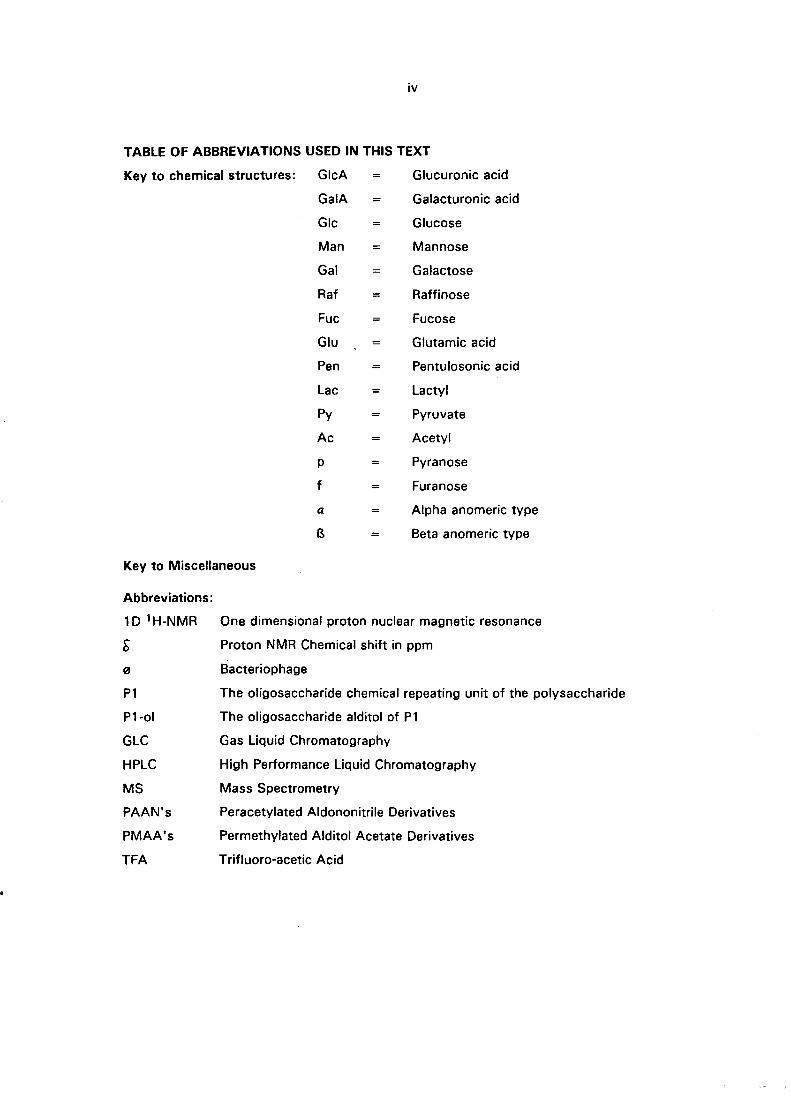
TABLE OF ABBREVIATIONS USED IN THIS TEXT
Key to chemical structures:
Key to Miscellaneous
Abbreviations:
GlcA
GaiA
Glc
Man
Gal
Raf
Fuc
Glu
Pen
Lac
Py
Ac
p
f
Q
B
Glucuronic acid
Galacturonic acid
Glucose
Mannose
Galactose
Raffinose
Fucose
Glutamic acid
Pentulosonic acid
Lactyl
Pyruvate
Acetyl
Pyranose
Furanose
Alpha anomeric type
Beta anomeric type
1 D 'H-NMR One dimensional proton nuclear magnetic resonance
b Proton NMR Chemical shift in ppm
o Bacteriophage
P1 The oligosaccharide chemical repeating unit of the polysaccharide
P1-ol The oligosaccharide alditol of Pl
GLC Gas Liquid Chromatography
HPLC High Performance Liquid Chromatography
MS Mass Spectrometry
PAAN's Peracetylated Aldononitrile Derivatives
PMAA's Permethylated Alditol Acetate Derivatives
TFA Trifluoro-acetic Acid
v
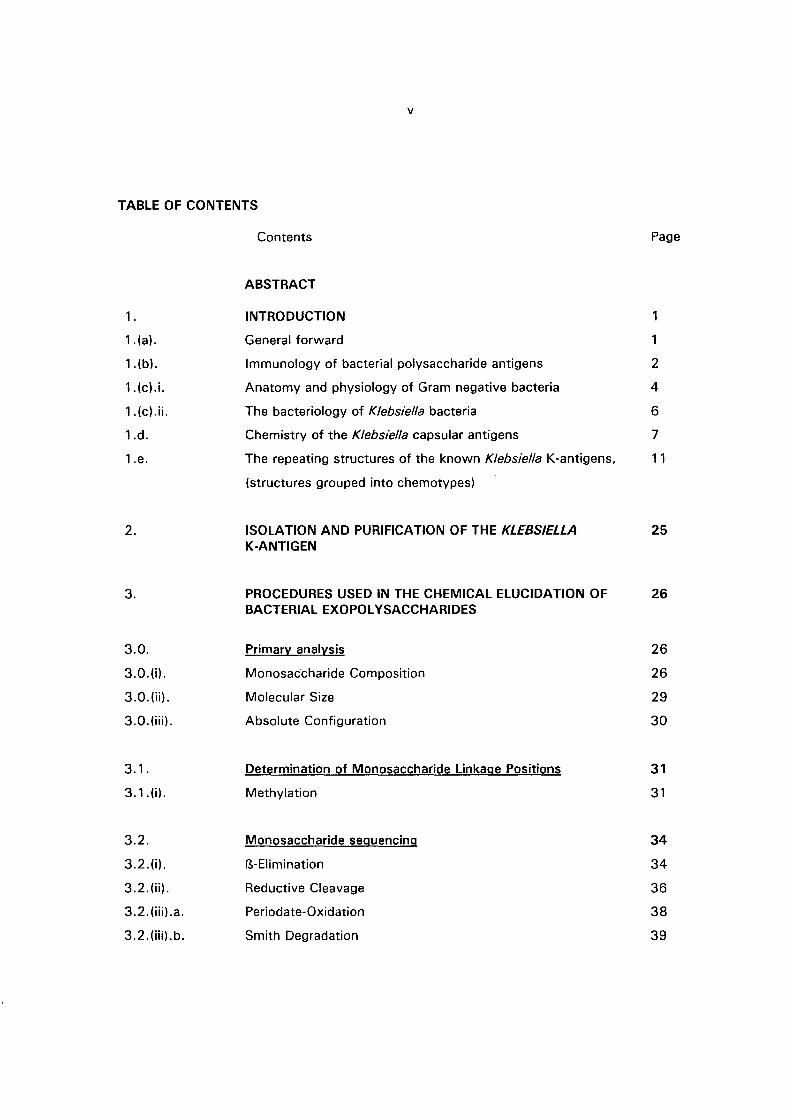
TABLE OF CONTENTS
1 .
1.(a).
1.(b).
1.(c).i.
1. (c).ii.
1.d.
1.e.
2.
3.
3.0.
3.0.(i).
3.0.(ii).
3.0.(iii).
3.1.
3.1.(i).
3.2.
3.2.(i).
3.2.(ii).
3.2.(iii).a.
3.2.(iii).b.
Contents
ABSTRACT
INTRODUCTION
General forward
Immunology of bacterial polysaccharide antigens
Anatomy and physiology of Gram negative bacteria
The bacteriology of Klebsiella bacteria
Chemistry of the Klebsiella capsular antigens
The repeating structures of the known Klebsiella K-antigens,
(structures grouped into chemotypes)
ISOLATION AND PURIFICATION OF THE KLEBSIELLA K-ANTIGEN
PROCEDURES USED IN THE CHEMICAL ELUCIDATION OF BACTERIAL EXOPOL YSACCHARIDES
Primary analysis
Monosaccharide Composition
Molecular Size
Absolute Configuration
Determination of Monosaccharide Linkage Positions
Methylation
Monosaccharide sequencing
B-Elimination
Reductive Cleavage
Periodate-Oxidation
Smith Degradation
Page
1
2
4
6
7
11
25
26
26
26
29
30
31
31
34
34
36
38
39

vi
3.3. Pol)lsaccharide deQol)lmerisation techniques 41
3.3.(i) Partial acid hydrolysis 41
3.3.(ii) Lithium degradation 43
3.3.(iii) Enzymic depolymerisation 44
3.3.(iii).a Virus-borne enzymic depolymerisation 45
4. INSTRUMENTAL ANALYTICAL TECHNIQUES 48
4.0. Introduction 49
4.1. ChromatograQhic Techniques 49
4.1.(i). Gas liquid chromatography 49
4.1.(ii). Liquid chromatography 52
4.1.(iii). Column based liquid chromatography 53
4.1.(iii).a. High performance liquid chromatography 53
4.1.(iii).b. Size exclusion chromatography 55
4.1.(iii).c. lon-exchange chromatography 58
4.1.(iii).d. Affinity chromatography 60
4.2. Mass SQectrometr)l 61
4.2.m. Introduction 61
4.2.(ii). Electron ionisation mass spectrometry 62
4.2.(iii). Chemical ionisation mass spectrometry 66
4.2.(iv). Fast atom bombardment mass spectrometry 68
4.3. Nuclear Maqnetic Resonance SQectroscoQ)l NMR 70
4.3.(i). Introduction 70
4.3.(ii). One dimensional spectroscopy 71
4.3.(ii).a. One dimensional proton (1 H) spectroscopy 71
4.3.(ii).b. One dimensional carbon (13C) spectroscopy 76
4.3.(iii). Introduction to two dimensional spectroscopy 78

vii
4.3.(iv). Homonuclear correlation spectroscopy 79
4.3.(iv).a. COSY 79
4.3.(iv).b. Relay COSY 80
4.3.(iv).c. HOHAHA 81
4.3.(iv).d. NOESY 82
4.3.(iv).e. ROESY 83
4.3.(v). Heteronuclear correlation spectroscopy 84
4.3.(v).a. Normal phase detection 84
4.3.(v).a.i. HETCOR 84
4.3.(v).b. Inverse phase detection 84
4.3.(v).b.i. HMOC 85
4.3.(v).b.ii. HMOC-TOCSY 85
4.3.(v).b.iii. HMBC 88
5. THE STRUCTURAL ElUCIDATION OF THE CAPSULAR 90
POLYSACCHARIDE ANTIGEN OF KLEBSIELLA SEROTYPE K43
5.0. Abstract 90
5.1. Introduction 90
5.2. Results and discussion 91
5.2.(i). Isolation and monosaccharide composition 91
5.2.(ii). Methylation analysis 93
5.2.(iii). Sequencing of the monosaccharides 94
5.2.(iii).a. Base-catalysed IS-elimination of the uronic acid of methylated 94
polysaccharide
5.2.(iii).b. Lithium degradation of the uronic acid of underivatised 96
polysaccharide
5.3. NMR study of the lithium degraded polysaccharide 97
5.4. Smith degradation 104
5.5. Conclusion 105

6.
6.1.
6.2.
6.2.(i).
6.2.(ii).
6.2.(iii).
6.2.(iv).
6.3.
7.
8.0.
8.1.
8.2.
8.3.
8.4.
8.5.
8.6.
8.6.(a)
8.6.(b)
8.6.(b).i
8.7.
8.8.
8.8.(a).
8.8.(b).
8.8.(b).i.
8.8.(c).
viii
PREPARATION AND NMR STUDY OF THE OLIGOSACCHARIDE 119
REPEATING UNIT OF THE KLEBSIELLA K43 ANTIGEN
Introduction 119
Results and discussion 119
Depolymerisation of the capsular antigen of Klebsiella K43 by a 119
specifc bacteriophage-borne endoglycanase
Methylation analysis of the oligosaccharide repeating unit (P1 ) 121
Reduction of P1 and NMR investigation of the repeating unit 122
alditol (P1-ol)
NMR investigation of the oligosaccharide P1 138
Conclusion 152
A STUDY OF DATA ACCUMULATED FROM SEROLOGICAL 153
STUDIES ON KLEBSIELLA K-ANTIGENS, PERTINENT TO
PREDICTING THE PARTIAL STRUCTURE OF THE KLEBSIELLA
K43 ANTIGEN
EXPERIMENTAL 159
General methods 159
Isolation and purification of the Klebsiella K43 polysaccharide 160
Monosaccharide composition analysis 161
Absolute configuration of the monosaccharides 161
Methylation analysis 162
Uronic acid degradation 162
B-Elimination of permethylated polysaccharide 162
Lithium degradation of underivatised polysaccharide 163
2D-NMR acquisition parameters of the lithium degraded 164 polysaccharide
Smith degradation of the Klebsiella K43 polysaccharide 165
Bacteriophage depolymerisation of the Klebsiella K43 166
polysaccharide
Methylation analysis of the oligosaccharide repeating unit P1 166
Formation of the oligosaccharide repeating unit alditol P1-ol 167
NMR acquisition parameters of the repeating unit alditol P1-ol 167
NMR acquisition parameters for the repeating unit P1 168

9.
9.0.
10.
ANNEXURE 1
Media
REFERENCES
ix
169
169
171

x
ABSTRACT
This thesis presents a detailed chemical and spectroscopic determination of the
capsular, polysaccharide K"antigen isolated from the Klebsiella bacterium, serotype K43
(culture #2482). The repeating unit of the capsular polysaccharide was found to be of the
"3 + 2" repeating unit type. A uronic acid was found as part of a disaccharide side chain
and the main chain of the polysaccharide was found to be composed of a neutral
trisaccharide of mannose and galactose. The work forms part of an ongoing research
interest in bacterial polysaccharides of this laboratory and now completes the structural
elucidation of all the Klebsiella K-antigens, bar three antigens which were originally assigned
to other laboratories. These data together with the respective serological characteristics of
each serotype are available to the molecular biologist, and may result in the production of:
vaccine(s) against Klebsiella infections, diagnostic products and novel carrier molecules
enabling targeted drug delivery.

1 . INTRODUCTION
1.a. General Forward
Friedlander's 1 discovery of a mucin-like substance on cells of the Diploccocus
pneumonia a century ago might have indirectly provided the impetus for elucidating bacterial
polysaccharide structure. Nevertheless over the past three decades a wealth of structural
data of bacterial polysaccharides has been published and today the utility of these
biopolymers is being realised. These non-metabolic bacterial polysaccharides2 are generally
composed of oligosaccharide subunits which impart biological identity to the bacterium.
They also serve to initiate or suppress biological processes with reference to events of
cellular adhesion by pathogens, regulation of enzyme inhibitors, and reactions of antigens
and antibodies of the immune system.
Parolis and Wilkinson3 have reviewed developments and new directions within the
scope of polysaccharide chemistry and clearly the pharmaceutical industry stands at the
edge of an abyss filled with an exciting, growing range of biopolymers which may be
modified to fulfil the industries quest for new molecules. Apart from the attractiveness of
using bacteria and bio-engineering to produce polysaccharide material, the pharmaceutical
industry will probably enter a new era of producing "intelligent molecules" from this material
enabling either directed transit to their site of action, or carrying an agent to this site. Uhr et
al. 4 have reviewed similar technology with regard to cancer therapy and have commented on
the formation of an immunotoxin by attaching a pharmacological agent to an antigen and
thereby producing specific cellular chemotherapy.
In order that the afore-mentioned understanding of the properties, functions and
applications of bacterial polysaccharides can be used, methodologies and techniques as
discussed in this thesis are invaluable in describing the primary structure of these
polysaccharides. Most of the common bacterial 0- and K-antigen primary structures have
been published, but generally listings are incomplete, e.g. Klebsiella still have three
unpublished K-antigens. Study of the published Klebsiella K-antigens and others reveals a
need to reinvestigate many structures which were ambiguously assigned prior to the advent
2
of high field NMR spectroscopy. Ultimately research and development of the primary
structure of bacterial polysaccharides will lead to a better understanding of the relationship
between primary structure, solution conformation and physical properties necessary for
producing bio-engineered vaccines.
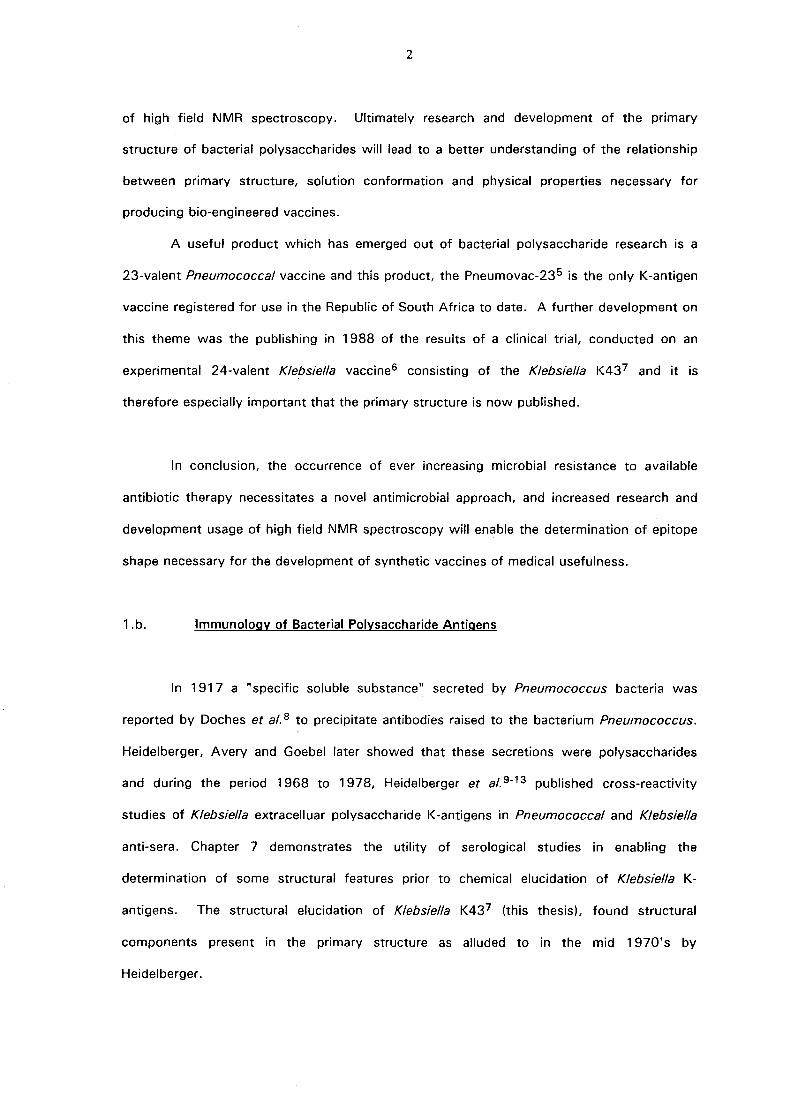
A useful product which has emerged out of bacterial polysaccharide research is a
23-valent Pneumococcal vaccine and this product, the Pneumovac-235 is the only K-antigen
vaccine registered for use in the Republic of South Africa to date. A further development on
this theme was the publishing in 1988 of the results of a clinical trial, conducted on an
experimental 24-valent Klebsiella vaccine6 consisting of the Klebsiella K437 and it is
therefore especially important that the primary structure is now published.
In conclusion, the occurrence of ever increasing microbial resistance to available
antibiotic therapy necessitates a novel antimicrobial approach, and increased research and
development usage of high field NMR spectroscopy will enable the determination of epitope
shape necessary for the development of synthetic vaccines of medical usefulness.
1.b. Immunology of Bacterial Polysaccharide Antigens
In 1917 a "specific soluble substance" secreted by Pneumococcus bacteria was
reported by Doches et al. 8 to precipitate antibodies raised to the bacterium Pneumococcus.
Heidelberger, Avery and Goebel later showed that these secretions were polysaccharides
and during the period 1968 to 1978, Heidelberger et al. 9-13 published cross-reactivity
studies of Klebsiella extracelluar polysaccharide K-antigens in Pneumococcal and Klebsiella
anti-sera. Chapter 7 demonstrates the utility of serological studies in enabling the
determination of some structural features prior to chemical elucidation of Klebsiella K
antigens. The structural elucidation of Klebsiella K437 (this thesis), found structural
components present in the primary structure as alluded to in the mid 1970's by
Heidelberger.

3
Serological and chemical studies performed on capsular K-antigens, extracted from
Klebsiella and other bacteria, have enabled immunologists to specify certain chemical
determinants 14 common to polysaccharide antigens.
Bacterial Polysaccharide Antigens may be described by:
1 . Polysaccharide constructed of chemical repeating units each consisting of 2-8
monosaccharides.
2. A polysaccharide with molecular weight greater than 50 000 daltons.
3. An antigenic core region of 2-4 monosaccharide units in each chemical repeating
unit.
4. Antigenic specificity resident in a single monosaccharide residue at the non-reducing
end of a linear repeating unit polysaccharide.
5. An antigenic core region solely in the chain, if the side chain is of oligosaccharide
length.
6. An antigenic core region extending to include two or three neighbouring residues in
the main chain, in a repeating unit with a single monosaccharide side chain.
It is interesting to note the subtle effect that stereochemical or minor chemical
derivatisation has on antigenic character. The stereochemistry of the Me / COOH of the
pyruvic acid affects the antigenic specificity of the antigen, and Jennings et al. 15 have
reported that replacing the N-acetyl groups of sialic acid residues by propionyl groups
enhanced the immune response generated by a group B meningococcal polysaccharide
antigen.
Furthermore polysaccharide antigens show T-cell independence, i.e. only IgM antibodies are
induced in children, and hence pure polysaccharide vaccines are ineffective here.
Combination with an immunological adjuvant 14,16 or antigenic ligand, (e.g. when the
influenza B polysaccharide antigen is attached to the Diphtheria protein antigen) enables

4
T-cell dependant IgG formation along with IgM, and immunological memory is produced in
the paediatric population.
The study of immunological reactivities has confirmed that surface polysaccharide
moieties are the serological determinants of bacteria, and polysaccharide antigens can be
used to form ligand(s) which discriminate between similar receptor sites.
1.c.(i). Anatomy and Physiology of the Gram negative bacteria
Trimers of porin protein
T 8nm
+ Broun lipoprotein
Protein catalyzing specific, facilitated diffusion ---__
Peptidoolycon (murein)
FIGURE 1. The Gram negative cell wall
Phospholipid

5
r --I
'1/ 1/ " "" IIJJJ" II 1/ "" "JJJ,I
111111111111111111111111111111111111 111111111111"""" 11111111 "" 1111
capsule
Lipopolysaccharide
Outer membrane
Lipoprotein
Peptidoglycan
Cytoplasmic (Inner) membrane
FIGURE 2. Cross-section of the gram-negative cell envelope
The gram negative cell wall content, (Figure 1. and Figure 2.) is approximately 60%
of that of the gram positive wa1l 17 . It also consists of 10-22% lipid and an outer membrane
conferring improved resistance, as seen in gram negative infections, to attack by
macrocytes, enzymes, antibiotics etc.
The membrane excludes large molecules and contains protein channels called porins
which regulate the entry of small molecules into the cell. Brauns lipoprotein attaches the
membrane to the cell wall and the antigenic determinants are expressed outwardly from this
membrane. Essentially three kinds of antigenic determinants are expressed by Klebsiella
bacteria, viz. lipopolysaccharide R or O-antigen, extracelluar polysaccharide K-antigen, and
M-antigen (bacterial slime). Bacteria can be defined by more than one O-antigen and
interestingly the O-antigens may exibit antigenic drift18, i.e. the O-antigen serotyping of a
bacterium may change over time especially during chronic infection so as to evade the host
antibody response. Figure 1. depicts O-antigen protruding from the outer membrane.
Should this membrane rupture, O-antigen is released and upon hydrolysis the extremely
toxic endotoxin is released.
Other antigens generally found are the M-antigen, and the proteinaceous H-antigen in
motile bacteria. M-antigen is loosely attached to the capsule, serving as an adhesive agent
and is formed in copious amounts under certain conditions.

6
Capsular K-antigen covers the surface of the outer membrane and occludes the
oligosaccharide O-antigen determinants. The capsule 18 composition has been shown to be
important for the degree of virulence of a bacterium, acapsular bacteria of the same species
being much less pathogenic. A relationship between the quantity of capsule in some
Klebsiella species and the species virulence, resistance to host phagocytosis or host
defences, has been postulated. In the E.co!i species it has been suggested that the quantity
of capsule determines whether the bacterium will resist the bactericidal effect of serum
complement or not. Again other studies believe the qualitative 19 and not the quantitative
nature of the capsule to be more important. The general functions of the capsule can be
summarized as:
1) protection against bacterial desiccation (hygroscopic nature of the polysaccharide)
2) possibly blocking the attachment of bacterial phages
3) conferring virulence to the bacterium (antiphagocytic ability)
4) promotion of attachment of its bacterium to hosts
5) conferring stability on the bacterial suspension by virtue of an anti-aggregatory effect
induced by the anionic nature of the uronic acid content.
1. (c).ii. The bacteriology of Klebsiella bacteria
The genus Kiebsiella20 is a member of the Enterobacteriaceae family and are
facultative, anaerobic gram negative rods which can withstand aerobic conditions. They
ferment lactose, are non-motile and if encapsulated tend to produce much K-antigen.
M-antigen may be exuded under conditions of higher salt concentration and decreased
temperature in liquid culture.
78 K-antigens and 12 O-antigens define the whole species, Klebsiella bacteria are
normally saprophytes but in healthy persons are found as commensal hosts of the gastro
intestinal tract. Pathogenically K.pneumonia K121 and K222 cause lobar pneumonia23 and
the condition of haemorrhagic necrotizing consolidation of the lung. Types K824, 9 25, 1026,

7
2427 are implicated in urinary tract infections and chronic hospital infections are often
caused by Klebsiella species.
1.d. Chemistry and Serology of the Klebsiella antigens
The O-Antigen.
~----------------
Lipid A Core o side chain
FIGURE 3. The O-Antigen
The O-antigen' 8,28,29 (Figure 3). is a lipopolysaccharide moiety composed of three
covalently bound subunits. Figures 4 and 5 show the antigen in greater detail.
OH ~N
~o OH
Lipid A
I p
Core
FIGURE 4. Greater Detail of the O-Antigen
o side chain

8
GIcNAc O·Gal P·P·Etn P-Etn
J' !' P I I I I • 2 , 2 , 3 6, 3 I , 3 4 , 5 , 7/81 r.=-:l o side chain-O-Glc-O-Gal- O.GIC-Lo·T7
ep-LO.Hep _KOO ~KOO-~
:, (LD-Hep)
KOO = Keto-deoxy-octulonate Hep = L-Glycero-O-mannoheptose HM = p·Hydroxymyristic acid (C I4 )
FA = Other fatty acids Eth'N = Ethanolamine Glu = Glucose GlcNAc = N-acetylglucosamine Gal = Galactose
FIGURE 5. An example of an O-Antigen Core Region
The O-antigen consists of the O-specific side chain which is linked to a core region,
which, in turn, is linked via its KDO, (3-deoxy-D-manno-octulosonic acid) residue to the
glucosamine residue of Lipid A. The core region has been found to be generally similar in
structure amongst many bacteria 18, i.e. a complex oligosaccharide of, L-glycero-D-
mannoheptose along with phosphate containing groups, e.g. O-phosphorylethanolamine and
O-pyrophosphorylethanolamine.
The O-side chain carries the immunological specificity of the antigen and the variety
of oligosaccharide combinations is vast. Klebsiella have twelve known O-antigen structures.
The repeating unit is built of rare and common monosaccharides and is found to exist in
multiples of one to more than thirty repeating units. In 1970 Nimmich30 characterised the
12 Klebsiella O-antigen serotypes chemically and alluded to the possibility that some were
chemically similar. Since then O-antigen types 1, 2, 6 and 11 have been deleted because of
their similarity to others.
9
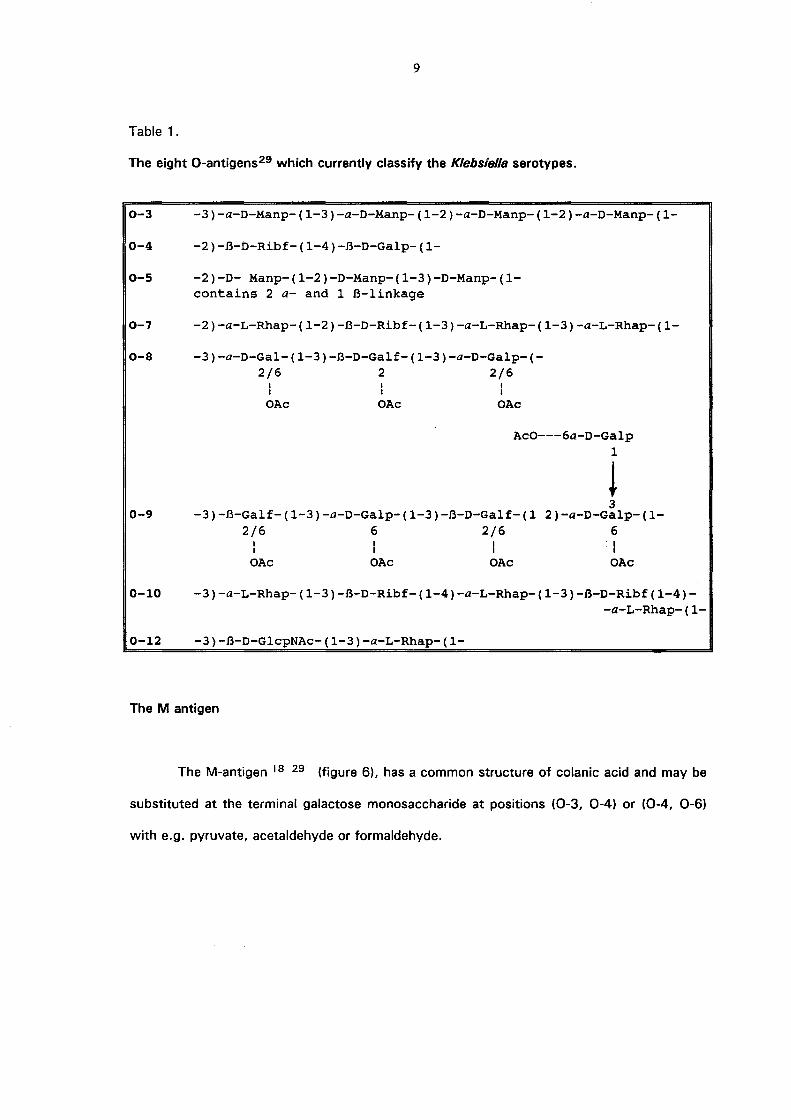
Table 1.
The eight 0-antigens29 which currently classify the Klebsiella serotypes.
0-3 -3)-a-D-Manp-(1-3)-a-D-Manp-(1-2)-a-D-Manp-(1-2)-a-D-Manp-(l-
0-4 -2)-B-D-Ribf-(1-4)-B-D-Galp-(1-
0-5 -2)-D- Manp-(1-2)-D-Manp-(1-3)-D-Manp-(1-contains 2 a- and 1 B-linkage
0-7 -2)-a-L-Rhap-(1-2)-B-D-Ribf-(1-3)-a-L-Rhap-(1-3)-a-L-Rhap-(l-
0-8 -3)-a-D-Gal-(1-3)-B-D-Galf-(1-3)-a-D-Galp-(-2/6 2 2/6
I I I I
OAe OAe
I I
OAe
AeO---6a-D-Galp 1
! 3
0-9 -3)-B-Galf-(1-3)-a-D-Galp-(1-3)-B-D-Galf-(1 2)-a-D-Galp-(1-2/6 6 2/6 6
I I I I I I I I
OAe OAe OAe OAe
0-10 -3)-a-L-Rhap-(1-3)-B-D-Ribf-(1-4)-a-L-Rhap-(1-3)-B-D-Ribf(1-4)--a-L-Rhap-(l-
0-12 -3)-B-D-GlepNAe-(1-3)-a-L-Rhap-(1-
The M antigen
The M-antigen 18 29 (figure 6), has a common structure of colanic acid and may be
substituted at the terminal galactose monosaccharide at positions (0-3, 0-4) or (0-4, 0-6)
with e.g. pyruvate, acetaldehyde or formaldehyde.

10
-4)_a-L-Fucp-(1-3)-B-D-Glcp-(1-3)-B-L-Fucp-(1-4 t 1
B-D-Galp-(1-4)-B-D-GlcAp-(1-3)-B-D-Galp X X =(0-3, 0-4) or (0-4, 0-6) pyruvate, acetaldehyde or
formaldehyde linkage positions as above.
FIGURE 6.
The Klebsiella K-antigen
The K-antigen 18,29 is a polysaccharide composed of oligosaccharide repeating units
and all the Klebsiella K-antigens are acidic. The acidic groups are usually uronic acids such
as galacturonic or glucuronic acid. However, in some cases the acidity is due solely to
pyruvic acid, e.g. K5631 , K7232 and K3233. Some unusual acidic sugars have also been
found and these include 4-0-lactyl-glucuronic acid (K2234), 4-Q-lactyl-glucose (K6635) and
3-deoxy-L-glycero-pentulosonic acid (K3836).
In 1968 Nimmich37 chemotyped the 72 serologically defined Klebsiella bacteria, (at
that time only 72 types had been defined). The monosaccharide components were found to
be of three chemical types, viz. acidic monosaccharide (uronic acid), neutral monosaccharide
(hexoses) and neutral monosaccharide (6-deoxyhexose). In particular, the K6038
monosaccharide content, as published by Nimmich, has been refuted and contains galactose
and not fucose.
To date eighty-three' Klebsiella K-antigens have been serologically defined, although
strains39 K73;75;76;77;78, have been deleted because of their close relationship to other
known Klebsiella serotypes. Seventy-eight Klebsiella K-antigens are serologically detailed to
date and Table 2. allows comparison by chemotype of a current listing of the 75 chemically
elucidated structures. Over the past 30 years improved techniques, e.g. selective
polysaccharide depolymerisation and the advent of high resolution NMR and highly sensitive
MS instrumentation, have necessitated that certain published chemical structures be revised.
11
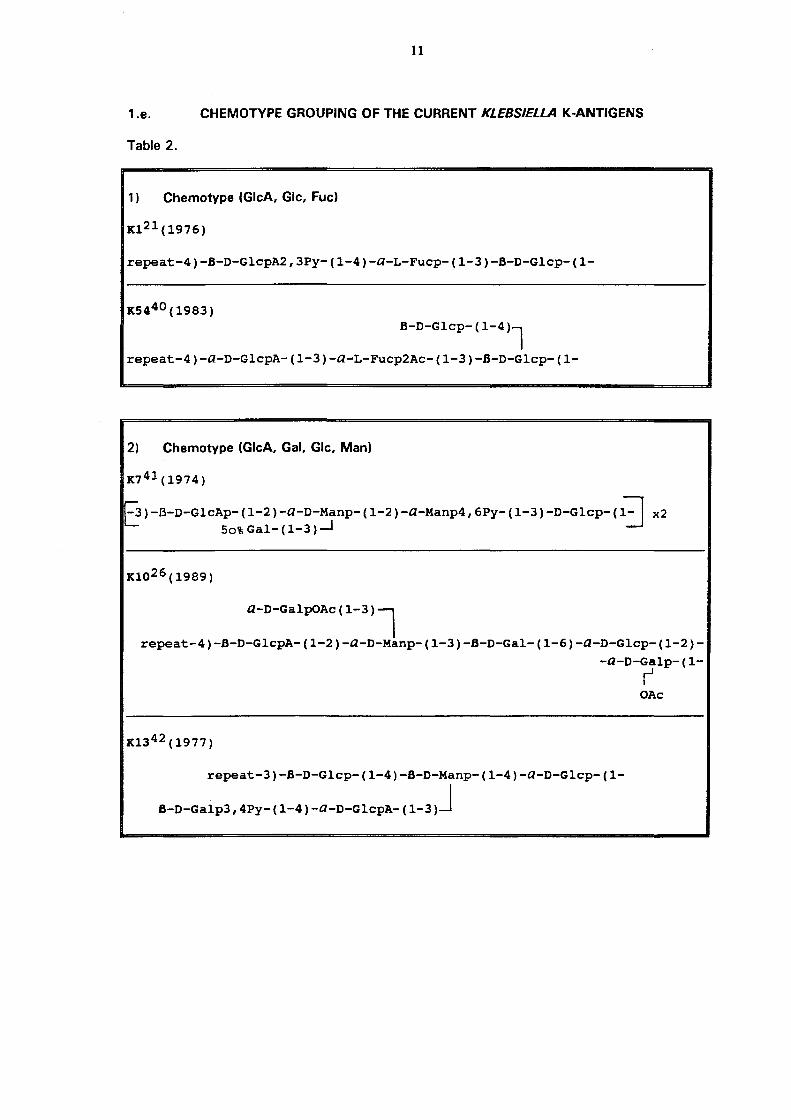
1.e. CHEMOTYPE GROUPING OF THE CURRENT KLEBSIELLA K-ANTIGENS
Table 2.
1) Chemotype (GleA, Gle, Fue)
1C121 (1976)
repeat-4)-B-D-GlepA2,3Py-(1-4)-Q-L-Fuep-(1-3)-B-D-Glep-(1-
1C5440(1983) B-D-Glep -(1-4)l
repeat-4)-Q-D-GlepA-(1-3)-Q-L-Fuep2Ae-(1-3)-B-D-Glep-(1-
2) Chemotype (GleA, Gal, Gle, Man)
1C7 41 (1974)
~3)-B-D-GleAp-(1-2)-Q-D-Manp-(1-2)-Q-Manp4,6PY-(1-3)-D-Glep-(;=l x2 I'- 50% Gal- (1-3)....J L.:J
Q-D-GalpOAe(1-3)~
repeat-4)-B-D-GlepA-(1-2)-Q-D-Manp-(1-3)-B-D-Gal-(1-6)-Q-D-Glep-(1-2)-
-Q-D-Galp-(l,-J
repeat-3)-B-D-Glep-(1-4)-B-D-Manp-(1-4)-Q-D-Glep-(1-
B-D-GalP3'4pY-(1-4)-Q-D-GlePA-(1-3)~
I
OAe

12
B-O-GalP4,6PY-(1-4)-B-O-G1CP-(1-6)-a-O-G1CP-(1-4)l
repeat-3)-B-O-Galp-(1-2)-a-O-GlcpA-(1-3)-a-O-Manp
-(1-2)-a-O-Manp-(1-
-2)-a-O-Galp-(1-3)-a-O-Manp-(1-2)-a-O-Manp-(1-3)-B-O-Glcp-(l
B-O-G1CPA-(1-2)~ B-O-G1CP-(1-3)J
a-O-GlcPA-(1-3)1
repeat-4)-B-O-Glcp-(1-4)-B-O-Manp-(1-4)-B-O-Manp-(1-
B-O-GalP3,4PY-(1-6)J
B-O-G1CP4,6PY-(1-2)-a-O-Manp-(1-4)l
repeat-3)-B-O-Glcp-(1-3)-a-O-GlcpA-(1-3)-B-O-Galp-(1-
K33 47 (1979)
B-O-GalP3,4pY-(1-6~
repeat-4)-B-O-Glcp-(1-4)-B-O-Manp-(1-4)-B-O-Manp6Ac-(1-
a-O-G1CPA-(1-3)J
repeat-3)-a-O-Galp4,6Py-(1-3)-a-O-Manp-(1-3)-a-O-Manp-(1-3)-B-O-Glcp-{1-
S-O-G1CPA-(1-2)J

13
repeat-3)-a-D-Galp-(1-3)-B-D-Galp-(1-3)-a-D-GlcpA-(1-3)-a-D-Manp-(l
B-D-GlCP-(1-3)-B-D-Manp4,6PY-(1-4)J
B-D-GalP-(1-6)-a-D-GlCP-(1-6)~
repeat-3)-B-D-Galp-(1-3)-a-D-Glcp-(1-4)-a-D-GlcpA-(1-3)-a-D-Manp-(1-2)
-a-D-Manp-(l-
B-D-GlCPA-(1-4)1
repeat-3)-B-D-Glcp-(1-3)-B-D-Galp-(1-2)-a-D-Manp6AC-(1-3)-a-D-Manp6Ac-
* -(1-
(only some 6 acetylation) *
K6038 (1980)
repeat-3)-B-D-Glcp-(1-3)-B-D-GlcpA-(1-3)-a-D-Galp-(1-3)-a-D-Manp-(l
a-D-Glcp- (1-4)J B-D-Glcp- (1-2)J B-D-Glcp- (1-2)J
a-D-Galp- (1-3 )1 repeat-4)-B-D-GlcpA-(1-2)-a-D-Manp-(1-3)-B-D-Glcp-(1-6)-a-D-Glcp-(l-
a-D-Manp-(1-3)~
repeat-4)-a-D-Glcp-(1-2)-B-D-GlcpA-(1-2)-a-D-Manp-(1-3)-B-D-Galp-(l-

14
repeat-3) -Q-D-Manp( 1-3) -Q-D-Galp-( 1-2) -Q-D-'GlcpA- (1-3) -Q-D-Manp- (1-
L( 3-1) -B-D-Glcp
L40LaC Lac = Lactyl group, i.e. 4-0-Lactyl glucose
[R]
B-D-GalP4,6PY-(1-6)l
repeat-4)-B-D-Glcp-(1-4)-B-D~Manp-(1-4)-B-D-Manp-(1-
a-D-GlCPA-(1-3)J (6-0Ac) 33.3%
3) Chemotype <:G1cA, Glc, Man, Puc)
repeat-3)-Q-L-Pucp-(1-3)-B-D-Glcp-(1-3)-B-D-Manp4,6Py-(1-4)-Q-D-GlcpA-(1-
4) Chemotype (GlcA. Gal, G1c)
B-D-GlCPA-(1-4)1
repeat-3)-B-D-Glcp-(1-3)-B-D-Galp-(1-3)-Q-D-Glcp-(1-
L(2-1)-GalP
Q-D-GalP4,6PY-(1-4)1
repeat-3)-B-D-Glcp-(1-3)-B-D-GlcpA-(1-3)-Q-D-Galp-(1-

15
It1S 57 (1992)
B-D-G1CP (1-6)l
repeat-4)~B-D-Galp-(1-3)-a-D-Galp-(1-6)-B-D-Galp-(1-3)-B-D-Galp-(l
B-D-G1CPA-(1-3)~
1(2234 (1988)
B-D-G1CPA4(S)Lt-(1-6)-a-D-G1CP-(1-4)l
repeat-3)-B-D-Galp-(1-4)-B-D-Glcp-(1-
L (6)Oac
Lt = 4-0-[(S)-1-carboxyethyl]
B-D-G1CPA-(1-6)~
repeat-3)-B-D-Glcp4,6Py-(1-3)-?-D-Galp-(1-3)-?-D-Galp-(1-6)-B-D-Glcp-(1-
. B-D-G1CP-(1-4)~
1(37 59 (1977)
B-D-G1CPA4Lt-(1-6)-a-D-G1CP-(1-4)~
repeat-3)-B-D-Galp-(1-4)-B-D-Glcp-(1-
Lt = 4-0-[(S)-1-carboxyethyl]
a-D-GlcpA- (1-6) -a-D-Glcp- (1-4
1 repeat-3)-a-D-Galp-(1-3)-a-D-Galp-(1-
B-D-G1CP-(1-2)--,
B-D-G1CPA-(1-4)~
repeat-3)-B-D-Galp-(1-4)-B-D-Galcp-(1-

16
5) Chemotype (GlcA, Gal, Rha)
B-D-GICPA-(1-4)1
repeat-3)-Q-D-Galp-(1-3)-Q-L-Rhap-(1-3)-Q-L-Rhap-(1-2)-Q-L-Rhap-(1-
repeat-3)-B-D-Galp-(1-4)-Q-L-Rhap-(1-
Q-L-Rhap-(1-4)-B-D-GICPA-(1-3)J
K52 62 (1973)
repeat-3-?-D-Galp-(1-2)-?-L-Rhap-(1-4)-?-D-GlcpA-(1-3)-?-D-Galp-(1-4)-L-~-_____ -.JI -Rhap- (1-
li2-1)-?-D-GalP.
repeat-2)-Q-L-Rhap-(1-3)-Q-L-Rhap-(1-4)-B-D-GlcAp-(1-2)-Q-L-Rhap-(1-3)
-Q-L-Rhap-(1-3)-B-D-Galp(1-
repeat-3)-B-D-Gal-(1-4)-Q-L-Rhap-(1-
Q-D-GlcpA- (1-3) -Q-D-Galp- (1-3)J
6) Chemotype (GlcA, Gal, Glc, Rba)
repeat-3)-Q-D-Galp-(1-2)-B-D-Galf-(1-6)-Q-D-Glcp-(1-3)-Q-L-Rhap-(1-
B-D-Galp4, 6Py- (1-4) -B-D-GlCPA-(~-3,J
repeat-3)-Q-L-Rhap-(1-3)-B-D-Galp-(1-4)-Q-D-Glcp-(1-
Q-D-GICP-(1-4)-B-D-GICPA-(1-2)-Q-L-Rhap-(1-3)~

17
K19 67 (1986)
Rhap-(1-4)1
repeat-2)-Q-L-Rhap-(1-2)-Q-D-Glcp-(1-3)-B-D-Galp-(1-3)-Q-D-GlcpA-(1-2)-Q-L-Rhap-(l-
B-D-GICP4,6PY-(1-4)-B-D-GICPA-(1-2)~
repeat-3)-B-D-Galp-(1-3)-Q-L-Rhap-(1-3)-Q-L-Rhap-(1-2)-Q-L-Rhap-(1-
K41 69 (1978)
. B-D-GICP-(1-6)-Q-D-GICP-(1-4)-B-D-GICPA-(1-3)~
repeat-6)-Q-D-Glcp-(1-3)-Q-L-Rhap-(1-3)-Q-D-Galp-(1-2)-B-D-Galf-(l-
,2-0AC
repeat-3)-B-D-Glcp-(1-4)-Q-L-Rhap-(1-
Q-D-GICPA-(1-3)-Q-D-GalP-(1-3~
repeat-4)-B-D-GlcpA-(1-4)-Q-L-Rhap-(1-2)-Q-L-Rhap-(1-2)-Q-D-Glcp-(1-3)-B-D-Galp-(1-2)-Q-L-Rhap3,4Py-(1-
repeat-3)-B-D-Galp-(1-3)-B-D-GlcpA~(1-2)-Q-L-Rhap-(1-3 )-Q-L-Rhap-(l-
l -3) -Q-L-Rhap- (1-
(4-1)-Q-D-Glcp
L-(6-1)-Q-D-GICP
18
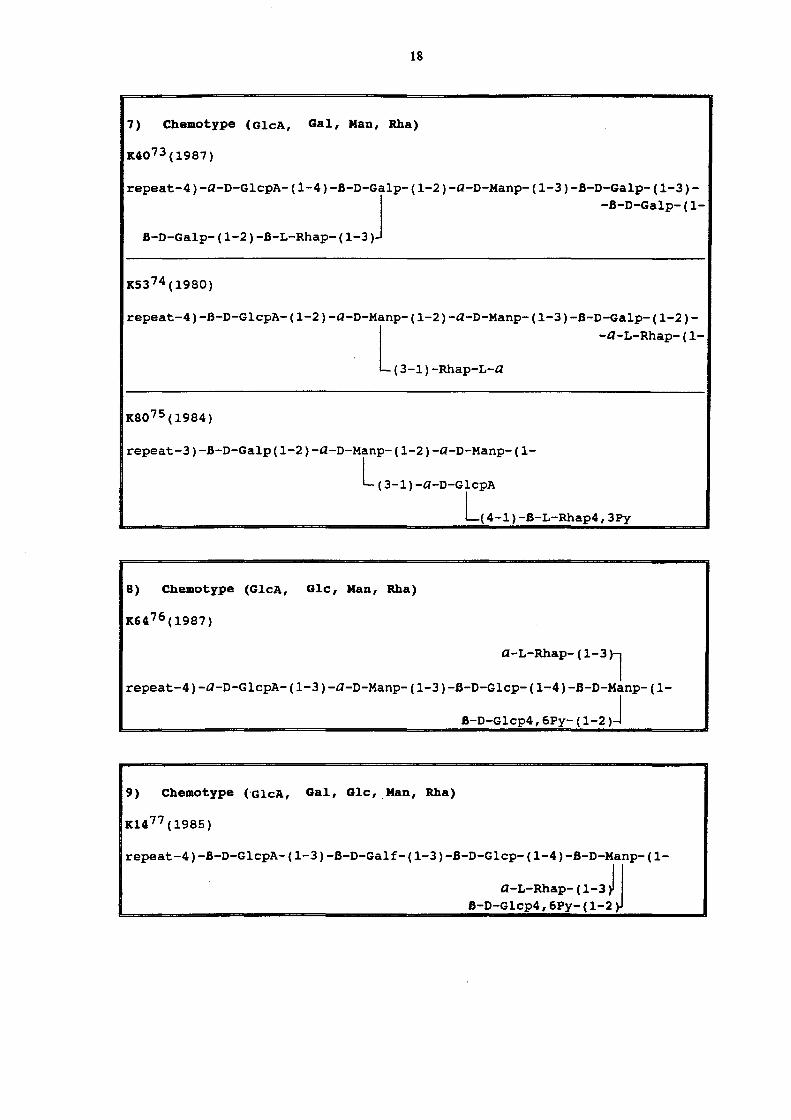
7) Chemotype (GleA, Gal, Man, Rha)
repeat-4)-Q-D-GlepA-(i-4)-8-D-Galp-(1-2)-Q-D-Manp-(1-3)-8-D-Galp-(1-3)-
J -8-D-Galp-(1-
8-D-Galp-(1-2)-8-L-Rhap-(1-3)
repeat-4)-8-D-GlepA-(1-2)-Q-D-Manp-(1-2)-Q-D-Manp-(1-3)-8-D-Galp-(1-2)-
l -a-L-Rhap-(l-
(3-1)-Rhap-L-Q
repeat-3)-8-D-Galp(1-2)-Q-D-Manp-(1-2)-Q-D-Manp-(1-
~(3-1)-Q-D-GlCPA ~(4-1)-8-L-Rhap4'3PY
8) Chemotype (GleA, Gle, Man, Rha)
Q-L-Rhap- (1-3)l
repeat-4)-Q-D-GlcpA-(1-3)-a-D-Manp-(1-3)-8-D-Glcp-(1-4)-8-D-Manp-(1-
8-D-GlCP4,6PY-(1-2)J
9) Chemotype (GleA, Gal, Gle,Man, Rha)
K1477 (1985)
repeat-4)-8-D-GlcpA-(1-3)-8-D-Galf-(1-3)-8-D-Glcp-(1-4)-8-D-Manp-(1-
a-L-Rhap-(1-3JJ 8-D-Glcp4,6Py-(1-2

19
K67 78 (1983)
repeat-3)-a-L-Rhap-(1-3)-a-D-Manp-(1-3)-a-D-Manp-(1-3)-B-D-Gle-(l
B-D-GalP-(1-3)-B-D-GleA-(1-2)~ ~(4-1)-a-L-Rhap
10) Chemotype (GleA, Gal, Gle, Pue)
B-D-GalP-(1-4)~
repeat-3)-a-D-Glcp-(1-4)-B-D-GlcpA-(1-4)-a-L-Fucp-(1-
repeat-3)-a-D-Glcp-(1-4)-B-D-GlepA2,3Py-(1-4)-a-L-Fuep-(1-
a-D-GalP-(1-3)~
11) Chemotype (GleA, Gle, Rha)
1 x OAe
repeat-4)-B-D-Glcp-(1-2)-a-L-Rhap-(1-4)-a-D-GlcpA-(1-3)-B-L-Rhap-(1-
a-L-Rhap- (1-3)J
K23 82 (1990)
repeat-3)-B-D-GlcpA-(1-3)-a-L-Rhap-(1-
B-D-GlePA-(1-6)-a-D-Glep-(1-2)~
repeat-4)-B-GlepA-(1-2)-a-L-Rhap-(1-3)-a-L-Rhap-B-Glep-(1-4)-a-D-GJle~(1_
64\ (60Ac)
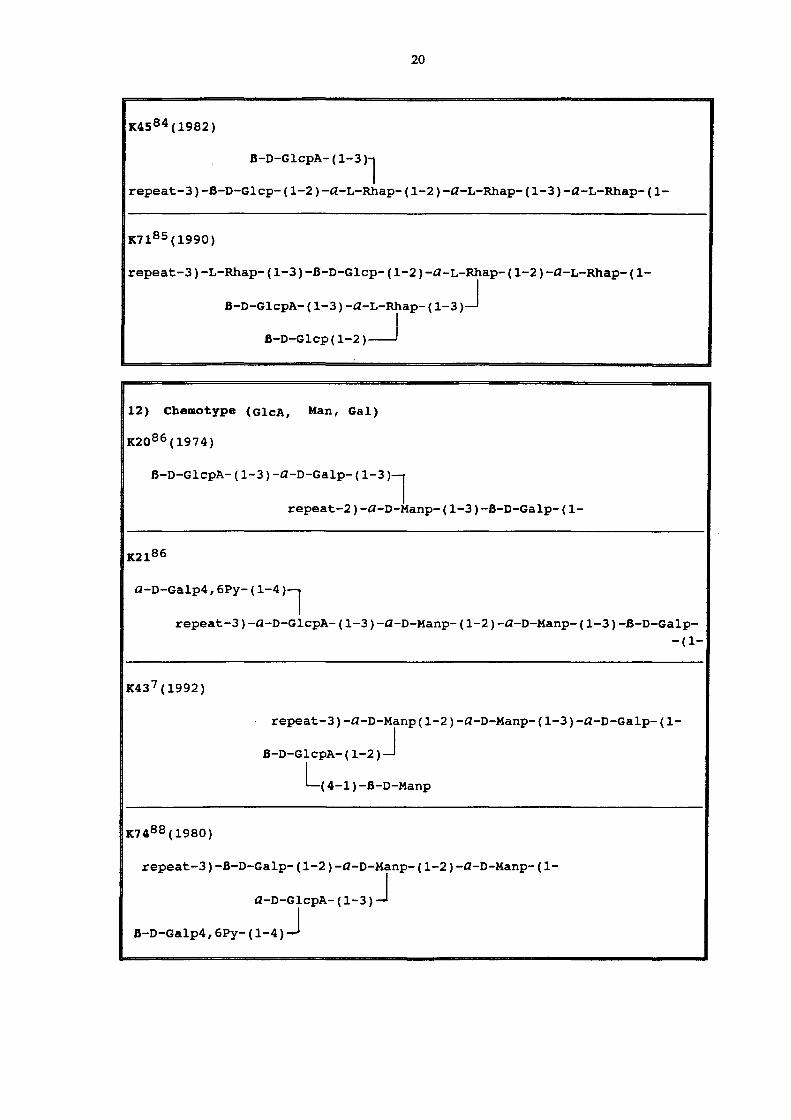
20
8-D-G1CPA-(1-3)1
repeat-3)-8-D-G1cp-(1-2)-Q-L-Rhap-(1-2)-Q-L-Rhap-(1-3)-Q-L-Rhap-(l-
repeat-3)-L-Rhap-(1-3)-8-D-Glcp-(1-2)-Q-L-Rhap-(1-2)-Q-L-Rhap-(l-
8-D-G1CPA-(1-3)-Q-L-Rhap-(1-3)~ 8-D-G1CP(1-2)~
12) Chemotype (GlcA, Man, Gal)
8-D-G1CPA-(1-3)-Q-D-GalP-(1-3)~
repeat-2)-Q-D-Manp-(1-3)-8-D-Galp-(1-
Q-D-GalP4,6PY-(1-4)~
repeat-3)-Q-D-GlcpA-(1-3)-Q-D-Manp-(1-2)-Q-D-Manp-(1-3)-B-D-Galp-(1-
. repeat-3)-Q-D-Manp(1-2)-Q-D-Manp-(1-3)-Q-D-Galp-(1-
8-D-G1CPA-(1-2)~ ~(4-1)-8-D-Manp
repeat-3)-8-D-Galp-(1-2)-Q-D-Manp-(1-2)-Q-D-Manp-(1-
Q-D-G1CPA-(1-3)~ 8-D-GalP4,6PY-(1-4)~

21
13) Chemotype (GlcA, Glc, Man)
repeat-3)-a-D-Glc-(1-4)-B-D-Man-(1-4)-B-D-Glc-(1-
a-D-GICPA-(1-3)~
repeat-3)-a-D-Glcp-(1-2)-a-D-GlcpA-(1-3)-a-D-Manp-(1-3)-8-D-Glcp-(1-
repeat-4)-B-D-GlcpA-(1-4)-B-D-Glcp2Ac-(1-3)-B-D-Manp4,6Py-(1-
repeat-3)-B-D-GlcpA-(1-2)-a-D-Manp-(1-4)-B-D-GlcpA-(1-2)-a-D-Manp-(1-
B-D-Glcp-(1-4) J -3)-8-D-Glcp-(1-
B-D-Manp-(1-4)~
repeat-2)-a-D-GlcpA-(1-3)-a-D-Manp-(1-2)-a-D-Manp-(1-3)-B-D-Glcp-(l-
22
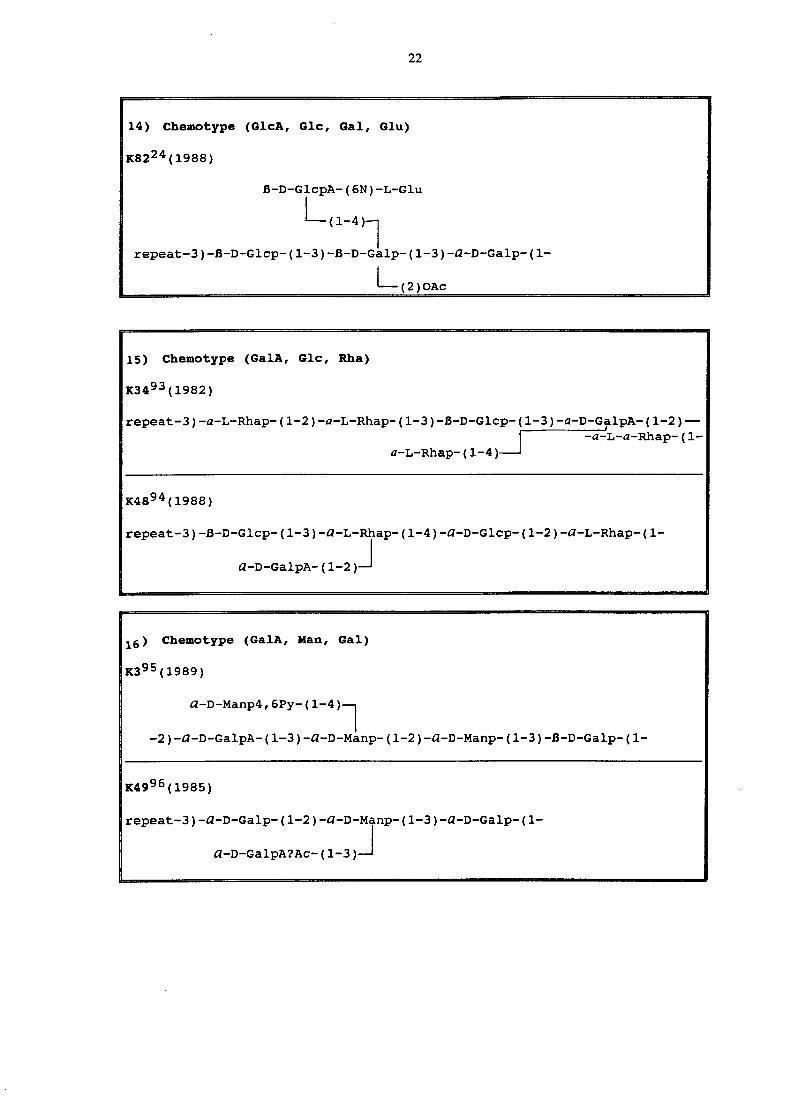
14) Chemotype (GleA, Gle, Gal, Glu)
B-D-GlcpA-(6N)-L-Glu
L(1-4)l repeat-3)-B-D-Glcp-(1-3)-B-D-Galp-(1-3)-Q-D-Galp-(1-
L(2)OAC
1S) Chemotype (GalA, Gle, Rha)
repeat-3)-a-L-Rhap-(1-2)-a-L-Rhap-(1-3)-B-D-Glcp-(1-3)-a-D-GalpA-(1-2)--~ -a-L-a-Rhap-(l-
a-L-Rhap-(1-4)
repeat-3)-B-D-Glcp-(1-3)-Q-L-Rhap-(1-4)-Q-D-Glcp-(1-2)-Q-L-Rhap-(l
Q-D-GalPA-(1-2)~
16) Chemotype (GalA, Man, Gal)
Q-D-Manp4'6PY-(1-4)~
-2)-Q-D-GalpA-(1-3)-Q-D-Manp-(1-2)-Q-D-Manp-(1-3)-B-D-Galp-(l-
repeat-3)-Q-D-Galp-(1-2)-Q-D-Manp-(1-3)-Q-D-Galp-(1-
Q-D-GalPA?AC-(1-3)~

23
K57 97 (1975)
Q-D-Manp-(1-4)~
Q-D-GalpA-(1-2)-Q-D-Manp-(1-
repeat-3)-8-D-GalP-(1-3)~
Q-D-Manp 4,6PY-(1-4)l
Q-D-GalpA-(1-2)-Q-D-Manp-(1-3)-8-D-Galp-(1-
repeat-2 ) J ' 17) Chemotype (GalA, Glc, Fuc)
K63 99 (1979)
repeat-3)-Q-D-Galp-(1-3)-Q-D-GalpA-(1-3)-Q-L-Fucp-(1-
18) Chemotype (Gal, Glc, Rha)
-3)-8-D-Glcp4,6Py-(1-3)-8-D-Glcp-(1-3)-Q-D-Galp-(1-3)-8-D-Galp-(1-
Q-L-Rhap-(1-2)~
19) Chemotype (Gal, Rha)
repeat-3)-Q-D-Galp-(1-2)-Q-L-Rhap3,4Py-(1-3)-8-L-Rhap-(1-4)-Q-L-Rhap
-(1-

24
20) Chemotype (Gal, Glc)
B-D-G1CP-(1-2)~
repeat-6)-B-D-Glcp-(1-3)-B-D-Galp-(1-4)-a-D-Galp-(1-
A-(2-3)
* A 3-deoxy-L-glycero-pentulosonic acid
21) Chemotype (Glc, Rha)
K72 32
-3)-B-D-Glcp(1-3)-a-L-Rhap-(1-2)-a-L-Rhap-(1-3)-a-L-Rhap-(l
* *3,4 pyr

25
2. ISOLATION AND PURIFICATION OF THE KLEBSIELLA K-ANTIGEN
Propagation of Klebsiella bacteria can be carried out in liquid or on solid culture
media and Duguid et al. 100 have reported the influence of culture conditions on
polysaccharide production amongst Klebsiella bacteria. If grown on sucrose-rich nutrient
agar the bacteria flourish and produce copious amounts of capsular polysaccharide. In order
for the results of the structural analysis of the polysaccharide to be reliable, a rigorous
purification procedure must be followed and the final product must be free of contaminating
proteins, lipids, nucleic acids and inorganic salts. Adams 101 has described the extraction of
cellular carbohydrate constituents. When separating and purifying polysaccharides it is
useful to have some knowledge of the character of the polysaccharide under investigation,
e.g. solubility, stability to acid and base, heat lability, and stability of labile substituents.
On extracting the capsular polysaccharide from Klebsiella bacteria it is preferable to
prevent cell lysis as this leads to greater ease of purification. Cells are killed 101 and the
capsular polysaccharide is solubilised by stirring the suspension in 1 % aqueous phenol. The
cells are removed by ultracentrifugation and the supernatant is freeze-dried to yield crude
capsular polysaccharide. Some lipopolysaccharide (O-antigen) is also extracted at this time.
However, because this polysaccharide is neutral, the separation of K-antigen from O-antigen
is simple. The acidic K-antigen is precipitated by adding a quaternary ammonium salt such
as cetyltrimethylammonium bromide 101.102 (CT AB), which reacts with the acidic functions
on the polysaccharide. Neutral O-antigen remains in the supernatant. Should the solution
be contaminated with nucleic acids 101, increasing the CTAB concentration slowly to 0.3 M
precipitates nucleic acid whilst the acidic K-antigen is still in solution. Careful control of the
addition of the CT AB solution allows the different fractions present in solution to be
separated. The methodology of antigen extraction in the present study is similar to that
used by Okutani et al. 103 and enables the separation of milligram to gram quantities of acidic
polysaccharide. Other techniques used on a smaller scale are a variety of chromatographic
techniques, (chapter 4), e.g. ion-exchange chromatography on DEAE columns by means of
gradient-elution with buffer of increasing strength, affinity chromatography, electrophoresis

26
and size exclusion chromatography (SEC). In this laboratory SEC is mainly used to ascertain
purity and separate contaminants from capsular polysaccharides.
3. PROCEDURES USED IN THE CHEMICAL ElUCIDATION OF BACTERIAL
EXOPOl YSACCHARIDES
3.0. Primary analysis
Bacterial polysaccharides are complex polymers composed of oligosaccharide
repeating units. This phenomenon along with relatively high yields of bacterial
polysaccharide (mg or » permit the use of a variety of chemical and instrumental methods
for structural elucidation. Certain biological techniques are also useful in depolymerising the
polysaccharide. In this section the more common techniques in current use, and all
techniques used in the elucidation of the structure of the Klebsiella K437 antigen will be
discussed.
3.0.(i). Monosaccharide composition
When determining the sugar ratio of a bacterial polysaccharide the monosaccharide
yield must be optimised and careful choice of reaction conditions, viz. the choice of reaction
type, concentration of reactants, temperature and length of time of reaction are vitally
important. Cleavage of the glycosidic linkages is associated with a degree of
monosaccharide degradation and this must be kept to a minimum if an accurate sugar ratio
is to be found.
Principally four reaction types may be used to determine the sugar ratio:
hydrolysis 104,105 (with mineral or organic acid!. methanolysis 1 05 (with anhydrous
methanolic hydrogen chloride), acetolysis 105 (with acetic anhydride and acetic acid), and
formolysis 105 (with formic acid).

27
Polysaccharides soluble in organic solvents e.g. methylated polysaccharide, may be
subjected to acetolysis or formolysis and the water soluble products hydrolysed to their
monosaccharide residues should the polymer resist hydrolysis initially. Uronic acids resist
hydrolytic conditions used and polysaccharides containing uronic acids are initially
methanolysed105 . The methyl ester of the uronic acid is formed, and this is accompanied by
a degree of polysaccharide depolymerisation. After reduction of the methyl ester of the
uronic acid the parent monosaccharide is easily hydrolysed and subjected to analysis.
Methanolysis27 is generally carried out with 3% anhydrous methanolic hydrogen chloride
solution at 80° C for 16 hours. Cheetham et al. 106 have published results of the degree of
degradation of ten monosaccharide methylglycosides in a 1 M HCI IMeOH system at BOoC
for 24 hours and Fournet et al. 107 have used O.5M MeOH/HCI for 24 hours at 80° to
analyse methylated glycosaminoglycans. This method allowed them to analyse neutral and
amino sugars simultaneously as the methylated methylglycosides.
Hydrolysis 105 is routinely used to cleave bacterial polysaccharide glycosidic linkages
and takes place in aqueous solution under the control of a proton donor viz. the acid. Acids
used include sulphuric, hydrochloric and trifluoro-acetic acid (TFA), while the use of oxalic
acid has also been reported. Adams '08 has discussed the acid lability of different
monosaccharide forms and this information is useful when designing a hydrolytic
experiment, see Table 3.

28
Table 3.
More acid labile Less acid labile
Ketose sugars Aldose sugars
Furanose cyclic forms Pyranose cyclic forms
a-anomeric configuration f!,-anomeric configuration
Pentoses Hexoses
Deoxysugars
Pyruvate, acetate groups etc.
Uronic acid sugars
Hough 109 (1972) surveyed different acidic conditions used in polymer hydrolysis.
Practically sulphuric acid is difficult to remove after hydrolysis and hydrochloric acid should
be used under nitrogen to decrease the possibility of oxygen-induced monosaccharide
decomposition. Trifluoro-acetic acid27 (TFA) has become popular as it is easily removed
under reduced pressure because of its volatility and is used at a strength of 2 M. Neeser et
al. 110 have used 4 M TFA at 125°C for 1 hour, and all hydrolytic reactions performed in the
study of Klebsiella K437 were conducted under these conditions.
The hydrolysate may be analysed directly, e.g. by HPLC of the products. A range of
Quantitative colorimetric methods'" for the determination of monosaccharides are available,
but do not discriminate between sugars of the same class and may give erroneous results
depending on the products in solution. They rely on the formation of chromogens of the
hydrolysate after reaction with specific reagents.
Aspinall"2 has described chemical methods for the analysis of pyruvate and other
covalently bound non-carbohydrate groups, sensitive to hydrolytic conditions. Today native
underivatised material may be directly studied by 1H- and '3C-NMR methods which are
faster and non-destructive allowing labile groups to be preserved.
29
3.0.(ii). Molecular size determination
Polysaccharide molecular weight determinations are estimates of a repeating unit
structure and are measured by one or more of the following techniques 113: primary (direct
determination), viz. Mn - number average or Mw - molecular weight average; Secondary
technique, viz. Mr - relative molecular weight. The relative molecular weight is a secondary
technique because it relates the polysaccharide weight to a known molecular weight
polysaccharide and is quick and easily carried out on a calibrated gel permeation
chromatographic column.
Primary techniques rely on a range of physico-chemical techniques 114 and the
approximate weight of the polysaccharide dictates which method will be most
appropriate,e.g. osmometric determination is applied to polymers which fall between 15 000
to 15 000 000 daltons, as smaller molecules diffuse through the membrane involved in this
method. Isothermal distillation determines number averages between 1 000 to 20 000
daltons. The use of chemical techniques to determine the reducing end of a polysaccharide,
e.g. periodate oxidation and 14C labelled cyanide allows calculation of the number average
on the premise that each polysaccharide sequence contains one reducing end. Other
techniques available are ultracentrifugation 115 which is laborious, and computation of the
degree of polymerisation by quantitative colorimetric analysis of periodate oxidised
polysaccharide.
Greenwood115.117 has evaluated inherent problems in methodology and
interpretation of molecular weight determinations. Comparing Mn to Mw indicates the
degree of molecular weight distribution within a system and if a polydisperse system is
present the results will not be in close agreement.
30
3.0.(iii). Absolute configurational analysis of the monosaccharides
Monosaccharides found naturally may be either of the D or l absolute configuration
e.g. glucose, mannose etc, are usually of the D configuration whilst rhamnose is usually l,
but exceptions do occur and monosaccharide absolute configuration must be established for
complete description of a bacterial polysaccharide.
Methods of determining the absolute configuration of a monosaccharide are:
polarimetry 118, circular dichromism, enzyme catalysis and chromatographic separation of
derived diastereomers.
The use of circular dichromism in measuring the derived monosaccharide alditol
acetate derivatives, for the determination of absolute configuration was reported by Bebault
et al. 119 , and was conducted on milligram quantities of hydrolysed Klebsiella serotypes K7
and K21.
Enzymatic determination relies on the substrate specificity of the enzyme, e.g. D
glucose specific oxidase if shown to degrade the monosaccharide confirms that the
monosaccharide was D glucose. Unfortunately these biological products apart from causing
degradation, are difficult to acquire and are not available for the array of sugars found in
bacterial polysaccharides.
Gas liquid chromatographic analysis is a popular technique for determining absolute
configuration on sub-milligram quantities of the polysaccharide which is hydrolysed prior to
glycosylation with a chiral reagent. The enantiomers released by hydrolysis are not
distinguishable directly using conventional GLC columns and are converted to
diastereomeric 120 glycosides which are separated by chromatography of their acetates.
KOnig et al. 121 have however succeeded in determining the absolute configuration of the
hydrolysed monosaccharides from a polysaccharide by GLC analysis on a chiral phase, and
their report describes chiral phases suitable for analysis of a variety of volatile derivatives.
The choice of asymmetric glycosylating agent will affect the resolution of the
chromatographed peaks. Monosaccharide glycosylation with a chiral alcohol usually
produces overlapping peaks owing to the different forms of each glycosylated
31
monosaccharide, e.g. a-and B-anomers of each of the pyranose and furanose forms. A
commonly used chiral alcohol is (-)-2-octanoI 122. Comparison of a chromatogram of a
standard glycosylated monosaccharide easily confirms the D or L configuration from the
complicated chromatogram of the unknown monosaccharide.
Oshima et al. 120 have used L-(-)-methylbenzylamine to produce acyclic
diastereoisomers. Multiple pyranose and furanose forms are avoided and enhanced product
separation is found. An aromatic group is introduced via reductive ami nation and if HPLC
chromatography is used, the eluting components can be detected at 230nm by a uv
detector. Another report has shown that separation of enantiomeric sugars as diasteriomeric
trifluoroacetylated-(-)-bornyloximes 123 produces two GLC peaks which simplify the
interpretation of the absolute configuration data.
3.1. Determination of monosaccharide linkage positions
Establishing the linkage pattern of a bacterial polysaccharide involves determining the
monosaccharide linkage position(s) and the relative configuration of these linkages.
Methylation analysis in tandem with one or more complementary chemical technique is
necessary to describe the chemical repeating unit.
3.1.(i). Methylation analysis
Methylation has been widely used to determine monosaccharide glycosidic linkages
but does not prove the sequence of these linkages.
The methylation 124 reaction assumes that all non-glycosidic hydroxyl groups are
converted to methyl ethers via an alkoxide anion, formed by the action of a strong base on
the cyclic monosaccharide, and that this methylation product does not undergo de
etherification on hydrolysis. The resulting free hydroxyl groups indicate the linkage positions
and these positions can be determined by GLC-MS of their acetylated derivatives.
Limitations of this technique are that the order of the monosaccharide linkages is not

32
defined, i.e. only the positions of the glycosidic linkages are found, the relative anomeric
configuration is not determined, and sugars not methylated at C4 or C5 can give ambiguous
ring size information.
During the period 1915-1992 a variety of solvent systems, bases and alkylating
agents have been introduced, each having its own advantages under different
circumstances. Overcoming solubility problems, incomplete methylation, excessive
degradation or by-product formation, and the length of time for the manipulation has been
the driving motivation in finding new techniques.
Methylation is carried out on milligram Quantities of material and the complete
methylation 125 of 1pg of a disaccharide and 5pg of an acidic polysaccharide has been
reported. Other practical difficulties are the possible loss of highly volatile polymethylated
monosaccharides during work up procedure. Non-carbohydrate substituents 126 e.g.
a-acetyl groups are cleaved by the strong base used, but N-acetyl groups are stable.
Haworth 127 achieved methylation with a 25-30% aqueous sodium hydroxide
solution in which the polymer was treated with dimethyl sulphate, but complete methylation
was seldom achieved in a single reaction and Purdie developed a technique which involved
refluxing the partially methylated polysaccharide in silver oxide and methyl iodide. Kuhn et
al. 128 improved on this method by using a polar solvent e.g. N,N-dimethyl formamide with
repetitive methylation in the presence of barium oxide.
In 1964 Hakomori129 revolutionised the methylation of polysaccharides by
introducing the use of sodium dimsyl and methyl iodide (Mel). Most methylation reactions
are carried out by this or a derivative of the Hakamori method, i.e. that of Phillips et al. 130.
Initially sodium dimsyl anion 129 in DMSO was used to form the alkoxide anion. Other
derivatives used are potassium dimsyl130 which is easier to produce, less dangerous and
more stable; potassium tert-butoxide 131 which forms an equilibrium of methylsulphinyl
carbanion with tert-butoxide anion in solution; and lithium methylsulphinyl carbanion 132
which produces results relatively devoid of contaminating fragments, although there is
considerable danger in its preparation. 1,1 ,3,3-tetramethyl urea 113 has been applied in a
1 : 1 DMSO solution, enabling intermolecular hydrogen bonding relaxation within a

33
polysaccharide matrix and improved Mel penetration to the polysaccharide anion.
Aggregation of ribbon-like tertiary structures has been shown to decrease the extent of
methylation of a galactomannan by Manzo et al. 134 thus reinforcing the utility of tetramethyl
urea in polysaccharides present as aggregates.
Some fluorinated methylating agents have found use in polysaccharide chemistry,
e.g. diazomethane-boron trifluoride 135 conserves O-acyl substituents during methylation and
Arnarp et al. 136 offered methyl trifluoromethane sulphonate as an alternative to it where
necessary. It must be noted that a nonpolar solvent is necessary if the high degree of
reactivity is to be maintained when using fluorinated agents.
Methylation chemistry has advanced to a stage where a polysaccharide can be
methylated in a single vessel within a few hours without intermediate work-up
procedures 125. Probably the most novel technique since the Hakomori method is that of
Ciucanu 137 who replaced the dimsyl anion with a solid base of potassium hydroxide, (and
others hydroxides) in methyl sulphoxide. This technique has the advantage of almost
quantitative methylation in 6-7 minutes, and a clean chromatogram free of non-methylated
by-products. Ciucanu et al. 138 have recently also published methodology used to avoid
uronic acid degradation which can occur during methylation with sodium
methanesulphinylmethanide in methylsulphoxide. When methylating oligosaccharide material
of low molecular weight, the Prehm 139 method of methylation for small molecules may be
useful.
Today methylation of polysaccharides of diverse character can be brought about by
a multitude of techniques using solvent systems ranging from aqueous to non-aqueous.

34
3.2. Monosaccharide sequencing
One or more of the following techniques is normally used after linkage determination
by methylation analysis. To confirm the structural analysis a third technique, the Smith
degradation may still be necessary.
3.2.(i). B-Elimination of uronic acid residues
The majority of bacterial polysaccharide K-antigens contain a uronic acid. This acid
can be selectively cleaved by ~-elimination if the uronic acid is 4-0-substituted and the
polysaccharide is methylated. Comparative GLC analysis of hydrolysed, methylated
polysaccharide with that of the ~-eliminated hydrolysed products enables the site(s) of
uronic acid linkage to be identified.
Polysaccharides constructed with an in-chain uronic acid degrade to produce
oligosaccharides, while polymeric products are obtained from polysaccharides with a uronic
acid in the side chain. Demethylation and other degradation reactions may give false
information, but can be controlled.
The reaction must be performed in a basic non-aqueous solution which affords
stability to the alkoxide anion, and the methyl ester of the uronic acid and methylated
hydroxyl groups of the uronic acid should be stable to the ~-Elimination conditions.
Lindberg et al. 140 described an elimination method which takes advantage of the
formation of an unsaturated bond at C4 of a uronic acid under the action of a strong base
but the presence of a good leaving group at C4 is necessary. The polysaccharide is initially
methylated by the modified-Hakomori method and ~-elimination will not occur under these
conditions to any appreciable degree because the methyl iodide added neutralizes the dimsyl
anion. On the addition of a strong base 140 and later mild hydrolysis the uronic acid
degrades forming a 4-deoxyhex-5-ulosonate which may form a turan moiety through internal
lactonization, (see figure 7). The substituent monosaccharide or appendage is liberated
along with the intact polysaccharide or oligosaccharide.

35
(,O,CII, C) 0 ) -b--o · ).-0.--
o ()~
-··0
r(\ .. _O~OII
I I·urlh~r lkgradalil)1l h} ha,~ ffl1l11
Iih~ralcJ r~dlJt..·ll1g gn.Hlfh
d~r~lldillg nn n'IIL1r~ and l,lL-ali"1l of SLlh'lill1~llh
r°'ro_ .. ..------ II()~
S,ll' dfl'\rhhL'd 'lgl)ttlllil".·
h} dr"" I group idel1lilied h~ 1IIIIh,-r ,Ilk} 1.111"11
FIGURE 7, Base-catalysed IS-elimination from 4-linked hexuronate residues in permethylated polysaccharides.
Kiss 141 has reviewed the scope, mechanism and various systems susceptible to IS-
elimination and provides data on these. Kenne et al. 142 used Klebsiella K47 as a model
polysaccharide and methylated it selectively leaving C-3 with an underivatised hydroxyl. A
carbonyl centre was generated by the oxidation of the hydroxyl under ruthium tetroxide
followed by IS-elimination under suitable conditions. Aspinall et al. 143 reported that the
elimination reaction of Lindberg 140 could be performed with the omission of the mild
hydrolysis step. The point of uronic acid linkage is directly ethylated with ethyl iodide,
hydrolysed and separated by GLC.
Lindberg et al. 144 have shown that after methylating a polysaccharide containing an
uronic acid in its side chain, e.g. Klebsiella K28, the uronic acid could be cleaved in a 9:5
acetic-anhydride/triethylamine solution followed by treatment with 90% acetic acid. This
elimination is dependant on the strength of the leaving group attached to the acid. If the
group is weak, increasing the reaction conditions only serves to form intramolecular uronic
ester linkages.

36
B-Elimination is qualitatively carried out on milligram quantities of methylated
polysaccharide and describes the relative position of the uronic acid, i.e. identifying which
monosaccharides are linked to the uronic acid and gives an idea whether the acid is in the
chain or not.
3.2.(ii). Reductive cleavage
Conventional analysis of methylated polysaccharides by GLC of the derived
permethylated alditol acetates does not allow differentiation between 0-4 linked
aldopyranosyl and 0-5 linked aldofuranosyl residues 124. The technique of reductive
cleavage 145 when applied to methylated polysaccharide, enables the simultaneous
determination of the ring size, and linkage positions of the cleaved monosaccharides. The
glycosidic C-O bond of a polysaccharide undergoes a hydride transfer by, e.g. triethylsilane
in the presence of a catalyst, and the anomeric carbon of the monosaccharide cleaved is
dehydrated with the formation of an anhydroalditol, (Figure 8.). GLC-MS analysis of the
permethylated anhydroalditol acetates establishes the monosaccharide character
unambiguously, pyranose residues are expressed as 1,5 anhydro-alditol derivatives and
furanose residues as 1,4 anhydro-alditols.
OR Catalyst
FIGURE 8. Reductive cleavage of the C-O bond via hydride transfer

37
The utility of following a conventional methylation reaction by reductive cleavage is
witnessed by less work-up procedure, acetylation is carried out in situ in acetic anhydride,
and the ring form is maintained along with the stable anhydro-alditol
Triethylsilane has' been used as the reducing agent along with either
trimethylsilyltrifluoromethanesulphonate or boron trifluoride etherate as the catalyst. By
judicious choice of catalyst 146 monosaccharide residues of a polysaccharide may be
preferentially cleaved, e.g. B 1-3, B 1-4 and 6 linked glucopyranosyl residues are stable to
boron trifluoride etherate. However a solution 147 of 5: 1 trimethylsilylmethanesulphonate
and one equivalent of boron trifluoride etherate per equivalent of acetal has been shown to
cause total polysaccharide cleavage without artifact formation.
Gray et al. 146 have done much to develop the method of reductive cleavage and
have determined linkage position(s) and ring size amongst, e.g. D-mannans 148, 2-acetamido-
2-deoxy-D-glucopyranosyl residues 149, and its application to pyruvic acid acetal containing
polysaccharides 150. They note that although the 4,6 (1-methoxycarbonylethylide) is stable
to reductive cleavage conditions, eventually the S diastereoisomer of the acetal results with
possible erroneous configuration determination. Slow regiospecific reductive ring-opening of
the acetal may also occur with the formation of a 6-0-[ l-(methoxy-carbonyl)ethyll
derivative.
Although reductive cleavage has advantages, the establishment of optimal reaction
conditions of reagent/catalyst may be problematic, as described by Hackland 151 in the
reductive cleavage of an E. coli polysaccharide.

38
3.2.(iii).a. Periodate Oxidation
Oxidation of bacterial polysaccharides by periodate is carried out in aqueous solution
and the products of this reaction are used to prove points of linkage, linkage sequence,
chain length and molecular weight.
In 1928 Malaprade 152 showed that ~-glycols undergo quantitative oxidation with
periodate to form polyaldehydes. One mole of periodate is consumed for each pair of vicinal
diols present and the oxidation of an adjacent diol pair results in the release of
formaldehyde. Structural information can be determined with respect to the oxidised
polysaccharide being analysed, if it is assumed that all vicinal diols are oxidised. The
formation of inter-residue hemi-acetals 153, after the formation of reactive carbonyls may
result in a first oxidation limit, i.e. the oxidised residue has a protective effect on its nearest
neighbour but reduction at this stage, followed by re-oxidation usually enables complete
oxidation of the monosaccharide. Should the polysaccharide be over oxidised it is
depolymerised and period ate is consumed to infinity 153.
Painter 154 has demonstrated that the "peeling reaction" taking place from the
reducing end of the polysaccharide which causes depolymerisation of the polysaccharide can
be eliminated. The polysaccharide is reduced after oxidation and 1-propanol is included as a
radicle scavenger. Scott 155 has used divalent magnesium ions in decreasing the anionic
nature of the uronic acid carboxyl. This decreases the steric repulsion toward the oxidising
periodate ion and enables complete oxidation. Using a lower pH156 has a similar effect, but
causes a loss in oxidation selectivity of diol systems. Bobbit 157 indicated that the inability of
a polysaccharide to undergo periodate oxidation could establish that either a vicinal diol is
absent, or that an anchored trans configuration could be present in the structure. Cis diols
are oxidised most quickly and therefore polysaccharides containing a greater number of cis
diol pairs are oxidised more quickly.
Optimum conditions for selective periodate oxidation 158 include a mildly acid
environment, temperature less than 6°C, darkness (periodate is decomposed by light), and a
3-4 fold excess of sodium periodate. Sterically hindered polysaccharide systems are
39
oxidised more slowly and HPLC analysis of oxidised polysaccharides can be useful in
determining the degree of oxidation.
Period ate oxidation is useful for the quantitative determination of small quantities of
polysaccharide material. Quantitative analysis of the periodate consumption relative to
formaldehyde production gives an indication of the number of vicinal diol pairs, and
isotachophoretic 159 analysis of periodate can be performed down to 1-2pg. Other
methods 160 used in the determination of periodate, iodate and formate are
spectrophotometry, titrimetry, potentiometry, manometry, and enzymic methods, depending
on the particular system. Spectrophotometric 161 analysis depends on the maximum light
absorbance of periodate being at 223, 260 and 290nm. However iodate absorption
influences the accuracy of this technique and must be taken into account.
Preparative generation of large quantities of selectively oxidised polysaccharide is
possible and the reaction is easily quenched by adding excess ethylene glycol, making
period ate oxidation a very useful reaction.
3.2.(iiil.b. Smith degradation
A Smith degradation involves initial oxidation of the polysaccharide by periodate,
followed by hydrolysis under mild conditions. The Smith degradation generates an
oligosaccharide which is the most elementary product of the oxidised polysaccharide. A
mild hydrolytic step cleaves all the acyclic linkages present after periodate oxidation and the
resulting poly- or oligosaccharide can be analysed further to yield structural information.
Figure 9, depicts the Smith degradation product of the Klebsiella K437 polysaccharide.

40
o
FIGURE 9. The Klebsiella K43 Smith fragment.
For reliable interpretation of information generated from a Smith degradation, it is
necessary that all the vicinal diols of the polysaccharide undergo complete oxidation, and
that hydrolysis of unoxidisable monosaccharides does not occur. Information established
from the Smith degradation complements methylation and uronic acid degradation data.
Hydrolytic conditions used in the Smith degradation are mild and sensitive
furanosides, if present, are not hydrolysed. Comparison of the acyclic degradative
product(s) released after mild hydrolysis, with that of the Smith fragment helps to establish
the polysaccharide structure. Dutton 162 surveyed hydrolytic conditions necessary for
hydrolysis of glycoalditols and polysaccharide residues, whilst Baird163 has indicated that
GLC analysis of the Smith degradation products is best conducted by the formation of
PAAN's derivatives, as TMS derivatives produce multiplets in the chromatogram.
Quantitative determination of acyclic fragments generated can be determined relative to an
internal stancfard 164.
1 M Trifluoroacetic acid at room temperature for 24 hours 165 has been shown to
bring about complete hydrolysis of acetal linkages within the oxidised polysaccharide, but
certain polysaccharides do require harsher hydrolytic conditions to cleave the acyclic
aglycone. These condition can only be determined through experimentation.

41
3.3. Polysaccharide depolymerisation techniques
Water soluble bacterial polysaccharide K-antigens are expressed as a chain of
oligosaccharide repeating units, and are often found as aggregates 166. This gives rise to a
complex quaternary structure of high molecular weight, usually several hundred thousand
daltons. This material often resists attack by chemical reagents due to steric hinderance of
reactive centres, but a variety of physical, chemical and biological techniques are available to
decrease the molecular weight of a polysaccharide and each is useful in its own way. The
degree of cleavage specificity sought, lability of certain components, the speed of the
process, its availability and cost dictate the technique used.
3.3.0). Partial Acid Hydrolysis
Aspina1l167.168 and Bouveng et al. 102 have reviewed the use of partial acid
hydrolysis, in the structural analysis of complex polysaccharides. The polysaccharide is
exposed to hydrolytic conditions that cleave only some glycosidic linkages and gel
permeation chromatography is used routinely to separate the many oligosaccharides
produced by partial acid hydrolysis. Structural determination of the resulting oligosaccharide
allows deductions to be made about linkage location and monosaccharide sequence.
The nature of the glycosidic linkages and monosaccharide size within a
polysaccharide dictate the outcome of the hydrolysis experiment. Furanose residues are
hydrolysed 103 times faster than the pyranose forms, and uronic acids and hexosamine
linkages are usually stable to partial hydrolysis. The occurrence of an aldobiouronic acid in a
hydrolysate is indicative of an uronic acid linked to a neutral sugar within the
polysaccharide. Furthermore the position of the glycosidic bond increases the specificity to
preferential hydrolysis, e.g. (1-6) linkages are less labile than (1-2) linkages to partial
hydrolysis. Changing the reaction conditions to a non-aqueous solvolysis system, e.g.
acetolysis, methanolysis or mercaptolysis, reverses the relative susceptibility of different
42
glycosidic linkages, e.g. (1-2) linkages are then less susceptible to partial degradation than
the (1-6) linkage. Careful choice of partial acid hydrolysis/solvolysis conditions will provide
extra information pertinent to sequence and linkage type. Chemical manipulation, via the
reduction of a uronic acid to its corresponding neutral monosaccharide, might allow the
isolation of a different oligosaccharide fragment, thus yielding further structural information
about the polysaccharide.
Typical aqueous partial hydrolysis conditions1S9 are 0.5M H2S04 at 100°C and
samples are drawn at 45, 60 and 90 minutes. TFA is commonly used over a range of 0.5-
2.0 M at various temperatures and periods of time.
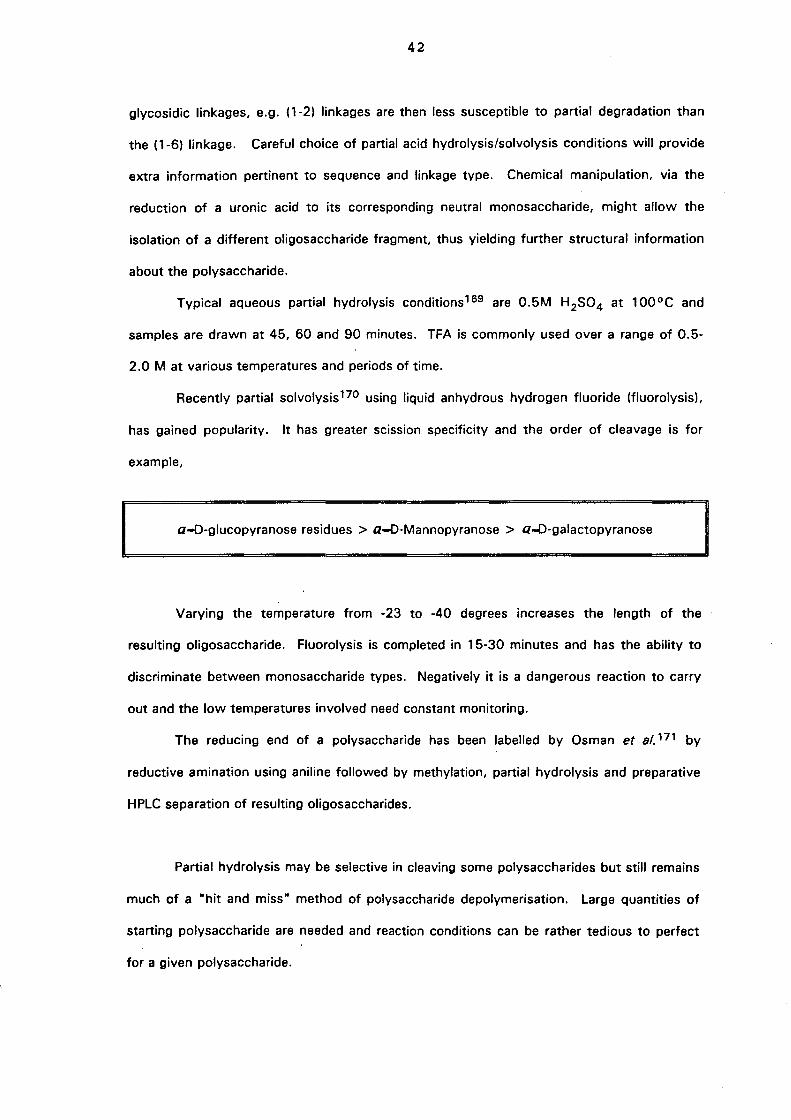
Recently partial solvolysis 170 using liquid anhydrous hydrogen fluoride (fluorolysis),
has gained popularity. It has greater scission specificity and the order of cleavage is for
example,
a-D-glucopyranose residues > a-D-Mannopyranose > a...[)-galactopyranose
Varying the temperature from -23 to -40 degrees increases the length of the
resulting oligosaccharide. Fluorolysis is completed in 15-30 minutes and has the ability to
discriminate between monosaccharide types. Negatively it is a dangerous reaction to carry
out and the low temperatures involved need constant monitoring.
The reducing end of a polysaccharide has been labelled by Osman et al. 171 by
reductive amination using aniline followed by methylation, partial hydrolysis and preparative
HPLC separation of resulting oligosaccharides.
Partial hydrolysis may be selective in cleaving some polysaccharides but still remains
much of a "hit and miss" method of polysaccharide depolymerisation. Large quantities of
starting polysaccharide are needed and reaction conditions can be rather tedious to perfect
for a given polysaccharide.

43
3.3.(ii). The Lithium degradation
Underivatised acidic polysaccharides undergo uronic acid cleavage by the use of
lithium metal dissolved in an ethylenediamine solution of the polysaccharide 172. The
reductive strength of lithium ions dissolved in an amine solvent cleaves the polysaccharide at
the point of the uronic acid linkage regardless of the linkage position. Oligosaccharides or
low weight polysaccharides will form depending on the position of the uronic acid, i.e. an in
chain uronic acid will degrade into oligosaccharide length material. Unfortunately the caustic
lithium ions produce a harsh reaction environment cleaving all attached ketals, and is
strongly reducing to aldose sugars.
Mechanistically the lithium reaction has been suggested to be via an (telimination of
the oxygen attached between the C5 and C1 of the uronic acid, which in turn eliminates its
oxygen to the aglycone liberated. The yield of neutral oligosaccharide from the lithium
degraded Klebsiella K437 polysaccharide approximated 50%, but is adequate for preparative
generation of large samples of uronic acid degraded polysaccharide.
Dry acidic polysaccharide is solubilised in ethylene-diamine by ultrasonication,
heating and stirring. Lithium metal is introduced and vigorously stirred till a deep navy
colour results. This is maintained for an hour after which the degraded polysaccharide is
extracted by means of a toluene-water-ethylenediamine azeotrope as described172. Few by
products are formed and the reaction can be completed in a working day, although the ion
exchange of the lithium ions is time consuming.
Mort et al. 173 published the cleavage results of a 3-linked glycosyluronic acid in an
amine solvent by lithium metal in 1982, and since then Lau et al. 172 have evaluated this
technique by uronic acid degradation of a range of acidic biological polysaccharides. The
uronic acid of the K-antigen's of Klebsiella K44, K17 and K62 were degraded, and this
thesis has shown that the Klebsiella K437 polysaccharide glucuronic acid is also susceptible.

44
The lithium degradation conveniently generates uronic acid cleaved polysaccharide
from underivatised polysaccharide, and the only restriction to its use is the solubility of the
polysaccharide in ethylene-diamine. The lithium degradation is an important technique for
generating uronic acid degraded samples of sufficient quantity for 20 NMR studies.
3.3.(iii). Enzymic Depolymerisation
Enzyme mediated polysaccharide depolymerisation has been reviewed174-177, as well
as its applicability to Klebsiella exopolysaccharides 175.
Many enzymes exist which catalyse the cleavage of specific glycosidic bonds. They
can be divided into two marn categories, viz. exo- and endo-enzymes. Exo-enzymes cleave
the monosaccharide residues of a polysaccharide from the outside inwardly, i.e. from the
non-reducing terminal of the poly- or oligosaccharide, and may be used in the step-wise
identification of monosaccharides present in a saccharide. They may also aid in the
determination of the linear or branched nature of a polysaccharide 174.
Endo-enzymes cleave a polysaccharide in a random pattern enabling rapid
depolymerisation, but require several points of substrate attachment and these are found in
regions of the polysaccharide which are unbranched or slightly branched 177. They are
particularly useful in producing large quantities of repeating unit oligosaccharide material
from bacterial polysaccharides. The en do-enzyme only cleaves one type of bond, e.g. the
Klebsiella K437 repeating unit oligosaccharide was produced by an endogalactosidase,
cleaving an ~.....o-(1 ~3) galacto-mannose bond. All structural information of the original
polysaccharide is maintained, e.g. acetate and other labile groups. It has been reported 177
that small residues may undergo transglycosylation after an endoglycanase digestion,
although not common this necessitates the need to compare the repeating unit
oligosaccharide produced with the native polysaccharide, e.g. by comparison of their
respective methylation data.

45
Advantages of enzymic depolymerisation technology
1). An absolute degree of selectivity toward linkage and or sugar type is possible.
2). The method is non-contaminating and is carried out in water which allows easy
dissolution of the polysaccharide and purification/separation.
3). The scission of the repeating unit or multiples thereof is possible for bacterial
polysaccharides and acid labile appendages are not cleaved under the physiological
conditions of the degradation.
Enzyme preparations must always be checked for purity as false information will
result if impure enzyme isolates are used in structural analysis.
3.3.(iii).a. Virus-borne enzyme depolymerisation
Bradley 177 has reviewed the multitude of bacteriophages found and they are
described as obligate viral parasites of bacteria. They de polymerise the extra-cellular
polysaccharide of the encapsulated bacteria by means of the endoglycanases carried on their
tail spikes, and these enzymes can be hydrolyses or Iyases. Since enteric bacteria are found
in sewage, phages may be easily isolated from untreated sewerage water.
Phage isolation, propagation and polysaccharide digestion used in our laboratory
essentially follows the methods of Okutani et al. 103 . Bacteriophage propagation and
concentration is carried out till a phage titre of 1013 plaque forming units is achieved, this
being accepted as sufficient to degrade 1 g of polysaccharide.
Hydrolases 117 are reported to be most active at pH 5-6 and Iyases at pH 8, however
Dutton et al. 50 found pH 7 ~o be the most successful. Hydrolases have a molecular weight
of near 50 000 daltons and that of Iyases is higher; this physical property enables easy
isolation of the resulting oligosaccharides by dialysis, with retention of the enzyme within
the dialysis bag.
It has been noted 175 that amongst Klebsiella bacteriophages the majority bring about
46
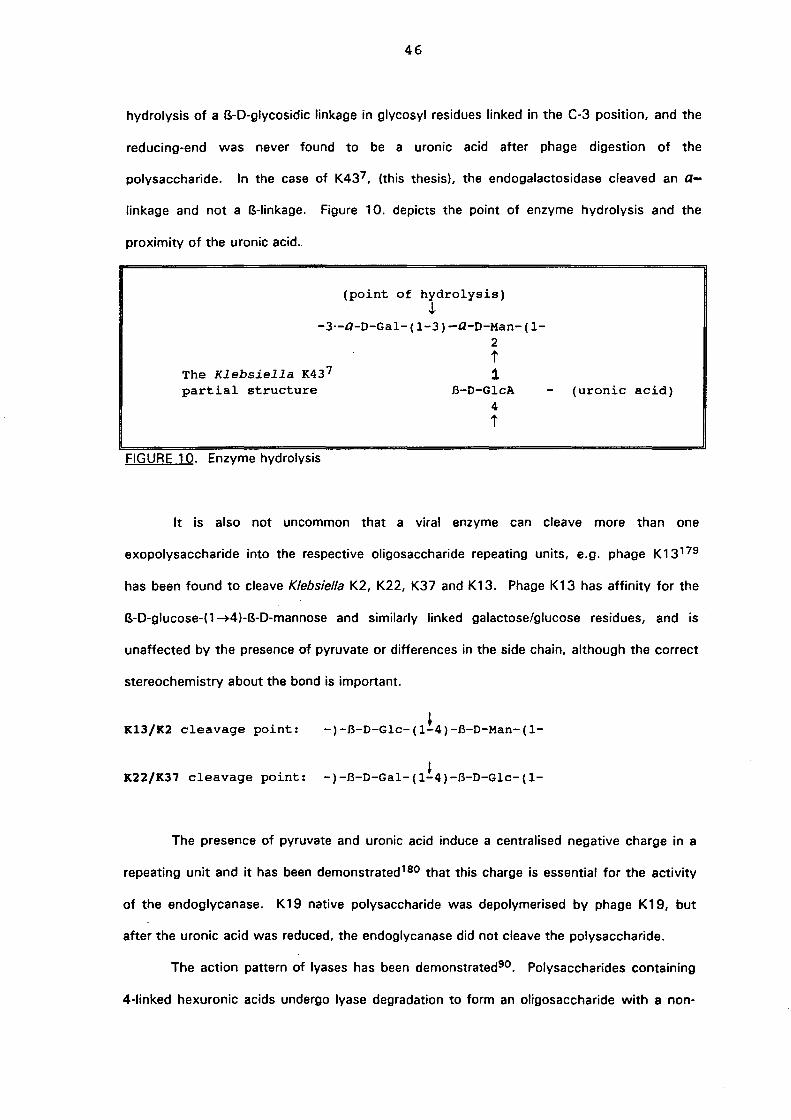
hydrolysis of a B-D-glycosidic linkage in glycosyl residues linked in the C-3 position, and the
reducing-end was never found to be a uronic acid after phage digestion of the
polysaccharide. In the case of K437, (this thesis), the endogalactosidase cleaved an Q-
linkage and not a B-linkage. Figure 1 O. depicts the point of enzyme hydrolysis and the
proximity of the uronic acid ..
(point of hydrolysis) J,
-3'-Q-D-Gal- (1-3) -Q-D-Man- (1-2 t
The Klebsiella K43 7 1 partial structure
FIGURE 10. Enzyme hydrolysis
B-D-GlcA 4 t
(uronic acid)
It is also not uncommon that a viral enzyme can cleave more than one
exopolysaccharide into the respective oligosaccharide repeating units, e.g. phage K 13179
has been found to cleave Klebsiella K2, K22, K37 and K13. Phage K13 has affinity for the
B-D-glucose-(1 ~4)-B-D-mannose and similarly linked galactose/glucose residues, and is
unaffected by the presence of pyruvate or differences in the side chain, although the correct
stereochemistry about the bond is important.
K13/K2 cleavage point:
K22/K37 cleavage point:
~ -)-B-D-Glc-(1-4)-B-D-Man-(1-
~ -)-B-D-Gal-(1-4)-B-D-Glc-(1-
The presence of pyruvate and uronic acid induce a centralised negative charge in a
repeating unit and it has been demonstrated180 that this charge is essential for the activity
of the endoglycanase. K19 native polysaccharide was depolymerised by phage K19, but
after the uronic acid was reduced, the endoglycanase did not cleave the polysaccharide.
The action pattern of Iyases has been demonstrated90 . Polysaccharides containing
4-linked hexuronic acids undergo lyase degradation to form an oligosaccharide with a non-
47
reducing terminus containing an unsaturated hex-4-enuronic acid. K590 and K6476 are
examples of polysaccharides which have been degraded by a lyase-containing
bacteriophage.
Phage degradation is of especial utility in preserving the chemically labile pyruvate
and acetate moieties found in some bacterial polysaccharides, and Dutton et al. 83 discovered
that K44 contains an acetate appendage after work up of an enzymatic digest of the
polysaccharide. This re-investigation into a published structure emphasises the importance
of phage depolymerisation in the accurate determination of bacterial polysaccharides.
In conclusion phage depolymerisation yields the chemical repeating unit or multiples
thereof. These oligosaccharides are then amenable for further structural analysis. In
particular, they allow the acquisition of clean, well resolved NMR spectra and are excellent
substrates for high resolution 20 NMR spectroscopy. Unfortunately bacteriophages are not
found for all bacterial polysaccharides, e.g. Klebsiella K3836 containing a pentulosonic acid
was screened during initial investigations on K437 for a susceptible bacteriophage, but all
tests were negative.

48
INSTRUMENTAL ANALYTICAL TECHNIQUES
4.0. Introduction
Nuclear magnetic resonance spectroscopy, mass spectrometry and different forms of
chromatography are used routinely for the structural elucidation of bacterial polysaccharides.
Other useful instrumental methods include polarimetry, ultra-violet spectrometry (UV),
crystallography, and infra-red spectroscopy.
Polarimetry 118 was the only instrumental means of identifying the relative anomeric
configuration of a monosaccharide a century ago but today is rarely used for this purpose.
It is used to determine the specific light rotation of a chiral compound, i.e. specifying [alO
for a polysaccharide, and for determining the absolute configuration of isolated
monosaccharides.
Colorimetry and UV spectrometry, used extensively in the 1950's, has lost ground
to new methods which are more accurate, but UV spectrometry 181 is still useful in the
determination of phosphate in polysaccharides.
Crystallography 182 is beyond the scope of this section. It produces information on
the tertiary structure (conformation) of crystallisable molecules and has been applied to the
exopolysaccharide of Klebsiella K5 7 183 . Conformational molecular modelling 184 by super
computer technology has enabled mathematical, three dimensional geometrical calculations
of polysaccharides and augments crystallographic studies.
Infra red (lR) analysis has been used in the determination of the carbonyl content of
acidic polysaccharides and has also been used to monitor the extent of a reaction, e.g. the
Smith degradation reaction.

49
4.1. Chromatographic Techniques
Figure 11, depicts the diversity of chromatographic techniques relevant to
polysaccharide analysis.
I GAS
~ I COLUMN
GLC
I LSC LLC BPC
FIGURE 11. Chromatographic techniques
4.1.i. Gas Liquid Chromatography (GLC)
I LIOUID
I
PLANAR
lin IEC EC TLC PC
II GPC GFC
Gas liquid chromatography (GLC) separates complex volatile mixtures by partition
between a carrier gas and a liquid stationary phase.
GLC is used to analyse the components of polysaccharides and determines the
nature of monosaccharide residues, and their relative ratios. Monosaccharides are non-
volatile and must undergo chemical derivatisation to increase their volatility. The volatile
form chosen must be stable to the oven temperature of the chromatograph and produce well
resolved chromatograms. Bishop 185 (1964) and Dutton 186 (1974) have extensively reviewed
GLC (packed column technology), and the applicability of GLC to structural analysis of
carbohydrates. Dutton 186 and Drozd 1 87 have described volatile derivatisation and its utility
in polysaccharide analysis. Each derivative has its own nuance and the following are
routinely used: trimethylsilyl, acetate, trifluoroacetate, methyl and aldononitrile acetate
(PAAN's). Volatile cyclic derivatives188 produce complex chromatograms because of the
presence of the a-land B-anomers of both the pyranose and furanose forms. Formation of
an alditol or acyclic nitrile eliminates the multiplet pattern and produces a single well
separated peak for each residue, simplifying the interpretation of the analysis. Peracetylated

50
aidononitriles200 (PAAN's) are ordinarily used in the determination of monosaccharide type,
and partially methylated alditol acetates201 (PMAA's) for the determination of methylated
polysaccharides. The identity of permethylated alditols should always be confirmed by mass
spectrometry. PAAN's are the result of an oxime formation which stabilizes carbonyl
compounds prone to producing assymetrical peaks 187. Permethylated monosaccharides are
convenietly analysed as their respective PMAA' s by acetylation after hydrolysis of the
polysaccharide and the derived alditol acetates 190 give distinct m/z fragments by GLC-MS
analysis.
The resolving capacity 190 of a GLC system is dependant on: 1). Column variables of
length, internal diameter, and stationary phase film coating thickness. 2). Operational
variables of carrier gas make up, gas velocity and column temperature.
At least five types of injector valves are available, viz. split, splitless, on-column,
direct and programmed temperature vaporising injection. Split injection allows the vast
majority of sample injected after flash vaporisation to by-pass the column admitting only
nanogram quantities necessary for modern fused silica capillary columns.
Fused silica capillary columns are commonly used because they exhibit inertness to
sample and solvent, produce high resolution efficacy and selectivity, and are popularly used
in most literature reports. Wall coated open tubular 192 columns, (WCOT) of the OV225 and
OV 17 types are routinely used to separate derivatised186 monosaccharides. Differences in
polarity between column coatings may be beneficial in cases where co-elution of compounds
occurs and changing the stationary phase may allow better separation of the compounds of
interest. The internal diameter of a capillary column ranges from O.05mm to O.53mm and
the stationary phase film thickness from O.1,um to 8.0,um. Stationary phase coatings are
described by 9 different degrees of polarity, e.g. they vary from polymeric OV225 (viscous
liquid), through gum-like OV-1 to carbowax 20M, which is solid at ambient temperature.
Disadvantages found amongst WCOT columns are a lack of film capacity for
concentrated samples and less effective separation of molecules of low molecular weight.
Thicker film coating is available but alternative column designs, viz. porous layer open
tubular (PLOT), support coated (SCOT) and micro packed capillary columns 192 are

51
alternative possibilities.
Temperature variation, i.e. programmed temperature GLC193 (PTGC) is a feature of
all modern instruments, allowing software controlled temperature control. An initial
temperature is set and throughout the GLC cycle the temperature is incrementally increased
over time till a temperature plateau of choice is reached. This is advantageously used in
some situations over isothermal setting because it offers a constant peak width throughout
the elution, and retention times rise only at a linear rate with respect to increasing carbon
number. In the case of Klebsiella K437, (this thesis) isothermal analysis proved adequate
because residues were of the same carbon number and all qualitative work was conducted
against standards run under identical conditions.
Five different detector 192 types are available and detector choice depends on the
eluting substance. Flame ionisation detection (FID) is commonly used but the presence of
helium make up gas decreases its sensitivity. Thermal conductivity detection (TCD) shows
greater solution concentration sensitivity and optimal gas velocity near 5ml/minute will
enable decreased band broadening. Hence the choice of carrier gas types and velocity of
supply are important in optimising detector sensitivity.
Quantitative measurements are achieved by the integration of the area under the
peak being assayed, relative to that of a prepared standard which is assigned the value of
unity. Qualitative assurance of an eluted peak can be directly or indirectly 193 determined.
The indirect method is usually preferred and consists of running a standard solution under
precisely the same conditions as that of the unknown solution and the retention volumes are
then compared.
Extensive tables 186 of packed column types, various monosaccharide derivatives
separated and conditions used are available, but are not directly applicable to capillary
columns, although may serve as a guide. Virtually every paper published on polysaccharide
structure since the advent of the GLC capillary era uses some GLC application, and often it
is used as a convenient technique for pilot scale research before, e.g. NMR samples are
generated.
In this laboratory GLC was used for the analysis of the Klebsiella K437

52
monosaccharide ratio and the Smith degradation products by means of the derived PAAN's.
PMAA's were used to determine the polysaccharide linkage positions, and separately the
absolute configuration of the monosaccharide residues, after polysaccharide hydrolysis and
glycosylation with (-)-2-octanol.
Modern extensions to GLC analysis have been coupled instrumentation, viz. GLC-MS
(mass spectrometry), and GLC-IR. Two dimensional192 GLC has been used in analytical
work where a separated band must be further resolved on another column of different
polarity.
GLC is thus a technique of high sensitivity producing excellent resolution of mixed
monosaccharide residues and is thus well suited to polysaccharide analysis. It, however,
does require that the sample being eluted must be volatile and stable to the temperature of
the elution.
4.1. (ii). Liquid Chromatography (lC)
Liquid chromatography only imposes a solubility constraint on the sample in a liquid
eluent phase. Four basic chromatographic principles may apply at the stationary phase, i.e.
adsorption, partition, ion-exchange or gel exclusion. LC may be either carried out by planar
or column chromatography. Planar LC encompasses Paper 194,195, Thin layer 194 and
Electrophoretic 194 chromato"graphy. The former two techniques have reached maturation in
application but are still readily used for quick pilot scale or qualitative separation on the
bench, e.g. for determination of the extent of a reaction.
53
4.1 .(iii). Column based liquid chromatography
This describes a range of applications and is distinguished by a stationary phase
contained in a column of precise internal diameter and absolute perpendicular length. It is
generally of a glass construction or solvent stable polymer material, or stainless steel.
Depending on the nature of use, i.e. preparative or analytical scale, the inner diameter
ranges from a fraction of a millimetre to centimetres, and length from centimetres to a metre
or more. The application of HPLC in the analysis of carbohydrates has been reviewed by
Hicks 196.
4.1.(iii).a. High performance liquid chromatography (HPlC)
The use of HPlC 196-198 in separating polysaccharide material has become popular.
Instrumentation is cheaper than GLC, choice from a range of chromatographic modes is
available, the time to elute a sample is generally short and the volatility of the mixture
unimportant since separation is solution dependant.
HPLC is useful in separating small molecules « 2 000 daltons) and may be carried
out by one of many chromatographic 197 modes, viz. adsorption, partition (normal or reverse
phase), size exclusion, ion-exchange, affinity etc. and the separation of a mixture is achieved
by high pressure (1 to > 30 MPa) elution of a liquid mobile phase. It produces quantitative
and qualitative data comparable with that of GLC analysis and achieves separation of a
mixture without the need for residue derivatisation, although derivatisation can be useful if
isomers complicate the chromatogram. Unlike GLC, both stationary and mobile phases can
be optimized. Diffusion through the stationary phase may be enhanced by: decreasing the
particle size of the stationary phase, increasing the column temperature, making use of a
reverse stationary phase coating which increases the stationary phase surface area and
changes the surface polarity. The mobile phase may be modified by choosing a solvent of
different strength, (increasing the polarity of the mobile phase in an adsorption normal-
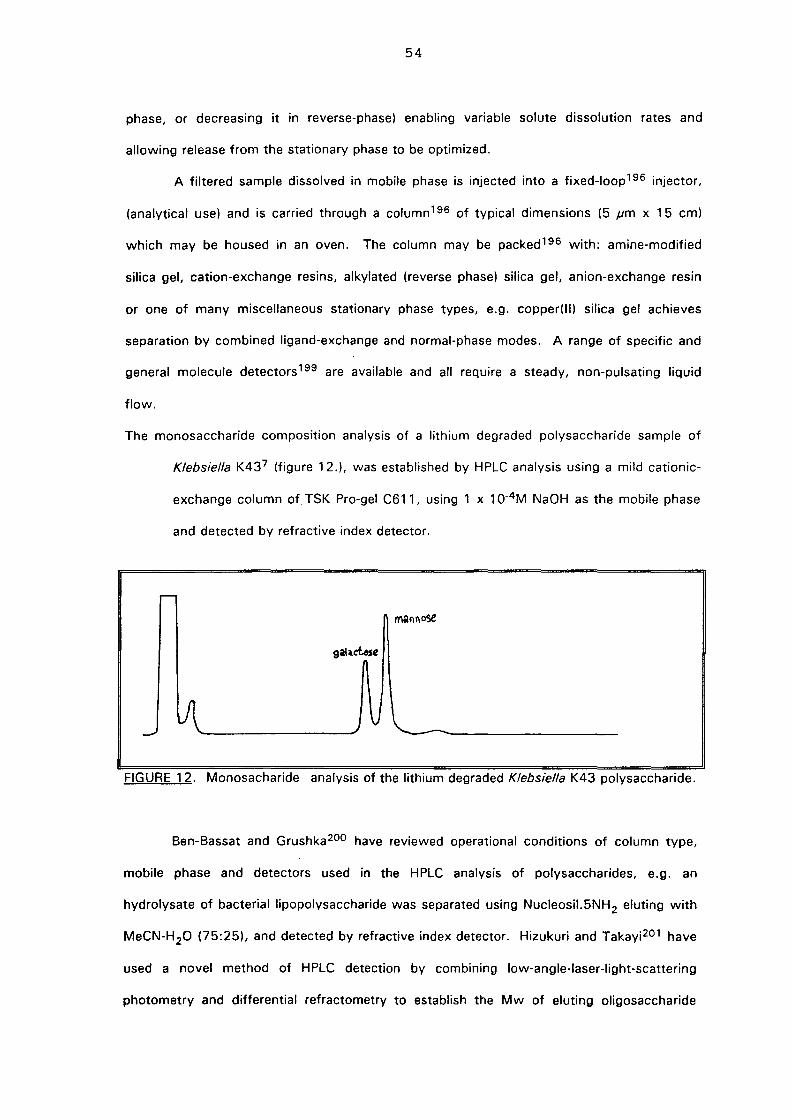
54
phase, or decreasing it in reverse-phase) enabling variable solute dissolution rates and
allowing release from the stationary phase to be optimized.
A filtered sample dissolved in mobile phase is injected into a fixed-loop 196 injector,
(analytical use) and is carried through a column 196 of typical dimensions (5 pm x 15 cm)
which may be housed in an oven. The column may be packed 196 with: amine-modified
silica gel, cation-exchange resins, alkylated (reverse phase) silica gel, anion-exchange resin
or one of many miscellaneous stationary phase types, e.g. copper(lI) silica gel achieves
separation by combined ligand-exchange and normal-phase modes. A range of specific and
general molecule detectors 199 are available and all require a steady, non-pulsating liquid
flow.
The monosaccharide composition analysis of a lithium degraded polysaccharide sample of
Klebsiella K437 (figure 12.), was established by HPLC analysis using a mild cationic-
exchange column of TSK Pro-gel C611, using 1 x 10⁻⁴ M NaOH as the mobile phase
and detected by refractive index detector.
- ---FIGURE 12. Monosacharide analysis of the lithium degraded Klebsiella K43 polysaccharide.
Ben-Bassat and Grushka200 have reviewed operational conditions of column type,
mobile phase and detectors used in the HPLC analysis of polysaccharides, e.g. an
hydrolysate of bacterial lipopolysaccharide was separated using Nucleosil.5NH2 eluting with
MeCN-H20 (75:25), and detected by refractive index detector. Hizukuri and Takayi201 have
used a novel method of HPLC detection by combining low-angle-laser-Iight-scattering
photometry and differential refractometry to establish the Mw of eluting oligosaccharide
55
fractions.
HPLC is playing an increasing role in the elucidation of polysaccharide structure and
has several advantages over other chromatographic methods, viz. polysaccharides can be
analysed directly after hydrolysis as monosaccharides, or small oligomers and thermally
unstable molecules are recoverable in the eluent. H PLC runs are fast, non-destructive,
reproducible and columns have long life expectancy if used correctly.
4.1.(iii).b. Size Exclusion Chromatography (SEC)
Other synonyms describing the same technique are gel filtration chromatography
(GFC) and gel permeation chromatography (GPC). SEC is well suited to the separation of
polymeric components over a wide dispersion of molecular weights and is dependant solely
on the molecular weight and conformational shape of the sample.
Depending on the nature of the stationary phase gel used, polysaccharides of
molecular weights ranging from 1 x 10² to 1 x 10⁷ daltons can be separated. Most gels
will have a specific weight exclusion range. e.g. Table 4.
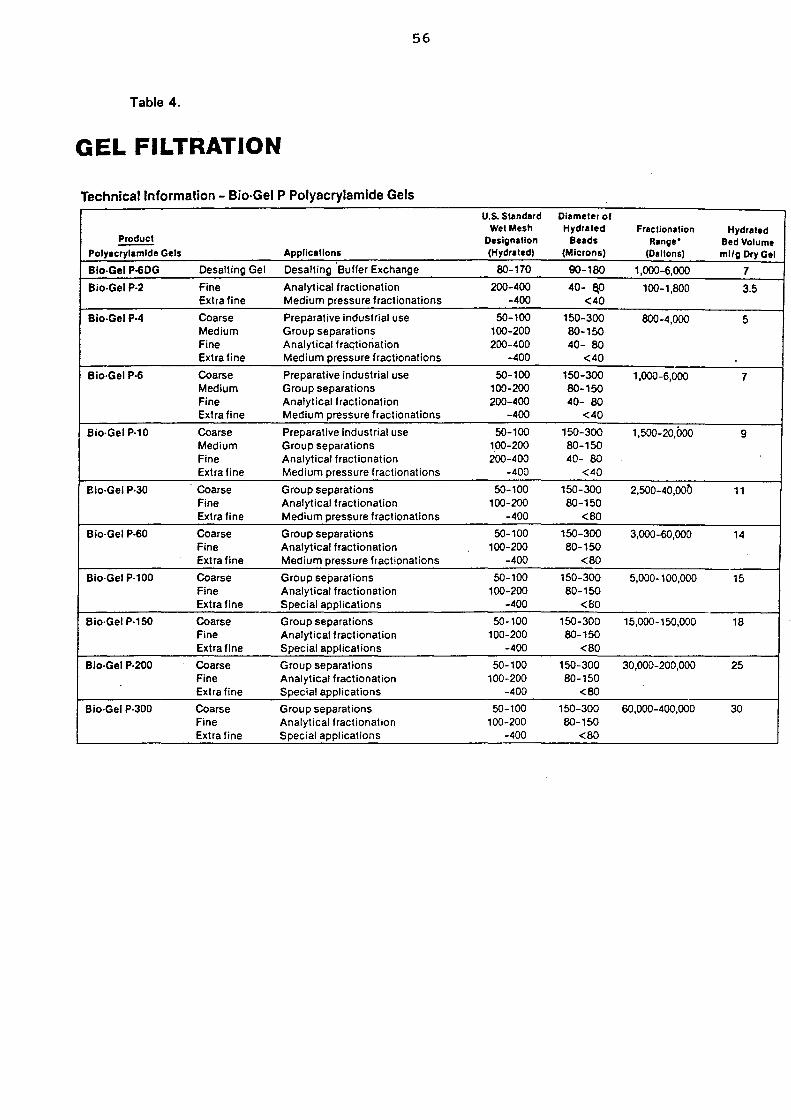
56
Table 4.
GEL FILTRATION
Technical Information - Bio·Gel P Polyacrylamide Gels U.S. Standard Diameter 01
Wet Mesh Hydrated Fractionation Hydrated Product Designation Seads Range" SedVolume
Polyacrylamide Gels Applications (Hydrated) (Microns) (Daltons) ml/g Dry Gel
Bio-Gel P-6DG Desalting Gel Desalting Buffer Exchange 80-170 90-180 1,000-6,000 7
Bio-Gel P-2 Fine Analytical fractionation 200-400 40- &0 100-1,800 3_5 Extra fine Medium pressure fractionations -400 <40
Bia·Gel P·4 Coarse Preparative industrial use SO-loo 1S0-300 800-4,000 5 Medium Group separations 100-200 8O-1SO Fine Analytical fraqtionation 200-400 40- 80 Extra fine Medium pressure fractionations -400 <40
Bia-Gel P·6 Coarse Preparative industrial use SO-100 1S0-300 1,000-6,000 7 Medium Group separations 100-200 80-150 Fine Analytical fractionation 200-400 40- 80 Extra fine Medium pressure fractionations -400 <40
Bio·Gel P·l0 Coarse Preparative industrial use SO-1OO 1S0-300 1,SOO-20,Ooo 9 Medium Group separations 100-200 80-150 Fine Analytical fractionation 200-400 40- 80 Extra fine Medium pressure fractionations -400 <40
Bia·Gel P·30 Coarse Group separations SO-100 1S0-300 2,500-40,oorJ 11 Fine Analytical fractionation 100-200 80-1S0 Extra fine Medium pressure fractionations -400 <80
Bio·Gel P·60 Coarse Group separations SO-100 1SO-300 3,000-60,000 14 Fine Analytical fractionation 100-200 80-1SO Extra fine Medium pressure flactionations -400 <80
Bio·Gel P-l00 Coarse Group separations SO-100 lS0-300 5,000-100,000 15 Fine Analytical fractionation 100-200 80-1SO Extra fine Special applications -400 <80
Bia·Gel P-150 Coarse Group separations SO-100 lSO-300 15,000-150,000 18 Fine Analytical fractionation 100-200 80-150 Extra fine Special applications -400 <80
Bia·Gel P-200 Coarse Group separations 50-100 lSO-300 30,000-200,000 2S Fine Analytical fractionation 100-200 8O-1S0 Extra fine Special applications -400 <80
Bio·Gel P-300 Coarse Group separations SO-100 150-300 60,000-400,000 30 Fine Analytical fractionation 100-200 80-150 Extra fine Special applications -400 <80

57
Extending the weight exclusion range for a sample with complex molecular weight
distribution can be achieved by coupled column 203 SEC.
Some gel types 194 include Sephadex, Agarose, Porous glass and Styragel. At a
molecular level the gel consists of a spider-web of generally polar groups which are capable
of adsorbing water and other polar solvents. Gel swelling results and an expanded matrix of
a specific particle size exclusion limit is generated. Elution of molecules larger than the pore
diameter occurs with the column void volume. Molecules within the exclusion limit of the
polymer gel diffuse into the pore cavity. Fractions of decreasing molecular weight diffuse
out of the gel matrix as elution takes place, and the equilibrium of that fraction within the
gel decreases. Smaller particles with less kinetic energy take longer to escape the matrix
and their residence is longer. Molecular weights lower than the exclusion limit are found at
the total permeation volume as an unresolved mixture 194.
Detection of compounds eluting from the column can be achieved by differential
refractometry or by a method such as the phenol-sulphuric acid method204.
SEC is useful in the separation of biological samples and may be used to determine
the relative molecular weight of an oligo- or polysaccharide. It is a gentle process which can
be carried out under physiological conditions of buffered pH and temperature, and has been
used for the quantitative estimation of carbohydrates, i.e. Mw determination. It is simple,
cheap and easy to perform giving reproducible results, and successive runs are achieved
without the need for regeneration of the gel. The "softness" of the technique allows the
true biological nature of a polysaccharide to be recorded. Klebsiella K437 (this thesis) has
revealed that K437 naturally occurs as an aggregate of Mw 1,047 x 107 , whilst the de
ionised polysaccharide had a relative Mw of 6,026 x 104 . Churms et al. 166 gave further
credibility to the concept of the bacterial polysaccharide repeating unit, by using SEC to
separate the repeating unit and multiples thereof from an enzyme digest of the
polysaccharide. They also noted the occurrence of the aggregation phenomenon.
Dulan 203 has described problems encountered by secondary retention effects found
in SEC. He has also described techniques used to optimize injection volumes, and practical

58
sample concentration limits which ensure that column overload does not occur. Churms205
(1970) and Whistler et al. 206 (1980) have reviewed the technique with reference to gel
types and their respective utility to polysaccharide separation, relative molecular weight
calculations, and column effects206 experienced in unsilanised narrow columns, detector
types etc.
Grellert et al. 207 found that derivatising a monosaccharide into a methylglycoside
increases the apparent retention volume by 150% and this effect was seen to be
cumulative. It should be noted that apart from the sensitivity of this technique to
methylated monosaccharides, comparative reference standards should approximate the type
of derivatisation and shape208 of polysaccharide material to be separated. This is especially
important where a relative molecular weight determination is carried out relative to standard
sugars.
Size exclusion chromatography is a most useful technique for biological
polysaccharide research and has been used in this thesis to separate enzyme degraded
repeating unit material, Smith degradation products and the broad molecular weight
distribution of main chain oligosaccharides from a lithium degradation, along with the
relative molecular weight determination of different forms of the Klebsiella K437 antigen.
4.1.(iii).c. Ion-exchange Chromatography (IEC)
lon-exchange chromatography 194 should not be confused with ion exclusion
chromatography. Ion-exchange chromatography separates molecules according to their
relative difference in ionisation state and is useful for purifying the acidic bacterial
polysaccharides. The instrumentation and chromatographic equipment used is similar to that
in size exclusion chromatography. Two differences exist: the detection is best undertaken
by means of conductivity detection and the gel used is of a different type. The stationary
phase ion-exchange gel relies on the ion-exchange capability of ionised functional groups
located in the cross linkages of the polymeric gel. The gel has a degree of polarity and
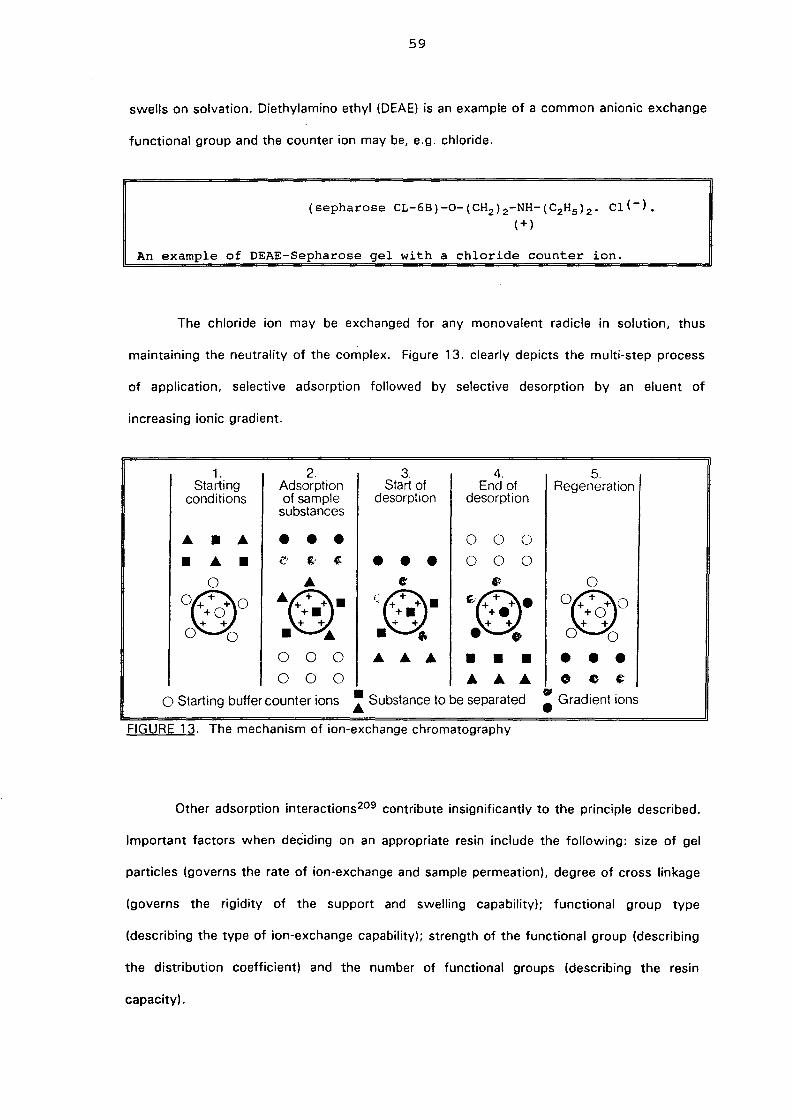
59
swells on solvation. Diethylamino ethyl (DEAE) is an example of a common anionic exchange
functional group and the counter ion may be, e.g. chloride.
(sepharose CL-6B)-O-(CH2)2-NH-(C2Hs)2. Cl(-). (+)
An example of DEAE-Sepharose gel with a chloride counter ion.
The chloride ion may be exchanged for any monovalent radicle in solution, thus
maintaining the neutrality of the complex. Figure 13. clearly depicts the multi-step process
of application, selective adsorption followed by selective desorption by an eluent of
increasing ionic gradient.
1. 2. 3. 4. 5. Starting Adsorption Start of End of Regeneration
conditions of sample desorption desorption substances
A • A • • • 0 0 0
• A • e' g' ~ • • • 0 0 0
0 A 4' • 0 o@o AQ_ e ~®. o®o t~ + +. +. +. + + + + + + + + + +
o 0 • A . ,. • • o 0
0 0 0 A A A • • • • • • 0 0 0 A A A 0 e e
o Starting buffer counter ions : Substance to be separated : Gradient ions
FIGURE 13. The mechanism of ion-exchange chromatography
Other adsorption interactions209 contribute insignificantly to the principle described.
Important factors when deciding on an appropriate resin include the following: size of gel
particles (governs the rate of ion-exchange and sample permeation), degree of cross linkage
(governs the rigidity of the support and swelling capability); functional group type
(describing the type of ion-exchange capability); strength of the functional group (describing
the distribution coefficient) and the number of functional groups (describing the resin
capacity).

60
Varying the pH of the eluent phase changes the degree of ionisation experienced by
the species being separated. This is advantageously used to find a buffer pH causing
optimal adsorption / desorption of the species to be separated. A gradient mixing device209
can be used to increase the ionic strength of the buffer chosen over time, and enables
selective desorption of the ionically bound sample. This technique has been used to
separate the acid polysaccharide antigen of Klebsiella K21 210, K32 210 and K26211 from the
contaminating neutral O-antigen polysaccharide.
Detection of carbohydrate has historically been conducted by detection of a colour
change reaction, e.g. the Phenol-sulphuric acid test204, although the efficiency of another
non-corrosive reagent212 has been published.
IR-120 H + proton exchange resin is used in this laboratory to de-ionise
oligosaccharide material prior to and after work up procedures. Special utility was found in
the removal of lithium ions from the polysaccharide of Klebsiella K437, after the lithium
degradation.
lon-exchange chromatography is important for the purification of contaminated
bacterial polysaccharides. The technique is relatively quick, extremely sensitive in
discriminating between similar ionic environments, and is economical as the resin can
normally be regenerated by washing it with an electrolyte solution of appropriate polarity
and counter ion concentration.
4.1.(iii).d. Affinity Chromatography (AC).
Affinity chromatography falls into the domain of the biochemist and is commonly
employed in the separation of enzymes but has also been applied to purifying
polysaccharides213 . An analogy to ion-exchange chromatography might be drawn but
instead of a specific ion, a biological ligand is covalently bound to a support and brings
about the most specific reversible binding of a molecule.
Scouten213 has concisely described the application and advances in this specialised

61
field, and Wood et al. 214 applied AC to separate oligosaccharide fractions in high yields by
using an anti-I blood group immuno-adsorbent ligand.
4.2. Mass Spectrometry
4.2.(il. Introduction
Mass spectrometry (MS) is widely used in the structural determination of bacterial
polysaccharides and is a highly selective, sensitive technique, e.g. 30 femto mole of a
methylglycose containing-polysaccharide (M w 3515 daltons) has been determined215 . Often
MS is the only technique sensitive enough for determining the minute quantities of
polysaccharide of biological origin. Information obtained from MS techniques216 which is
useful in the structural determination of polysaccharides is the assignment of the position of
linkages, determination of the reducing end monosaccharide, molecular weight
determination, the assignment of an oligosaccharide with respect to the linear arrangement
of monosaccharides if of different molecular weight, and the location of branching structures
along a polysaccharide chain. In 1966 Kochetkov et al. 217 reviewed the field of MS and
described fragmentation patterns produced by carbohydrate molecules.
A sample may be introduced into a spectrometer by a variety of methods. Some inlet
systems used include the cold or heated inlet, the direct insertion probe and a range of
chromatographic inlets. An inlet system, ego a GLC, is interfaced218 with the mass
spectrometer and the choice of interface is dependant on the nature of the sample, the
degree of volitility and sample volme. After recieving the sample from the interface, the
mass spectrometer must perform three distinct functions, ie. the production, separation and
detection of ions.
The production of ions is normally achieved via one of three modes (discussed over
leaf) and the resulting ions are separated by an analyser, which separates ions according to
their mass. A total ion chromatogram is produced which displays each fragment separated
as a function of its mass-to-charge ratio versus its relative ion abundence. A characteristic

62
pattern is produced in the total ion chromatogram and the presence (or absence) of ions
with a particular mass-to-charge ratio and, where present, their relative intensities enable
structural determination.
The usage of HPLC-MS and GLC-MS in research and development environments has
been documented219 . MS systems operate under high vacuum and when coupled to
capillary GLC columns, do not require a carrier gas separator. The interface is heated to
25°C above the column temperature and the detector is set at - 250°C, thus minimising
degradation of thermally laQile oligosaccharides and their volatile derivatives. Ionisation of
the eluent can be finely controlled enabling detection of different positions on the eluting
peak, allowing analysis of peak homogeneity.
Polysaccharides have conventionally been analysed as their derived volatile
oligosaccharides or monosaccharides, e.g. PMAA's because of their acyclic form, volatility
and straightforward fragmentation pattern. However these PMAA's do not allow for
differentiation between stereo-isomers, e.g. 2,3-di-Q-methyl-1 A,5,6-tetra-O-acetylgalactose
and its manno-isomer show the same fragmentation pattern, but comparison of their GLC
retention times enables their identification. Kovacik et al. 222 have demonstrated that
glucuronic acid can be differentiated from galacturonic acid by the relative intensity responce
of the derived PMAA's, but this may be regarded as an exception to the general rule.
A REVIEW OF MASS SPECTROMETRIC IONISATION MODES.
4.2.(ii). Electron ionisation mass spectrometry (e.i-MS)
This technique is considered a harsh ionisation method because of the high energy
used and it produces primary fragments of an oligosaccharide or monosaccharide which may
be further ionised forming secondary fragments. Large data bases of PMAA's GLC retention
times and MS ion fragmentation patterns are available, and serve to finger-print compounds.
Partially methylated alditol acetates undergo specific fragmentations, producing
characteristic fragments of the molecular ion. The molecular ion220 is seldom seen because

63
of the low degree of secondary fragmentation which occurs. The molecular ion undergoes
primary fission 221 between carbon atoms of the monosaccharide chain and in order of
decreasing abundance, fission between two methoxylated carbons, is greater than that
between methoxylated and acetoxylated carbons, which is greater than that between two
acetoxylated carbons (Figure 14.).
Methoxylated ions give the most intense or abundant ion response and acetoxylated
ions the weakest. Careful interpretation of a total ion chromatogram can supply information
necessary to construct the alditol present from first principles.
Rl I
R1 I
R1 I
H~-OMe -e - HC-Ot--1e -e HC=OMe
HC=~e • I • @ HC-OMe HC-OMe
I I I R2 R2 R2
r
Rl I ~
HC-OI-w1e -e - H:=&)e I ,. HC-OAe HC-OAe
I I ~2 R2
II
Rl I
Rl I
R1 I
H~-&Ae - e - HC-OAe HC=OAe - e c I ~ .Et> HC=OAe He-OAe HC-OAe I I I R2 R2 R2
III
FIGURE 14. Primary ion fission

64
Acetic acid (60 mass units mu)
Methanol (32 mu)
Ketene (42 mu)
Formaldehyde (30 mu)
FIGURE 15. Secondary fragments observed:
:H2OAc CH2 I II
HCOM~ - AcOH COMe I
~ I
HC-'&M4 HC=~e
m2'6' mIl, 101
HC=~Me HC=~Me HC=~Me HC=~M~ I -AcOH I -MeOH I - CH2CO I
iOAC • C=O HCOAc ! CH • I I I
HCOMe CHtJMe CH2 CH:l
mZ 101 mlZ 161 m.z 129 mlz 'a7
FIGURE 16. The secondary fragments observed from a primary fragment of (m/z) 161
The use of deuterium labelling by NaBD4 reduction of an oligosaccharide is
indispensable in determining the reducing sugar and is useful in identifying linkage points.
Bj6rndal et al. 223 have discussed the application of deuterium labelling and the resultant
change in ion species formed, whilst Karkkainen224 has similarly reported the identification
of (1 ~3) and (1 ~4) linkages at the reducing monosaccharide by NaBD4 reduction and
analysis of the derived PMAA' s of 21 different methylated trisaccharides .
The reducing monosaccharide of the repeating unit (P1) of the Klebsiella K437
oligosaccharide was identified by NaBD4 reduction of P1, followed by methylation,

65
hydrolysis, reduction and analysis of the derived PMAA's. A 1,2,4,5,6-penta-O-methyl-3-0-
acetylhexitol was observed in the total ion chromatogram and was identified as a
pentamethylated galactitol by retention time comparison to an authentic standard in GLC.
The identification of a m/z fragment of 206 and not 205 demonstrated that the C-1
of the galactose had incorporated deuterium, see Figure 17.

66
FIGURE 17.
An e.i.-MS study on an isolated 1,2,4,5,6,-penta-Q-methyl-3-0-acetylhexitol from the
deuterium reduced Klebsiella K43 P1 .
4.2. (iii)
H
I MeO-C-D
--------46 (1) MeO H
--------44 (2) H OAc
--------72 (3) H OMe ~ e.i.-MS
--------44 (4) H OMe
--------44 (5 ) H-C-OMe
I H --------45
Mr = 295 (1,2,4,5,6-penta-Q-methyl-3-Q-acetylhexitol)
Primary fragments observed
1) mjZ 249 2) mjZ 206
Secondary fragments observed
1) mjZ 129 2) mjZ 101 3) mjZ 87
Scission at (1) scission at (4)
loss of - AcOH loss of - CH20H
Chemical ionisation mass spectrometry (c.i.-MS)
This technique is considered to be a softer method of sample ionisation than e.i.-MS
and allows the maintenance of the molecular ion 1M +). A less complex total ion
chromatogram results due to less degradation of ionised species and c.i-MS has been
reviewed by Munson225,226. An ion-molecule interaction occurs in the production of a c.i.-
mass spectrum and the production of molecular weight ions enables abundant molecular ion
and primary ions to be observed.

67
C.i.-MS total ion chromatograms are acquired by a two step mechanism218 . An
ionising reactant gas, e.g. methane, is ionised by e.i.-MS which produces the molecular ion
of methane and other lesser ion fragments.
+ CH3 ' mjzlS
+ CH2 ' mjz14
CH+, mjz13
C+ mjz12
These species enter a chamber of lower vacuum allowing ion-molecule or ion-
(reactant gas-molecule) reactions to occur.
e.g. CH4+ + CH4- CHS+ + CH3 mjz17
CH4 + CHS+- C2HS + + 2H2 mjz29
CH4 + + + C2HS --to. C3HS + 2H2 mjz4l
The sample being analysed is bombarded by a beam of these high molecular weight
ions and on collision, the sample is converted to a protonated positive ion, i.e. (M + CH4 +)
- (M + 1) +. Adjunct ions are formed when less abundant ion species, i.e. m/z 29 and 41
successfully ionise the sample,
e.g. M + C2HS +- (M + 29) +
M + C3Hs +--(M + 41)+
Hancock et al. 227 have used c.i.-MS in the assignment of Q-acetyl-O-methylalditols
68
from methylation analysis and have reported that the (M + 1) + ion is helpful in solving the
ambiguities found in the e.i.-MS total ion chromatogram. McNeil et al. 228 reviewed the
utility of HPLC-c.i.-MS in elucidating the structure of oligosaccharides. Interestingly the
HPLC solvent, after volatilization can be used as a reactant gas, permitting direct analysis of
the HPLC eluent of derived PMAA's oligosaccharides. They were also able to use different
concentration gradient mobile phases and analyse the eluent purity, and establish the
presence of particular peracetylated oligosaccharides alditols in the HPLC eluent by selective
reconstruction of ion chromatograms.
The molecular ion215 (M + 1) is invaluable in the determination of sample molecular
weight. Although c.i.-MS has advantages over e.i.-MS, the possibility of, e.g. proton
abstraction (M - 1) + and charge transfer reaction, e.g. the loss of water [(M + 1) -
18] + must always be considered in the interpretation of spectra. The molecular ion may be
generated by, e.g. field ionisation229, field desorption230,231 but each imposes
prerequisites on the form of the sample, and in particular field desorption involves
complicated sample preparation.
4.2.(iv). Fast Atom Bombardment Mass Spectrometry, (f.a.b.-MS)
F.a.b.-MS has proved invaluable in the elucidation of complex polysaccharides over
the past 13 years and is the "softest" fission method used. De1l231-233 and co-workers
have periodically reviewed f.a.b.-Ms methods and through their efforts to develop special
applications for the technique, have moved the frontiers of f.a.b-MS forward.
F.a.b.-MS maintains the molecular-ion in the total ion chromatogram but does not
impose the need to produce a gaseous sample prior to ionisation, thus enabling analysis of
liquids and solids. It is useful in the determination of thermally labile, non-volatile
oligosaccharides and small polysaccharides, and is able to determine their molecular weight.
Molecular weights are not artificially increased and because multi-fragmentation processes
are not observed, direct characterisation of oligosaccharide mixtures234 is possible. Both
derivatised and underivatised samples can be analysed and spectra may be acquired in the
positive or negative ion modes. F.a.b.-mass spectra of lower homologue oligosaccharides

69
have been analysed at ambient temperatures231 but the Q-acetylated oligosaccharides
require higher temperatures.
A f.a.b.-mass spectrometer consists of a cold cathode discharge ion-source
producing argon + ions of kinetic energy, 1-8 keV. Spluttering of ions by fast ion
bombardment235,236 (SIMS) is used to overcome the inadequacies of e.i.- and c.i-MS
ionisation, and produces both negative and positive ion mass spectra. Problems
encountered 237 in f.a.b.-MS are overcome by a beam of neutral atoms used as "spluttering"
medium. The neutral argon atom beam is generated by the passage of the above argon +
ions through a collision chamber of argon gas. The emitted beam contains argon atoms of
higher velocity to that of the ions which allows ion spluttering from the sample, i.e. (M +
H +) and (M - H +) ions are detected.
The sample is deposited on a stage and a matrix of glycerol, thioglycerol or 3-
nitrobenzyl alcohol238 , depending on the sample character, is used, and is irradiated with
high velocity argon atoms.
Polysaccharide molecular ion species may be stabilised by the addition of an alkali
ion, e.g. sodium or potassium. 80ss0234 has reported MS analysis of underivatised
oligosaccharide material by positive recording mode, e.g. (M + H +) and (M + Na + IK +).
Use of the negative mode molecular anion (M - 17)- was useful for acylated or charged
acidic polysaccharides and a range of adduct ions, e.g. NH4' Cu, CI were used. The choice
of adduct was found to be important for accurate determination of pseudomolecular ions.
Oell233 has reported the use of negative ion spectra which enables the elucidation of
fragments from the non-reducing end of an oligosaccharide. These molecular weight ions
are indicative of the sequential structure of the material, but are only useful where the
polysaccharide is composed of sugars of different sizes. Oell 253 has also determined the
molecular weight of Klebsiella polysaccharides (unspecified serotypes), and the degree of
acetylation from derived permethylated and peracetylated material of 0.5 - 1.0pg. Molecular
weight calculation of material > 1 0 000 daltons was also determined from the non-reducing
end and structural elucidation performed.
Pappa et al. 238 have found that peracetylated polysaccharides produced superior

70
scission of the carbon-oxygen bonds of the backbone structure of polysaccharides and the
use of f.a.b.-MS enabled both internal and external linkage scission. They also report the
use of NaBD4 reduction of the polysaccharide for the detection of naturally occurring
hydroxyl groups, from those introduced by periodate oxidation performed on this material.
The mode of MS ionisation used is therefore dependent on the information required,
and the quantity and properties of the carbohydrate under investigation. The use of e.i.-MS
might complement other techniques where secondary scission is required, but interpretation
of data necessitates a thorough understanding of the ion fragments produced and their
natural abundance.
4.3. Nuclear Magnetic Resonance Spectroscopy (NMR)
4.3.(i). Introduction
NMR spectroscopy is the most powerful spectroscopic method for complete
structural analysis of polysaccharides. Information obtained from an NMR experiment has
been compared analogously to information obtainable from a person standing on a proton
and looking about this position, seeing structural features, shadows and reflections of
distant features.
The structural analysis of small molecules was initially conducted in the continuous
wave mode (eW). However, multiple pulse-Fourier transform NMR spectroscopy (FT-NMRI
is now routinely used and can achieve complete structural and conformational elucidation of
complex macromolecules.
A modern spectrometer consists of a stable super-conducting magnet, a detection
probe, e.g. 1 H-probe, and a radio frequency (rf) generating system coupled to a dedicated
computer which controls the acquisition cycle, and the manipulation of digital information.

71
4.3.(ii). One Dimensional Spectroscopy (10 NMR)
In contrast to continuous wave NMR, multiple pulse Fourier transform
experiments239 stimulate a specific range of frequencies within the sample by the induction
of a pulse(s) of rf energy, and the response of the system is measured as a function of time
by a digital computer. The time domain is converted mathematically by the Tukey-Cooley
Fast Fourier Transformation240 producing a frequency domain fl' After a sensitive nucleus
aligns itself along the induced magnetic field, the magnetisation can be perturbed by a
second field oscillation at an appropriate rf dependent on the pulse program software used,
and the signal decays by free induced decay (FlO). All 10 NMR acquisitions are determined
by three component parameters, (Figure 18.).
Preparation Evolution
~D) +---------~I~f----------~9.~--------~~
FIGURE 18.
The evolution time in a pulse FT-NMR experiment is that variable which enables the
generation of useful information via a second induced rf, i.e. it provides an opportunity of
refocussing the state of the spin system before detection, allowing improved spectral241
resolution.
4.3.(ii).a. 10 1H-NMR spectroscopy of bacterial polysaccharides.
A 10 1 H-NMR spectrum produces the following structural information: the
monosaccharide type, anomeric form and in some cases coupling constants for some

72
resonances in the anomeric region. The use of certain 10 NMR pulse programs, e.g.
HOHAHA239 and INEPT241 help to simplify 10 NMR spectra enabling chemical shifts to be
identified unambiguously. The structures of small molecules are usually elucidated solely by
10 NMR, but bacterial polysaccharides usually require a variety of 20 NMR experiments to
assign the sequence and linkage points, due to the heavy overlap of resonances in the ring
region, i.e. H-2,H-3, H-4 etc. Klebsiella bacterial polysaccharides show a high degree of
viscosity. Spin-spin relaxation242 times are shortened as the viscosity of the sample
increases and broad spectral lines develop leading to poor spectral resolution. Increasing the
sample temperature can marginally improve resolution and for this reason 10 NMR spectra
of the native polysaccharide serve mainly to determine the type and number of anomeric
linkages, (Figure 19)

73
HDO
Ring rot on.
Acetone
Anomeric region
~. j~ ~-1U}L- Vtv V
i-' i I i i I I i I i I i i i i I i i i i I i i i i I i i i i I i i i
5.0 4.5 4.0 3.5 3.0 2.5
FIGURE 19. A 1 D 1 H-NMR spectrum
Polysaccharide depolymerisation using a bacteriophage, usually produces an
oligosaccharide chemical repeating unit, the spectra of which are well resolved and easier to
analyse than those of the polysaccharide. However the effects of the mutarotation of the
reducing end monosaccharide can complicate the spectra. Conversion of the reducing end
to the alditol usually simplifies the spectrum and simultaneously identifies the reducing
monosaccharide.
Tetramethylsilane (T.MS), assigned a chemical shift of 0.00 ppm, is not used as an
internal standard in polysaccharide spectroscopy because it is not water soluble. 1 H-NMR
studies on polysaccharides use acetone, resonating at B 2.23 as the internal standard.
Figure 19. depicts the various proton chemical shift regions of carbohydrates. Non-
carbohydrate appendages are also detected, e.g. the CH3 of Q- and N-acetate resonate as
singlets at B 1.92 - 2.05 and pyruvate at 8 1.45-1.6.
Assignment of some residues by comparison with methyl glycosides243 is possible,
but it should be noted that chemical shifts are dependent on solvent used, and the
temperature of acquisition. Table 5. lists chemical shifts and coupling constants for a few
methyl glycosides and that of galactitol.

74
Table 5.
Standard D-Hexopyranoside methyl glycoside243 NMR shift values in ppm.
Proton or Carbon
5 60. 6b
~ .. Gal H 4.84 3.83 3.79 3.79 3.89 3.78 3.72
J 3.0 9.8 2.3 1.0 ----- 8.2/ 4.6 12.0
C 100.1 69.2 70.5 70.2 71.6 62.2
B-Gal H 4.31 3.50 3.64 3.92 3.68 3.80 3.75
J 8.0 10.0 3.8 0.8 ----- 7.6/ 4.4 11.2
C 104.5 71.7 73.8 69.7 76.0 62.0
B-Man H 4.58 3.99 3.64 3.57 3.38 3.94 3.74
J 0.9 3.2 10.0 10.0 ----- 2.21 6.7 12.2
C 101.3 70.6 73.3 67.1 76.6 61.4
Cl.Man H 4.77 3.93 3.76 3.64 3.62 3.90 3.76 '.
J 1.6 3.5 10.0 10.0 ----- 1.9/ 5.8 12.0
C 101.9 71.2 71.8 68.0 73.7 62.1
B-Glc H 4.38 3.26 3.49 3.38 3.47 3.93 3.57
J 8.2 9.6 9.6 9.6 ----- 2.4/ 6.4 12.8
C 104.0 74.1 76.8 70.6 76.8 61.8
Galactitol C 64.5 71.5 70.7 70.7 71.5 64.5
75
If coupling constants are available, residue identification can be made from first
principles because these values are independent of solvent or temperature of the experiment.
The coupling constant for H-1 and H-2 protons when large (J,,2 - 6-8 Hz) is indicative of a
trans-diaxial orientation, i.e. in gluco- and galacto- types this is indicative of a B-linkage.
Small J values (J'.2 1-4 Hz) confirm an (i·linkage with small dihedral angle. Mannose
residues because of their proton stereochemical configuration, give J values (J, ,2 1-4Hz) for
both anomers and little information is gleaned. 1 D 'H-NMR also allows the establishment of
ring size, viz. the anomeric signal for a ... pyranose residues is found at (6 5.0 - 5.5) with a
small J value, and B-pyranose residues at (6 4.5 - 5.0) with a large J value, while the
anomeric signal for 4-furanose residues resonates further downfield than their pyranose
forms.
The polyhydroxyl nature of a monosaccharide produces a complicated ' H spectrum,
which can be simplified by exchanging a reactive hydroxyl proton with deuterium245 as
described in the experimental. This removes the hydroxyl proton signal, and a
monosaccharide will show seven protons and an uronic acid five protons. A residual water
peak, (HOD), can be observed in the anomeric region and is often superimposed on anomeric
proton resonances. Varying the temperature usually shifts the HOD peak adequately to
uncover the hidden resonances. Vliegenthart et al. 246 have described the application of 500
MHz 1 D ' H-NMR spectroscopy in the determination of the primary structures of
polysaccharides and have emphasised the utility of structural reporter groups, i.e. signals of
individually resonating protons. At this point the purity of the material, the need to
depolymerise the polysaccharide, and the need for extra NMR experiments will be evident
from the 1 D 'H-NMR spectrum.
10 Homonuclear Hartmann-Hahn Spectroscopy (HOHAHA)
The HOHAHA 1 D-NMR pulse sequence has been used by Bax247 in determining 1 D
NMR coupling constants after proton chemical shift assignment. It becomes useful in the
determination of coupling constants of non-anomeric protons. Sub-spectra of a relayed spin

76
system are formed by transfer of magnetisation through the related spin -spin system by the
HOHAHA pulse sequence. Morris and Freeman248 have reported the use of the (INEPT)
pulse sequence. Polarization transfer is non-selectively achieved and after the application of
a 90° pulse, a characteristic spin system inversion results.
4.3.(ii).b. 10 13C-NMR Spectroscopy
Once the 1 D 1 H-NMR spectrum has been assigned as completely as possible, the
next useful nucleus with / = (1/2) is l3C, but its low natural abundance of 1.1 % imposes a
constraint on its detection and a large sample mass is needed. The spin-lattice relaxation
rate is also longer than that of the proton nucleus and the acquisition time is longer than the
1 D lH-NMR.
Broad band decoupling239 has been used to increase the sensitivity of l3C detection,
i.e. by removing 1 H_13C spin-spin coupling, detection of l3C is achieved with greater
sensitivity by means of the nuclear Overhauser effect. Sadler249 has given a detailed
account of the various l3C pulse programs used in the acquisition of resonances.
1 D NMR l3C spectra250 are simple in comparison to 1 H spectra because the low
abundance of l3C nuclei do not produce coupled signals, and polysaccharide chemical shifts
are shifted over a range of (15-185 ppm). Figure 20. details regions of the l3C spectrum
similar to those seen in the 1 H spectrum, i.e. anomer region etc. A carbonyl signal
corresponding to the uronic acid carboxylic acid is found far down field (160-180 ppm) and
the internal standard acetone resonates at 31.07 ppm Non-carbohydrate appendages, e.g.
CH3 of acetates resonate upfield at (23-25 ppm). Anomeric signals are of strong intensity
and ,,"pyranose residues are found at (95-100 ppm), while I:?-pyranose residues are found at
(100-105 ppm).
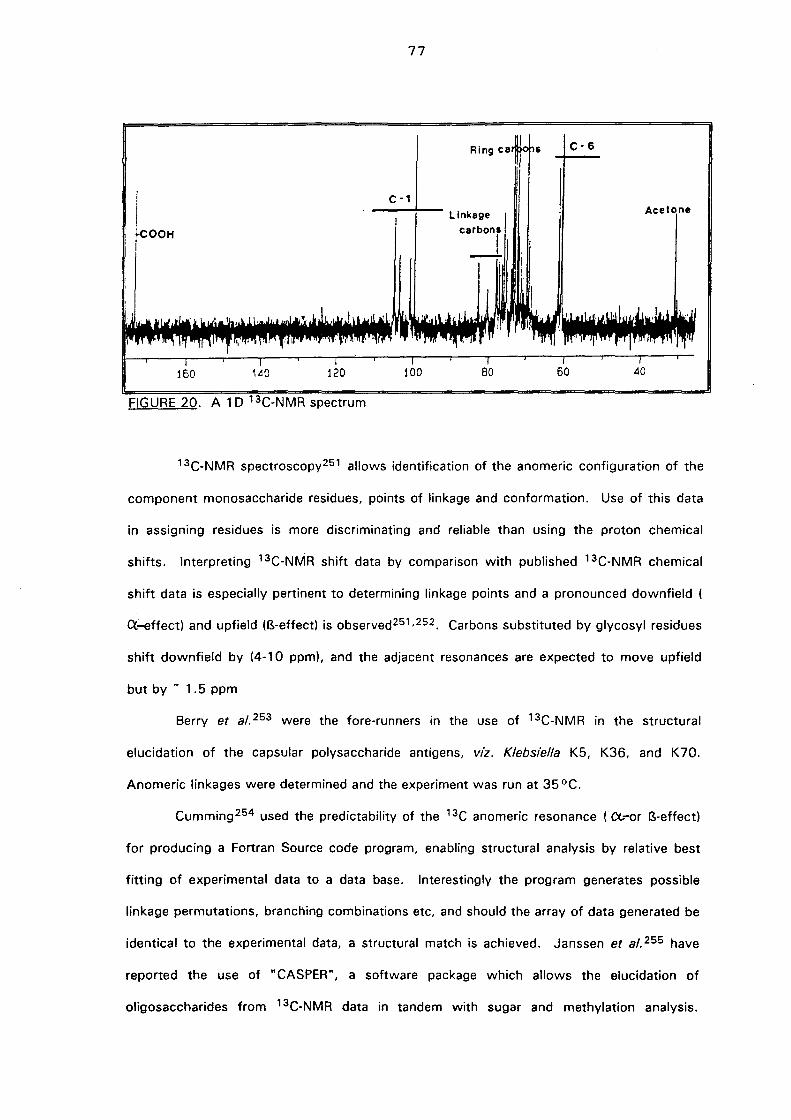
77
c -,
H
FIGURE 20. A 1 D 1 MR spectrum
Ring
linkage carbon
C-6
Ace
13C-N MR spectroscopy251 allows identification of the anomeric configuration of the
component monosaccharide residues, points of linkage and conformation. Use of this data
in assigning residues is more discriminating and reliable than using the proton chemical
shifts. Interpreting 13C-NMR shift data by comparison with published 13C-NMR chemical
shift data is especially pertinent to determining linkage points and a pronounced downfield (
CX-effect) and upfield (B-effect) is observed251 ,252. Carbons substituted by glycosyl residues
shift downfield by (4-10 ppm), and the adjacent resonances are expected to move upfield
but by - 1.5 ppm
Berry et al. 253 were the fore-runners in the use of 13C-N MR in the structural
elucidation of the capsular polysaccharide antigens, viz. Klebsiella K5, K36, and K70.
Anomeric linkages were determined and the experiment was run at 35 DC.
Cumming 254 used the predictability of the 13C anomeric resonance (wor B-effect)
for producing a Fortran Source code program, enabling structural analysis by relative best
fitting of experimental data to a data base. Interestingly the program generates possible
linkage permutations, branching combinations etc, and should the array of data generated be
identical to the experimental data, a structural match is achieved. Janssen et al. 255 have
reported the use of "CASPER", a software package which allows the elucidation of
oligosaccharides from '3C-NMR data in tandem with sugar and methylation analysis.
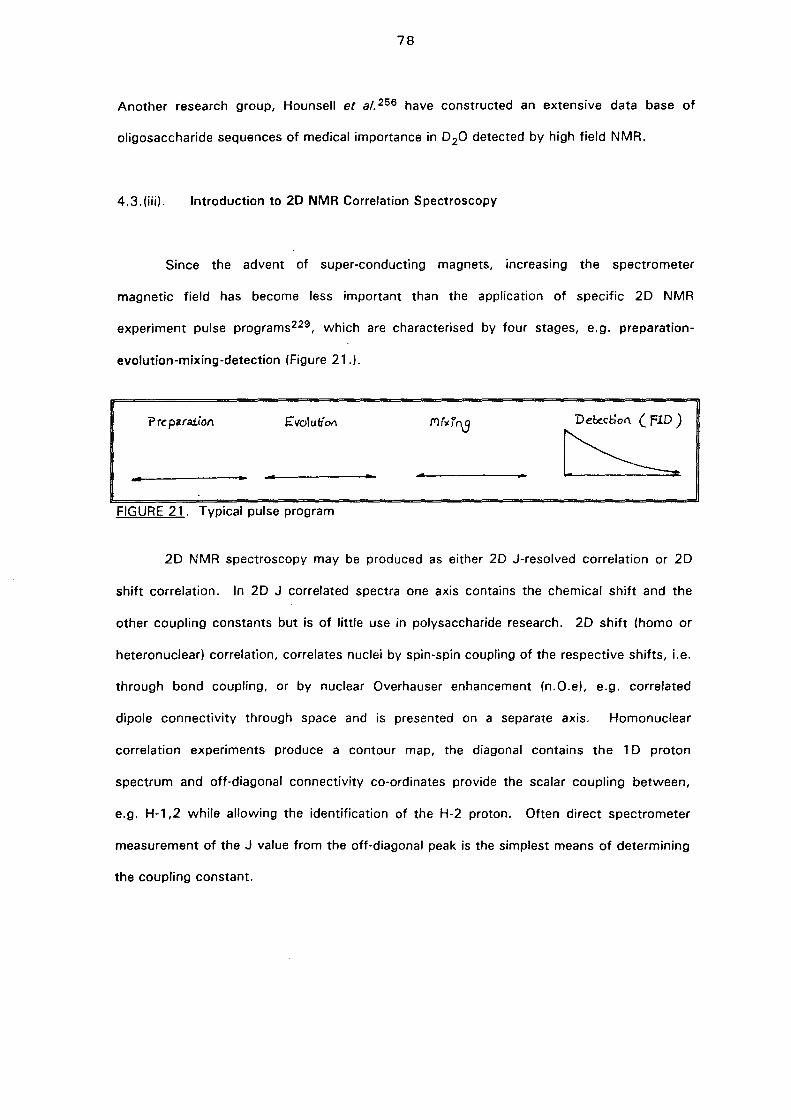
78
Another research group, Hounsell et al. 256 have constructed an extensive data base of
oligosaccharide sequences of medical importance in 0 20 detected by high field NMR.
4.3.(iii). Introduction to 20 NMR Correlation Spectroscopy
Since the advent of super-conducting magnets, increasing the spectrometer
magnetic field has become less important than the application of specific 20 NMR
experiment pulse programs229 , which are characterised by four stages, e.g. preparation-
evolution-mixing-detection (Figure 21 .).
? rc paraiiOll E::IfO\utiOfl Det:cctio(\ (FlD )
~ __ ~ ____________ ~ _4~--------~._ • ...
FIGURE 21. Typical pulse program
20 NMR spectroscopy may be produced as either 20 J-resolved correlation or 20
shift correlation. In 20 J correlated spectra one axis contains the chemical shift and the
other coupling constants but is of little use in polysaccharide research. 20 shift (homo or
heteronuclear) correlation, correlates nuclei by spin-spin coupling of the respective shifts, i.e.
through bond coupling, or by nuclear Overhauser enhancement (n.O.e), e.g. correlated
dipole connectivity through space and is presented on a separate axis. Homonuclear
correlation experiments produce a contour map, the diagonal contains the 10 proton
spectrum and off-diagonal connectivity co-ordinates provide the scalar coupling between,
e.g. H-1,2 while allowing the identification of the H-2 proton. Ohen direct spectrometer
measurement of the J value from the off-diagonal peak is the simplest means of determining
the coupling constant.
79
4.3.(iv). 20 NMR Homonuclear Correlated Spectroscopy
4.3.(iv).a. Correlated spectroscopy (COSY).
'H-'H COSY was the first 2D NMR experiment and has been reviewed242.257.258.
Other nuclei which have been correlated are 13C_13C, e.g. Goux et 81. 259 successfully
studied peracetylated mono- and oligosaccharides by introducing '3C enrichment via an
acetylation step.
In the 2D COSY contour plot the 1 D ' H-NMR spectrum is plotted on the diagonal
and off-diagonal cross peaks depict the chemical shift of mutually coupled spin systems.
Magnetisation is detected by the collection of the FID on the f2 axis while the f, axis
analyses the spin system during the evolution period. Subsequent Fourier transformation of
this f, data enables the COSY contour map development (Figure 22.).

80
H-3
· · H-2 · · - -_ •• i> I
H·I . ( 62 , 63 ) I I _._- ..
( 6, • 62 )
FIGURE 22. 2D Cosy correlation map
I'S
Transmitter n ... _______ _ ___ r-:l _ R_e_Ce_i\_'e_r ___ --'1 Acqui: - :on: l
Time---_~
FIGURE 23. The cosy pulse sequence
The pulse sequence, (Figure 23) of the COSY 90 begins with a 90 0 pulse which
disturbs the spin system and evolution takes place. The second pulse disturbs the relaxing
spin system and detection occurs. The first pulse causes the induced vector to precess in
the xy plane, after the evolution time the vector is aligned along the y axis and the second
90 0 pulse aligns it with the z axis. The evolution time is incrementally increased producing
data in the f2 plane describing chemical shift and coupling. The second Fourier transform
enables correlation of this data with shifts on the fl plane.
The COSY 45 is a program using a 45 0 second pulse and has its advantages and
problems 239,258. Sanders239 suggests using a yet to be recognised COSY 60, as used by
them for optimal homonuclear correlation.
4.3.(iv).B. Relay COSY.
The relay COSY pulse program260 is a hybrid of the original COSY. Magnetisation is
transferred between protons not mutually coupled, provided both resonances are coupled to
a third central proton. The acquisition parameters are adjusted to optimise the intensity of
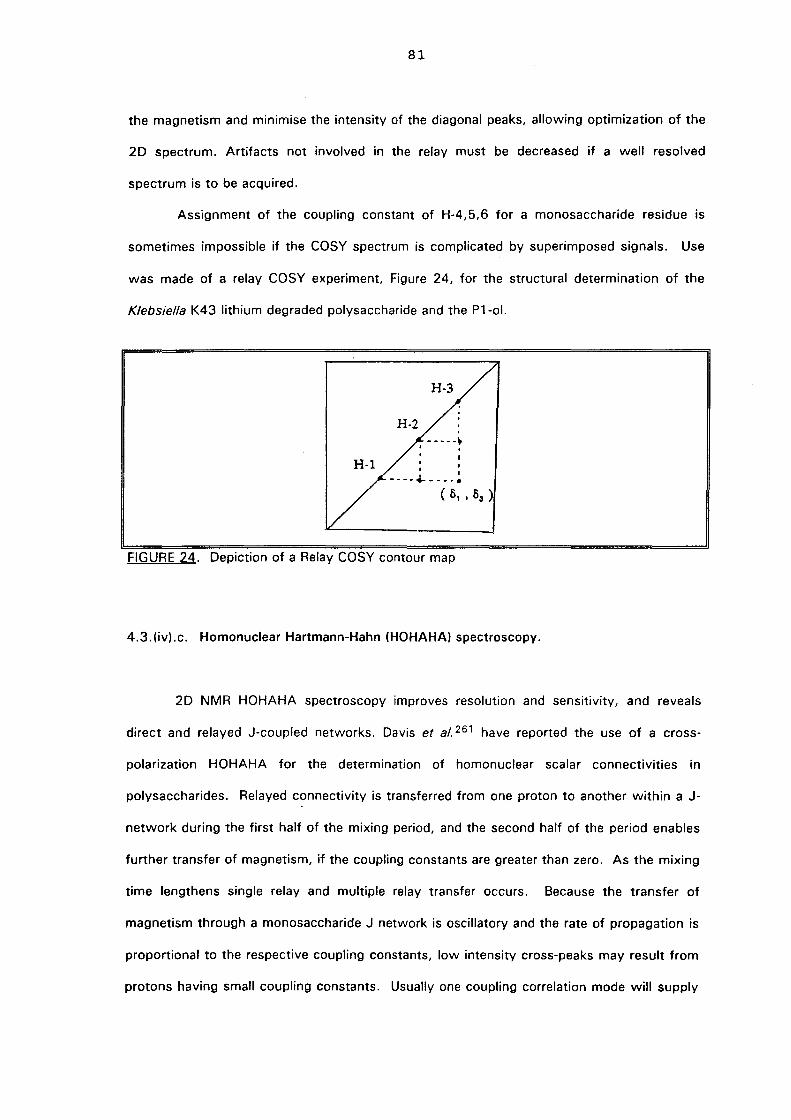
81
the magnetism and minimise the intensity of the diagonal peaks, allowing optimization of the
2D spectrum. Artifacts not involved in the relay must be decreased if a well resolved
spectrum is to be acquired.
Assignment of the coupling constant of H-4,5,6 for a monosaccharide residue is
sometimes impossible if the COSY spectrum is complicated by superimposed signals. Use
was made of a relay COSY experiment, Figure 24, for the structural determination of the
Klebsiella K43 lithium degraded polysaccharide and the P1-01.
: : ---- ..... ----. ( 8, • 83 )
FIGURE 24. Depiction of a Relay COSY contour map
4.3.(iv).c. Homonuclear Hartmann-Hahn (HOHAHA) spectroscopy.
2D NMR HOHAHA spectroscopy improves resolution and sensitivity, and reveals
direct and relayed J-coupled networks. Davis et al. 261 have reported the use of a cross-
polarization HOHAHA for the determination of homonuclear scalar connectivities in
polysaccharides. Relayed connectivity is transferred from one proton to another within a J-
network during the first half of the mixing period, and the second half of the period enables
further transfer of magnetism, if the coupling constants are greater than zero. As the mixing
time lengthens single relay and multiple relay transfer occurs. Because the transfer of
magnetism through a monosaccharide J network is oscillatory and the rate of propagation is
proportional to the respective coupling constants, low intensity cross-peaks may result from
protons having small coupling constants. Usually one coupling correlation mode will supply

82
data deficient in another.
All resonances of a· system will seldom be relayed down to the H-l track of the
HOHAHA, but assignment of proton spectra from, e.g. the H-3 track of a studied
monosaccharide might resolve the H-4 and H-5 1 H chemical shifts.
4.3.(iv).d. 20 nuclear Overhauser Spectroscopy (NOESY)
Both sequence and molecule conformation data may be established by the n.O.e
correlation. The pulse sequence used to acquire a 20 NOESY experiment, (Figure 25) has
been reviewed 239 ,242, and Bax262 has reviewed parameters which minimise HOHAHA
effects which diminish the n.O.e. correlation.
------------------------~~
FIGURE 25. Pulse sequence of the NOESY experiment
20 NOESY experiments detect through-space correlation within the van der Waals
connectivity, e.g. a distance of -4 A or less. After the proton shifts have been acquired via
COSY etc., the three dimensional structure can be determined by use of the distance
sensitive n.O.e. in conjunction with coupling constant data240 . The use of J resolved 20
spectra may be useful in detecting coupling constants of crowded, overlapping spectra.
Bundle et al. 263 have used NOESY correlation in the determination of the
conformation of a polysaccharide antigen of a Salmonella serotype, and in this thesis the
sequence of the backbone structure of the Klebsiella K437 antigen was confirmed by NOESY
correlation.
83
4.3.(iv).e. 20 nuclear Overhauser Spectrometry, (ROESY)
The ROESy264-267 experiment is useful for n.O.e. observation in small molecules. It
is performed by a rotating frame n.O.e. experiment known as 2D Cross-Relaxation for Mini
molecules Emulated by spin-locking, (CAMElSPIN).
The advantage266 of the ROESY experiment over conventional NOESY correlation is
that it has a different dependence on molecular tumbling than the NOESY experiment. When
an intermediate size molecule is observed, the NOESY experiment will usually produce a
small or zero enhancement. ROESY on the other hand is less influenced by spin differences
and better resolved correlation cross-peaks are observed, i.e. in medium sized molecules264
cross-peak intensity is often close to zero when the correlation time approaches the vicinity
of the larmor frequency of the proton in the NOESY experiment, and here ROESY may be
helpful. It may also be beneficial to larger molecules where poor n.O.e. enhancement is
witnessed.
Negatively the ROESY correlation is difficult to interpret and the spectra are
complicated by a non-uniform degree of spin locking, and sometimes non-uniform excitation
occurs.

84
4.3.(v). Heteronuclear Correlated NMR Spectroscopy
4.3.(v).a. '3C-detected, 'H_13C correlation NMR Spectroscopy
4.3.(v).a.i. Heteronuclear Correlation spectroscopy (HETCOR)
One bond 1 H_13C nuclear coupling242.249 is detected under the control of a proton
decoupled 13C-NMR pulse program, e.g. WALTZ-16239, which alleviates the temperature
gradients induced by other decoupling pulses relying on higher energy rf pulses. WALTZ
brings about broadband l3C decoupling during acquisition of the 1 H FlO, so that the final
proton multiplets contain only homo nuclear couplings. Proton chemical shifts are depicted
on the f 1 axis and l3C shifts on the f 2 axis. The generated spectrum enables the identity of
previously assigned shift data to be checked by their C-H connectivity, and assists in
monosaccharide residue identification. Spectra are found to be well resolved if the sample
mass is > 15 mg, but the acquisition of spectra is time consuming.
Proton spin polarization242 is transferred to a l3C through a one bond coupling. The
delay period is varied and allows the magnetisation and phase of the transferred signal to be
dependent on the proton chemical shift.
Spectrometer time is often at a premium and Uhrin et al. 268 reported in 1992 the
use of a 1 H chemical shift filter technique which acquires the coupled l3C spectrum in a 10
experiment. No knowledge of J (C-l ,H-l) values is necessary and this is a highly selective
technique relying only on the proton shift responsible for the carbon connectivity.
4.3.(v)'b. 1 H-detected 1 H_13C Heteronuclear Correlation Spectroscopy
Inverse detection247,268 of a l3C nucleus by a more sensitive correlated 1 H nucleus
has produced a significant advance in 20 NMR spectroscopic resolution. A smaller sample
mass, e.g. 1-2 mg of oligosaccharide is sufficient to produce a well resolved spectrum, and
the acquisition time247 can be 1/10 to 1/20 of that of the HETCOR experiment. Inverse
probe design has provided the impetus to novel pulse program design and Lerner247 has

85
described instrument requirements for the observation of inverse detected pulse sequences.
Inverse detected 2D NMR was extensively used in the structural elucidation of the
oligosaccharide repeating unit and its reduced alditol form of Klebsiella K437.
4.3.(v).b.i. Heteronuclear Multiple Quantum Coherence Spectroscopy (HMQC)
The HMOC247,269,270 experiment produces a spectrum (Spectrum 31, page 149)
similar to the HETCOR, consisting of a 2D data matrix, with one frequency axis displaying
signals as a function of their 13C Chemical shifts, and another according to their 1 H
chemical shifts. Directly linked C and H atoms are depicted by a contour level correlation
point.
The generation of multiple quantum coherence between 1 Hand 13C energy levels is
achieved allowing correlations between directly-bonded 1 Hand 13C resonances when 13C
decoupling is used. The utility of the HMQC technique is witnessed in its ability to assign
carbon shifts from noted 1 H shifts, or vice versa. When 13C decoupling is not used during
acquisition, correlation peaks in the 2D spectrum appear as low intensity doublets in the 1 H
dimension. The separation between signals is equal to a one-bond 1 H_13C coupling
constant, and this may be useful in determining the anomeric stereochemistry of a
monosaccharide. The BIRD247 pulse is used to decouple 13C resonances, and signals
originating from protons, with long-range coupling to 13C atoms, are removed by phase
cycling of a second 90° 13C pulse.
4.3.(v).b.ii. Heteronuclear Multiple Quantum Coherence - Total Correlated Spectroscopy,
(HMQC - TOCSY)
Through the combination of the heteronuclear correlation, HMOC, with the TOCSY
pulse program, all resonances of a particular residue are coupled regardless of whether they
are directly or indirectly coupled. An HOHAHA effect is obtained, allowing relayed
86
coherence throughout the system, and all bonded protons and carbons in the spin system
are related. The result is an elaborate depiction of all H-C cross-peaks within the system.
Figure 26 depicts the complete assignment of the 1 H- 13C resonances for the
terminally linked ~-D-mannose residue of Pl-ol. The rectangular area is formed by a 1 H- 13C
connectivity at each corner. For example a rectangle is generated by H1Cl, H1C2, H2Cl,
H2C2 etc.

87
CSHs SHS
C> 0 C4 H4
• Ca 5 70
0 '0 • 10 000
• ~
tj QO Cs1-i.3 CSHS 80 ... I • ••• ••
90
C,H, 100 00 •
ex> ••• OlD ppm
I I I I I I I ppm 5.00 4.75 4.50 4.25 4.00 3.75 3.50
FIGURE 26, B-D-Mannose HMQC-TOCSY correlation contour map
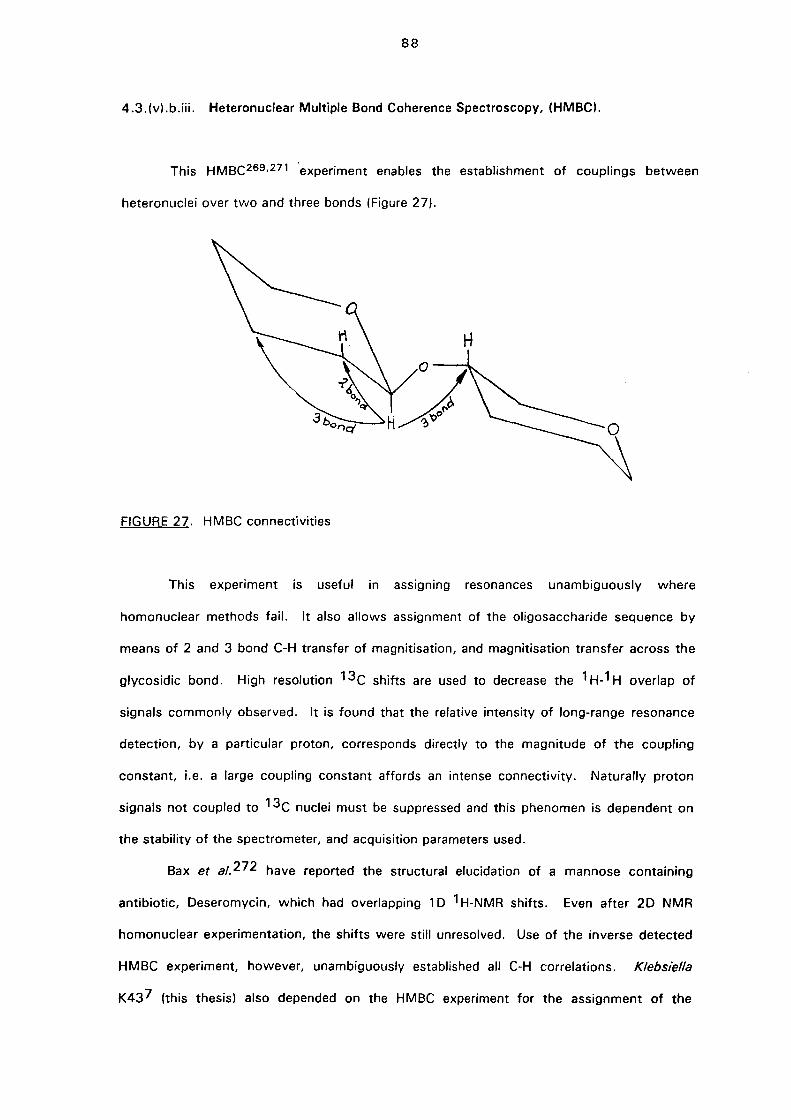
88
4.3.(v).b.iii. Heteronuclear Multiple Bond Coherence Spectroscopy, (HMBCI.
This HMBC269,271 experiment enables the establishment of couplings between
heteronuclei over two and three bonds (Figure 27).
FIGURE 27. HMBC connectivities
This experiment is useful in assigning resonances unambiguously where
homonuclear methods fail. It also allows assignment of the oligosaccharide sequence by
means of 2 and 3 bond C-H transfer of magnitisation, and magnitisation transfer across the
glycosidic bond. High resolution 13C shifts are used to decrease the 1 H_l H overlap of
signals commonly observed. It is found that the relative intensity of long-range resonance
detection, by a particular proton, corresponds directly to the magnitude of the coupling
constant, i.e. a large coupling constant affords an intense connectivity. Naturally proton
signals not coupled to 13C nuclei must be suppressed and this phenomen is dependent on
the stability of the spectrometer, and acquisition parameters used.
Bax et al. 272 have reported the structural elucidation of a mannose containing
antibiotic, Deseromycin, which had overlapping 1 D 1 H-NMR shifts. Even after 2D NMR
homonuclear experimentation, the shifts were still unresolved. Use of the inverse detected
HMBC experiment, however, unambiguously established all C-H correlations. Klebsiella
K437 (this thesis) also depended on the HMBC experiment for the assignment of the
89
repeating unit, which showed several unresolved, overlapped shifts.
The use of HMBC 2D NMR is increasing and is invaluable, if inverse detection is
possible on the spectrometer. It enables shift assignment of carbohydrate material with
overlapping resonances and may be a useful alternative to the NOESY experiment. The
correlation of heteronuclei over multiple bonds and over the glycosidic linkage permit residue
sequence, linkage and previously ambiguous 1 H_13C assignments possible.

90
5. STRUCTURAL ELUCIDATION OF THE CAPSULAR POLYSACCHARIDE OF
KLEBSIELLA K43
5.0. Abstract
The repeating unit .of the capsular polysaccharide (K-antigen) from the Klebsiella
serotype K437, culture number 2482, was found to be of the "3+2" repeating unit type. The
uronic acid was found as part of a disaccharide side chain and the backbone of the
polysaccharide is a neutral trisaccharide of mannose and galactose.
repeat ~3) -Q-D-Manp- (1~2)- a-D-Manp- (1~3) -Q-D-Galp- (1~ 2 t 1
B-D-GlcpA 4 t 1
B-D-Manp
The repeating unit of the Klebsiella K43 polysaccharide
Structural elucidation was performed by chemical analysis, NMR and GLC-MS studies
on the native polysaccharide, uronic acid degraded oligosaccharide and on the chemical
repeating unit oligosaccharide produced by a bacteriophage degradation of the K437
polysaccharide. The repeating unit structure was confirmed by a Smith degradation experiment
and by 20 NMR spectroscopy performed on both the repeating unit oligosaccharide (P1) and its
reduced form (P1-01).
5.1. Introduction
The structural elucidation of the capsular polysaccharide (K-antigen) of the Klebsiella
serotype K437 forms part of a broader, continuing international program to relate the respective
bacterial antigenic characteristics to their chemical structure.
91
Of 78 serotyped Klebsiella K-antigens, K437 is the 75th to be determined and is the 4th
member of the glucuronic aCid-galactose-mannose chemotype. Other members of this group are
K2086, 21 87, and 7488. The acidic nature of this polysaccharide is determined by a single
glucuronic acid residue found in each repeating unit. The polysaccharide does not contain non
carbohydrate appendages. Consistent with the Klebsiella genus, K437 contains no phosphate.
The serological cross-precipitation reaction, as witnessed by K437 and K5797 in Pneumococcaf12
(XVIII) antiserum, and K437 in Klebsiella K5712 antiserum, suggests that K437 should be
structurally close to K5797.
5.2. Results and discussion
5.2.(i). Isolation and monosaccharide composition
Bacteria of the genus Klebsiella, serotype K437, were propagated on sucrose-rich agar as
described, and the solubilised capsular material was separated from the cells by ultra
centrifugation followed by precipitation of the crude polysaccharide into ethanol. The acidic K
antigen was then separated from the neutral (O-antigen) polysaccharide by the method of
Okutani et al. 103. The acidic polysaccharide component was readily precipitated as the
cetyltrimethylammonium bromide salt from the viscous solution of the polysaccharide mixture.
The relative molecular weight of the sodium and the acidic form of the polysaccharide
was determined by GPC on a dextran-calibrated Sephacryl S-500 column (Figure 28, page 92).
Both forms of the polysaccharide were found to be polydisperse with regard to molecular weight
distribution. The sodium salt polysaccharide had maxima at 1.047 x 10⁷ daltons and at 6.026 x
106 daltons, while the acidic form had maxima at 5.495 x 10⁵ daltons and at 1.318 x 10⁴ daltons.
All polysaccharide fractions showed identical monosaccharide ratios indicating that the
extracted polysaccharide was of a homologous nature, but was probably present as aggregates.
The optical rotation of the purified sodium salt of the polysaccharide was found to be [a
Jo +29°. An acid hydrolysate of the sodium salt of the polysaccharide tested negative for
phosphate181 .
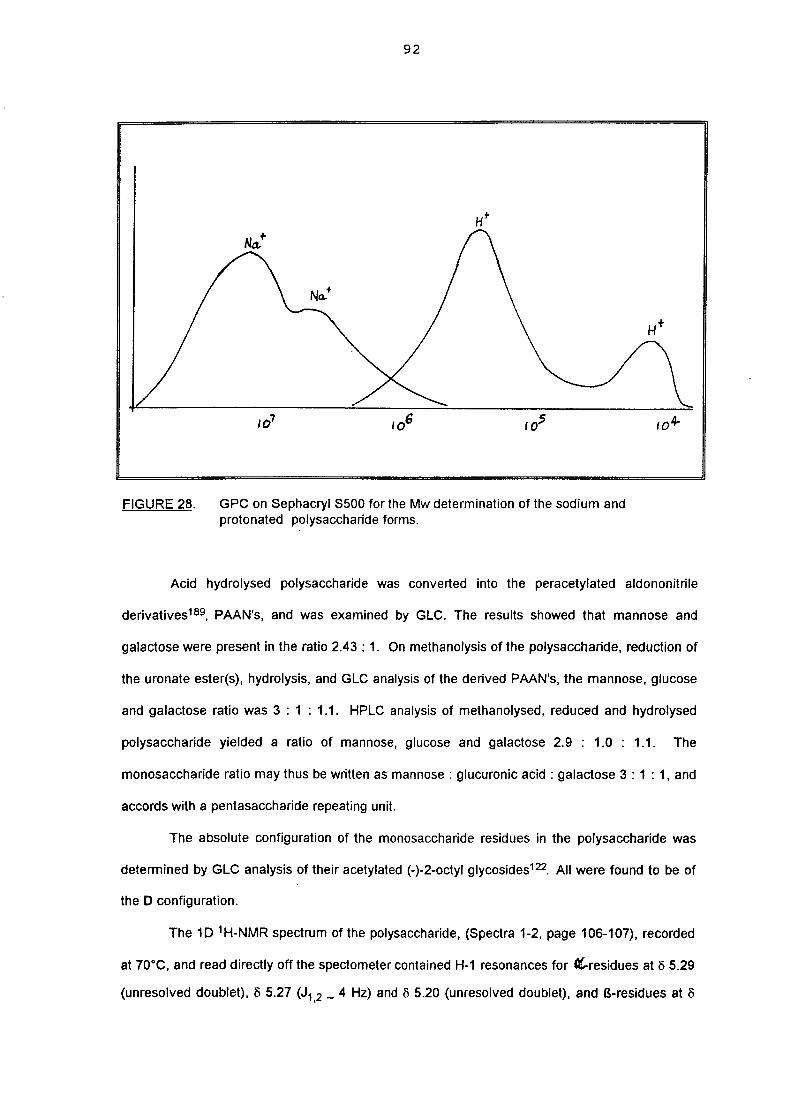
92
FIGURE 28. GPC on Sephacryl S500 for the Mw determination of the sodium and protonated polysaccharide forms.
Acid hydrolysed polysaccharide was converted into the peracetylated aldononitrile
derivatives189, PAAN's, and was examined by GLC. The results showed that mannose and
galactose were present in the ratio 2.43 : 1. On methanolysis of the polysaccharide, reduction of
the uronate ester(s), hydrolysis, and GLC analysis of the derived PAAN's, the mannose, glucose
and galactose ratio was 3 : 1 : 1.1. HPLC analysis of methanolysed, reduced and hydrolysed
polysaccharide yielded a ratio of mannose, glucose and galactose 2.9 : 1.0 : 1.1. The
monosaccharide ratio may thus be written as mannose : glucuronic acid: galactose 3 : 1 : 1, and
accords with a pentasaccharide repeating unit.
The absolute configuration of the monosaccharide residues in the polysaccharide was
determined by GLC analysis of their acetylated (-)-2-octyl glycosides122. All were found to be of
the 0 configuration.
The 10 1H-NMR spectrum of the polysaccharide, (Spectra 1-2, page 106-107), recorded
at 70°C, and read directly off the spectometer contained H-1 resonances for «:'residues at 6 5.29
(unresolved doublet), 6 5.27 (J1 2 _ 4 Hz) and 6 5.20 (unresolved doublet), and B-residues at 6 ,

93
4.69 (unresolved doublet) and 6 4.59 (J1,2 8 Hz). The chemical shifts at 6 5.29 and 6 5.20 were
tentatively assigned to H-1 of two a-O-Manp residues and 84.69 was assigned to H-1 of a B-O
Manp residue.
The 13C-NMR spectrum, (Spectrum 3, page 108) , contained C-1 signals at (102.64,
101.92,101.03,100.58, and 96.02 ppm), a signal for C=O at 172.42 ppm indicative of a uronic
acid, and signals for CH20H at 62.45, 62.04, 61.89 and 61.72 ppm. The latter chemical shifts
indicated that none of the residues was 6-linked. 10 1H-NMR did not show signals for pyruvate
which resonates at 6 1.45-1.6, and acetate which resonates at 6 1.92-2.05. 10 1H-NMR
performed on the alkali treated polysaccharide (Spectrum 4, page 109) showed no substantial
difference to that of the native polysaccharide. The results thus confirm that the polysaccharide
is composed of a pentasaccharide repeating unit devoid of acetate or pyruvate moieties.
5.2.(ii). Methylation analysis
The modified Hakomori-method of Phillips and Fraser130 was used to methylate a small
quantity of polysaccharide. The product was not completely soluble in dichloromethane,
indicative of incomplete methylation. The partially methylated polysaccharide was therefore
methylated by the Kuhn128 procedure to afford fully methylated polysaccharide. A methylation
analysis using 1,1 ,3,3-tetramethyl urea to relax the hydrogen bonding, responsible for
undermethylation under Hakomori conditions was abandoned when it was found that
troublesome artifacts formed and interferred with the GLC analysis. One third of the methylated
polysaccharide was hydrolysed with 4M trifluoro-acetic acid, and the product was then analysed
as the partially methylated alditol acetate derivatives186 (PMAA's) by GLC and GLC-MS. The
results are listed in Table 6, column 1.

94
Table 6.
1 2 3
Ta Polysac Methano- B-Elim-Partially Methylated Alditol Acetates charide lised ination
Polysac charide
2,3,4,6-tetra-O-methylglucitol 1.00 I I I
2, 3,4, 6-tetra-O-methylmannitol 0.97 I 0.61 0.56 I
3, 4, 6-tri-O-methylmannitol 1.52 1.09 1.00 0.78
4,6-di-O-methylmannitol 2.19 0.93 0.86 I
2,3-di-O-methylglucitol 3.00 I 0.49 I
2,4,6-tri-O-methylgalactitol 1.65 1.00 0.99 1.00
2,4,6-tri-o-methylmannitol 1.63 I I 0.96
Ta retention time relative to 2,3,4,6 tetra-O-methylglucitol on an OV 225 capillary column.
Two thirds of the methylated polysaccharide was subjected to methanolysis105, the
methyl esters produced were reduced with sodium borohydride, hydrolysed and analysed by GLC
as the derived PMAA's. These data are listed in Table 6, column 2. The methylation analysis
thus indicates the presence of a 2-linked; 2,3-linked and terminal man nose residue, a 4-linked
glucuronic acid and a 3-linked galactose residue in the repeating unit.
5.2.(iii). Seguencing of the monosaccharide residues
5.2.(iii).a. Base catalysed B-elimination of the uronic acid of methylated polysaccharide
A small quantity of polysaccharide was methylated as before and was then treated with
potassium dimsyl for two hours. Direct re-alkylation of the products with Mel followed in a single
vessel as described by Lindberg et al. 140 and the product of hydrolysis was analysed as partially
methylated alditol acetates by GLC-MS. The results are listed in Table 6, (column 3) and show
the complete absence of 2,3,4,6-tetra-O-methylmannose and 4,6-di-O-methylmannose, and the
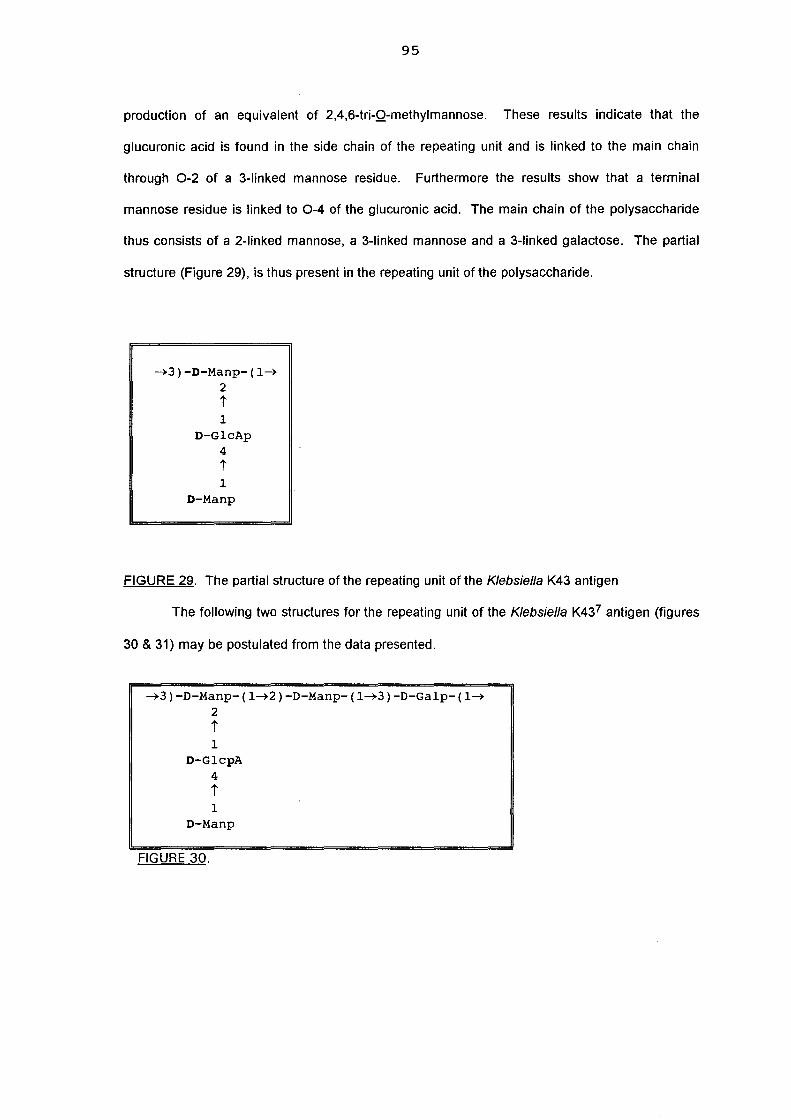
95
production of an equivalent of 2,4,6-tri-0-methylmannose. These results indicate that the
glucuronic acid is found in the side chain of the repeating unit and is linked to the main chain
through 0-2 of a 3-linked mannose residue. Furthermore the results show that a terminal
mannose residue is linked to 0-4 of the glucuronic acid. The main chain of the polysaccharide
thus consists of a 2-linked mannose, a 3-linked mannose and a 3-linked galactose. The partial
structure (Figure 29), is thus present in the repeating unit of the polysaccharide.
~3) -D-Manp- (l~ 2 t 1
D-GlcAp 4 t 1
D-Manp
FIGURE 29. The partial structure of the repeating unit of the Klebsiella K43 antigen
The following two structures for the repeating unit of the Klebsiella K437 antigen (figures
30 & 31) may be postulated from the data presented.
~3)-D-Manp-(1~2)-D-Manp-(1~3)-D-Galp-(1~
2 t 1
D-GlcpA 4 t 1
D-Manp
FIGURE 30.

96
~2)-D-Manp-(1~3)-D-Manp-(1~3)-D-Galp-(1~
2
FIGURE 31.
t 1
D-GlcpA 4 t 1
D-Manp
S.2.(iii).b. Lithium degradation of the native polysaccharide
Polysaccharide in the sodium salt form was dissolved in ethylenediamine and small
pieces of lithium metal were sequentially added, according to the method of Lau ef al. 172. After
quenching the reaction with water and removal of the lithium ions by ion-exchange
chromatography, the degraded material in the acidic form was separated on a column of
8ephacryl 8-200 gel. A fraction corresponding to the degraded polysaccharide was isolated, see
Figure 32. The isolated material was analysed by GLC of the derived PAAN's and showed
mannose and galactose in the ratio 1.9 : 1.0. This result accords with the result of the
B-elimination reaction and confirms the main chain composition as mannose and galactose in the
ratio 2 : 1.
FIGURE 32. GPC chromatogram of the degraded uronic acid polysaccharide

97
The quantity of lithium metal necessary to produce a dark navy-blue colour for 60
minutes was found to be dependent on: the surface area of the metal, the frequency of
introducing atmospheric exchange to the area above the reaction surface, or indeed a large
volume of dead space above the reaction mixture. It was found that during the experiment if the
glass stopper was removed from the flask, the reaction mixture changed to a creamy colour. If
excessive quantities of lithium metal were added, the ion-exchange removal of lithium ions was
complicated. The reaction generally needed 15-20 minutes to change colour and further lithium
addition before this point resulted in excess lithium ion concentration in the solvent.
The lithium reaction is effective in cleaving uronic acid residues and has been utilized by
OeBruin273 in the elucidation of the structure of the repeating unit of E.coli K102 capsular
polysaccharide.
5.3. NMR study on the lithium degraded polysaccharide
This study established the anomeric configuration of the residues in the polysaccharide
and allowed the sequencing of the main chain residues. A 10 NMR study on the degraded
material confirmed the anomeric configuration of the repeating unit, and a 20 study allowed the
sequencing of the main chain residues. The anomeric configurations of the monosaccharide
residues in the backbone structure of the K437 polysaccharide was assigned by comparing the
proton 1 D 1 H NMR spectra of the native (Spectrum 5) and lithium degraded polysaccharides
(Spectrum 6).
~ HOD
~ /1
~~~~)~)~ I .' i ppm 5 0 • 5
SPECTRUM 5. 10 1H-NMR of the polysaccharide
a I a.
J\J~~~ i ppm 5 0
i • 5
SPECTRUM 6. 10 1H-NMR of the degraded polysaccharide

98
spectrum 6, shows 3 Q-anomeric signals for the degraded polysaccharide while the
spectrum of the native polysaccharide has 3 Q- and 2 B-signals in the anomeric region.
The repeating unit is thus composed of:
side chain residues
main chain residues
B-D-Manp(l~, ~4)-B-D-GlcpA
~2 ) -Q-D-Manp-, ~3 )-Q-D-Manp-2 t
~3) '-Q-D-Galp-
10 1 H-NMR spectrum, (Spectra 7,8, page 110-111) recorded at 50°C contained H-1
resonances for the Q-,linked residues at «5 5.342 (J1 2 4.00 Hz), «5 5.295 (J1 2 unresolved) and , ,
«55.048 (J1 2 1.4Hz), and the 13C-NMR spectrum, (Spectrum 9, page 112) contained C-1 signals ,
at 103.03, 101.20 and 95.44 ppm. The chemical shifts of most of the 1H and 13C resonances of
the residues (Table 7, page 100) were established mainly from 1 H_1 H correlation experiments,
viz. COSY, Relay COSY and HOHAHA, and a 1 H_13c heteronuclear correlation experiment, viz.
HETCOR. Use of through space n.O.e. couplings confirmed the linkage positions and
established the residue sequence. The residues were labelled arbitrarily !! to ~ in order of
decreasing chemical shift of the H-1 resonances.
Residue a The chemical shifts for the H-1/2 resonances were established from the
COSY-45 spectra, (Spectra 10,11, page 113-114) and the connectivities up to H-4 were noted in
the H-1 track of the HOHAHA contour map, (Spectrum 12, page 115). The chemical shift for the
H-5 resonance was determined from the n.O.e between H-4 and H-5 in a NOESY experiment,
(Spectrum 13, page 116). The H-6a and H-6b resonances could then be identified from the
COSY spectrum (Spectrum 11, page 114).
Residue b The chemical shifts for the H-1/2 resonances were established from the
COSY spectrum. The chemical shift for H-3 was established from the H-1 track in the double
Relay COSY contour plot, (Spectrum 14, page 117), while those for the H-4 and H-5 resonances
were noted in the H-2 and H-3 track of this Relay COSY.

99
Residue c The chemical shifts for the H-1 to 3 resonances were traced in the COSY
spectrum and that for the H-4 in the H-3 track of the double Relay COSY contour map. The
chemical shift for the H-5 resonance was established from the n.O.e. between H-3 and H-5 in the
NOESYexperiment. The 13C resonances for residues!! to .£ (Table 7, page 100) were assigned
by comparing the 1 H assignments with the 1 H_13C correlation data obtained from the HETCOR,
(Spectrum 15, page 118). The identity of the residues!! to.£, their linkage positions, and
anomeric configurations followed from a comparison of the NMR data with those of methyl
glycosides, (Table 5, page 74).
Identification of an unknown residue may be conducted either by a comparative study
with standard monosaccharide derivatives243 (methyl glycosides), or from first principles using
the unknown residue's coupling constant values, if available. The latter method is especially
useful where standard shift data is not available. Each chiral centre's relative configuration is
determined on the premise that large "J" values indicate a trans stereochemistry, e.g. a B-D-Glc
will exhibit large coupling constants for H1 ,2; H2,3 and H 3,4 of approximately 8-10 Hz.
Use of standard methyl glycoside shift data is a quick and convenient means of
identifying unknown residues. Both the 1 Hand 13C data acquired for the unknown residue are
compared to that of a range of standards. 13C shifts are less variable than the 1 H shifts and are
used first in identifying the unknown resonance. An almost text book example of identifying an
unknown residue, is that of the terminal B-D-mannose residue, (residue .£. which is known to be
terminally linked from methylation results) of the repeating unit of Klebsiella K43.7 The magnetic
environment of the resonances of a terminal residue are not affected appreciably by
neighbouring groups, and show 1 Hand 13C shift data virtually identical to those of, e.g. a methyl
glycoside of the particular sugar residue. Table 7 monosaccharide shift values (page 100)
compares standard methyl glycoside NMR shifts with those of the unknown residue (£).
Points of monosaccharide linkage are detectable by the degree of 13C chemical shift, up
or down field, in comparison to the standard methyl glycoside residues. Generally these shift
differences can be up to 10 ppm for 13C resonances, e.g. the unknown residue .£ of the lithium
degradation product of Klebsiella K437 can be identified as a 3-linked ®-D-mannose by use of
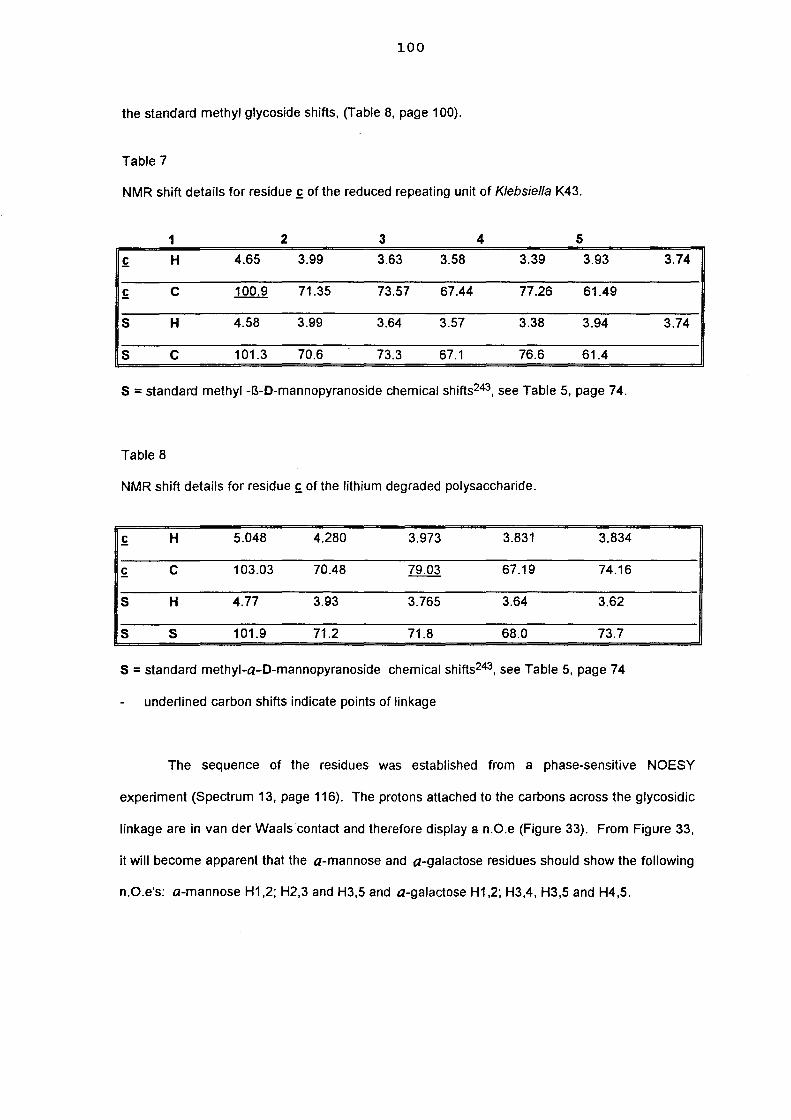
100
the standard methyl glycoside shifts, (Table 8, page 100).
Table 7
NMR shift details for residue £ of the reduced repeating unit of Klebsiella K43.
1 2 3 4 5
£ H 4.65 3.99 3.63 3.58 3.39 3.93 3.74
£ C 100.9 71.35 73.57 67.44 77.26 61.49
5 H 4.58 3.99 3.64 3.57 3.38 3.94 3.74
5 C 101.3 70.6 73.3 67.1 76.6 61.4
5 = standard methyl -B-D-mannopyranoside chemical shifts243, see Table 5, page 74.
Table 8
NMR shift details for residue £ of the lithium degraded polysaccharide.
£ H 5.048 4.280 3.973 3.831 3.834
£ C 103.03 70.48 79.03 67.19 74.16
5 H 4.77 3.93 3.765 3.64 3.62
5 5 101.9 71.2 71.8 68.0 73.7
5 = standard methyl-a-D-mannopyranoside chemical shifts243, see Table 5, page 74
underlined carbon shifts indicate pOints of linkage
The sequence of the residues was established from a phase-sensitive NOESY
experiment (Spectrum 13, page 116). The protons attached to the carbons across the glycosidic
linkage are in van der Waals contact and therefore display a n.O.e (Figure 33). From Figure 33,
it will become apparent that the a-mannose and a-galactose residues should show the following
n.O.e's: a-mannose H1,2; H2,3 and H3,5 and a-galactose H1,2; H3,4, H3,5 and H4,5.
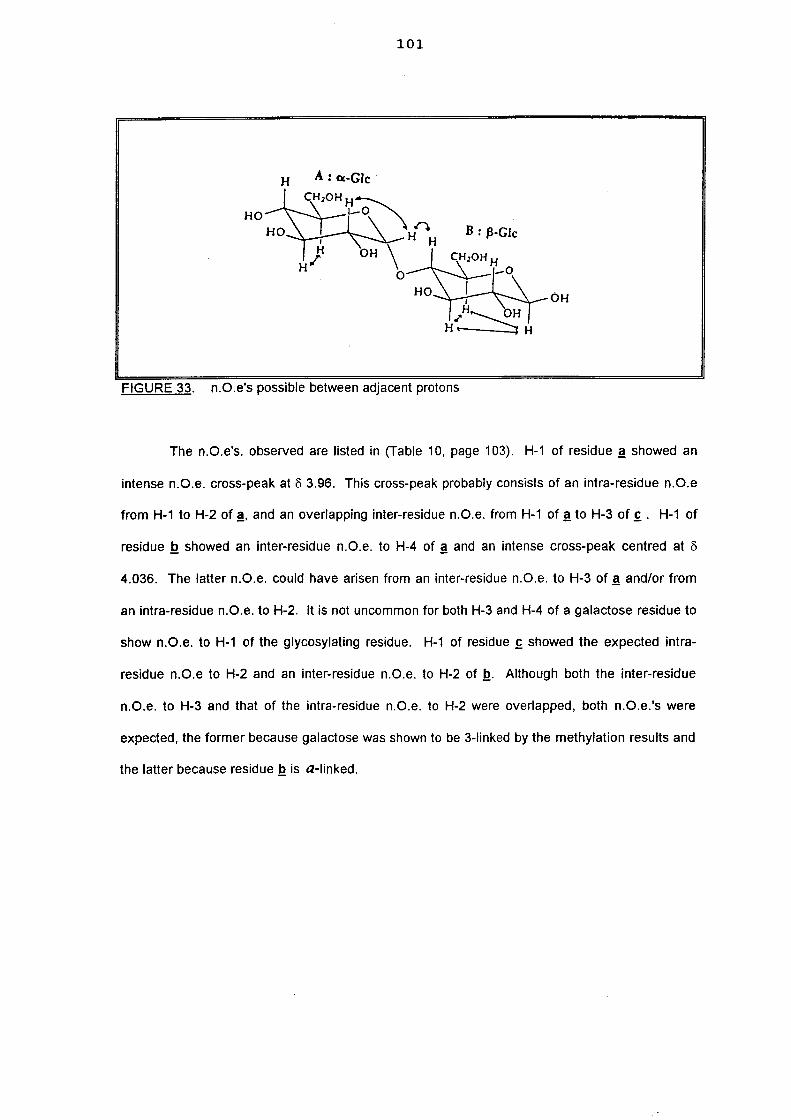
101
H A: cx-GJc
HO B : ~-Glc
OH
FIGURE 33. n.O.e's possible between adjacent protons
The n.O.e's. observed are listed in (Table 10, page 103). H-1 of residue!! showed an
intense n.O.e. cross-peak at 8 3.96. This cross-peak probably consists of an intra-residue n.O.e
from H-1 to H-2 of !!, and an overlapping inter-residue n.O.e. from H-1 of!! to H-3 of f. H-1 of
residue!! showed an inter-residue n.O.e. to H-4 of !! and an intense cross-peak centred at 8
4.036. The latter n.O.e. could have arisen from an inter-residue n.O.e. to H-3 of !! and/or from
an intra-residue n.O.e. to H-2. It is not uncommon for both H-3 and H-4 of a galactose residue to
show n.O.e. to H-1 of the glycosylating residue. H-1 of residue f showed the expected intra
residue n.O.e to H-2 and an inter-residue n.O.e. to H-2 of!!. Although both the inter-residue
n.O.e. to H-3 and that of the intra-residue n.O.e. to H-2 were overlapped, both n.O.e.'s were
expected, the former because galactose was shown to be 3-linked by the methylation results and
the latter because residue!! is a-linked.
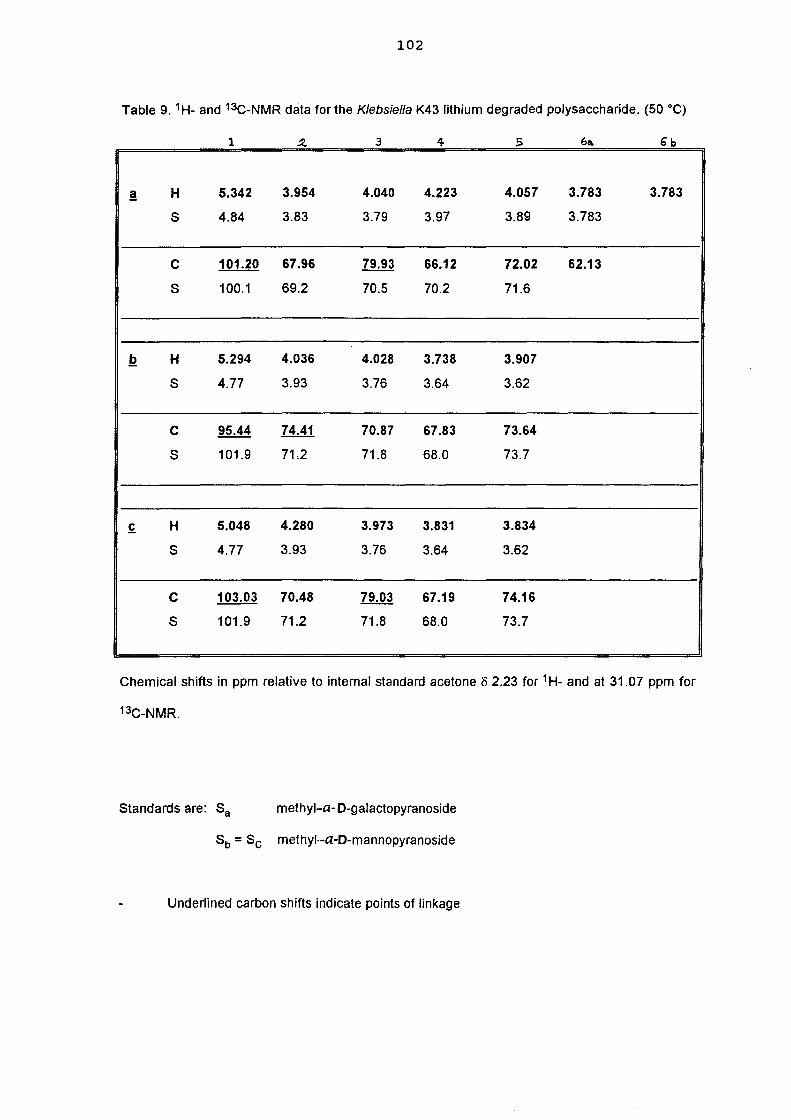
102
Table 9. 1H_ and 13C-NMR data for the Klebsiella K43 lithium degraded polysaccharide. (50°C)
1 3 4 5 611.
! H 5.342 3.954 4.040 4.223 4.057 3.783 3.783
S 4.84 3.83 3.79 3.97 3.89 3.783
C 101.20 67.96 79.93 66.12 72.02 62.13
S 100.1 69.2 70.5 70.2 71.6
~ H 5.294 4.036 4.028 3.738 3.907
S 4.77 3.93 3.76 3.64 3.62
C 95.44 74.41 70.87 67.83 73.64
S 101.9 712 71.8 68.0 73.7
£ H 5.048 4.280 3.973 3.831 3.834
S 4.77 3.93 3.76 3.64 3.62
C 103.03 70.48 79.03 67.19 74.16
S 101.9 71.2 71.8 68.0 73.7
Chemical shifts in ppm relative to internal standard acetone 82.23 for 1H- and at 31.07 ppm for
13C-NMR.
Standards are: Sa methyl-a-D-galactopyranoside
Sb = Sc methyl·-a-D-mannopyranoside
Underlined carbon shifts indicate points of linkage

103
Table 10.
n 0 e 's for the Klebsiella K43 Lithium degradation ..
Proton n.O.e. to
a, H-1 5.342 3.954(a,H-2); 3.973(c,H-3)
a, H-3 4.040 4.223(a,H-4)
a, H-4 4.223 4.057(a,H-5)
b, H-1 5.295 4.223(a,H-4); 4.036(b,H-2)
c, H-1 5.048 4.280{c,H-2); 4.036(b,H-2)
c, H-3 3.973 4.280(c,H-2)
The sequence for the lithium degraded polysaccharide may thus be written:
~3}£-(1 ~2}-!?-{1 ~3}-!(1 ~
Thus the backbone structure of the polysaccharide of the Klebsiella K437 antigen may be written:
~3)-a-D-Manp-(1 ~2)-a-D-Manp-(1 ~3)-a-D-Galp(1 ~
The main chain of the KJebsiella K437 antigen oligosaccharide repeating unit.
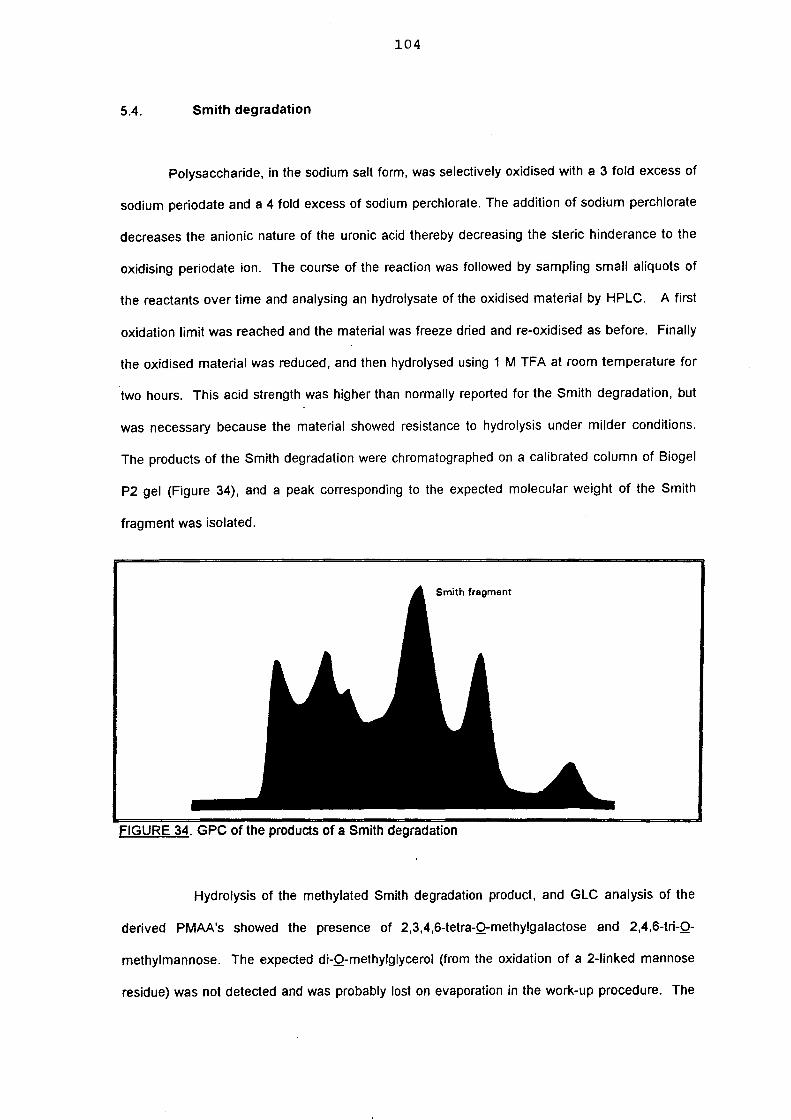
104
5.4. Smith degradation
Polysaccharide, in the sodium salt form, was selectively oxidised with a 3 fold excess of
sodium periodate and a 4 fold excess of sodium perchlorate. The addition of sodium perchlorate
decreases the anionic nature of the uronic acid thereby decreasing the steric hinderance to the
oxidising periodate ion. The course of the reaction was followed by sampling small aliquots of
the reactants over time and analysing an hydrolysate of the oxidised material by HPLC. A first
oxidation limit was reached and the material was freeze dried and re-oxidised as before. Finally
the oxidised material was reduced, and then hydrolysed using 1 M TFA at room temperature for
two hours. This acid strength was higher than normally reported for the Smith degradation, but
was necessary because the material showed resistance to hydrolysis under milder conditions.
The products of the Smith degradation were chromatographed on a calibrated column of Biogel
P2 gel (Figure 34), and a peak corresponding to the expected molecular weight of the Smith
fragment was isolated.
FIGURE 34. GPC of the products of a Smith degradation
Hydrolysis of the methylated Smith degradation product, and GLC analysis of the
derived PMAA's showed the presence of 2,3,4,6-tetra-O-methylgalactose and 2,4,6-tri-O
methylmannose. The expected di-O-methylglycerol (from the oxidation of a 2-linked mannose
residue) was not detected and was probably lost on evaporation in the work-up procedure. The
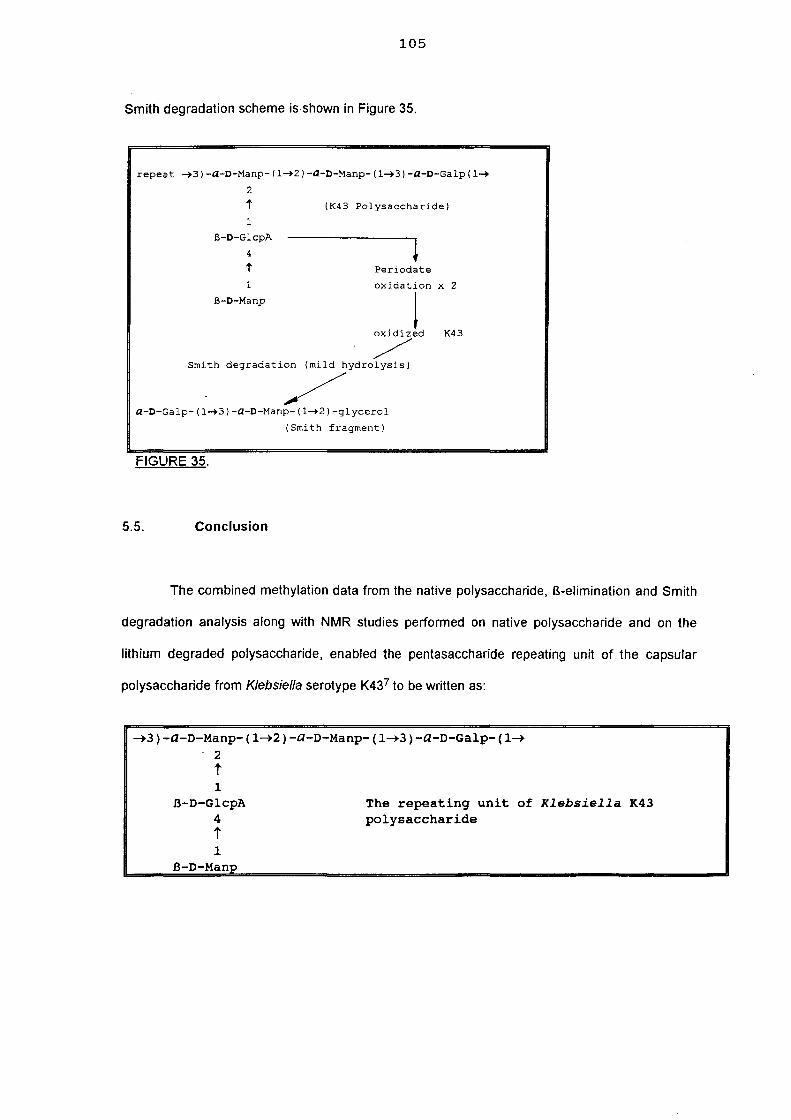
105
Smith degradation scheme is shown in Figure 35.
repeat -+3)-a-D-Manp-(1-+2)-a-D-Manp-(1-+3)-a-D-Galp(1-+
2
t (K43 Polysaccharide)
1
B-D-GlcpA
4
t 1
B-D-Manp
Periodate
oxidation x 2
! oxidized K43
/ Smith degradation (mild hydrolysis)
/ a-D-Galp-(1-+3)-a-D-Manp-(1-+2)-glycerol
(Smith fragment)
FIGURE 35.
5.5. Conclusion
The combined methylation data from the native polysaccharide, ~-elimination and Smith
degradation analysis along with NMR studies performed on native polysaccharide and on the
lithium degraded polysaccharide, enabled the pentasaccharide repeating unit of the capsular
polysaccharide from Klebsiella serotype K437 to be written as:
~3)-a-D-Manp-(1~2)-a-D-Manp-(1~3)-a-D-Galp-(1~
2 i 1
B-D-GlcpA 4 i 1
B-D-Manp
The repeating unit of Klebsiella K43 polysaccharide

Current Data Para~eters
~l P lj3e reb 0 eLI K 1 cbs 1 e 11 a K Ll3 poI y NANE hp _aerelloe. EXPNO 101 PROCNO I
HOD acetone
F2 - ACQUISition Parameter Date 910~16 11me 11 29 PULPROG 1930 NUCLEUS IH SOL VENT CDCl3 AO J 40787;>0 se FIORE S a 146719 H1 ow 104 0 us RG 2046 Hl\ I liB 01 .0000000 se PI \3 0 us RO a 0000000 se Pw 0.0 us O~ 130. a us SFOI 400 1368620 NH SWH 4B07.69 Hl 10 32768 NS 1<'8
a OS 2
OIJu,I..II!PPet> jT B
F2 - Processing parameters ~ 51 16384 SF 400. 1355913 NH WOw EM SS8 a LB 0.30 Hz G8 0 PC 1.00 a 10 NMR plot parameters CX 23 90 cm F]P 5500 pp F\ 2200.75 Hz F2P 2 000 pp F2 BOO.27 Hz PPNCN O. 14644 pp HZ CM 58 59726 Hz
I I I I I I I ppm 5 .0 4 . 5 4 0 3 .5 3 0 2 :i
)oectrum 1. 10 1 H-NMR of the Klebsiella K43 polysaccharide
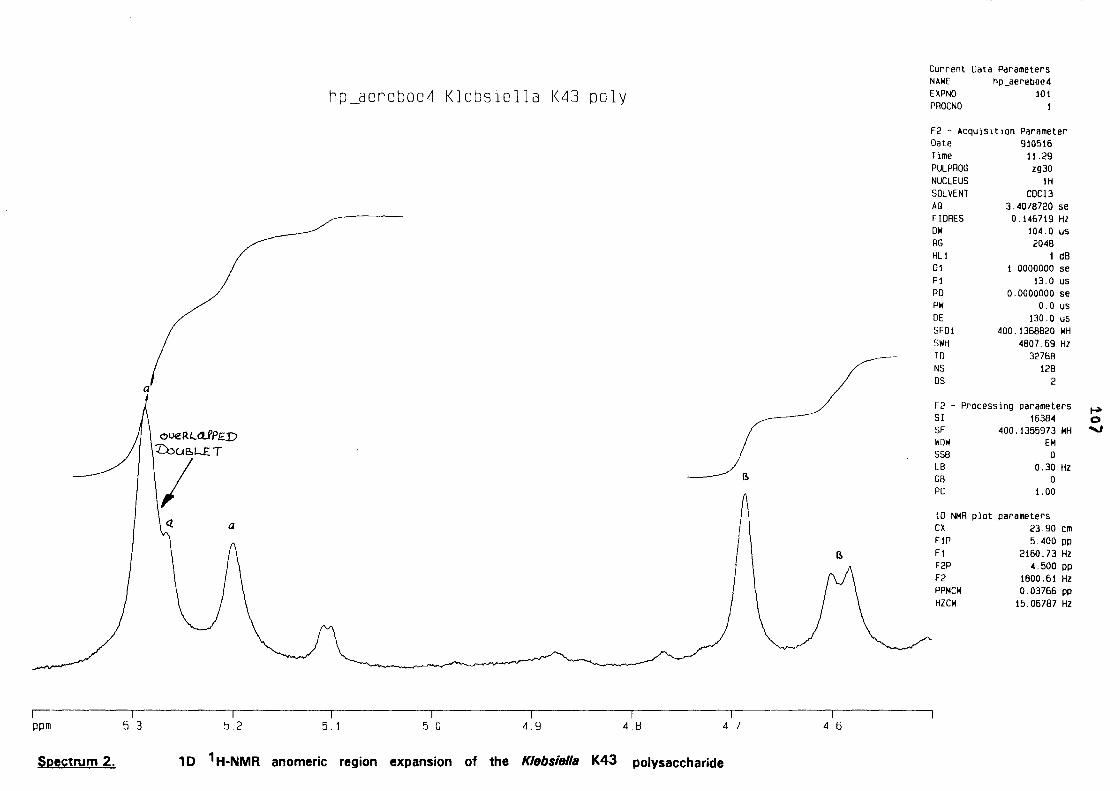
r-ppm
Spectrum 2.
]
5.3
a I
Current Data Parameters NAME hp_aerebOe4
hp_aereboe4 Klebsiella K43 poly EXPNO 101 PROCNO 1
F2 - AcquisitIon Parameter Oate 910516 Time 11.29 PULPROG Zg30 NUCLEUS lH SOLVENT COCl3 AO 3.4078720 se FIDRES 0.146719 Hz OW 104.0 us RG 2046 HLI 1 dB 01 0000000 se PI 13.0 us RO 0.0000000 se PW 0.0 us DE 130.0 us SFOI 400. 1368620 MH SWH 4607.69 Hl TO 3276B NS 126 OS 2
/ F2 - Processing parameters ..... SI 16384 0
oVER.l..d.PP£D
~ SF 400.1355973 MH -...J
'Z::bU8.k£ T WOW EM
/ SS6 0 LB 0.30 Hz G6 0 PC 1.00
10 NMR plot parameters CX 23.90 em F1P 5.400 pp
~ Fl 2160.73 Hz F2P 4.500 pp F2 1800.61 Hz PPMCM 0 .03766 pp HZCM 15.06787 Hz
,--,.- "-I--~--~--'--T- '--- "-~T--- '---r"- .- ']- ]- --- --I 5.2 5.1 5.0 Ll.9 Ll.8 Ll 7 Ll.6
1 D 1 H-NMR anomeric region expansion of the Klebsiella K43 polysaccharide

108
c c o ... c o III
0
• 0
0 CD
0 0
0 C'\J -
0 '<t
0 lO
E a. a.
., 'C '': CO .r. (J (J CO
'" > '0 Q,
M o:t ~
~ ~ III
oQ ,!? ~ ., .r. .. .... 0
IX: :!: Z
I
U M .... e ....
I

hp_aereboe6 Klebsiella 43 poly deOAc current Data ~arameters NAME hp_aerebof!5 EXPNO 101 PROCNO 1
F2 - ACQUisition Parameter Date 910523 Time 11 55 PULPROG zg30 NUCLEUS IH SOLVENT CDCl3 AO 3 4078720 se FIDRES 0.145719 Hz
HOD ~ acetone OW 104.0 us RG .2048 HU I dB 01 1.0000000se PI 13.0 us RO 0.0000000 se PW 0.0 us DE 130.0 us SFOI 400. 1358820 MH SWH 4807.59 Hz TO 32768 NS 64 OS 2
F2 - Processing parameters I-' SI 16384 0
SF 400. 1355530 MH \0 WOW EM SSB 0 LB 0.30 Hz GB 0 PC 1.00
10 NMR Plot parameters
II l CX 23.90 em B
II I'll ~ ~III F1P 5.600 pp Q Fl 2240.76 Hz
II
F2P -0.500 pp Q
I I J ~ WI M JI
F2 -200.07 Hz Q PPMCM 0.25523 pp HZCM 102.12665 Hz B
I I I I I ppm 5 4 3 2 0
Spectrum 4. '0 'M.-NMR of the de-O-acetylated Klebsiella K43 polysaccharide

HOD
F Q Q
Q
--,----~---,--- I r I I I I I I I 1nm 5.2 5.0 <18 .-1_6 .1.4 4;:J 40 3A in 1.1
Spectrum 7. 10 1 H - NMR of the lithium degraded Klebsiella K43 polysaccharide
Current Data Parameters NAME hp _aereboe 7
EXPNO 101
"AOCNO 1
F2 - ACQuisit ion Parameter,
Oate 910814 T line 14.23 PULPAOG zg30 NUCLEUS lH
SOLVENT COCl3 AG 5.1118078 se, FlORES 0.097813 Hz OW 156.0 us, RG 1024 HU 1 dB 01 a . 7000000 se' PI 13.0 us,
RD o . 0000000 se' PW 0.0 us,
DE 195.0 us, SFOI 400 1367556 MH: SWH 3205.13 Hz
TO 32768 NS 128
OS 2
F2 - Processing parameters SI 16384 SF 400. 1355645 MH: WOW EM SSB 0 L8 0.30 Hz GB 0 PC 0.50
ID NMR plot parameters CX 25.10 em FIP 5.456 pp' Fl 2182.94 Hz F2P 3.283 PPI F2 1313.58 Hz PPMCM 0 . 08656 PPI HZCM 34 .63595 Hz.
..... ..... o
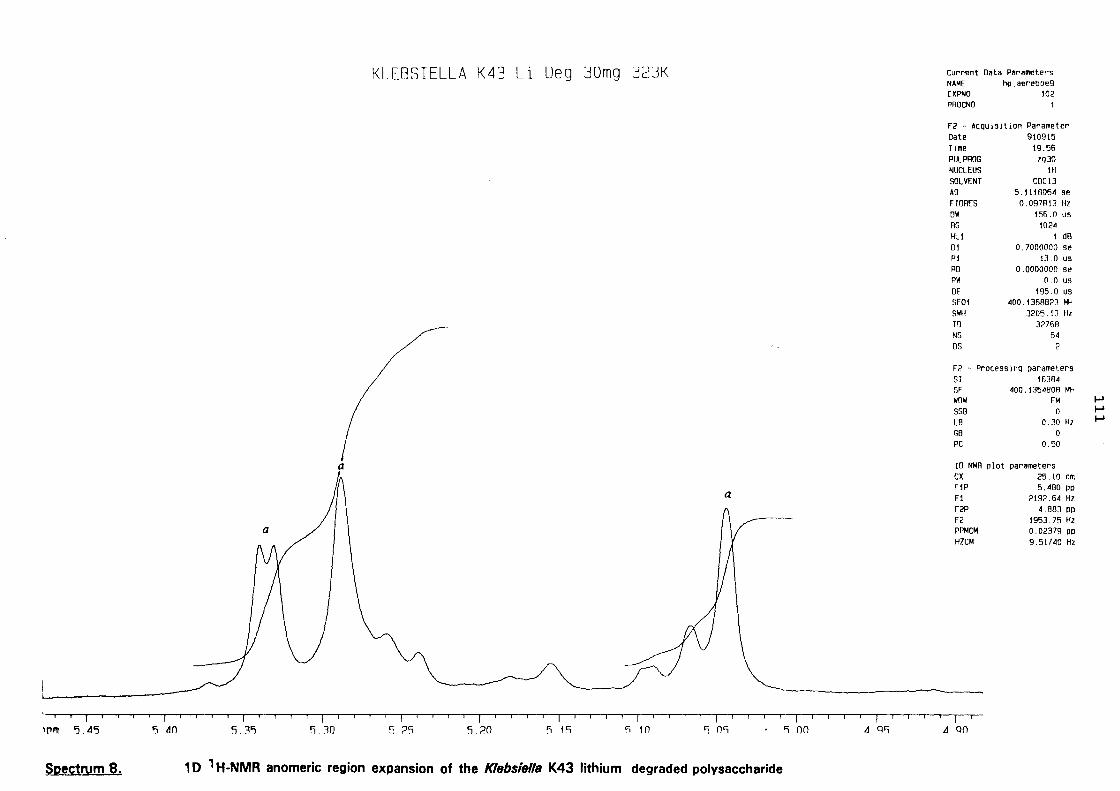
KLEBSIELLA K43 Li Ueg JOmg j2jK
a
a
a
,-,---,----,- ------r-,..--,---,----,--r--.----,-,-----,-I~l---.---T-,-,- , 1-----'
'11m 5.45 5 4n 5.3'1 'i.30 :1 ?'i 'i ;:>0 'i 1'1 'i 10 '1 n'1 '1 nn 4 Q'1
Spectrum 8. '0 ' H-NMR anomeric region expansion of the Klebsiella K43 lithium degraded polysaccharide
Current Data Parameters NAME hp_aerebDe9 EXPNO 102 PROCNO
F2 - ACQuisition Parameter Date 910915
Time 19.56
PULPROG Zg30
NUCLEUS IH SOLVENT CDC 13
AO 5.1118064 se FlORES 0.097813 Hz OW 156.0 us RG 1024
HLI 1 dB 01 O. 7000000 se PI 13.0 us Ro 0.0000000 se PW 0.0 us DE 195.0 us SFDI 400 1368823 M~ SWH 3205.13 Hz TO 3?768
NS 64
OS 2
F2 - Processing parameters SI 16384 SF 400. 135480A MI-WOW EM
SSB 0 LB 0.30 Hz GB 0 PC 0.50
10 NMR plot parameters ex 25.10 CII',
FIP FI F2P F2 PPMCM
HZCM
4 Qn
5.480 PP 2192.64 Hz
4.883 PO 1953.75 Hz 0.02379 pp 9.51740 Hz
.....
.....
.....

Current Data Parameters NAME hp ....aereboe 12 fXPNO 206 PROCNO
F2 - ACQulslt ion Parallll!t Date 911007 Time 15.32 PULPROG zgpg30 NUCLEUS BC SOLVENT CDCI3 40 .7039360 FIDRES o .293~38 OW 52.0 RG 32768 HL1 01 0.7000000 011 0.0300000 PI 7.5 RD 0.0000000 PW 0.0 DE 65.0 SFOt 100 .6213932 SWH 9615.38 TO 32768 NS 1733 OS 2
F2 - Process i ng oaramp:tf sr 3276A SF 100.6140739 ~ WOW EM ~ SSB 0 I'V LB .00 G8 0 PC 1. 40
10 NMR P lot parameters CX 25.00 FIP 104.652 FI 10529 47 F2P 58.257 F2 5861.51 PPMCM I. 85579 HlCM 186.71851
Soectrum 9 1 10 13C-NMR of the Klebsiella K43 lithium degraded polysaccharide

113
/ - e' 3.5 , • ; I
•
.. OD c • • • 4.0
B2 • ..... oCO I; •
aO 1f1_C7 •• 00 B2/3
tI
/:1(. 4.5
. "
"
/I
5.0
tP B1 " • B1/2 CI
ttt .. 21/2
~ . - • • ~
~ !,1 CD !,1/2 ppm
I I I I ppm 5.0 4.5 4.0 3.5
Spectrum 10. 20 1 H_1 H-NMR COSY contour map of the Klebsiella K43 lithium
degraded polysaccharide

I ppm
Spectrum 1 1 .
I 4.2
I 4.0
114
I 3.8
3.8
4.0
4.2
ppm
20 'H-1H COSY contour map expansion of the Klebsiella K43 lithium
degraded polysaccharide
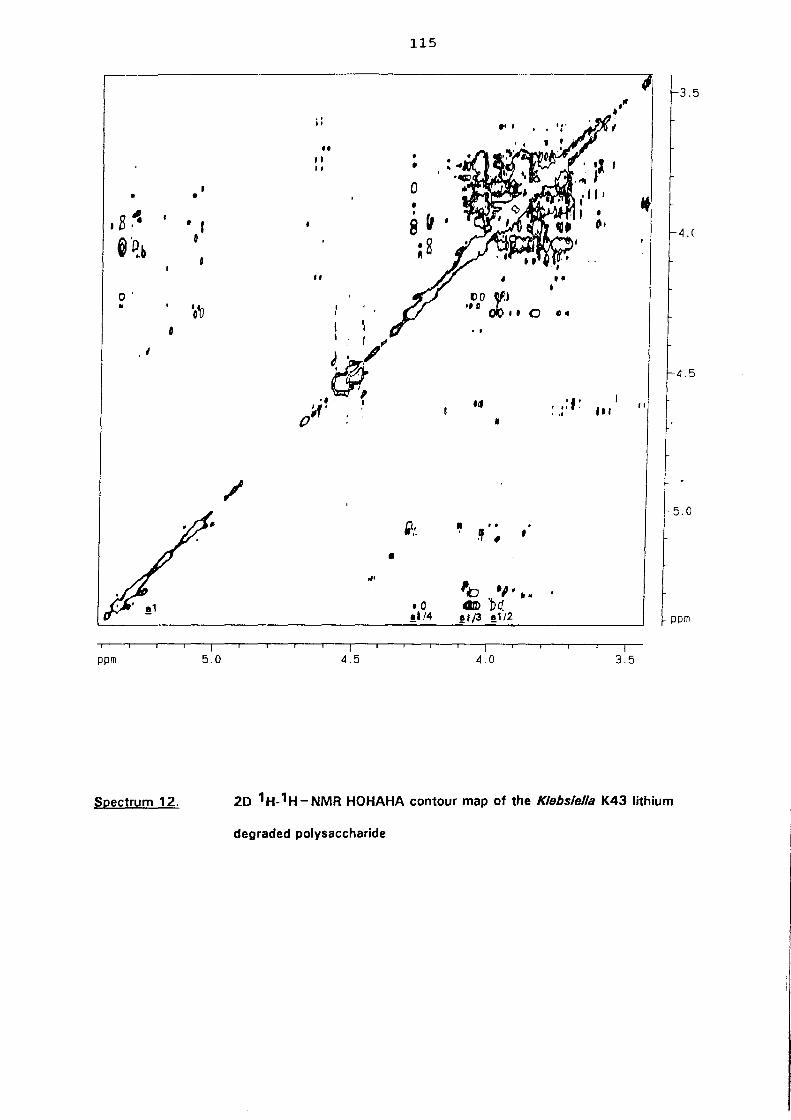
•
B~ • 0
i'~b
o· •
• . ,
ppm
Spectrum 12.
, • • ,
0
'ot
I 5.0
115
3.5
• ." .. " " . i .. " • II •
0 ~ •
B ~ • ~I
~ .(
R8
" , , . •
vo 1/ " G . I • 0 "4 , ,
I o. I. I r1
J I /
CW, 4.5
, t:' ~ I o. . I 'If I,' • It, " (l " •• 1
•
5.0
~.'. ... .. •• •
, •
ti'
'b ", . t ~ .0 dIr> be: !1/4 !1/3 !1/2 ppm
I I I 4.5 ~O 3.5
20 1 H-1 H - NMR HOHAHA contour map of the Klebsiella K43 lithium
degraded polysaccharide
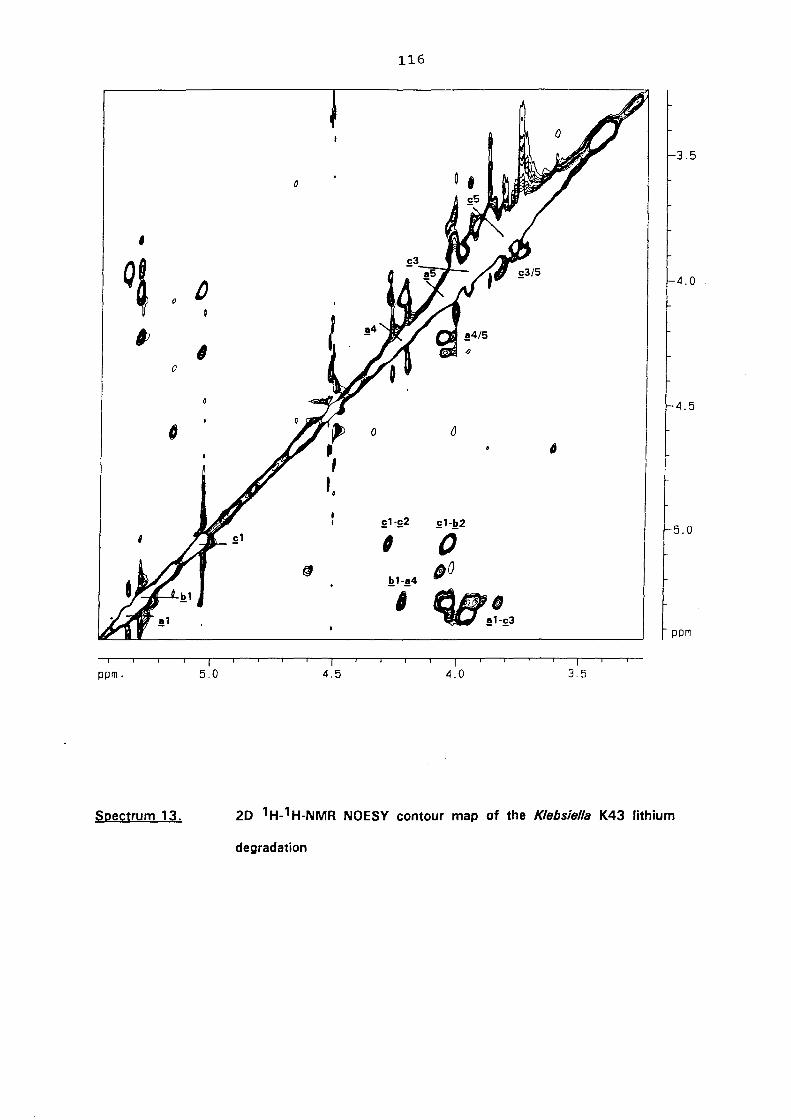
116
3.5
,
Q~ ~ 4.0
0
l f; , 0
4.5 , 0 (J
£1-£2 £1-!!2 5.0 I , 0
(J !!1-.!4
,0 , qe'!~£3
ppm
I I I I ppm. 5.0 4.5 4.0 3.5
Spectrum 13. 20 1 H-1 H-NMR NOESY contour map of the Klebsiella K43 lithium
degradation

117
Klebsiella K43 li deg 343K , 3.6
3.8
~ G f). e , 0
~.O
4" () ~i ()
~
D "#i • ~.2
0 0 ~ 1!3/5
~.~
~.6
•
II ~.8
/ .0
tJ D DC!) #
/ Jlfl2 .2
Q C> Jlf/3 () G6'G
.~
pp.
I I I I I I I I I I pp. I.~ B.2 1.0 ~ .. ~.I ~.~ ~.2 ~.O 3.8 3.8
Spectrum 14. 20 1 H-1 H-NMR Relay COSY contour map of the Klebsiella K43
lithium degraded polysaccharide
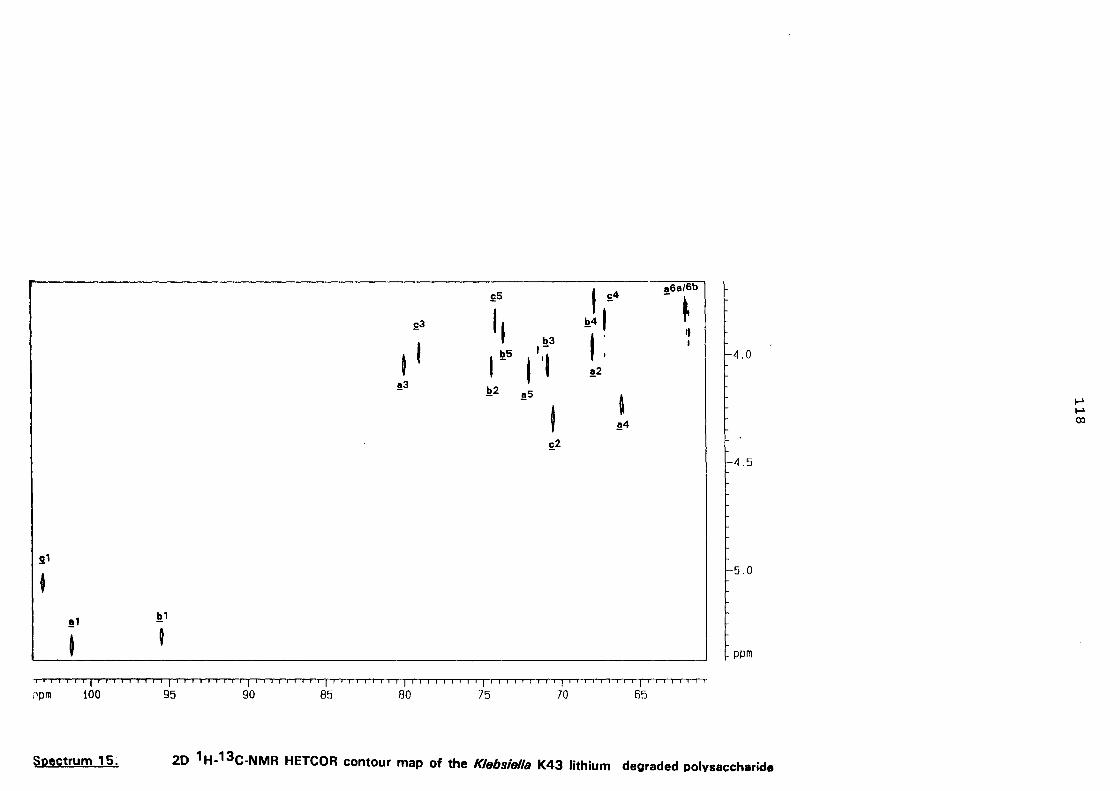
£5 t £4 !6a/6b
I , ~ £3 l!4 t
~ t b3 t :
II
b5 ,-I
,- t It I H.O
!3 !2
l!2 !5
f ~ I ~ a4
....
-.... 00
£2 I r
4.5
g1
• 5.0
!1 l!1
t ~ ppm
,r-rl-Tr-T I-T r-r,l Tl r. r--' ,-I '-l-T r. r-ll-ITt 11--"-'1-" rlT-rTTT-T'-~r-rTT-IT---rTTTTI-TT"-lr-'I-TT-----rrT r-T r-J-TII
;:lprn 100 95 90 85 80 75 70 65
Spectrum 15. 20 1 H_13C-NMR HETCOR contour map of the Klebsiella K43 lithium degraded polysaccharide

119
6. PREPARATION 'AND NMR STUDY OF THE OLIGOSACCHARIDE REPEATING
UNIT OF THE KLEBSIELLA K43 ANTIGEN
6.1. Introduction
Aqueous solutions of the native polysaccharide are viscous and this results in broad
Iines242 in the proton NMR spectra, making complete structural analysis by 20 NMR methods
difficult. Bacteriophages may carry endoglycanases177 which are capable of depolymerising host
capsular polysaccharide to oligosaccharidesof repeating unit size. The oligosaccharide produced
retains all the structural information of the polysaccharide and gives excellent, well resolved
spectra amenable to detailed 20 NMR structural studies. The Klebsiella K437 polysaccharide
was depolymerised by its bacteriophage, and the resulting oligosaccharide P1 and reduced form
P1-01, were analysed by 20 NMR methods.
6.2.
6.2.(i).
Results and discussion
Depolymerisation of the exopolysaccharide antigen of Klebsiella K43 by a
specific bacteriophage-borne endoglycanase
The Klebsiella K437 polysaccharide was depolymerised by a bacteriophage active on the
host bacteria, by the method published by Okutani and Outton103,
The Klebsiella /2} 43 (phage) was isolated by inoculating a liquid culture of Klebsiella
bacteria with raw sewage water from Grahamstown sewerage works. The cellular material was
preCipitated the following day and the supernatant containing possible phage was accumulated.
This potential phage solution was serially diluted and added to an equal volume of Klebsiella K43
suspension in nutrient broth (Annexure 1, formula 9.2), mixed with sloppy agar (Annexure 1,
formula 9.3), and overlaid over nutrient agar (Annexure 1, formula 9.4). After incubation over
night large haloes were seen on the plates, indicative of vigorous phage activity. The phage was
isolated by "picking" a small amount of agar from the centre of a halo, extracting the phage, and

120
repeating the overlay and picking technique three times. Bulk phage propagation was carried out
in order that a volume of phage could be generated that had approximately 1013 plaque forming
units (PFU's), that concentration estimated to be sufficient to depolymerise 1 g of bacterial
polysaccharide. The phage was assayed for PFU number by comparison of the phage ability to
form haloes on solid agar inoculated with a known serial dilution of Klebsiella bacteria. The
crude phage solution was then dialysed (12-14 000 Mw) against running water for 48 hours and
assayed again for strength.
The purified Klebsiella K437 exopolysaccharide was then committed to the phage
solution for three days in a mechanical shaking water bath set at 3rC. The viscosity of the
polysaccharide solution dropped rapidly overnight as the polysaccharide was digested. After 3
days the solution was freeze-dried, reconstituted with a minimum volume of water and dialysed
for a further 3 days against distilled water. The dialysate was freeze-dried, subjected to gel
permeation chromatography and showed the following profile, (Figure 36). P1 refers to the
P3
FIGURE 36. GPC chromatograph of the bacteriophage mediated depolymerisation of
the K43 antigen
The degraded material was then committed to a preparative GPC column of Biogel P4,
eluted with a buffer and an oligosaccharide fraction corresponding to the retention volume of a

121
pentasaccharide was isolated.
6.2.(ii). Methylation analysis of the repeating unit (P1)
A portion of the oligosaccharide P1 was reduced with NaBD4' to label223 the reducing
end, and was then methylated according to the modified Hakomori130 method. The product was
then methanolysed, reduced, hydrolysed and converted to the PMAA's which were analysed by
GLC-MS (Table 11, column 1).
Table 11.
Partially Methylated Alditol Acetates Ta
2,3,4,6-tetra-Q-methylglucitol 1.00
2,3,4,6-tetra-Q-methylmannitol 0.97
3,4,6-tri-Q-methylmannitol 1. 52
2,3-di-Q-methylglucitol 3.00
Ta retention time relative to 2,3,4,6-tetra-O-methylglucitol.
All material was run on a OV 225 capillary column.
1
Reduced repeating unit (P1-01)
0.46
2.00
0.60
A small quantity of deuterium labelled pentamethylated hexitol, (lost due to volatility, was
not integrated in the GLC analysis, Table 11), was detected by GLC-MS, and allowed the
galactose to be aSSigned as the reducing end. The results accord with a pentasaccharide
repeating unit and indicate that the depolymerised polysaccharide (P1), is present as a linear
oligosaccharide, having a terminal man nose residue, a 4-linked glucuronic acid, two 2-linked
mannose residues and a 3-linked galactose residue. Thus far the accumulated data suggest that
the material isolated from the bacteriophage depolymerisation is the repeating unit.

122
6.2.(iii). Reduction of P1 and NMR investigation of the repeating unit alditol P1-01
P1 was reduced (NaBH~ to form the alditol P1-01, the formation of which simplified the
2D NMR spectrum by replacing the ~ and B-anomers of galactose with the alditol, thereby
removing complications due to mutarotation. This enabled assignment of the P1-01 structure.
The 1H-NMR spectrum of the P1-01, (Spectra 16-17, page 128-129) recorded at 30°C,
contained H-1 resonances for a-residues at 8 5.26, 5.20, and B-residues at 8 4.65 and 8 4.62.
The resonances at 8 5.26 and 8 5.20 were assigned to two a-D-Manp residues, and 8 4.62 was
assigned to a B-D-GlcAp which relayed as far as C-5, (expected for uronic acid residues). The
13C-NMR spectrum, (Spectrum 18, page 130) contained C-1 signals at 100.46, 100.84, 100.92,
102.19 ppm, and signals forCH20H at 61.47,61.72,61.78,63.83 and 63.98 ppm. The observed
31C-NMR signals are thus consistent with the presence of 3 hexoses, a hexuronic acid and an
alditol.
The chemical shifts of most of the 1H and 13C resonances, (Table 13, page 126) were
established mainly from 1 H_1 H homonuclear correlation spectroscopy (COSY, Relay COSY, and
HOHAHA), heteronuclear 1H_13C (HETCOR) and inverse detected 1H_13C correlation, (HMQC
TOCSY and HMBC) experiments. The residues were labelled arbitrarily ! to ~ in order of
decreasing chemical shift of the H-1 resonances.

123
2D-NMR INVESTIGATION INTO THE REDUCED REPEATING UNIT STRUCTURE
Residue a. The chemical shifts for H-1/2 resonances were established from the COSY
contour map, (Spectrum 19, page 131) and the connectivities up to H-4 were noted in the
HOHAHA contour map (Spectrum 20, page 132).
Residue b The chemical shifts for the H-1/2 and H-2/3 connectivities were established
from the COSY contour map, while resonances to H-4 were noted in the Relay COSY, (Spectrum
21, page 133) and in the H-1 track of the HOHAHA experiment. In addition connectivities to H-5
were observed in the H-2 track of the HOHAHA spectrum.
Residue c The chemical shifts for the H-1 to H-6a/6b resonances were established
completely from the COSY spectrum.
Residue d The chemical shifts for the H-1/2 and H-2/3 connectivities were established
from the COSY contour map, while resonances to H-4 were established in the H-2 track of the
Relay COSY contour map. Returning to the COSY spectrum the H-4/H-5 cross peak was
identified and the chemical shift for H-5 established. The assignments were confirmed in the H-1
track of the HOHAHA spectrum. The 1 H chemical shifts, above, were compared with the 1 H_13C
correlation data obtained from the HETCOR experiment (Spectra 22 + 23, page 134-135), and
permitted the unambiguous assignment of all the 13C resonances for residue .£ and 9" C-1 to C-4
of residue !, and C-1 to C-5 of residue!!. The assignment of the chemical shifts for C-5/H-5 and
C-6/H-6a,6b for residue !, C-6/H-6a,6b for residue !!, and all of the 13C/1 H resonances for the -+
3)-galactitol, residue ~, were accomplished mainly from an HMBC (Heteronuclear Multiple Bond
Correlation) experiment, (Spectrum 24, page 136) measuring through-bond connectivity between
C and H atoms, two and three bonds distant. Thus H-4 of !! showed a correlation to 13C
resonance at 61.47 ppm which was assigned to C-6 of this residue. The chemical shifts for H-6a
and H-6b of!! followed from the 1H_13C correlation data.
Residue e On the basis of literature values, which show that the chemical shifts for
unlinked primary carbon atoms of alditols occur between 1-1.5 ppm lower field than those of
hexopyranoses, the unassigned sets of 13C/1H resonances: 63.83 ppm/8 3.709 and 63.98 ppm/8
3.726 were assigned to the C-1/H-1 and C-6/H-6a,6b resonances of~. The remaining 13C/1H

124
resonances for ~ were established by comparing the correlations established from the HMBC
experiment (Spectrum 24, page 136) with the 1H_13C correlation data form the HECTOR
experiment (Spectra 22,23, page 134-135). The correct sequence of the carbon atoms in ~ was
established by assigning the most downfield 13C resonance of ~ to the linkage carbon, C-3
(known from methylation analysis). The HMQC-TOCSY spectrum (Spectrum 25, page 137)
supported the sequence of the carbon atoms in the alditol ~.
Comparison of the NMR data for residues !! - ~ with those for model compounds
identified the residues in P1-01 as indicated on. The significant deshielding of the C-2 of !!, C-2
of ~ and C-4 of g, identified these as residue linkage positions. These results accord with the
methylation results for P1-01. The remaining two sets of 1 H/13C chemical shifts could now be
assigned by inspection to C-5/H-5 and C-6/H-6a,6b of residue !!.
The sequence of the residues!! - ~ (P1-01) was established from an HMBC experiment,
(Spectrum 24, page 136). The relevant 3 bond relayed connectivities are listed in table 12.
Table 12.
HMBC Correlation data for P1-01
Residue Proton Shift(8)
!! (H-1) 5.26
~ (H-1) 5.20
.£ (H-1) 4.65
g (H-1) 4.611
~ (C-3)
!! (C-2)
g (C-4)
~ (C-2)
correlated residue (carbon)
79.16
80.00
80.80
78.46
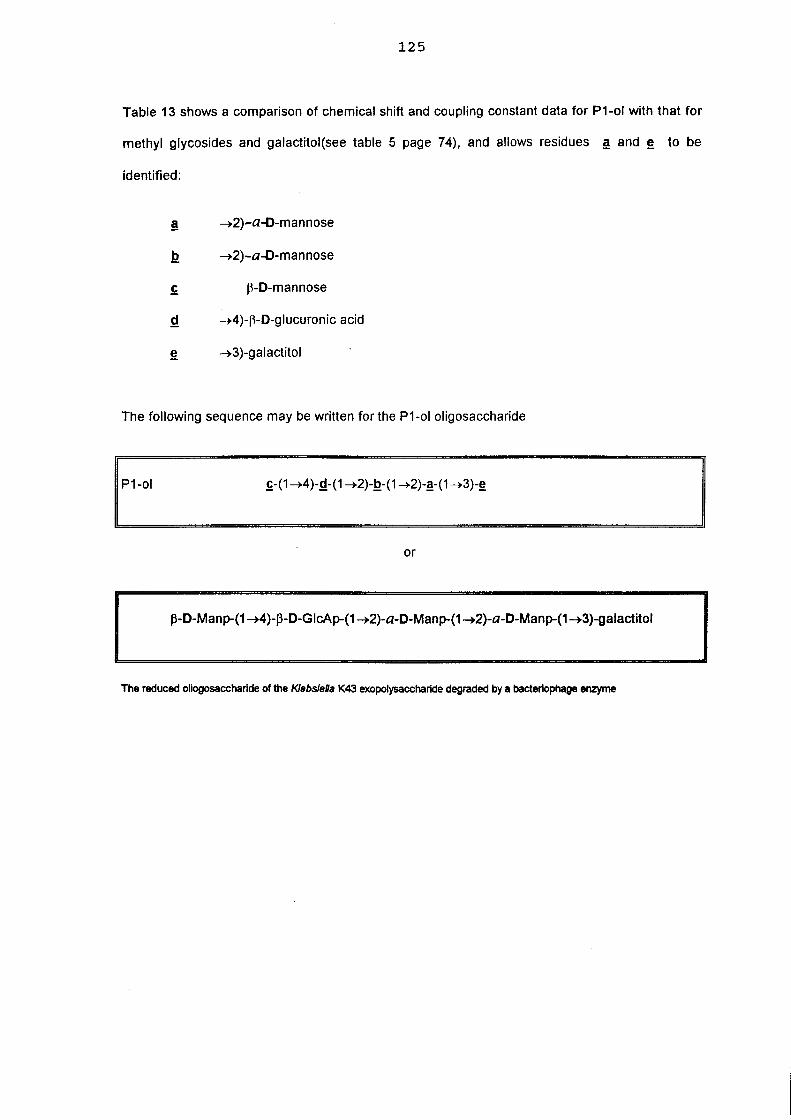
125
Table 13 shows a comparison of chemical shift and coupling constant data for P1-ol with that for
methyl glycosides and galactitol(see table 5 page 74), and allows residues ! and! to be
identified:
! ~2)-a-o-mannose
~ ~2)-a-D-mannose
~ J3-D-mannose
Q ~4)-J3-D-glucuronic acid
! ~3)-galactitol
The following sequence may be written for the P1-01 oligosaccharide
~-(1 ~4)-Q-(1 ~2)-~-(1 ~2)-!-(1 ~3)-!
or
p-D-Manp-(1 ~)-P-D-GlcAp-(1 ~2)-a-D-Manp-(1 ~2)-a-D-Manp-(1 ~3)-galactitol
The reduced oliogosaccharide of the KJebsieUa K43 exopolysaccharide degraded by a bacteriophage enzyme
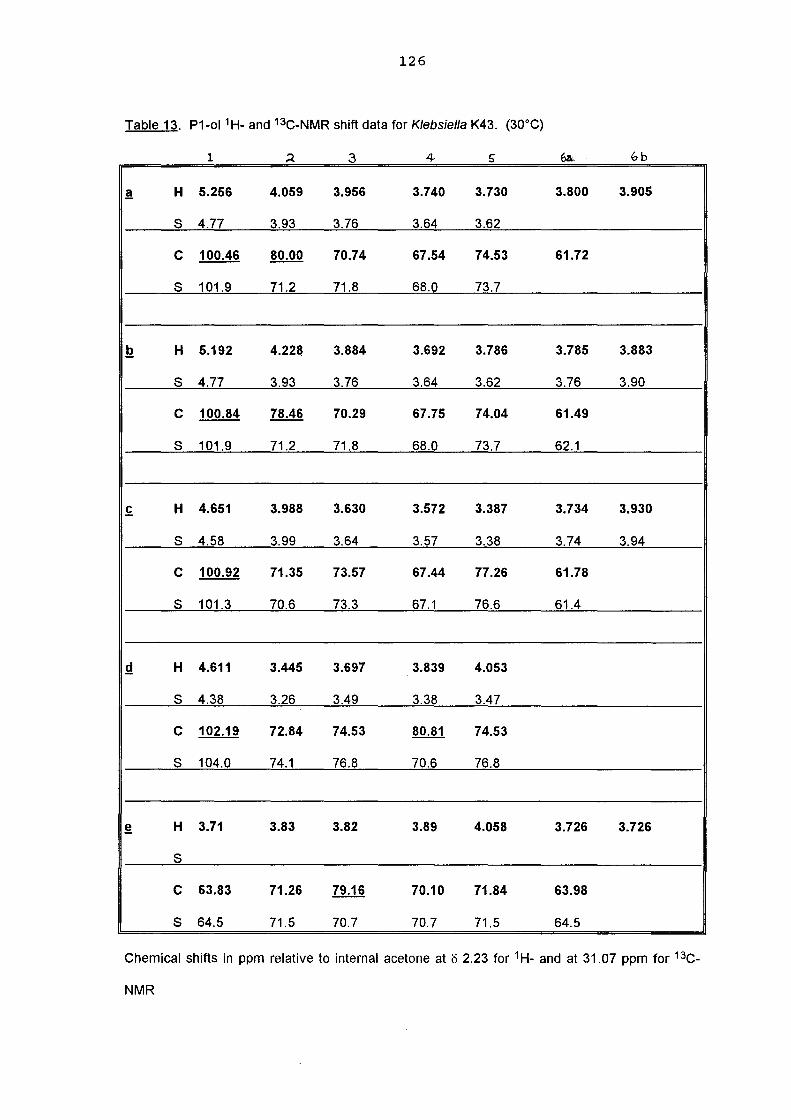
126
Table 13. P1-01 1H- and 13C-NMR shift data for Klebsiella K43. (30°C)
1 :3 4 bb
! H 5.256 4.059 3.956 3.740 3.730 3.800 3.905
S 4.77 3.93 3.76 3.64 3.62
C 100.46 80.00 70.74 67.54 74.53 61.72
S 101.9 71.2 71.8 68.0 73.7
~ H 5.192 4.226 3.884 3.692 3.786 3.785 3.883
S 4.77 3.93 3.76 3.64 3.62 3.76 3.90
C 100.84 78.46 70.29 67.75 74.04 61.49
S 101.9 71.2 71.8 68.0 73.7 62.1
~ H 4.651 3.988 3.630 3.572 3.387 3.734 3.930
S 4.58 3.99 3.64 3.57 3.38 3.74 3.94
C 100.92 71.35 73.57 67.44 77.26 61.78
S 101.3 70.6 73.3 67.1 76.6 61.4
g H 4.611 3.445 3.697 3.839 4.053
S 4.38 3.26 3.49 3.38 3.47
C 102.19 72.84 74.53 80.81 74.53
S 104.0 74.1 76.8 70.6 76.8
~ H 3.71 3.83 3.82 3.89 4.058 3.726 3.726
S
C 63.83 71.26 79.16 70.10 71.84 63.98
S 64.5 71.5 70.7 70.7 71.5 64.5
Chemical shifts in ppm relative to internal acetone at is 2.23 for 1 H- and at 31.07 ppm for 13C_
NMR

127
* Note residue g standard is methyl glucoside and not glucuronic acid, but serves as an indicator
of shift for cc;methyl glucuronic acid.
"S" refers to standard methyl glycosides : !S= methyl-a- D-mannose
gS= methyl-a- D-mannose
£S= methyl-j3-D-mannose
gS= methyl-j3-D-glucose
~S= galactitol
Underlined carbon shifts indicate pOints of linkage
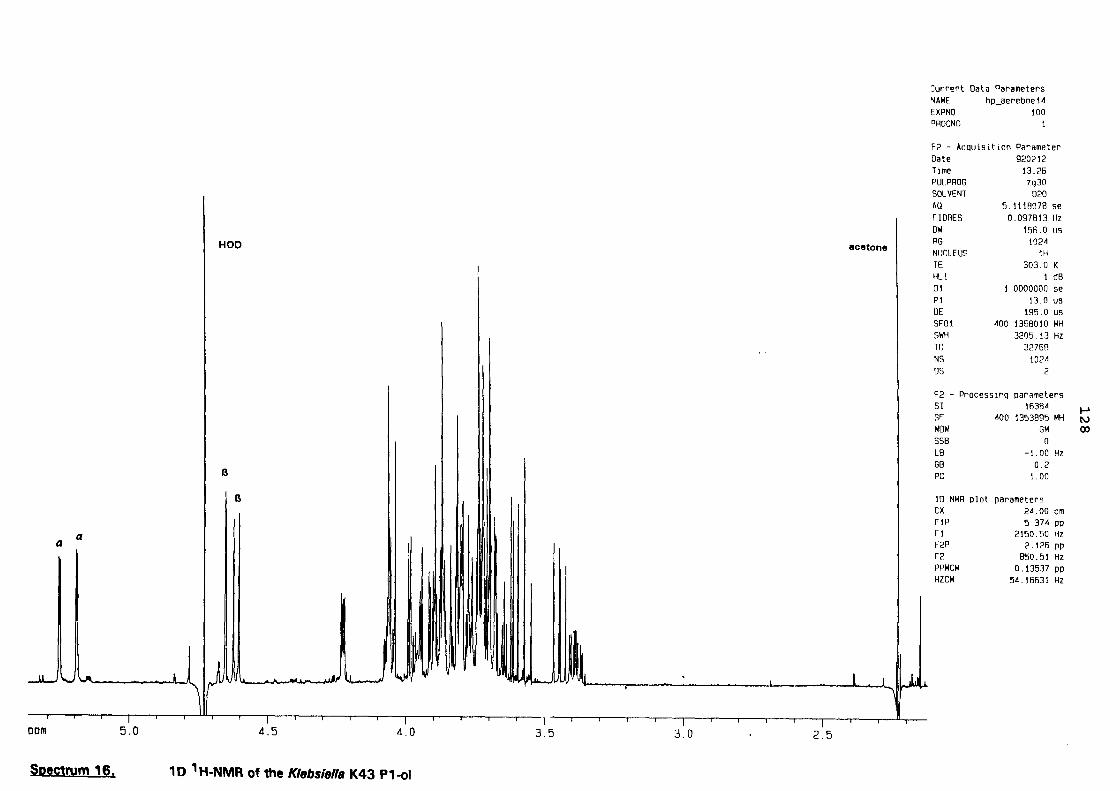
:urrent Data Parameters ~AME hp_aereboe 14 EXPNO lOa °ROCNO
F? - Acquisition Parameter Date 920212 Time 13.26 PULPROG zg30 SOLVENT D20 AO 5.1118078 se F !ORES 0.097813 Hz OW 156.0 us
HOD acetone RG 1024 NUCLEUS IH lE 303. a K HL\ I d8 01 .0000000 se PI \3.0 us DE 195.0 us SFOI 400 1368010 MH SWH 3205.13 Hz TO 32768 .. NS 1024 OS 2
F2 - Processing parameters 51 16384 ..... SF 400 1353895 MH N WOW GM 00 SSB 0 L8 -1.00 Hz GB 0.2
B PC 1. 00
B 10 NMR plot parameters CX 24.00 cm F1P 5.374 pp
Q Q
FI 2150.50 Hz F2P 2.126 pp F2 850.51 Hz PPMCM 0.13537 pp HICM 54.\663\ Hz
--"-- '-' .A I 1 I)~ uJt. lL...-..,.. II.) ~ I I J ~~ '\
- . ""\
I I 1
oom 5.0 4.5 4.0 3.5 3.0 2.5
SDectrum 16. 10 1 H-NMR of the Klebsiella K43 P1-ol

HOD
B J a a B
T -- -~- ----i----TH
- I I I I I 1---- ---r pm 5.2 5.1 5.0 4.9 ,j.B ,j.7 4.6 4.5 4.,j 4.3 4.2
..... 1 u ..... IID ft~ ........ ri,. ... ninn .. Ynl'ln~inn of the Klebsiella K43 P1-ol
Current Data Parameters NAME hp_aereboe 14 EXPNO 100 PROCNO
F2 - Acquisition Parameter Date 920212 Time 13.26 PULPROG zg:JO SOLVENT O?O All 5.1118078 se FlORES 0.097813 Hz OW 156.0 us RG 1024 NUCLEUS IH TE 303.0 K HU d8 01 1.0000000 se PI 13 0 LIS
DE 195.0 us SFOI 400.1368010 MH SWH 3205.13 Hz TO 32768 NS 1024 OS 2
F2 - Processing parameters 51 16384 SF 400. 1353895 MH WOW EM SSB 0 LB 0.30 Hz G8 0 PC 1.00
10 NMR plot parameters ex 24.00 em F1P 5.290 pp Fl 2116.68 Hz F2P 4.137 pp F2 1655.25 Hz PPMCM HZCM
0.04805 pp 19.22609 Hz
I-' I'V ~

Current Data Parameters NAME hp _aereboe 14 orNO 200 PROCNO I
F2 - ACQUlsitlon Parameter~ Date 920306 Time 20 39 PULPROG zgpg30 SOLVENT 020 AtJ 0.6225920 set FlORES 0.8030Q4 Hz OW 19.0 USE RG 32768 NUCLEUS DC TE 303 0 K HU I dB OJ I .0000000 set P31 100 0 USE 54 26 dB OU 0.0300000 Set
S2 25 dB PI 7 5 USE DE 23.B USE SFOI 100.627 \\80 MHz SWH 26315.79 Hz TO 32768 NS 39229 05 2 .... F2 - Processing parameters W
0 SI 32768 SF 100.6140480 MHl WOW E.M 558 a LB .00 Hz GB 0 PC .40
10 NMR plot parameters CX 23.90 em FIP 103.076 ppn FI 10371.07 Hz F2P 99.487 ppn F2 10009.75 Hz PPMCM 0.15026 ppn HZCM 15.11812 Hv
lpm r- I I I I I I I
100 95 90 85 80 75 70 65
.. "' 13" .. IUD ... f .,,_ KI.ltttiAl'" K43 P1 -01

131
- OD -.. IU24/5
,1 , itt (J. 3.5
• II .. 0 0 sl213
If'
oorJ 419 tl £5/6b
0 ~415 Yo • • • . . OJ 25/68 4.0
0 (l to OO~· 11) £2/3
0 0
0 00 l!2/3
4.5
i'~ 0 000 £1/2
gl/2
5.0
!!' /2
Q 0 !1/2
0 0 ppm
I I I I I I I I I I I I I I I
ppm 5.0 4.5 4.0 3.5
Spectrum 19. 20 1 H-' H-NMR COSY contour map of the Klebsiella K43 P1-ol

II
I I I
ppm
0
0,
0' d
Spectrum 20,
I I i
5.0
~t
~ It
" c ~
...(GI
I I I
4.5
I
• e
o
132
00 •• 1 If .;.215
~ I I 101 g1J5 I g1l4 sl1/3 I
.. 0" a
!,-1/2 !Si3 !.1/4
I i I I I
4.0 I I I
' , "1 .,t ~.: , ..
If) ••
00' g112
I I I
3.5
20 H_1 H-NMR HOHAHA contour map of the Klebsiella K43 P1-01
3.5
4.0
4.5
5.0
ppm

133
9 I B U iii ~illll: II~ 3.5
°a • ~IIG. . .~iio .-a I d:ll Q '. ·,1' iII.~ :
I 0 • I , 001
~ ttl: ~~ !P. 0 4.0
0 {9 10 ~ .. t6~O 'I
• J!214
• 00 Ot.
4.5
000 00 ~8
5.0
w 0' 0 ~ Q 0 " ppm
I I I I ppm 5.0 4.5 4.0 3.5
Spectrum 21. 20 1H-1H-NMR Relay COSY contour map of the Klebsiella K43 P1-01
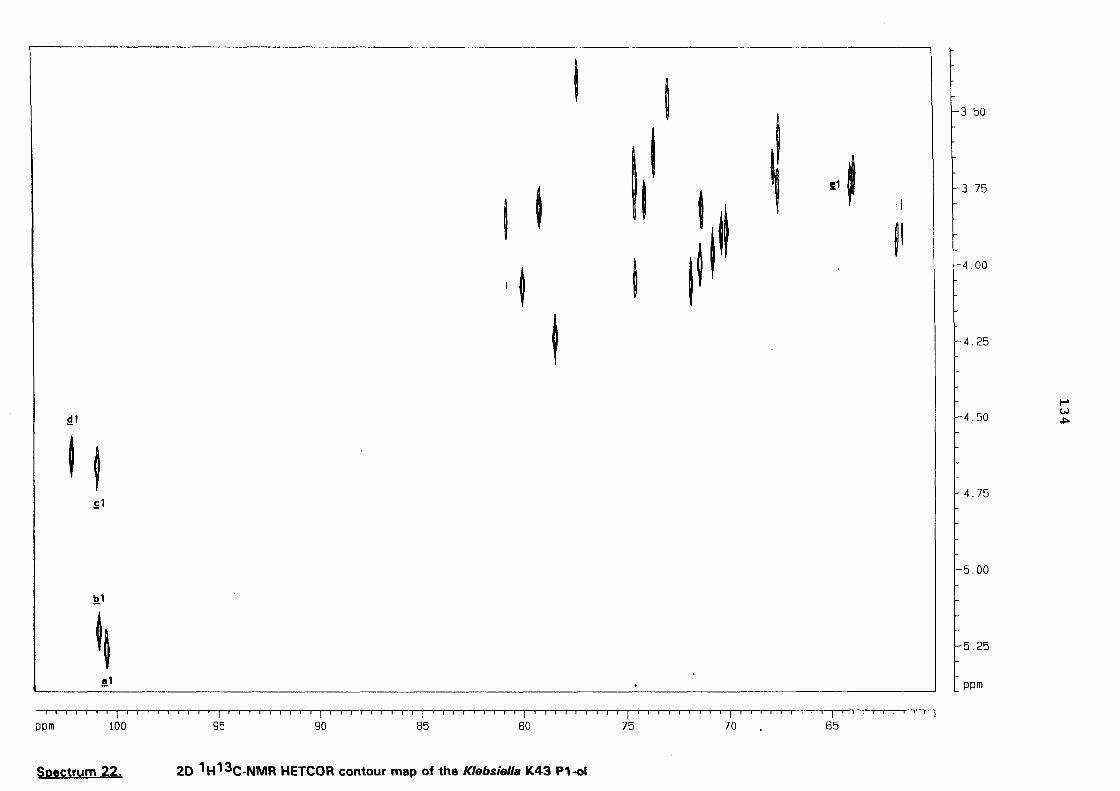
I I I I I H.50
I t
I I ~ I I' I H. 00
I ~
~ I 1-4.25
I ~ ..... ~1 I 1-4 . 50
w ~
t f I 1-4.75
£1
5.00
!!'
~t 5.25
,!, ppm
i' I I I , I ' I I I I I I I 11 I I I I I I r-~-I-~T T-T~- T- }-1 ppm 100 95 90 85 80 75 70 65
Spectrum 22. 20 'H'3C-NMR HETCOR contour map of the Klebsiella K43 P1-ol

I I I f-3. 4
.£5 .£ 4
g2
gJ ~
T I f-3. 6
!,6
!!5 ~ !,J rr '4~, I ~ ~ , !!6b I I I f-3.8
!,1
!4
~.o ~ ' .. 0 I f ...... w Ul
!6I. I f-4. 0
~ g5
!2 ~ !,5 I I
4.2
!!2
ppm
, -T-----.- r I I I I I I I I I I ppm 80 78 76 74 72 70 68 66 64 62
Spectrum 23. 20 1 H_13C-NMR HETCOR contour map expansion of the Klebsie//B K43 P1-ol

06 OG
!.H-l!.t-3 a -----l!.H-l/!.C-2
t) 'd H-l/b.e.2 ./ -' -
~ .
0"-... c.H-l/g.C-4
64 ilt
H
!. C-6/H6a.6b
C1)
... U. II 00 It
"'0 '
!. c!-l/H-l 0 Gel
l!.H-4/l!.£-6 , ~.
~"~l,aOI
'. ~;Jlj: -gl tl()11
.' I I , . \ ..
-OD • rTTTT-rTTT-rl IIIII ,-TI 11111 IIIII IJ 111'1
ppm 5.0 4.5 4.0 3.5
Spectrum 24. 20 1 H_13C-NMR HMBC contour map of the Klebsiella K43 P1-01
60
70
80
90
100
ppm
I-' w 0\

• • C6H5
· eo
o
o
137
·~o. I
Cooc .0 .: :J
BJOO
I t.
O(¢)o .. Got
I I I I I i I I I I r I iii I I I I I I i I I r I I Iii I I ii' I I I , I I I I I I I i
ppm 4.2 4.0 3.8 3.6 3.4
65
70
75
80
ppm
Spectrum 25. 20 1H-13C-NMR HMOC-TOCSV contour map of the Klebsiella K43
P1-ol galactitol

138
6.2.(iv). NMR investigation into the oligosaccharide Pi
The assignment of the 1H- and 13C-NMR chemical shifts for P1 was complicated by the
occurence of two populations of oligosaccharide causing cluttered spectra which
contained overlapping resonances. The a-anomeric region of the 1 D 1 H-NMR was
initially confusing, because of inherent partial superimposition of two apparently different signals.
Use of data aquired from the P1-ol NMR study was helpful in aSSigning shifts which were either
poorly relayed in 20 experiments, or partially overlapped by other resonances.
The 1 H-NMR spectrum of P1, (Spectra 26+27, page 144-145) recorded at 30°C,
contained H-1 resonances for a-·residues at 8 5.294 (J12 1.37 Hz), 8 5.281 (J12 1.96 Hz), 8 , ,
5.290 (J1,2 3.72 Hz), 8 5.164 (J1,2 1.76 Hz) and ~-residues at 8 4.637 (J1,2 0.97 Hz), 8 4.63 (J1,2
8.02 Hz) and 8 4.595 (J1 2 7.83 Hz).
The resonances at 8 5.290 and 8 5.164 were assigned to a-D-Galp and a-·D-Manp
respectively. Those at 8 5.294 and 5.281 were tentatively assigned to an a-D-Manp.
Resonances at 8 4.637, 4.631 and 4.595 were assigned to B-D-Manp, B-D-Galp and B-D-GlcpA.
The 13C-NMR spectrum, (Spectrum 28, page 146) contained C-1 signals at 95.14, 95.33,
92.99, 100.90, 100.71,97.06 and 102.03 ppm, and signals for CH20H at 61.78, 61.71,62.04,
61.61, 61.82 and 61.84 ppm, and a signal at 174.95 ppm indicative of the uronic acid carbonyl.
The chemical shifts of most of the 1H and 13C resonances as listed in (Table 15, page
142), were established mainly from 1 H_l H homonucle,ar correlation experiments, (COSY and
HOHAHA), and inverse-detected 13C_1H correlation (HMQC, HMQC-TOCSY and HMBC)
experiments. The residues were labelled arbitrarily!! to ! in order of decreasing chemical shift of
the H-1 resonances.
2D NMR INVESTIGATION INTO THE REPEATING UNIT STRUCTURE Pi
Residue a. The chemical shifts for H-1 to H-6a,6b were established from the Cosy-45
contour map, (Spectrum 29, page 147) and the weak H-4,5, cross-peak was detectable.

139
Residue b. The chemical shifts for H-1 to H-4 were established from the COSY contour
map and H-4 from the H-2 track in the HOHAHA, (Spectrum 30, page 148).
Residue c. The chemical shifts for the H-1 to H-3 resonances were established from the
COSY contour map, whilst H-2 to H-5 were established in the H-2 track of the HOHAHA
spectrum. H-6a,6b could not be determined with any certainty.
Residue d. The chemical shifts for the H-1 to H-6 were easily established from the
COSY contour map.
Residue e. The chemical shifts for the H-1 to H-5 resonances were established from the
COSY contour map, the H-4,5 cross-peak was weak but discernable.
Residue f. The chemical shifts for the H-1 to H-3 resonances were established from the
COSYcontour map and H-1 to H-5 in the HOHAHA contour map.
The 13C data was established by comparing the 1 H assignments with the 1 H_13C HMQC
experiment (Spectrum 31, page 149). Assignment of C-6's was difficult, however data obtained
from the HMQC-TOCSY experiment (Spectrum 32, page 150) enabled C6 determination from
H5C5 to H5C6 relayed connectivty, e.g. residue ~ H5C5 at (8 3.384)(77.22 ppm) showed a
relayed connectivity to H5C6 at ( 3.384)(61.82 ppm), thus establishing the chemical shift for!! C-
6.
The sequence of the residues was established from the HMBC correlation experiment,
(Spectra 33 page151). The pertinent correlations are presented in Table 14.

140
Table 14.
HMBC Correlation data for P1.
Residue Proton Shift (*) Correlated residue (carbon)
~ (H-1) 5.281 uncertain to ! (C-3) 73.90
~ (H-1) 5.281 ~ (C-3) 77.30
~ (H-1) 5.294 weak to ~ (C-2) 80.19
£ (H-1) 5.164 £ (C-3) 70.24
£ (H-1) 5.164 £ (C-S) 74.10
£ (H-1) 5.164 ~ (C-2) 80.19
£ (H-1) 5.164 weak to £ (C-2) 78.21
g (H-1) 4.637 ! (C-4) 80.92
g (H-1) 4.637 g (C-2) 71.36
~ (H-1) 4.631 ~ (C-3) 77.30
! (H-1) 4.595 £ (C-2) 78.21
! (H-5) 3.923 ! (C-6) 174.95
! (H-4) 3.785 ! (C-6) 174.95
Table 14 shows a comparison of chemical shift and coupling constant data with that for methyl
glycosides (see Table 5, page 74), and allows residues! to! to be identified as:
! ~3}-a-D-galactose
~ ~2) -a-D-mannose
£ ~2)-a- D-mannose
g p-D-mannose
~ ~3)-p-D-galactose
! ~4)-P-D-glucuronic acid

141
The following sequence may be written for the P1 oligosaccharide
g-(1 ~4)-f-(1 ~2)-£-(1 ~2)-!l-(1 ~3)-!t
OR
~-D-Manp-(1 ~)-~-D-GlcAp-(1 ~2)-a-D-Manp-(1-+2)-a-D-Manp-(1-+3)-, ~-D-Gal
The P1 oligosaccharide of the KJebsie.a K43 exopolysaccharide degraded by a bacteriophage enzyme
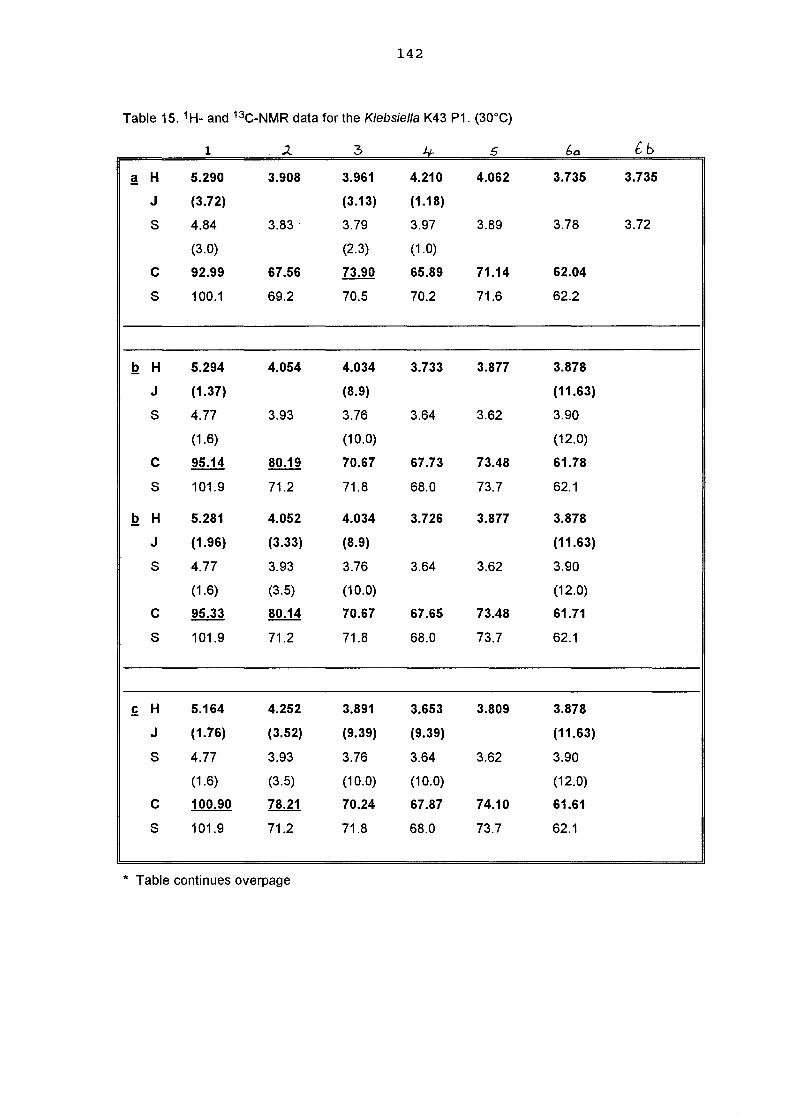
142
Table 15. 1H- and 13C-NMR data for the Klebsiella K43 P1. (30°C)
1 ).. :3 '+ 5 60 6b
! H 5.290 3.908 3.961 4.210 4.062 3.735 3.735
J (3.72) (3.13) (1.18)
S 4.84 3.83· 3.79 3.97 3.89 3.78 3.72
(3.0) (2.3) (1.0)
C 92.99 67.56 73.90 65.89 71.14 62.04
S 100.1 69.2 70.5 70.2 71.6 62.2
I! H 5.294 4.054 4.034 3.733 3.877 3.878
J (1.37) (8.9) (11.63)
S 4.77 3.93 3.76 3.64 3.62 3.90
(1.6) (10.0) (12.0)
C 95.14 80.19 70.67 67.73 73.48 61.78
S 101.9 71.2 71.8 68.0 73.7 62.1
I! H 5.281 4.052 4.034 3.726 3.877 3.878
J (1.96) (3.33) (8.9) (11.63)
S 4.77 3.93 3.76 3.64 3.62 3.90
(1.6) (3.5) (10.0) (12.0)
C 95.33 80.14 70.67 67.65 73.48 61.71
S 101.9 71.2 71.8 68.0 73.7 62.1
£ H 5.164 4.252 3.891 3.653 3.809 3.878
J (1.76) (3.52) (9.39) (9.39) (11.63)
S 4.77 3.93 3.76 3.64 3.62 3.90
(1.6) (3.5) (10.0) (10.0) (12.0)
C 100.90 78.21 70.24 67.87 74.10 61.61
S 101.9 71.2 71.8 68.0 73.7 62.1
.. Table continues overpage

143
5
~ H 4.637 3.989 3.634 3.565 3.384 3.731 3.929
J (0.98) (3.13) (9.59) (9.59) (2.35,6.46)
S 4.58 3.99 3.64 3.57 3.38 3.76 3.94
(0.9) (3.2) (10.0) (10.0)
C 100.71 71.36 73.43 67.45 77.22 61.82
S 101.3 70.6 73.3 67.1 76.6 61.4
! H 4.631 3.573 3.751 4.154 3.678
J (8.02) (9.98) (3.33) (0.98)
S 4.31 3.50 3.64 3.92 3.68 3.80
(8.0) (10.0) (3.8) (0.8)
C 97.06 71.10 77.30 65.29 75.77 61.84
S 104.5 71.7 73.8 69.7 76.0 62.0
f H 4.595 3.436 3.674 3.785 3.923
J (7.83) (9.39) (9.39) (9.95)
S 4.38 3.26 3.49 3.38 3.47
(8.2) (9.6) (9.6) (9.6) (---)
C 102.03 72.91 74.58 80.92 75.54 174.95
S 104.0 74.1 76.8 70.6 76.8 61.8
Chemical shifts in ppm relative to internal acetone at 8 2.23 for 1H_ and at 31.07 ppm for 13C_
NMR.
* Note residue f standard is methyl glucoside and not glucuronic acid, but serves as an indicator
approximating B-methyl glucuronic acid. "S" refers to standard methyl glycosides: . ~ S = methyl- a- D-galactose
Q S = methyl- a-D-mannose .£ S = methyl· a-O-mannose ~ S = methyl-B-D-mannose ! S = methyl-B-D-galactose f S = methyl-B-D-glucose
Underlined carbon shifts indicate points of linkage

Current Data Paremeters
hp_aereboe1 100 1 Klebsiella K43 NAME hp _aereboe I EXPNO 100 PROCNO I
F2 - Acquisition Parameter Date 910509 TIme 10.59 PULPROG zg30
HOD NUCLEUS IH SOLVENT CDCl3 AO 3.40787<'0 se FIDRES 0.146719 Hz DW 104.0 us RG ?048 HL1 1 dB Dl .0000000 se PI 13.0 us RD o 0000000 se PW 0.0 us DE 130.0 us SFDI 400. 1368820 MH SWH 4807.69 Hz TD 32768 NS 128 DS 2
B F2 - Processing parameters ~ SI 16384 ~
a SF 400.1353749 MH ~ WOW EM
a SS8 0 L8 0.30 Hz
a B G8 0 PC 1.00
ID NMR plot parameters CX 23.90 cn F1P 5. 500 p~ Fl 2200.74 Hz F2P 3. 200 D~ F2 1280.43 Hi PPMCM 0.09623 Dr HZCM 38.50575 Hi
;lprn r--r--..,----,--,----r--r---.--r----,----,---.----,----,--_....-__ ,--_--, __ r-_,_---,~-,_-__,-__,
, A 5.2 5.u 4.tl 4.0 4." 4.e: 4.U j.t! 3.6 3.4
Spectrum 26. '0 1 H-NMR of the Klebsiella K43 P'

fARTIAlJ.V
ppm
SUPE: It Ifl'I po SIOD
Q-ftNOme-~s ~..,
~ ~
,J
(, a
a '\.",,,·11.
~
A l.(,,\-I1-
a
r I I I I 5.3 5.2 5.1 5.0 4.9
Soectrum 27. 10 1 H-NMR anomeric region expansion of the Klebsie/ls K43 P1
HOD
B
4.8 4.7
B
4.6
B .... ~ 01

acetone
0-0
ITT IT1 rTT'TTTT~T I I' I I I" I I I' I I i I I I' I I I' I I I I' I I I I' iii
ppm 160 140 120 100 80 60 40 20
Spectrum 28. 10 13C-NMR of the Klebsiella K43 P1
..... oj:>.
0\

147
Spectrum 29. 20 1H-1H-NMR COSY contour map of the Klebsiella K43 P1
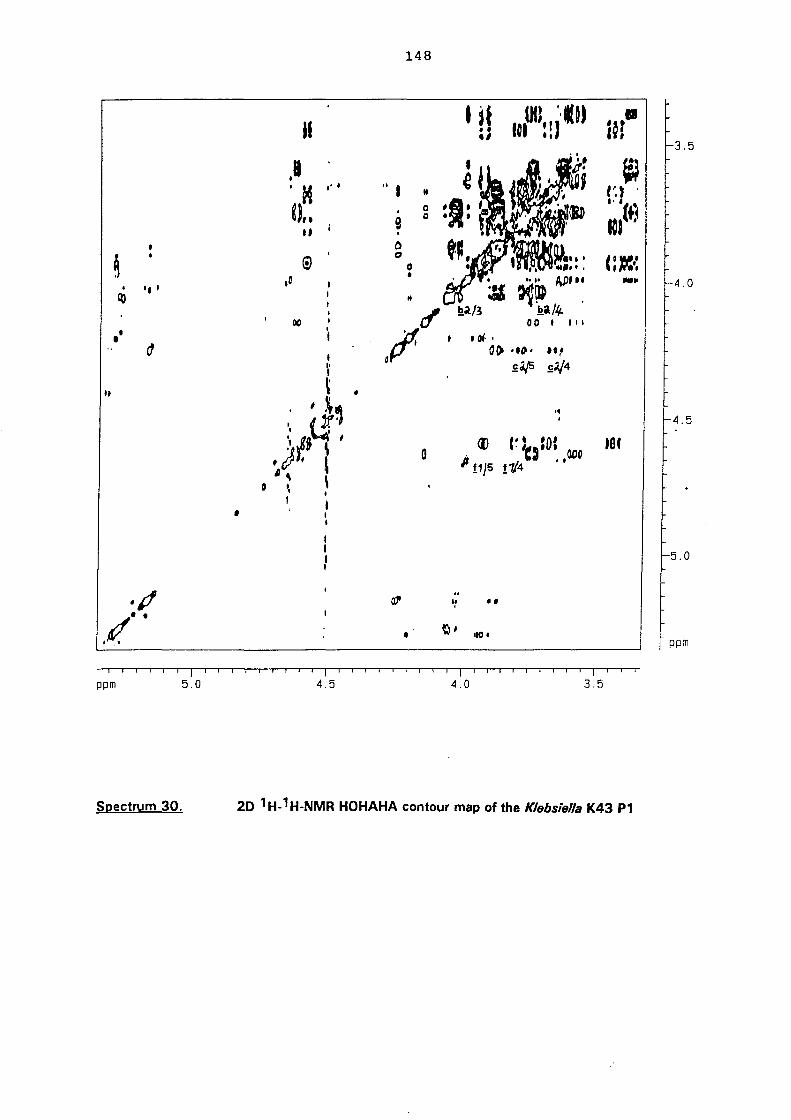
I, '
It
·tf tI' · , .'
I I
ppm I I I
5.0
Spectrum 30.
•
II
,8 , K I"
U,. II
00
I 4.5
•
" I . 9 o o
148
o •
"
,.
" o o
o
I I 4.0
I .. .... PJJ, If
~~a/lf. . 00 I 'I I
.01· , a~ -."', ",'
••
110 •
B~ B;J4
'. .
,~.
hS
I I I
3.5
•
20 1 H_1 H-NMR HOHAHA contour map of the Klebsiella K43 P1
3.5
4.0
4.5
5.0
ppm

i r- 60
0° •• • .'0.. ~.~ •••
-Alto •• I ~ 70 ... 'i D"CD... • •• 40. ,. 4::
., 0'" 0 O· ••• r 80
.... oj:>.
\0
I -- r- T- T T --'1 I I I " I I I ppm 5 .00 .; . 75 4.50 4.25 4.00 3./5 3.50
Spectrum 31. 20 1 H_13C-NMR HMQC contour map of the Klebsiell. K43 P1

0
• t
o ~
•
<>
~~-H.-5/C-6 e:ar Q- H-5/C-G b P ,,-S/c-6' d H-sjC-6
, 0 - f/-,5 c-6 •• I -
o .~~. 00 r · • o c:::JO () 0 • • ~ 00 0 Of Qfl-s(C~ .Ji,H-;/C- ~\o' t,... ~~,~ co ..
() 0 QCX?o.", .. • • 0 f 1I'~/c-~ .. 00tIJ •• •
C> ~ 00 ~ H-Sjc.-5 .d. 11-*-5 I • 0 00 0 I.. 00 •
•• .,
000 .. OliO
'.0 .. ()(> .t. (1110
I I I I I -------r I I -~--.----. --~ r - T If
ppm 5.00 4.75 4.50 4.25 4.00 3.75 3.50
Spectrum 32, 20 1 H_13C-NMR HMQC-TOCSY contour map of the Kleblliella K43 P1
flO .... U1 0
f-- 80
90
100
ppm

J ~ f d~ O~I
1 l65 I
~, ~ t~~I' ~ ~, '
o ~ I ~ lu ~I ~ f ~al ~ I r70 ...... Ul ......
, 0 tl'l ~~~~ eIe ~e r H5 l!1-3! !1-2Q
t ~ II~ "
-~,
t~ t £1-2~ ~
~ ,
~ .,-41 ~ "
I 1-80
I I ppm
I I I I I I I I' I I I r I I ppm 5.0 4.5 4.0 3.5
Spectrum 33. 20 1H-13C_NMR HMBC expansion contour map of the Klebsiella K43 PI
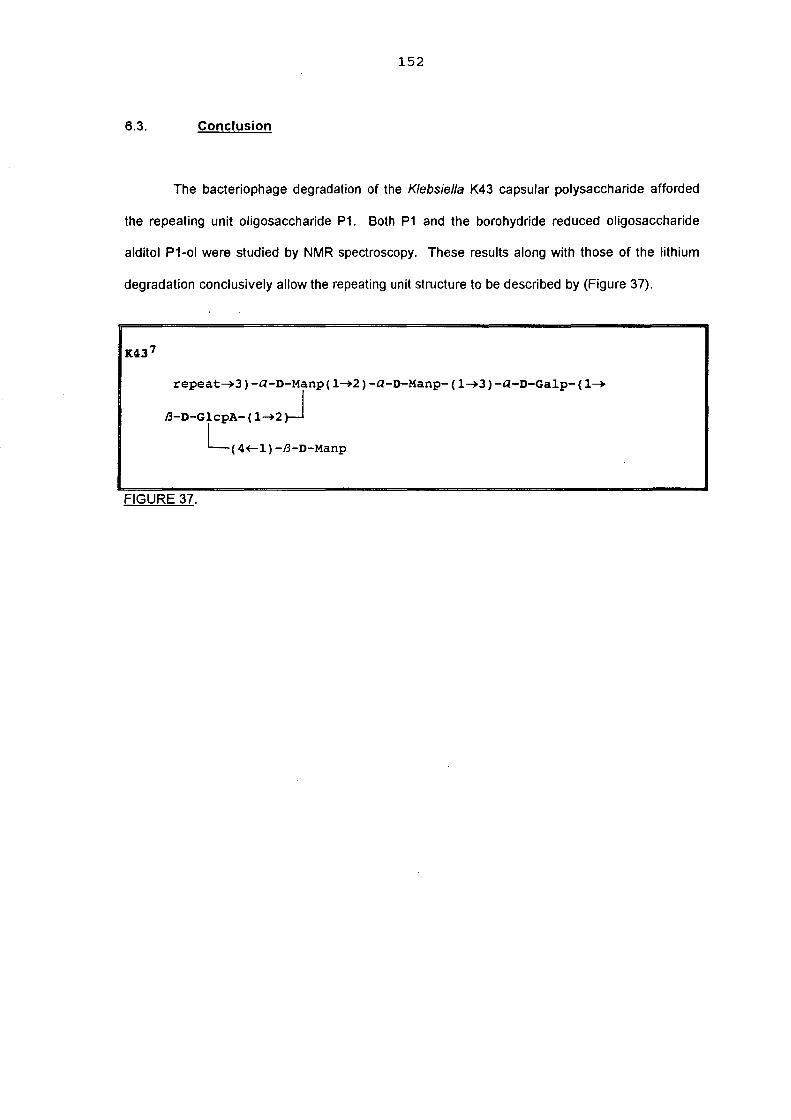
152
6.3. Conclusion
The bacteriophage degradation of the Klebsiella K43 capsular polysaccharide afforded
the repeating unit oligosaccharide P1. Both P1 and the borohydride reduced oligosaccharide
alditol P1-01 were studied by NMR spectroscopy. These results along with those of the lithium
degradation conclusively allow the repeating unit structure to be described by (Figure 37).
repeat~3)-a-D-Manp(1~2)-a-D-Manp-(1~3)-a-D-Galp-(1~
J3-D-GlcpA- (1~2 J ~(4+-1)-J3-D-Manp
FIGURE 37.
153
7. A STUDY OF DATA ACCUMULATED FROM SEROLOGICAL STUDIES ON
KLEBSIELLA K-ANTIGENS, PERTINENT TO PREDICTING THE PARTIAL
STRUCTURE OF THE KLEBSIELLA K43 ANTIGEN
This section illustrates the usefulness of cross-reactive fitting of an unknown
polysaccharide antigen, by antibodies generated from antigens of known chemical structure, as
advised by Van Regenmorten274. This serological technique is useful in choosing which antigens
might be dedicated to further chemical elucidation, and reveals elements which may be expected
in an unknown structure.
Heidelberger, Dutton and Nimmich amongst others conducted cross-reactivity studies on
Klebsiella K-antigens in anti-Pneumococcal, anti-Salmonella and anti-Klebsiella sera. By
quantitative and qualitative analysis of antibody-antigen precipitation they were able to build a
database, enabling the chemical constitution of unknown Klebsiella polysaccharide K-antigens to
be predicted by their respective immunological specificities.
The most valuable chemical predictions arising out of their work are: monosaccharide
type, linkage type and tentative partial structures to unknown serotypes, indications of the
reactive centre of the polysaccharide and the linkage positions of various monosaccharides,
information regarding the reducing monosaccharide of an isolated repeating unit, and attachment
of non-carbohydrate appendages.
Problems encountered in the research were: a lack of complete chemical structure of
certain Pneumococcal and Salmonella serotypes, and the lack of an explanation for the fact that,
Klebsiella K-antigens contained D-Mannose, but Pneumococcal serotypes did not, and
Pneumococcal serotypes contained amino sugars which Klebsiella Serotypes did not.
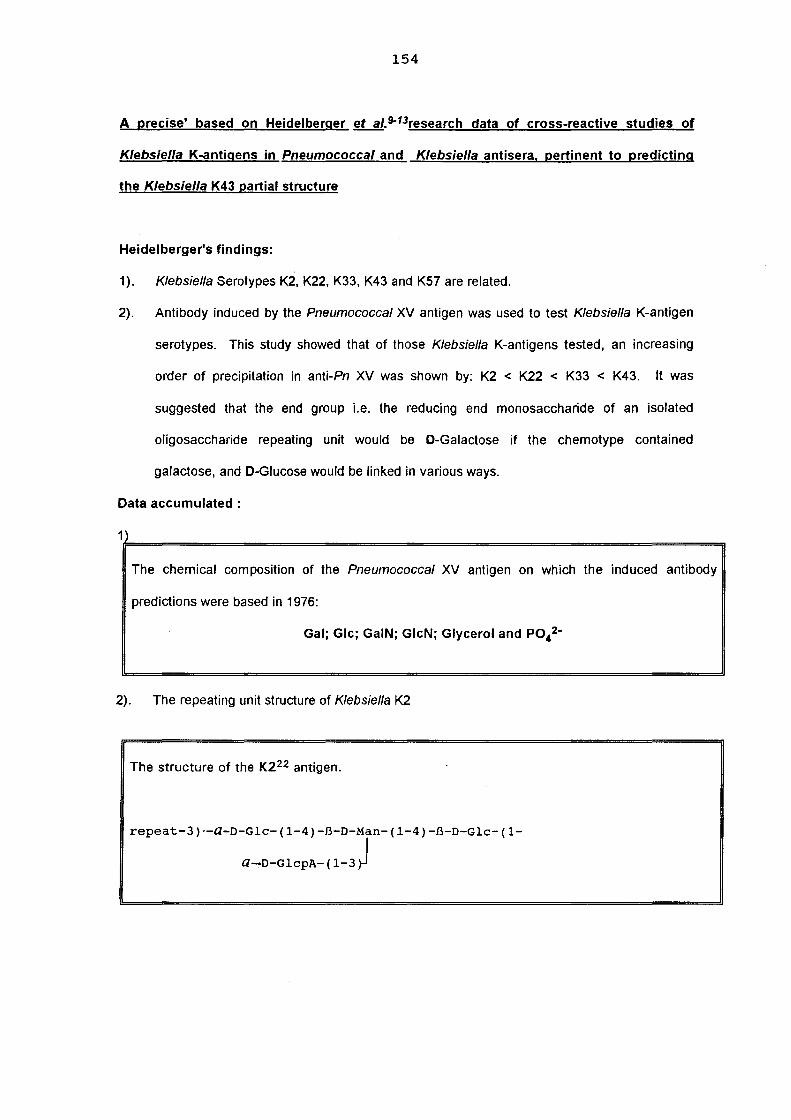
154
A precise' based on Heidelberger et al.9-13research data of cross-reactive studies of
Klebsiella K-antigens in Pneumococcal and Klebsiella antisera, pertinent to predicting
the Klebsiella K43 partial structure
Heidelberger's findings:
1). Klebsiella Serotypes K2. K22. K33, K43 and K57 are related.
2). Antibody induced by the Pneumococcal XV antigen was used to test Klebsiella K-antigen
serotypes. This study showed that of those Klebsiella K-antigens tested, an increasing
order of precipitation in anti-Pn XV was shown by: K2 < K22 < K33 < K43. It was
suggested that the end group i.e. the reducing end monosaccharide of an isolated
oligosaccharide repeating unit would be D-Galactose if the chemotype contained
galactose, and D-Glucose would be linked in various ways.
Data accumulated:
1 rr=================================================================,
The chemical composition of the Pneumococcal XV antigen on which the induced antibody
predictions were based in 1976:
Gal; Glc; GaiN; GleN; Glycerol and POl-
2). The repeating unit structure of Klebsiella K2
The structure of the K222 antigen.
repeat-3)"-Q-D-Glc-(1-4)-B-D-Man-(1-4)-B-D-Glc-(1-
Q-D-GlcpA- ( 1-3 J

155
3.a. Antibody induced by Klebsiella K22 was used to test Klebsiella K-2, 22, 33, 43 and 57 antigens.
The structure of the K2234 antigen used to induce its corresponding antibody.
a-D-G1CPA4(S)Lt-(1-6)-Q-D-GICP-(1-4~
repeat-3)-B-D-Galp-(l-4)-B-D-Glcp-(l-
Lt lactyl l(6)OAC
3.b. The repeating unit structure of Klebsiella K33
The structure of the K3347 antigen.
B-D-GalP3'4pY-(l-6)~
repeat-4)-B-D-Glcp-(l-4)-B-D-Manp-(l-4)-B-D-Manp6Ac-(l
a-D-GICPA-(l-3)~
3.c. The chemotype37 of the Klebsiella K43 antigen I Glucuronic acid; Mannose; Galactose.
3.d. Possible elements in common from this study:
3.d.i. The presence of a- or ~-GlcA in the side chain.
3.d.ii. The presence of 6-0-Ac in the structure.
Ac = acetyl
3.d.iii. If mannose is present in the backbone of the polymer, the uronic acid side chain may be
linked to position 3 of the man nose.
I
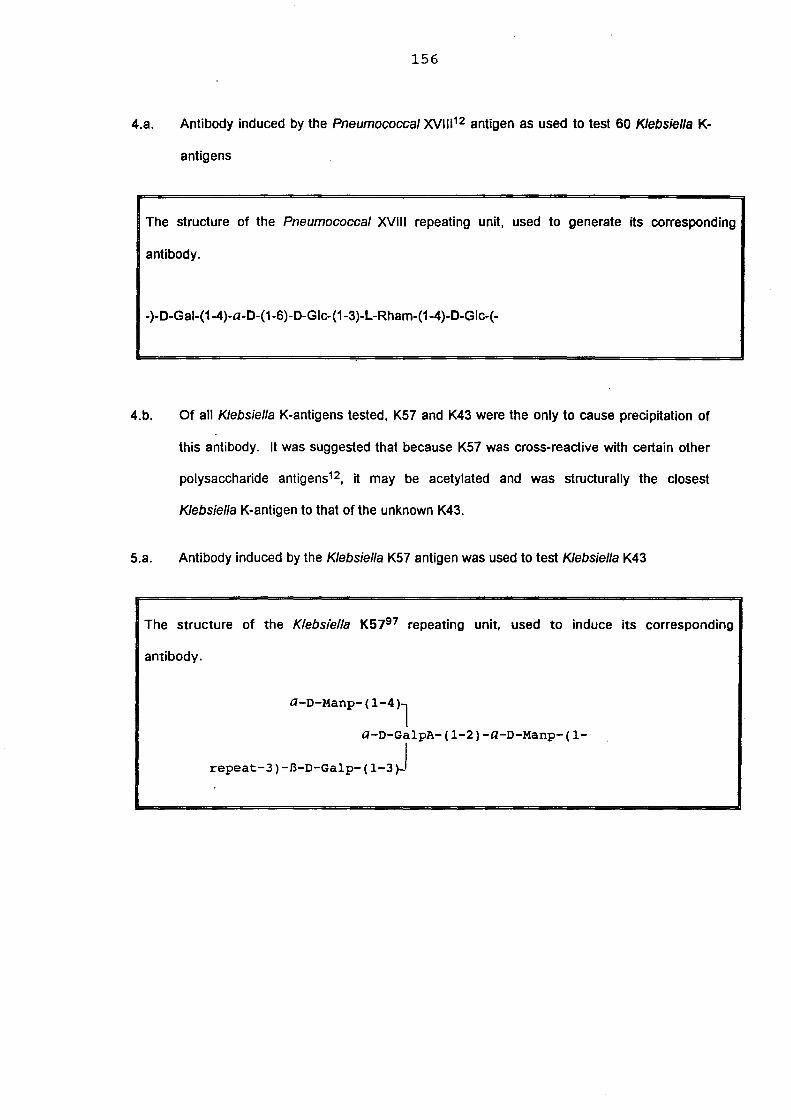
156
4.a. Antibody induced by the Pneumococcal XVlll12 antigen as used to test 60 Klebsiella K-
antigens
The structure of the Pneumococcal XVIII repeating unit, used to generate its corresponding
antibody.
-)-D-Gal-(1-4)-a-D-( 1-6)-D-Glc-(1-3)-L-Rham-(1-4)-D-GIc-(-
4.b. Of all Klebsiella K-antigens tested, K57 and K43 were the only to cause precipitation of
this antibody. It was suggested that because K57 was cross-reactive with certain other
polysaccharide antigens12, it may be acetylated and was structurally the closest
Klebsiella K-antigen to that of the unknown K43.
5.a. Antibody induced by the Klebsiella K57 antigen was used to test Klebsiella K43
The structure of the Klebsiella K5797 repeating unit, used to induce its corresponding
antibody.
a-D-Manp- (1-4)1
a-D-GalpA-(1-2)-a-D-Manp-(1-
repeat-3)-B-D-GalP-(1-3r1

157
S.b. Klebsiella K43 reacted strongly in anti-KS7 and this result lead Heidelberger to postulate
that the mannose linkages in K43 would be similar to that in KS7, and because K43 was
strongly cross-reactive in anti-KS7 serum, the chemical repeating unit of KS7 and K43
would be similar, although their uronic acids were galacturonic acid in KS7 and
glucuronic acid in K43.
Deductions made from this study allowing the most likely partial structure for the
Klebsiella K43 antigen to be postulated:
1. D-galactose may be the reducing end monosaccharide of an isolated repeating unit
oligosaccharide of K43.
2. D-glucuronic acid is present in the main chain or side chain.
3. The repeating unit may be acetylated, although probably not because KS7 is not
acetylated.
4. Mannose residues will be present and may be (1~2), (1~3) or (1~4) linked
5. Mannose residue(s) might be linked (1~4) to an uronic acid in the side chain.
6. If a mannose side chain is present, it could be linked to glucuronic acid.
7. If the uronic acid is in the side chain, the monosaccharide to which it is attached will be
of the inverse anomeric configuration to its self, i.e. an a-monosaccharide in the main
chain will probably be attached to a B-uronic acid.

158
The chemical repeating unit of Klebsiella K43 as determined in this work.
repeat43) -Q-D-Manp ( 142) -Q-D-Manp- ( 143) -a-D-Galp- (14
B-D-G1CPA-(142rl
~(4~1)-B-D-Manp
Conclusion to this literature survey.
Many of the deductions of bacteria polysaccharide structure made in the middle 1970's,
through cross-reactive serological studies on Klebsiella and Pneumococcal serotypes, aided by
their induced antibodies, correlate directly with many of the features found for the elucidated
structure of the Klebsiella K43 antigen. In particular, attention is drawn to the mannose linkage
types and the attachment of the uronic acid.
Whilst cross-reactivity precipitation studies may provide valuable structural information
and give direction to a study of an unknown polysaccharide antigen, they suffer because of the
need for a range of chemically known polysaccharides, availability of pure antibodies of known
mechanistic activity, and the difficulty in quantifying marginal precipitation reactions.
Although a conformational study on the Klebsiella K43 antigen is beyond the scope of
this thesis, it is interesting to note that a crystallographic183 study on K57 has revealed a trifolded
helix with an axial projection. This helix was also found to be highly extended in spite of a 1,2-
diaxial linkage being present in the main chain. It is important to note that, whilst the chemical
repeating unit may be fundamental to the antigenic character, it may not be the effective
biological repeating unit. Crystallographic or computer simulated conformational studies in
tandem with the observed serological reactivities are necesssary to adequately describe the
biological sequence of the antigen.

159
8. EXPERIMENTAL
8.1. General Methods.
Unless otherwise stated, solutions were concentrated under reduced pressure, at a
water-bath temperature not exceeding 40°C using a rotary evaporator. Optical rotations were
measured in a cell of pathlength 1cm, at 23°C (± 2°C), using a Perkin-Elmer model 141
polarimeter. Gel-permeation chromatography was performed on columns each having different
length and internal diameter, dimensions for an analytical column were 1.8 by 65 cm, and
preparative columns had dimensions 3.0 by 88 cm. Depending on the application, gels used
included: Biogel P-2 (eluent - water), Biogel P-4 (eluent - 0.1 M sodium acetate buffer, pH 5.0),
Sephacryl S-200 (eluent - 0.1 M sodium acetate buffer, pH 5.0) and Sephacryl S-500 (eluent -
0.1 M sodium acetate buffer, pH 5.0). The columns were coupled to a Waters Differential
Refractometer (R401) and the signals were recorded on a flat-bed recorder.
Analytical gas-liquid chromatography was performed using a Hewlett-Packard 5890A gas
chromatograph fitted with flame-ionisation detectors and a 3392A recording integrator, with
helium as the carrier gas. A J + W Scientific wall-coated, fused-silica, bonded-phase capillary
column of OV-225 dimensions (30m x 0.252mm), having a film thickness of 0.25 ;um, was used
for separating partially methylated alditol acetates or aldononitrile derivatives. The temperature
settings were always isothermal and varied between 190°C and 210°C. The identities of all
derivatives were confirmed by GLC-MS on a Hewlett-Packard 5988A GLC-Mass spectrometer
using the OV-225 column. Mass spectrometric studies were recorded at 70 eV and an ion
source temperature of 200°C.
All 1 Hand 13C-NMR spectra were recorded on a Bruker AMX 400 spectrometer at 30°C,
50°C or 70°C. The samples were deuterium-exchanged by freeze-drying solutions three times in
99.6% O2° and finally dissolving in 99.995% O2°. Acetone was used as an internal standard (8
2.23) for 1 H and at 31.07 ppm for 13C.
160
8.2. Preparation of the K43 polysaccharide
An authentic culture of Klebsiella K43 (culture #.2482) was obtained from Dr.1.0rskov
(Copenhagen), and the bacteria were plated out on sucrose-rich agar (Formula 9.4, Annexure 1)
and incubated overnight at 3rC (triplicate). Single colonies were transferred from these plates
to eight test tubes, each containing 5 mL of nutrient broth (Formula 9.1, Annexure 1), which were
then incubated overnight at 3rC in a mechanical shaking-waterbath. These broth cultures were
then used to inoculate evenly eight stainless steel trays, each containing 1.5 L of sterile sucrose
rich agar, (Formula 9.4, Annexure 1). The trays were covered and incubated at 3rC for 86
hours after which the bacterial slime was scraped off the agar surface carefully and suspended in
a 1% phenol solution. This suspension was stirred overnight at 4°C ensuring bacterial death and
dissolution of the capsular polysaccharide. Capsular polysaccharide was then separated from the
cellular debris by ultracentrifugation (Seckman L8-M ultracentrifuge at 35 000 rpm for 3 hours
using a type 70 Ti rotor). The supernatants were combined and the polysaccharide (both the K
and O-antigens) precipitated into 5 volumes of ethanol, after which the mixture was centrifuged
at 3 000 rpm. The clear, off-white supernatant was poured off and the polysaccharide sediments
combined, and dissolved in the minimum volume of water .50 ml). The resultant mixed antigen
solution of high viscosity was subjected to further purification.
Approximately 15 mL of a 5% cetyltrimethylammonium bromide (CT AS) solution was
slowly added with stirring to the solution of impure polysaccharide. CTAS was added till no more
polysaccharide appeared to preCipitate, the system was allowed to stand overnight and the
preCipitate was centrifuged at low speed. The CTAS salt of the polysaccharide was then
dissolved in 25 ml of a 3M aqueous NaCI solution, to form the sodium salt of the polysaccharide
and dissociate the CTAS-complex, after which the polysaccharide was preCipitated into 5
volumes of ethanol. After centrifugation, the polysaccharide was dissolved in 50 ml of water and
dialysed (12 000 - 14 000 Mw cut-off) against running tape water over 48 hours. The solution
was freeze-dried to yield 542 mg of the sodium salt polysaccharide.
The purified polysaccharide (sodium salt) was shown to be polydisperse with regard to
molecular weight distribution. GPC was performed on a column of Sephacryl S500 with

161
dimensions 30 mm x 88 mm.
8.3. Monosaccharide composition.
A small portion (3.1 mg) of the polysaccharide was hydrolysed with 2 mL 4M
trifluoroactetic acid (TFA at 125°C for 1 hour). The reaction mixture was concentrated under
reduced pressure after which it was co-concentrated several times with small aliquots of water,
(to ensure the removal of traces of TFA). The liberated monosaccharide residues were
transformed into their acetylated aldononitrile derivatives189 (PAAN'S) and analysed by GLC on
an OV-225 capillary column at 220°C.
The uronic acid was identified as follows: dried native polysaccharide was refluxed with
methanolic 3% HCL at 80°C for 16 hours. The solution was neutralised with A92C03 and stirred
for 1 hour and the resultant precipitate was removed by low speed centrifugation after which the
solution was reduced with NaBH4 in dry methanol (overnight). The solution was subsequently
passed down an Amberlite IR-120(H+) resin ion-exchange column, and the acidic fraction was
collected and co-concentrated with several aliquots of methanol to remove borate. The product
was hydrolysed (4M TFA, 125°C, 1 hour), after which the free reducing sugars were converted
into their PAAN'S and examined by GLC as before.
8.4. Absolute configuration of the monosaccharides
The absolute configuration of each constituent monosaccharide was determined by GLC
analysis of their acetylated (-)-2-octyl glycosides122. The native polysaccharide (5.5 mg) was
methanolysed (methanolic 3% HCL, 80°C, 16 hours), reduced (NaBH4, overnight), and
hydrolysed with (4M TFA, 125°C, 1 hour). The hydrolysate was freeze-dried in an ampoule to
which 1 drop of TFA, 0.5 mL (-)-2-octanol and a small magnetic flea was added. The sealed
ampoule was stirred in an oil bath at 130°C for 16 hours. The reaction solution was then
concentrated to dryness. The resulting octyl glycosides were acetylated using pyridine: acetic
anhydride (1 : 1 v/v at 100°C for 1 hour), after which they were examined by GLC at 220°C and

162
their retention times compared to reference 0 and L monosaccharides derivatives.
8.S. Methylation analysis
A portion (22mg) of the acidic polysaccharide was dried for 16 hours in a drying pistol
and then methylated by the modified Hakamori method of Phillips et al. 130 with potassium-dimsyl
and methyl iodide, followed by the Khun128 method using A920 and methyl iodide in DMF to fully
methylate the polysaccharide. The product was divided into two portions in the ratio 1 :2.
One third of the methylated polysaccharide was hydrolysed with (4M TFA, 12SoC, 1
hour). After evaporation of the acid the hydrolysate was reduced (NaBH~, and passed down an
Amberlite IR-120(H+) resin column. The acidic fractions were collected and co-concentrated
with repeated aliquots of methanol to remove borates. Acetylation of the partially methylated
alditol residues was achieved by treatment with equal volumes (1 ml) of acetic anhydride and
pyridine at 100°C for 1 hour. The partially methylated alditol acetates186 were analysed by GLC
(20S°C). Results are presented in Table 6 (column 1, page. 94).
Two thirds of the methylated polysaccharide was dried (6 hours) in a drying pistol prior to
methanolysis (methanolic 3% HCL, 80°C, 16 hours). The solution was neutralised with AgC03,
centrifuged, and the supernatant co-concentrated to dryness. The residue was dissolved in
methanol ~ 3 mL), filtered (0.22IJm filter), and reduced (NaBH~ overnight. The alkaline
solution was subsequently passed down Amberlite IR-120(H+) resin and the acidic fraction
eluted was collected and concentrated with small aliquots of methanol. The residue was
hydrolysed (4M TFA, 12SoC, 1 hour), and the partially methylated monosaccharides converted
into their alditol acetates186 as previously described, and analysed by GLC (20S °C), Table 6
(Column 2, page 94).
8.6. Uronic acid degradation
8.6.(a). B-Elimination of permethylated polysaccharide
The methylated polysaccharide (10 mg) was subjected to a base-catalysed degradation,

163
following a modified method introduced by Lindberg et a/. 144.
A mixture (1 mL) containing dry dimethylsulphoxide : 2,2-dimethoxypropane (19 : 1 v/v)
was added to the methylated polysaccharide under positive nitrogen pressure. The mixture was
stirred for 1 hour after which potassium-dimsyl (1 mL) was added. After stirring for another 2
hours, the polysaccharide was re-alkylated with Mel (0.5 mL) whilst keeping the mixture cool in
an ice-bath. The reaction solution was stirred for another hour after which it was diluted with
water (3 mL) and the reaction products were extracted with dichloromethane (4 x 3 mL). The
dichloromethane fractions were pooled, washed with water (4 x 3 mL), and concentrated to
dryness. The residue was hydrolysed with (4M TFA, 125°C, 1 hour), and the partially methylated
alditol acetates were analysed by GLC (205°C). The results are presented in Table 6 (column 3
page 94).
8.6.(b), Lithium degradation of underivatised polysaccharide
Dry acidic polysaccharide (100mg) was dissolved in ethylenediamine (80 mL) by the
method described by Lau et a/. 172, To the solution was added two small lengths (3-5 mm) of
lithium wire. The round-bottom flask chosen had little head space above the reaction surface
and was securely stoppered. The solution and wire were vigorously stirred till a navy-blue colour
formed (20 minutes), thereafter as the colour faded to a creamy-yellow, more wire was cut and
added. After an hour the reaction mixture was slowly quenched with water (80 mL) and
transferred to a larger flask. The product mixture was then roto-evaporated to dryness as an
azeotrope, (addition of 100 mL toluene). The residue was co-concentrated with two aliquots (2 x
100 mL) of toluene after which the powdery residue was cooled in an ice-bath and adjusted to pH
4.5 with glacial acetic acid. The acidic solution was passed down an Amberlite IR-120(H+) resin
column, (to exchange lithium ions for protons). The rate of elution of the acidic fraction from
the column was slow (resin has a low affinity for lithium ions) and 90 mg of degraded
polysaccharide product was freeze dried.
A concentrated aqueous solution of the freeze-dried, degraded polysaccharide was
chromatographed down a column 18 mm by 88 cm of Sephacryl S-200 gel. The carbohydrate

164
component was detected using the phenol-sulphuric acid assay204.
The polysaccharide fraction was freeze-dried and 24mg of degraded material was
isolated. A small quantity (1 mg) of the product was hydrolysed, (4M TFA, 125°C, 1 hour), and
the products were converted to PAAN's, and analysed by GLC at (220°C).
The lithium degraded material (9mg) was deuterium-exchanged and subjected to
thorough NMR analysis.
8.6.b.(i). 20 NMR spectroscopy acquisition parameters of the lithium degraded
polysaccharide
1H- and 13C-NMR spectra were recorded at 50°C on a Bruker AMX 400 spectrometer.
Samples were deuterium exchanged and then dissolved in 99.99% D20 containing a trace of
acetone as an internal standard, 82.23 for 1 Hand 31.07 ppm for 13C.
The 2D 1 H homonuclear shift-correlated experiment (COSy)242 was aquired over a
spectral width of 2008.03 Hz. A data matrix of 256 x 2048 data points was collected with 128
transients for each delay. The data matrix was zero-filled in the t 1 dimension to 1024 data points
and transformed after the application of an un-shifted sine-bell window function in both
dimensions and symmetrised. Digital resolution in the resulting 2048 x 1024 matrix was 0.98
Hz/point in '2.
The 2D Relay-COSy260 experiment at 400 MHz was performed using a spectral width of
1483.68 Hz. Data matrices of 256 x 2048 data points were collected with 176 transients for each
t1 delay. The data matrices were zero-filled to 1024 data pOints in t1 transferred after the
application of a non-shifted sine-bell window function. Digital resolution in the 2048 x 1024
matrices were 0.72 Hz/point in f2. Fixed delays of 0.036 s were used.
The 2D homonuclear Hartmann-Hahn ( HOHAHA )261 experiment was performed using a
spectral width of 840.34 Hz. The mixing period consisted of 50 MLEV-17 cycles. A data matrix
of 2048 x 256 was aquired with 116 transients for each t1 delay. The matrix was zero-filled in
the t1 dimension (2048 x 1024 data pOints) and multiplied in both dimensions with a shifted sine
square window function prior to phase sensitive Fourier transformation.

165
The 2D homonuclear dipolar-correlated ( NOESY )239 experiment was performed using a
spectral width of 1483.68 Hz. An initial data matrix of 2048 x 256 data points was collected with
128 transients for each delay. The matrix was zero-filled to 1024 data points in t1 and
transformed after the application of a shifted sine-square window function in both dimensions and
was not symmetrised. Digital resolution in the resulting matrix was 0.72 Hz/point, in f2. The
mixing delay in the NOESY experiment was 0.30 s.
The 2D 13C - 1H heteronuclear shift-correlated ( HETCOR )249 experiment was recorded
using a spectral width of 960.31 Hz in t1 and 5555.56 Hz in t2 . The initial matrix of 2048 x 128
was zero-filled to 2048 x 512 data pOints and transformed after the application of a shifted sine
square window function. Digital resolution in '1 was 1.87 Hz/point and in f2 2.7 Hz/point. A
recycle delay of 1 s was employed and 1000 transients per FID were collected.
8.7. Smith degradation of the K43 polysaccharide
Klebsiella K43 polysaccharide (100 mg) in the sodium salt form was dissolved in 25m I
water, 29ml of a 0.2M sodium perchlorate solution, and 14ml of a 0.1 Molar sodium
metaperiodate solution was added. The mixture was kept in the dark (4°C, 96 hour), the reaction
was then quenched with 2ml of ethylene glycol, dialysed for 24 hours, freeze-dried and reduced
(NaBH4 150mg) for 24 hours. After destruction of excess sodium borohydride by the addition of
10% acetic acid, the oxidised product was dialysed (Mw cut off 3500, for 24 hours) against
running water, then freeze-dried.
A small sample mass was hydrolysed and analysed as the PAAN's189 derivatives by
GLC analysis. A higher ratio than that expected ( ie.1 : 1, mannose to galactose) was found
indicating that incomplete oxidation had occured, (see pages 39-41). The oxidation step was
then repeated. The polysaccharide was dissolved in 1 M TFA and was kept at room temperature
for 24 hours. TFA was then evaporated off and the product was reduced (NaBH~. The NaBH4
was quenched with Amberlite IR-120(W) resin and the solution was passed down a small de
ionizing column which was eluted with methanol. The solvent was removed by evaporation and
the borate esters removed by co-distillation with methanol (4x). The product of the reaction was

166
then separated on Biogel P2 using water as eluent. Material eluting with the retention volume of
a trisaccharide was isolated and freeze-dried. The product was methylated and analysed by
GLC-MS as the derived PMAA's.
8.8. Bacteriophage depolymerisation of the K43 polysaccharide
An active bacteriophage forming large haloes on a lawn of Klebsiella K437 bacteria was
isolated from Grahamstown sewerage and was used to depolymerise the K43 capsular
polysaccharide. The bacteriophage was propagated on bacteria in nutrient broth (Annexure 1,
Formula 9.1) until a total of 5.28 x 10¹² plaque forming units (PFU) was obtained.
Polysaccharide (500mg) was dissolved in the phage solution (80ml, 5.28 x 10¹² PFU) and the
solution was shaken gently at 37°C for 79 hours in the presence of a small amount of chloroform.
Thereafter the digest was freeze-dried, re-dissolved in a small amount of water and dialysed
against distilled water. The diffusates were combined and freeze-dried yielding depolymerised
material (393mg). The product was passed down an ice-jacketed column of Amberlite IR 120
(H+) resin and then subjected to chromatography on Bio-gel P-4 (eluted with 0.1 M sodium
acetate buffer pH 5.0). Four fractions labelled P1-5 were collected and the mass of each fraction
in order of decreasing oligosaccaride size was P4 (15.6mg); P3 (50mg); P2 (8.5mg) and P1
(14mg). D20 solutions of all 4 fractions were examined in by 1 H-NMR and intensive studies
were performed on the P1 and reduced P1 alditol.
8.8.a. Methylation analysis of the oligosaccharide repeating unit P1
A portion of reduced P1 (NaBD,J (4.4 mg) was dried overnight at 60°C in a drying pistol.
The oligosaccharide was dissolved in DMSO to which 0.3 ml of potassium dimsyl and later 0.3
ml Mel was added at 10°C, according to the modified Hakomori method130. The reaction was
quenched with 5 ml of water and extracted four times with 3 ml of methylene chloride. The
methylated oligosaccharide had to be isolated and purified by extraction in organic solvent
because the size of the oligosaccharide prohibited the use of a dialysing membrane. The

167
methylene chloride phases were combined and washed three times with 3 ml of water. Finally a
5 % sodium thiosulphate wash removed residual iodine and the organic phase was dried with
sodium sulphate, filtered and concentrated to dryness.
The methylated oligosaccharide was reduced for (16 hours) in dry methanol and was
then hydrolysed (4 M TFA, 125°C, 1 hour). The derived PMAA's186 were examined by GLC at
220°C and yielded the partially methylated alditol acetates listed in Table 11 (page I ~I)
8.8.b. Reduction of the oligosaccharide repeating unit P1
P1 was reduced with NaBH4 and the derived alditol was exchanged with O2° (99.6%),
made up in 99.995% O2° and examined by NMR.
8.8.b.(i). NMR acquisition parameters of the repeating unit alditol P1-oL
1 H- and 13C-NMR spectra were recorded at 30°C on a Bruker AMX 400 spectrometer.
Samples were deuterium exchanged and then dissolved in 99.99% 020 containing a trace of
acetone as internal standard, <52.23 for 1 Hand 31.07 ppm for 13C.
The 20 1 H homonuclear shift-correlated experiment ( COSY )242 was performed using a
spectral width of 1805.05 Hz. A data matrix of 256 x 2048 data points was collected with 152
transients for each delay. The data matrix was zero-filled in the t1 dimension to 1024 data pOints
and transformed after the application of a non-shifted sine-bell window function in both
dimensions and symmetrised. Digital resolution in the resulting 2048 x 1024 matrix was 0.88
Hz/point.
The 20 Relay-COSy260 experiments at 400 MHz was performed using a spectral width
of 1805.05 Hz. Data matrices of 2048 x 256 data points were collected with 144 transients for
each t1 delay. The data matrices were zero-filled to 1024 data pOints in t1 transformed after the
application of a Shifted sine-bell window function. Digital resolution in the 2048 x 1024
matrices were 0.88 Hz/point in f2" Fixed delays of 0.078 s were used.
The 20 homonuclear Hartmann-Hahn ( HOHAHA )261 experiment was performed using a

168
spectral width of 1805.05 Hz. The mixing period consisted of 50 MLEV-17 cycles. A data matrix
of 1024 x 371 was acquired with 112 transients for each t1 delay. The matrix was zero-filled in
the t1 dimension to (1024 x 1024 data points) giving a digital resolution of 1.76 Hz/point in f2 and
multiplied in both dimensions with a shifted sine-square window function prior to phase sensitive
Fourier transformation.
The 2D 13C - 1 H heteronuclear shift-correlated ( HETCOR )249 experiment was recorded
using a spectral width of 1600 Hz in t1 and 10204.08 Hz in t2. The initial matrix of 4096 x 128
was zero-filled to 2048 x 256 data points and transformed after the application of a shifted sine
square window function. Digital resolution in '1 was 0.16 Hz/point and in f2 4.98 Hz/point. A
recycle delay of 1 s was employed and 1100 transients per f.i.d. were collected.
The 2D heteronuclear multiple quantum coherence-total correlated spectroscopy
( HMQC-TOCSY ) experiment was recorded using: 4096 x 512 data matrix, 48 scans per t1
value, 50 MLEV-17 cycles, with a 1-s recycle delay.
The 2D heternuclear multiple bond coherence spectroscopy ( HMBC )269 experiment was
recorded using: 4096 x 256 data matrix, 96 scans per t1 value, ~1 and ~2 durations of 3.45 ms
and 60 ms, respectively, and a sine-bell filter.
8.8.c. NMR acquisition parameters of the repeating unit P1
The 2D 1 H homonuclear shift-correlated experiment ( COSY )242 was performed using a
spectral width of 1602.56.Hz. A data matrix of 512 x 2048 data points was collected with 64
transients for each delay. The data matrix was zero-filled in the t1 dimension to 1024 data pOints
and transformed after the application of a non-shifted sine-bell window function in both
dimensions and symmetrised. Digital resolution in the resulting 2048 x 1024 matrix was
0.78Hz/point.
The 2D homonuclear Hartmann-Hahn ( HOHAHA )261 experiment at 400 MHz was
performed using a spectral width of 1602.56 Hz. The mixing period consisted of 50 MLEV-17
cycles. A data matrix of (2048 x 512) was acquired with 64 transients for each t1 delay. The
matrix was zero-filled in the t1 dimension (2048 x 1024 data pOints) giving a digital resolution of

169
0.78 Hz/point and multiplied in both dimension with a shifted sine-square window function prior to
phase sensitive Fourier transformation.
The 20 heternuclear multiple coherence correlated spectroscopy ( HMQC )247
experiment was recorded: (4096 x 512) data matrix, 32 scans per t1 value, 1-s recycle delay,
zero-filled to 1024 data pOints in t1
The 20 heteronuclear multiple quantum total-coherence correlated spectroscopy
( HMQC-TOCSY ) experiment was recorded using: 4096 x 512 data matrix, 48 scans per t1
value, 12-MLEV-17 cycles, with a 1-s recycle delay.
The 20 heternuclear multiple bond coherence spectroscopy ( HMBC )269 experiment
was recorded using: (4096 x 256) data matrix, 112 scans per t1 value, ~1 and ~2 durations of
3.45 and 60 ms, and a sine-bell filter.
9. ANNEXURE 1
9.0. Formulae for Nutrient Media.
9.1. Formula 1: Luria Bertani Broth (LBB)
Bacto-Tryptone 10 9
Yeast Extract 5 9
NaCI 10 9
Maltose 2 9
Water to 1 L
9.2. Formula 2: Luria Bertani Agar (LBA)
LBB + 1.5% agar.

170
9.3. Formula 3: Luria Bertani Sloppy Agar
LBA + 0.7% agar.
9.4. Formula 4: Sucrose-Rich Medium
Sucrose NaCI Yeast Extract K2HP04 · H20 MgS04·7 H20 CaC03 Agar Water to
75.0g 5.0g 5.0g 2.5g 0.62g 0.5g 37.5g 2.5 L

171
10. REFERENCES
1. C. Friedlander, Fortschr. Med., 1 (1883) 715-733.
2. K-A Karlsson, TIPS., 12 (July 1991), 265-272.
3. H. Parolis and S.G. Wilkinson, Carbohydr. Res., 231 (1992) vii-xi.
4. J.W. Uhr, RJ. Fulton, E.S. Vitetta in H. Kohler and P.T. Loverde (Ed), Vaccines New
Concepts and Developments, Longman group UK Limited, Avon, (1988) 3-14.
5. (M.S.D.), Merck Sharp and Dohme, Div of Merk and Co, inc, Westpoint, PA 198486,
USA. Offical "blurb-sheet" for Pneumovax 23, (1986).
6. S.J. Cryz,Jr, AS. Cross, G.C. Sadoff, and J.U. Que, Eur. J. Immunol., 18 (1988)
2073-2075.
7. M. Aereboe, Structutal Study of The Klebsiella K43 Antigen., Thesis (Rhodes
University December (1992).
8. ARDochez and O.T. Avery, J. Exp. Med., 26 (1917), 477-493.
9. M. Heidelberger, W.F. Dudman, W. Nimmich, J. Immunol., 104 (1970) 1321-1328.
10. M. Heidelberger and G.G.S. Dutton, J. Immunol., 111 (1973) 857-859.
11. M. Heidelberger, W. Nimmich, J. Eriksen. G.G.S. Dutton, S. Stirm and C.T. Fang,
Acta Path, Microbiol. Scand., Sect. C, 83 (1975) 397-405.
12. M. Heidelberger and W. Nimmich, Immunochemistry, 13 (1976) 67-80.
13. M. Heidelberger, W. Nimmich, J. Eriksen and S. Stirm, Acta Path. Microbiol.
Scand., B, 86 (1978) 313-320.
14. C.T. Bishop and H.J. Jennings in G.O. Aspinall (Ed), The Polysaccharides Vol. 1,
Academic Press Inc., (1982) 292-330.
15. H.J. Jennings, A Gamian, F. Michon R Roy and F.E. Ashton, and R Bell and G.
Torrigani (Ed), in Towards Better Carbohydrate Vaccines., Published J. Wiley and
Son LTD, (1987) 11-22.
16. T.F. Murphy, M.B. Nelson, K.C. Dudas, L.C. Bartos, M.A. Apicella in H. Kohler and
P.T. Loverde (Ed.), Vaccines New Concepts and Developments, Longman group UK
Limited, Avon, (1988) 89-95.
17. M.J. Pelczar (Jr), E.C.S. Chan, N.R Krieg, in Microbiology., 5th Ed, McGraw-Hili
book company, NY. (1986) 73-88.
18. S.M. Hammond, P.A. Lambert, and AN. Rycroft, The Bacterial Cell Surface,
Croom Helm Ltd, Kent., (1984) 111-193.
19. W. Nimmich, and G. Korten, Path. Microbiol., 36 (1970) 179-190.
20. G.R Gillies, T.C. Dodds, Bacteriology Illustrated 2nd Ed,
E and S Livingston Ltd, Edinburgh and London., (1968) 98-102.
21. C. Erbing, L. Kenne, B. Lindberg, J. Lonngren, and I.W. Sutherland, Carbohydr.
Res., 50 (1976) 115-120.

172
22. L.C. Gahan, PA Sandford, H.E. Conrad, Biochemistry., Vol 6, No.9, September
(1967) 2755-2767.
23. E. Jawetz, J.L. Melnick, E.A. Adelbery, in, Review of Medical Microbiology., 14th Ed,
(1980) 232-233.
24. P.E. Jansson, B. Lindberg, G. Widmalm, G.G.S. Dutton, A.V.S. Lim and I.W.
Sutherland, Carbohydr. Res., 175 (1988) 103-109.
25. B. Lindberg, J L6nngren, J.L. Thompson and W. Nimmich, Carbohydr. Res., 25
(1972) 49-57.
26. G.G.S. Dutton, S.K. Ng, LAS. Parolis, H. Parolis and AK Chakraborty, Carbohydr.
Res., 193 (1989) 147-155.
27. G. Annison, G.G.S. Dutton and P.K. Mandall, Carbohydr. Res., 177 (1988) 278-284.
28. S.M. Hammond, PA Lambert and A.N. Rycroft, The Bacterial Cell Surface, Croom
Helm Ltd, Kent., (1984) 57-82.
29. L. Kenne and B. Linberg in G.O. Aspinall (Ed.), The Polysaccharides Vol. 2,
Academic Press Inc., (1983) 387-363.
30. W. Nimmich and G. Korten, Path. Microbiol., 36 (1970) 179-190.
31. Y-M. Choy and G.G.S. Dutton, Can. J. Chem., 51 (1973) 3021-3026.
32. Y.M. Choy and G.G.S. Dutton, Can. J. Chem., 52 (1974) 684-687.
33. G.M. Bebault, G.G.S. Dutton, NA Funnell, and K.L. Mackie, Carbohydr. Res., 63
(1978) 183-192.
34. LAS. Parolis and H. Parolis, Carbohydr. Res., 179 (1988) 301-304.
35. P-E. Jansson, B. Lindberg, J. L6nngren, C. Ortega and W. Nimmich, Carbohydr.
Res., 132 (1984) 297-305.
36. B. Lindberg, K. Samuelsson, and W. Nimmich Carbohydr. Res., 30 (1973) 63-70.
37. W. Nimmich, Z. Med. Mikrobiol. U.lmmunol., 154 (1968) 117-131.
38. G.G.S. Dutton and J. Di Fabio, Carbohydr. Res., 87 (1980) 129-139.
39. I. 0rskov and M.Q. Fife-Asbury, Int. J. Syst. Bacteriol., 27 (1977) 386-387.
40. A. Dell, G.G.S. Dutton, P-E. Jansson, B. Lindberg, U. Linquist and I.W. Sutherland,
Carbohydr. Res., 1221983) 340-343.
41. G.G.S. Dutton, A.M. Stephen, and S.C. Churms, Carbohydr. Res., 38 (1974) 225-
237.
42. H. Niemann, N. Frank and S. Stirm, Carbohydr. Res., 59 (1977) 165-177.
43. J.L. Di Fabio, D.N. Karunaratne and G.G.S. Dutton, Carbohydr. Res., 144 (1986)
251-261.
44. M. Curvall, B. Lindberg and J. L6nngren, Carbohydr. Res., 42 (1975) 95-105.
45. B. Lindberg, F. Lindh and J. L6nngren, Carbohydr. Res., 76 (1979) 281-284.
46. C-C. Cheng, S-L. Wong and Y-M. Choy, Carbohydr. Res., 73 (1979) 169-174.
47. B. Lindberg, F. Lindh and J. L6nngren, Carbohydr. Res., 70 (1979) 135-144.

173
48. G.G.S. Dutton and A.V.S. Lim, Carbohydr. Res., 145 (1985) 67-80.
49. G.G.S. Dutton, J.l. Di Fabio, D.M. Leek, E.H. Merrifield, J.R. Nunn, and A.M.
Stephen, Carbohydr. Res., 97 (1981) 127-138.
50. E. Altman and G.G.S. Dutton, Carbohydr. Res., 118 (1983) 183-194.
51. S. Lindberg, J. Ltinngren, U. Ruden and W. Nimmich, Carbohydr. Res., 42 (1975)
83-93.
52. A.S. Rao and N. Roy, Carbohydr. Res., 76 (1979) 215-224.
53. G.G.S. Dutton and M-T. Yang, Carbohydr. Res., 59 (1977) 179-192.
54. P.l. Hackland, H. Parolis, A. Dell and P.R. Tiller, Carbohydr. Res., 181 (1988) 153-
162.
55. U. Eisasser-Seile, H. Friebolin and S. Stirm, Carbohydr. Res., 65 (1978) 245-249.
56. H. Thurow, Y-M. Choy, N. Frank, H. Niemann, and S. Stirm, Carbohydr. Res., 41
(1975) 241-255.
57. H. Parolis, L.A.S. Parolis and D.V. Whittaker, Carbohydr. Res., 231 (1992) 93-103.
58. S.C. Churms, E.H. Merrifield and A.M. Stephen, Carbohydr. Res., 81 (1980) 49-58.
59. S. Lindberg, U. Lindquist, J. Ltinngren and W. Nimmich, Carbohydr. Res., 58 (1977)
443-451.
60. A.K. Chakraborty, U. Dabrowski, H. Geyer, R. Geyer and S. Stirm, Carbohydr. Res.,
103 (1982) 101-105.
61. H. Sjtirndal, S. Lindberg, J. Ltinngren, K-l. Rosell and W. Nimmich, Carbohydr.
Res., 27 (1973) 373-378.
62. H. Sjtirndal, S. Lindberg, J. Ltinngren, M. Meszaros, J.l. Thompson and W.
Nimmich, Carbohydr. Res., 31 (1973) 93-100.
63. M. Curvall, S. Lindberg, J. Ltinngren and W. Nimmich, Carbohydr. Res., 42 (1975)
73-82.
64. S. Lindberg and W. Nimmich, Carbohydr. Res., 48 (1976) 81-84.
65. G.G.S. Dutton, and A.V. Savage, Carbohydr. Res., 83 (1980) 351-362.
66. G.G.S. Dutton, K.l. Mackie and M-T. Yang, Carbohydr. Res., 65 (1978) 251-263.
67. M. Seurret, M. Vignon and J-P Joseleau, Carbohydr. Res., 157 (1986) 13-25.
68. G.G.S. Dutton and K.l. Mackie, Carbohydr. Res., 55 (1977) 49-63.
69. J-P. Joseleau, M. Lapeyre, M. Vignon and G.G.S. Dutton, Carbohydr. Res., 67
(1978) 197-212.
70. G.M. Sebault and G.G.S. Dutton, Carbohydr. Res., 64 (1978) 199-213.
71. G.G.S. Dutton and K.l. Mackie, Carbohydr. Res., 62 (1978) 321-335.
72. G.G.S. Dutton and A.V.S. Lim, Carbohydr. Res., 144 (1985) 263-276.
73. A.K. Ray, A. Roy and N. Roy, Carbohydr. Res., 165 (1987) 77-86.
74. G.G.S. Dutton and M. Paulin, Carbohydr. Res., 87 (1980) 107-117.
75. G.G.S. Dutton and D.N. Karunaratne, Carbohydr. Res., 134 (1984) 103-114.

174
76. N. Ravenscroft, AM. Stephen and E.H. Merrifield, Carbohydr. Res., 167 (1987) 257-
267.
77. G.G.S. Dutton, H. Parolis and LAS. Parolis, Carbohydr. Res., 140 (1985) 263-275.
78. G.G.S. Dutton and D.N. Karunaratne, Carbohydr. Res., 119 (1983) 157-169.
79. A.K. Chakraborty, H. Friebolin, H. Niemann and S. Stirm, Carbohydr. Res., 59
(1977) 525-530.
80. G.G.S. Dutton and AV. Savage, Carbohydr. Res., 84 (1980) 297-305.
81. G.G.S. Dutton and T.E. Folkman, Carbohydr. Res., 80 (1980) 147-161.
82. AK. Ray and N. Roy, Carbohydr. Res., 196 (1990) 95-100.
83. G.G.S. Dutton and D.N. Karunaratne, Carbohydr. Res., 138 (1985) 277-291.
84. G.G.S. Dutton, J.L. Di Fabio and AB. Zanlungo, Carbohydr. Res., 106 (1982) 93-
100.
85. G.E. Jackson, N. Ravenscroft and A.M. Stephen, Carbohydr. Res., 200 (1990) 409-
428.
86. H. Thurow, H. Niemann, C. Rudolph and S. Stirm, Virology., 58 (1974) 306-309.
e7. Y-M. Choy and G.G.S. Dutton, Can. J. Chem., 51 (1973) 198-207.
88. G.G.S. Dutton and M. Paulin, Carbohydr. Res., 87 (1980) 119-127.
89. YA Knirel, NA Kocharova, AS. Shashkov, G. Annison, G.G.S. Dutton and
P.K.Mandal, N.K. Kochetkov, VA Mamontova and T.F. Solov'eva,
Carbohydr. Res., 188 (1989) 145-155.
90. J.E.G. van Dam, H. van Halbeek, J.P. Kamerling, J.F.G. Vliegenthart, H. Snippe, M.
Jansze and LM.N. Willers, Carbohydr. Res., 142 (1985) 338-343.
91. A.N. Anderson, H. Parolis, G.G.S. Dutton and D.M. Leek, Carbohydr. Res., 167
(1987) 279-290.
92. H. Niemann, B Kwiatkowski, U. Westphal and S. Stirm, J. Bacteriol (1977) 366-374.
93. J-P. Joseleau, F. Michon and M. Vignon, Carbohydr. Res., 101 (1982) 175-185.
94. J-P Joseleau and M-F. Marais, Carbohydr. Res., 179 (1988) 321-326.
95. D.N.M. Jones and J.K.M. Sanders, J. Chem. Soc. Chem. Comm., 3 (1989) 167-169.
96. J-P. Joseleau, Carbohydr. Res., 142 (1985) 85-92.
97. J.P. Kamerling, B. Lindberg, J. Lonngren and W. Nimmich, Acta. Chemica.
Scandinavica., B29 (1975) 593-598.
98. G.G.S. Dutton, H.Parolis and LAS. Parolis, Carbohydr. Res., 152 (1986) 249-259.
99. J-P. Joseleau and M-F Marais, Carbohydr. Res., 77 (1979) 183-190.
100. J.P. Duguid, J.F. Wilkinson, J. Gen. Microbiol., 9 (1953) 174-189.
101. G.A. Adams and R.L. Whistler in J.N. BeMiller (Ed.), Methods in Carbohydr. Chem.
vol VI, AcademicPress Inc., (1972) 157-161.
102. H.D. Bouveng and B. Lindberg, Adv. Carbohydr. Chem and Biochem., 15 (1960) 53-
89.

175
103. K. Okutani and G.G.S. Dutton, Carbohydr. Res., 86 (1980) 259-271.
104. B. Capon, (Ed.), Chemical Reviews, 69 (1969) 415-425.
105. C.J. Biermann in R.S. Tipson and D. Horton (Ed.), Adv. in Carbohydr. Chem and
Biochem Vol 46., Academic Press Inc, London., (1988) 251-270.
106. N.W.H. Cheetham and P. Sirinamo, Carbohydr. Res., 112 (1983) 1-10.
107. B. Fournet, G. Strecker, Y. Leroy, and J. Montreuil, Analytical Biochemistry., 116
(1981) 489-502.
108. G.A Adams in R.L. Whistler (Ed.), Methods in Carbohydr. Chern. Vol V, Academic
Press Inc, London., (1965) 269-276.
109. L. Hough and J.V.S. Jones and P Wusteman, Carbohydr. Res., 21 (1972) 9.
110. J.R. Neeser and T.F. Schweizer, Anal. of. Biochem., 142 (1984) 58-67.
111. G.O. Aspinall in G.O. Aspinall (Ed.), The Polysaccharides Vol 1, Academic Press
Inc, London., (1982) 38-39.
112. G.O. Aspinall in G.O. Aspinall (Ed.), The Polysaccharides Vol 1, Academic Press
Inc, London., (1982) 97-100.
113. G.O. Aspinall in G.O. Aspinall (Ed.), The Polysaccharides Vol 1, Academic Press
Inc, London., (1982) 43-44.
114. H.S. Isbell in R.L. Whistler (Ed.), Methods in Carbohydr. Chem. Vol V, (1965) 249-
265.
115. G.O. Aspinall, Polysaccharides, Pergamon Press LTD, Oxford., (1970) 40-41.
116. C.T. Green in C.S. Hudson & M.L. Wolfrom (Ed.), Adv. Carbohydr. Chern. Vol 7,
(1952) 289-332.
117. C.T. Green in M.L. Wolfrom (Ed.), Adv. Carbohydr. Chem. Vol 11,.(1956) 385-393.
118. C.F. Snyder, H.L. Flush, H.S. Isbell, in A Thompson (Ed.), Methods in Carbohydr.
Chern. Vol 1, (1962) 524-584.
119. G.M. Bebault, J.M. Berry, Y.M. Choy, G.G.S. Dutton, N. Funnel, L.D. Hayward and
AM. Stephen, Can. J. Chern., 51 (1973) 325-326.
120. R. Oshima, Y. Yamauchi and J. Kumanotani, Carbohydr. Res., 107 (1982) 169-176.
121. WA Konig, P. Mischnick-Lubbecke, B. Brassat, S. Lutz and G. Wenz, Carbohydr.
Res., 183 (1988) 11-17.
122. K. Leontein, B. Lindberg and J. Lonngren, Carbohydr. Res., 62 (1978) 359-362.
123. H. Dchweer, Journal of Chromatography., 259 (1983) 164-168.
124. G.O. Aspinall in G.O. Aspinall (Ed.), The Polysaccharides Vol 1, Academic Press
Inc, London., (1982) 45-56.
125. P.J. Harris, R. Henry, AB. Blakeney and B.A. Stone, Carbohydr. Res., 127 (1984)
59-73.
126. B. Lindberg, Methods in Enzymology., 28 (1972) 179.
127. W.N. Haworth, J. Chem. Soc., 107 (1915) 8-16.

176
128. R. Kuhn, H. Trischmann and I.Low, Angew. Chem., 67 (1955) 32.
129. S.1. Hakomori, J.Biochem., (Tokyo) 55 (1964) 205-208.
130. L.R. Phillips and B.A. Fraser, Carbohydr. Res., 90 (1981) 149-152.
131. J. Finne, T. Krusius and H. Rauvala, Carbohydr. Res., 80 (1980) 336-339.
132. AB. Blakeney and BA Stone, Carbohydr. Res., 140 (1985) 319-324.
133. T. Narui, K. Takahashi, M. Kobayashi and S. Shibata, Carbohydr. Res., 103 (1982)
293-295.
134. AE. Manzi and AS. Ceezo, Carbohydr. Polymers., 6 (1986) 349-359.
135. 1.0. Monstronaldi, S.M. Flematti, J.O. Deferrari and E.G. Gros, Carbohydr. Res., 3
1966177-183.
136. J. Arnarp, L. Kenne, B. Lindberg and J. Lonngren, Carbohydr. Res., 44 (1975) e5-
C7.
137. I. Ciucanu and F. Kerer, Carbohydr. Res., 131 (1984) 209-217.
138. I. Ciucanu and C. Luca, Carbohydr. Res., 206 (1990) 71-77.
139. P. Prehm, Carbohydr. Res., 78 (1980) 372-374.
140. B. Lindberg, J. Lonngren and J.L. Thompson, Carbohydr. Res., 28 (1973) 351-357.
141. J. Kiss, Adv. Carbohydr. Chem. Biochem., 29 (1974) 229-303.
142. L. Kenne, J. Lonngren, S. Svensson, Acta. Chemica. Scand., 27 (1973) 3692-3698.
143. G.O. Aspinall, T.N. Krishnamunthy, W. Mitura and M. Funabashi, Can. J. Chem., 53
(1975) 2182.
144. B. Lindberg, F. Lindh and J. Lonngren, Carbohydr. Res., 60 (1978) 81-87.
145. D. Rolf and G.R. Gray, J. Am. Chem. Soc., 104 (1982) 3539-3541.
146. G.R. Gray, Methods in Enzymol Vol 38, Academic Press Inc., (1987) 26-38.
147. J-G Jun and G.R. Gray, Carbohydr. Res., 163 (1987) 247-261.
148. J.U. Bowie, P.V. Trescony and G.R. Gray, Carbohydr. Res., 125 (1984) 301-307.
149. JA Bennek, M.J. Rice and G.R. Gray, Carbohydr. Res., 157 (1986) 125-137.
150. S.G. Zeller and G.R. Gray, Carbohydr. Res., 198 (1990) 285-303.
151. P.L. Hackland, Structural analysis of some E. coli Capsular Antigens., Thesis
(Rhodes University) Dec 1991.
152. L. Hough, AC. Richardson in S. Coffey (Ed.), Rodds Chem of Carbon compounds
Vol 1 (Part f), 2nd edition, (1967) 83-85.
153. T.J. Painter and B. Larson, Acta. Chemica. Scand., 27 (1973) 1957-1962.
154. T.J Painter, Carbohydr. Res., 179 (1988) 259-268.
155. J.E. Scott, Histochemie., 14 (1968) 215.
156. K. Aalmo and T.J. Painter, Carbohydr. Res., 63 (1978) C3-C7.
157. M. Bobbitt, Adv. Carbohydr. Chem., 11 (1956) 1-41.
158. C. Araki and K. Arai, Methods in Carbohydr. Chem., 1 (1962) 122-125.
159. S. Oka, Analytical Biochem., 98 (1979) 417-428.

177
160. RD. Guthrie, Methods in Carbohydr. Chern., 1 (1962) 432-447.
161. J. Elting, Carbohydr. Res., 25 (1973) 387-389.
162. G.G.S. Dutton and K.B. Gibney, Carbohydr. Res., 25 (1972) 99-105.
163. J.K. Baird, Carbohydr. Res., 27 (1973) 464-467.
164. H. Yamaguchi, J. Biochern., 63 (1968) 553-554.
165. S.C. Churms, Carbohydr. Res., 94 (1981) 119-122.
166. S.C. Churms and AM. Stephen, Carbohydr. Res., 35 (1974) 73-86.
167. G.O. Aspinall (Ed.), Polysaccharides, Pergamon Press Inc., (1970) 19-22.
168. G.O. Aspinall, Pure and Appl. Chem., 49 (1977) 1105-1112.
169. K. Nath and AK. Chakraborty, Carbohydr. Res., 161 (1987) 91-96.
170. AI Mort, J.P. Utille, G. Torri and AS. Perlin, Carbohydr. Res.,121 (1983) 221-232.
171. S.F. Osman and p.o. Hoagland, Carbohydr. Res., 128 (1984) 361-365.
172. J.M. Lau, M. McNeil, AG. Darvill and P. Albersheim, Carbohydr. Res., 168 (1987)
219-243.
173. A. Mort and W Bauer, J. Bioi. Chern., 257 (1982) 1870-1875.
174. J.J. Marshall in RS. Tipson and D. Horton (Ed.), Adv. in Carbohydr. Chern. and
Biochern, Academic Press Inc., 30 (1974) 257-279 + 347-370.
175. B.V. McCleary and N.K. Matheson in RS. Tipson and D. Horton (Ed.), Adv.
Carbohydr. Chern and Biochern., 44 (1986) 217-225.
176. G.O. Aspinall (Ed.), Polysaccharides, Pergamon Press Inc, Oxford., (1970) 23-26.
177. N. K. Matheson and B .. McCleary in G.O. Aspinall (Ed.), The polysaccharides Vo/3,
Academic Press Inc, London., (1985) 1-105.
178. D.E. Bradley, Bacteriol Review., 31 December (1967) 230-314.
179. H Niemann, H. Beilharz and S. Stirm Carbohydr. Res., 60 (1978) 353-366.
180. M. Beurnet and J-P Joseleau, Carbohydr. Res., 157 (1986) 27-51.
181. A.!, Vogel, Textbook of Quantitative Inorganic Analysis, Fourth edition, Longmans,
London., (1979) 756.
182. D.A. Rees, E.R Morris, D. Thorn & T.K. Madden in G.O. Aspinall The
polysaccharide Vol. 1 (192) 204-206
183. D.H. Saac, K.H. Gardener, E.D.T. Atkins, U. Elsasser-Beile and S. Stirm, Carbohydr.
Res., 66 (1978) 43-52.
184. AD. French, J.W. Brady, Computer Modeling of Carbohydrate Molecules, ACS
Symposium Series 430, American Chem. Soc. Washington (1990)
185. C.T. Bishop, Advanced Carbohydr. Chern., 19 (1964) 95-147.
186. G.G.S. Dutton in RS. Tipson and D. Horton (Rd.), Adv. in Carbohydr. Chern and
Biochern Vol 3D, Academic Press Inc, London., (1974) 9-110.
187. J. Drozd, J. Chrornatogr., 113 (1975) 303-356.
188. M.F. Laker, J. Chrornatogr., 184 (1980) 457-470.
178
189. G.D. McGinnis,Carbohydr. Res., 108 (1982) 284-292.
190. J.A. Lomax and J. Conchie., J. Chromatogr., 236 (1982) 385-394.
191. R.R. Freeman (Ed.), High Resolution Gas Chromatography, Product of Hewlett
Packard., 2nd edition (1981),1-97.
192. P. Sandra in H.J. Hyver (Ed.), High Resolution Gas Chromatography, Product of
Hewlett-Packard., 3rd edition (1989).
193. JA Perry in J. Cazes (Ed), Introduction to Analytical Gas chromatogr, Marcel
Dekker Inc, (NY). , 14 (1981) 237-248.
194. R.L. Pecksok, L.D. Shields, T. Cairns and I.G. McWilliams, Modem Methods of
Chern. Analysis, J. Wiley and sons (NY)., 2 nd edition (1976) 54-84.
195. R.J. Block, E.L. Durrheim and G. Zweig, Paper Chromatogr. and Paper
Electrophoresis, Academic Press inc, (NY)., 2nd Edition (1958) 170-228.
196. K.B. Hicks in R.S.Tipson and D. Horten (Ed.), Adv. in Carbohydr. Chem and
Biochem, Academic Press Inc, London., 46 (1988) 17-71.
197. S. Ahuja in J.D. Winefordner (Ed.), Selectivity and Detectability Optimization in
HPLC, J. Wiley and Sons Publication (NY)., 104 (1989).
198. H.G. Barth and W.E Barber, C.H. Lockmuller, R.E. Majors and F.G. Regnier,
Ana/.Chem., 160 (1988) 387R-435R.
199. S. Ahuja in J.D. Winefordner (Ed.), Selectivity and Detectability Optimization in
HPLC, J. Wiley and Sons Publication (NY)., 104 (1989) 505-548
200. AA. Ben-Bassat and E. Grushka, J. of Liquid Chromatogr., 14 (6) (1991) 1051-1111.
201. S. Hizukuri and T. Takayi, Carbohydr. Res., 134 (1984) 1-10.
202. R.L. Whistler and A.M. Anisuzzaman, Methods Carbohydr. Chem., 3 (1963) 45-53.
203. J.W. Dolan, Liquid Chromatogr- Gas Chromatography., 8 (4) (1976) 290-294.
204. M. Dubois, K.A. Gilles, J.K. Hamilton, P.A. Rebers and F. Smith, Anal. Chem., 28
(1956) 350-256.
205. S.C. Churms, Adv, Carbohydr. Chem. and Biochem., 25 (1970) 13-51.
206. R.L.Whistier and AK.M. Anisuzzaman, Methods in Carbohydr. Chem., 3 (1963) 45-
53.
207. E. Grellert and C.E. Ballou, Carbohydr. Res., 30 (1973) 218-219.
208. BA Bidlingmeyer abd F.V. Warren (Jr), Liquid Chromatogr. Gass Chromatogr., Vol
6 (9) (1974) 780-786.
209. Ion-Exchange Chromatogr. Principles and Methods., Product of Pharmacia fine
Chemicals, 1-71.
210. G.G.S. Dutton, K.L. Mackie and AV. Savage,Carbohydr. Res., 84 (1980) 161-170.
211. J. DiFabio and G.G.S. Dutton, Carbohydr. Res., 91 (1981) 287-298.
212. K. Mopper, Anal. Biochem., 86 (1978) 597-601.
213. W.H. Scouten, Chromatography, International Scientific Communications Inc, USA,

179
series 2 Vol 1 (1977) 324-333.
214. E.Wood, E.F. Hounsell and T. Feizi, Carbohydr. Res., 90 (1981) 269-282.
215. A.L. Burlingame, D. Maltby, .H. Russell and P.T. Holland, Anal. Chem., 60 (1988)
294-R-342R
216. R.A. Laine XIII thlntemat. Carbohydr. Symp., (1986) B142 (269)
217. NK Kochetkov and O.S. Chizhov, Adv. Carbohydr. Chern., 21 (196639-93.
218. RL. Pecksok, L.D. Shields, T. Cairns and I.G. McWilliams, Modem Methods of
Chem. Analysis, J. Wiley and sons (NY)., 2 nd edition (1976) 316-352.
219. T.R. Covey, E.D. Lei, A.P. Briuns and J.D. Henion, Analytical. Chem., vol 58 14
December (1986) 1451A-1461A.
220. N.K.Kotchetkov and O.S. Chizhov, Methods. Carbohydr. Chem., 6 (1972) 540-554.
221. P-E. Jansson, L. Kenne, H. Liedgren, B. Lindberg and J. Lonngren, Chem.
Commun., 8 (1976) 1-20.
222. V. Kovacik, S. Bauer and J. Rosik, Carbohydr. Res., 8 (1968) 291-294.
223. H. Bjorndal, B. Lindberg, A Pilotti and S. Svensson, Carbohydr. Res., 15 (1970) 339-
349.
224. J. Karkkainen, Carbohydr. Res., 17 (1971) 11-18.
225. B. Munson, Anal. Chem., 43 (1971) 28A-43A.
226. B Munson, Anal. Chem., 49 (1977).
227. RHancock, K. Marshall and H Weigel, Carbohydr. Res., 49 (1976) 351-360.
228. M. McNeil, A.G. Darvill, P. Aman, L. Franzen and P. Albersheim, Methods in
Enzymol, Academic Press Inc., Vol 83 (1983) 3-45.
229. H.D. Beckey, Angew, Chem., 81 (1969) 662.
230. H.D. Beckey, Angew Chem., 87 (1987) 425.
231. A Dell, H.R Morris, H. Egge, H. von Nicolai and G. Strecker, Carbohydr. Res., 115
(1983) 41-52.
232. A.Dell and J.E. Oates, XII th Intemat. Carbohydr. Symp., (1984) 490.
233. A Dell and C.E. Ballou, Carbohydr. Res., 120 (1983) 95-111.
234. C. Bosso, . Defaye, A. Heyraud and J. Ulrich, Carbohydr. Res., 125 (1984) 309-317.
235. M. Barker, .C. Vickerman, Surf. Oefdt. Prop. Solids., 5 (1976) 162-183.
236. A Benninghaven and WK Sichtermann, Analyt. Chern., 50 (1978) 118
237. M. Barber, RS. Bordoli, RD. Sedgwick and A.N Tyler, Nature., 24 (1981) 293-324.
238. RS. Pappas, B.J. Sweetman, S. Ray and C.G. Hellerquist, Carbohydr. Res., 197
(1990) 1-14.
239. KM. Sanders and B.K. Hunter, Modem NMR Spectroscopy A Guide to Chemists.,
Oxford University Press (1988).
240. L.W. Jelinski, Modem NMR Spectroscopy., special report, AT and T Bell
Laboratories 5 th November (1984) 26-47.

180
241. R Benn, H. Gunther, Angew. Chem. Int. Ed. Engl., 22 (1983) 350-380.
242. G.A Morris, Magn. Res. in Chem., vol 24 (1986) 371-403.
243. K Bock and H. Thogersen, Annual Report in NMR Spectroscopy., 13 1982) 1-57.
244. B. Capon, D. Thacker, Proc. Chern. Soc., (1964) 369.
245. G. Kotowycz and RU. Lemieux, Chem. Res., 73 (1973) 669-698.
246. J.F.G. Vliegenthart, H van Halbeek and L .Dorland, Pure and Appl. Chem, Pergamon
Press Limited., 53 (1981) 45-77.
247. L Lerner and A Bax, Carbohydr. Res., 166 (1987) 35-46.
248. GA Morris and R Freeman, J. Am. Chem. Soc., 101 (1979) 760.
249. I.H. Dadler,Natural Product Reports., (1988) 101-127.
250. AJ. Perlin and B. Casu in G.O. Aspinall (Ed.), The Polysaccharides, Academic
Press Inc., 1 (1982) 140-151.
251. H.J. Jennings, Adv. Carbohydr. Chem. Biochemo, 41 (1983) 155-208.
252. S.J. Angyal, Carbohydr. Res., 84 (1980) 201-209.
253. J.M. Berry, .G.S. Dutton, L.D. Hall and K.L. Mackie, Carbohydr. Res., 53 (1977) C8-
C10.
254. DA Cumming, Carbohydr. Res., 179 (1988) 369-380.
255. P.E. Jansson, L. Kenne, G.Widmalm, XI1I th Int. Carbohydr. Symp., (1986)
unspecified symposium hand-out.
256. E.F. Hounsell, D.J. Wright, AS.R. Donald and J. Feeney, XII th Int. Carbohydr.
Symp., (1984) unspecified symposium hand-out.
257. A Bax, R Freeman, J. of Magn. Reson, 44 (1981) 542-561.
258. A.E. Derome, Modern NMR Techniques for Chemistry Research, Pergamon Press
Oxford, Vol 6 (1988) 183-257.
259. W.J. Goux and C.J. Unkefer, Carbohydr. Res.,159 (1987) 191-210.
260. A Bax, G. Drobny, J. of Magn. Reson, 61 (1985) 306-320.
261. D.G. Davis and A Bax, J. Am. Chem. Soc., 107 (1985) 2820-2821.
262. A Bax, V. Sklenar and M.F. Summers, J. of Magn. Reson, 70 (1986) 327-331.
263. D.R Bundle, M. Gerken and M.B. Perry, Can. J. Chem., 64 (1986 255-263.
264. H. Kessler, C. Griesinger, R Kerssebaum, K. Wagner and RR Ernst, J. Am. Chem.
Soc., 109 (1987) 607-609.
265. A Bax and D.G. Davis, J. Magn. Resonance. 63 (1985) 207-213.
266. D. Neuhaus and M. Williamson, The Nuclear Overhauser Effect in Structural and
Conformational Analysis, VCH Publishers Inc, USA, (1989) 312-327.
267. AA Bothner-By, RL. Stephens, J-M. Lee, C.D. Warren and RJ. Jeanloz, Am.
Chem. Soc., 106 (1984) 811-813.
268. D. Uhrin, G. Batta and K.E. Kover, J. of Magn. Resonance., 97 (1992) 54-64.
269. A Bax and M.F. Summers, J. Am. Chem. Soc., 108 (1986) 2093-2094.

181
270. A Bax and S.J. Subramanian, J of Magn. Reson, 67 (1986) 565.
271. A Bax. A Aszalos, Z. Dinya and K. Sudo, J. Am. Chern. Soc., 108 (1986) 8056-
8063.
272. B.H. Park, Virology., 2 (1956) 711-718.
273. AH. De Bruin, Structural studies on the capsular antigens of E. coli Serotype K102 &
K47., Thesis (Rhodes University) Dec 1991.
274. M.H.V. Van Regenmortel, S. Muller, V.F. Quesniaux, D. Altschuh, and J.P. Briand in
H. Kohler and P.T. Loverde (Ed.), "Vaccines", Longman Scientific and Technical,
NY., (1988). 113-120.