the currency-plus-commodity basket - growth lab · 6" "...
TRANSCRIPT
1
The Currency-Plus-Commodity Basket: A Proposal for Exchange
Rates in Oil-Exporting Countries to Accommodate Trade Shocks
Automatically
Jeffrey A. Frankel
CID Working Paper No. 333 December 2016. Revised March 2017
© Copyright 2017 Frankel, Jeffrey A.; and thePresident and Fellow of Harvard College
at Harvard University Center for International Development Working Papers

2
1st draft, Dec. 31, 2016. Revised, March 19, 2017
The Currency-‐Plus-‐Commodity Basket: A Proposal for Exchange Rates in Oil-‐Exporting Countries to Accommodate Trade Shocks Automatically
Jeffrey A. Frankel, James W. Harpel Professor of Capital Formation and Growth, Harvard Kennedy School, Harvard University
This paper was written for Macroeconomic Institutions and Management in Resource-‐Rich Arab Economies (forthcoming, Oxford University Press). The author gratefully acknowledges support from the
Economic Research Forum, Cairo, Egypt, and valuable research assistance from James Fallon.
Abstract
The paper proposes an exchange rate regime for oil-‐exporting countries. The goal is to achieve the best of both flexible and fixed exchange rates. The arrangement is designed to deliver monetary policy that counteracts rather than exacerbates the effects of swings in the oil market, while yet offering the day-‐to-‐day transparency and predictability of a currency peg. The proposal is to peg the national currency to a basket, but a basket that includes not only the currencies of major trading partners (in particular, the dollar and the euro), but also the export commodity (oil). The plan is called Currency-‐plus-‐Commodity Basket (CCB). The paper begins by fleshing out the need for an innovative arrangement that allows accommodation to trade shocks. The analysis provides evidence from six Gulf countries that periods when their currencies were “undervalued”, in the sense that the actual foreign exchange value lay below what it would have been under the CCB proposal, were periods of overheating as reflected in high inflation and of external imbalance as reflected in high balance of payments surpluses. Conversely, periods when the currencies were “overvalued,” in the sense that their foreign exchange value lay above what it would have been under CCB, featured unusually low inflation and low balance of payments. These results are suggestive of the implication that the economy would have been more stable under CCB. The last section of the paper offers a practical blueprint for detailed implementation of the proposal.
Contents
1. Introduction2. Exchange Rate Arrangements in Use by Oil-‐exporting Countries3. Unorthodox Proposals for Countries with Volatile Commodity Export Prices4. The Proposal for a Currencies-‐plus-‐Commodity Basket (CCB)5. The Currency-‐plus-‐Commodity Basket and Gulf Countries’ Recent History
(a) Identifying periods of overvaluation or undervaluation by means of the CCB(b) Consequences of overvaluation or undervaluation(c) Corroborating evidence from IMF Article IV Reports(d) Overview of the statistical evidence for GCC countries
6. Design details: A CCB blueprint
JEL code: F3. Keywords: basket, commodities, currency, exchange rate, Gulf, oil, peg, Saudi Arabia.

3
The Currency-‐Plus-‐Commodity Basket: A Proposal for Exchange Rates in Oil-‐Exporting Countries to Accommodate Trade Shocks Automatically
1. Introduction
It has long been observed that global prices for oil are considerably more volatile than prices of manufactured goods or services. But the oil price swings in recent years have been so large that oil-‐exporting countries have experienced variability in their terms of trade that is even higher than usual. The period 2001-‐2016 saw two complete cycles: a long rise in oil prices that peaked in mid-‐2008, followed by a short abrupt fall in the global recession of 2008-‐09, and then a renewed boom in 2010-‐13, followed by a new crash in oil prices beginning in mid-‐2014. For many oil exporters these swings have wreaked havoc with their financial situation, the state of their real economy, and their government’s budget planning.1
The subject of this paper is the choice of exchange rate arrangements for an oil-‐exporting country that wishes to reduce its future vulnerability to fluctuations in the world price of oil. The issues are surveyed briefly. But the intended contribution of the paper is to offer a very specific practical proposal, intended particularly for countries like Saudi Arabia that have traditionally pegged tightly to the dollar or countries like Kuwait that have pegged to a basket of major currencies. Those pegs have worked well in terms of offering transparency and stability. But the rigidity of the peg prevents accommodation to the biggest sort of shock that these countries face, changes in the price of oil.
In extreme cases, countries like Azerbaijan and Kazakhstan have recently found that their official exchange rate peg is not sustainable and have been forced to undergo economically painful and politically humiliating devaluations. A depreciation is what would have happened anyway, if the currency had been floating all along. But typically the devaluation comes after they have spent much of their reserves, suffered an adverse shift in the composition of their balance sheets, and lost credibility for official policy pronouncements regarding long-‐term monetary arrangements.2
The proposal, in brief, is to add to a basket of major currencies, say the dollar and euro, a third unit, namely oil. The plan is called Currency plus Commodity Basket, abbreviated CCB. It is intended to offer the best of both worlds: the stability, transparency and predictability of a peg, on the one hand, with the sustainability and economic flexibility afforded by a floating exchange rate on the other hand. The author has in the past offered proposals for related monetary regimes that were similarly designed to provide automatic accommodation to terms of trade shocks faced by commodity exporters. But the new CCB proposal is a more practical

4
and improved version, designed for these oil exporting countries in particular. The paper includes a detailed blueprint for how the plan would be put into action and subsequently maintained.
2. Exchange Rate Arrangements in Use by Oil-‐exporting Countries
It is not surprising that the general question whether countries should fix their exchange rates or float their currency should depend on the circumstances of the individual country in question. But it is perhaps surprising that economists do not have an agreed “conventional wisdom” as to what is the recommended exchange rate arrangement appropriate for a country that is heavily dependent on exports of a single volatile commodity like oil. Does a dependence on oil exports point to fixing, other things equal? Floating? An intermediate regime such as a target zone? Some other monetary arrangement altogether?
There are two textbook recommendations that in this context point in opposite directions. The first is that a relatively small open developing economy is a good candidate for a fixed exchange rate. “Small and open” means that internationally traded goods constitute a high share of its economy, so that exchange rate volatility is costly, if it can be avoided. “Developing” may imply that its financial markets are not as well-‐developed3 and perhaps that its central bank does not have as high credibility as the monetary authorities in advanced economies, and therefore needs a visible anchor for monetary policy such as a fixed exchange rate.4 Indeed most very small very open economies do have firm currency pegs. Examples among oil exporters include Brunei, Timor l’Este, and Trinidad and Tobago.
The second recommendation is that a country that tends to experience high exogenous volatility in its terms of trade, which certainly characterizes oil exporters, should let its currency float. The reasoning is that the under this regime the currency will automatically appreciate when the world oil market is booming and automatically depreciate when the oil market declines. Empirical evidence that the currencies of commodity-‐exporting countries that float do in fact fluctuate together with the global prices of the commodities in question is offered by Cashin, Céspedes, and Sahay (2004), Chen and Rogoff (2003), Frankel (2007), and Habib and Kalamova (2007), among others. (Examples of such commodity currencies include those of Australia, Canada, Chile, New Zealand, Russia and South Africa.)
Furthermore, a number of studies have confirmed empirically that in the presence of large terms of trade shocks, economic performance tends to be better in countries with floating exchange rates than in countries with conventionally fixed exchange rates: Broda (2004), Edwards and Levy-‐Yeyati (2005), Rafiq (2011), and Céspedes and Velasco (2012).5
The Gulf countries have opted for fixed exchange rates, either a peg to the dollar, as in the case of Saudi Arabia and the UAE, or a peg to a currency basket as in the case of Kuwait. The

5
pegs have probably served the countries well in the past, especially in the 1980s and 1990s when oil prices were not quite so volatile. But it has created problems when the world price of oil exhibits big swings, up or down, as it has repeatedly since the turn of the century.
During oil booms, such as 2006-‐08 or 2011-‐13, some Gulf countries have experienced unwanted monetary inflows, credit expansion, inflation and asset bubbles. During oil busts, such as 2014-‐15, they experience worrisome balance of payments deficits and economic contraction. These problems would have been moderated if the currency had been allowed to appreciate during the boom and depreciate during the bust. During the boom, a strongly valued currency would have dampened monetary inflows, credit expansion, wasteful spending, overheating, inflation, debt, and asset prices. During the downturn, currency depreciation would have moderated the balance of payments deficit and losses of output and employment. It would also have automatically incentivized the private sector to diversify into other traded goods and services, thereby reducing long-‐term dependence on the oil sector.
Other oil exporting countries have recently suffered much worse versions of the problem than have the Gulf countries which have the advantage of higher foreign exchange reserves and lower populations. Many have been forced to abandon their exchange rate targets, not as a calm deliberate policy decision, but under the pressure of crisis. Examples include Azerbaijan and Kazakhstan, among others. (Some like Nigeria continued in 2016 to cling to their exchange rate pegs despite adverse economic consequences.) When the devaluation finally comes, it is typically after the country has lost a lot of credibility, not to mention foreign exchange reserves, compared to what would have happened if it had got there sooner by floating. Currency mismatches hurt balance sheets -‐-‐ dollar debt is now much more expensive to service in terms of domestic -‐-‐ and can lead to defaults and a severe contraction in economic activity.
An exchange rate target is not the only nominal anchor or monetary regime that prevents accommodation to terms of trade shocks. The money supply and the inflation rate are two other nominal anchors in wide use, accompanied by a floating rate. If the money supply is the central bank’s target, which was the monetarist idea adopted as official policy by the most important central banks in the 1980s and which continues to be the official nominal anchor of central banks in some developing countries, then there is little room to respond to a decline in the export price with an adjusted monetary setting that is easy enough to allow depreciation of the currency. If some version of the CPI is the central bank’s target, which is the inflation targeting idea that became widespread among developing countries after the currency crises of the late 1990s, then again there is no room for accommodation of terms of trade shocks.6
What is wanted is a new monetary arrangement that combines some of the advantages of floating, namely automatic accommodation to terms of trade shocks, with some of the advantages of an exchange rate target, namely an explicit nominal anchor for monetary policy
6
to allow transparency and credibility.
3. Unorthodox Proposals for Countries with Volatile Commodity Export Prices In past research, the author has made some attempts to develop possible monetary
arrangements that would combine accommodation to trade shocks with a firm nominal anchor.
I started by investigating the idea that countries that specialize in the production of a particular commodity should peg the value of their currency to the price of that commodity. I called the proposal PEP, for “Peg the Export Price.” For example, oil producers could peg to oil.7 The proposed regime did have both of the desired properties: the pure commodity peg would supply a clear verifiable nominal anchor for monetary policy, as a currency peg does, and yet the exchange rate would automatically accommodate fluctuations in the world price of oil, as a floating exchange rate does. The main problem was that the latter property was excessive. The exchange rate would be too volatile if it rose or fell by 50% every year that the price of oil rose or fell by 50%.
I then investigated milder versions, where the central bank targeted the price index of a basket of export commodities8 or a comprehensive index of domestically produced goods such as the GDP deflator.9 This proposal was offered as an alternative way of implementing the popular arrangement of Inflation Targeting, which many central banks claim to follow, particularly developing countries that abandoned exchange rate targets after the currency crises of the 1990s. Drawbacks here have to do with the technical availability of the price data. The GDP deflator, for example, is typically available only with a lag, and is subject to subsequent revisions that are sometimes large. Also the proposal struck many as strange and unfamiliar.
Targeting Nominal GDP is a more familiar candidate for monetary authorities to consider, with support from many macroeconomists. It is designed to insulate countries from the full effects of terms of trade shocks, as is PEP, but also from the full effects of supply shocks such as weather disasters or productivity shocks. Even though Nominal GDP targeting has been discussed in the context of industrialized economies, I have argued that the proposal is particularly relevant to developing countries, because they are more exposed to such shocks. Statistical estimates of the relevant parameters (e.g., the magnitude of oil price fluctuations) for the case of Kazakhstan seemed to support the mathematical condition necessary for Nominal GDP targeting to dominate Inflation Targeting.10
4. The Proposal for a Currencies-‐Plus-‐Commodity Basket (CCB)
For countries in the Gulf, the most relevant alternative is not Inflation Targeting, but rather an exchange rate peg. The status quo is a simple peg to the dollar in the cases of Saudi Arabia,
7
the UAE, and the smallest Gulf countries. The Saudi and other national authorities continue to believe that a simple dollar peg has served their countries well. Supporting research includes Al-‐Hamidy and Banafe (2013) and Alkhareif and Qualls (2016).
The status quo is a peg to a basket of major currencies in the case of Kuwait. As Marzovilla and Mele (2010) describe the decision, “In May 2007, Kuwait unilaterally abandoned the dollar peg, adopted in 2003 as a first step towards the monetary integration of GCC countries, to return to the previous basket peg system. The decision was motivated by the need to limit the inflationary pressures…” The Kuwaiti authorities have kept the weights secret, but Marzovilla and Mele estimate the implicit weights on major currencies econometrically. They find greater weight on the dollar than the euro, for example .8 vs. .2 during the period August 5, 2008 to February 28, 2010.11
Habib and Stráský (2008), Abed, Nuri Erbas, Guerami (2003) and Aleisa, Hammoudeh, and Yuan (2008), find generally that a basket peg would suit Gulf countries better than a simple dollar peg.12
Under the plan proposed by this paper, oil exporting countries peg their currencies to a basket that includes the export commodity -‐-‐ oil -‐-‐ alongside major currencies. In the simplest case, the basket could assign equal weights of importance to three components: 1/3 to the dollar, 1/3 to the euro, and 1/3 to oil.
The paper will spell out the plan in detail, to provide a sort of practical blueprint or cookbook ready to be implemented by any country’s monetary authorities who might be interested in considering it.
Design details to be considered in Section 6 of the paper include:
• the choice of major currencies to go into the formula; • the oil price index to be used; • the computation of the coefficients on the major currencies and oil; • the frequency with which the coefficients would be revised; • whether the announcement of the new regime would include an immediate discrete
devaluation (or revaluation) to correct an existing misalignment on the one hand, or would maintain continuity with the current exchange rate on the other hand;
• whether a trend would be included in the formula, to allow the regime to be consistent with inflation targeting; and
• The mechanics of setting, announcing, and implementing the daily value of the exchange rate implied by the formula.

8
A useful counterfactual exercise might investigate the effects that the Currencies-‐Plus-‐Oil Basket arrangement would have had in a sample of countries if it had been in place in recent years in place of the actual exchange rate regime. For some countries, such as Algeria, Azerbaijan and Kazakhstan, the exchange rate has eventually been adjusted up or down in the aftermath of a big change in the price of oil (and also, in the case of Kazakhstan, in the aftermath of the devaluation of a major neighbor currency); but the adjustment has in some cases been long-‐delayed and accompanied by damaging losses of foreign exchange reserves, confidence and credibility for the authorities, and adverse balance sheet effects for domestic debtors. In the case of the Gulf countries, their foreign exchange reserve levels and overall economic strength have been sufficient to easily avoid a forced abandonment of currency pegs.
Either way, it is straightforward to look at the path that the exchange rate would have followed under the Currencies-‐plus-‐Commodity Basket alternative and to check how historical periods of large overvaluation or undervaluation relative to that benchmark correspond to evidence of imbalances externally (large balance of payments deficits or surpluses) or internally (overheating of the economy, showing up as rising inflation, or the reverse). This is the task of the next section of the paper, followed then by the detailed blueprint.
5. The Currency-‐plus-‐Commodity Basket and Gulf Countries’ Recent History The argument in favor of pegging the exchange rate to a basket that includes the price of oil, again, is that it would make monetary policy automatically countercyclical rather than procyclical. A simple peg to the dollar or other major currencies can exacerbate the boom-‐bust cycle. When global oil markets and hence the domestic economy are booming, the peg leads to trade surplus, balance of payments surplus, rapid reserve growth, excessive growth in money and credit, excess demand for domestic output and labor, overheating of the economy, inflation, and asset bubbles. When global oil markets and hence the domestic economy are in a downturn, the peg leads to trade deficit, balance of payments deficits, reserve loss, contraction in money and credit, excess supply of domestic output and labor, recession, disinflation, and asset market declines.
To fully explore the claim that the adoption of the CCB proposal would moderate these fluctuations would require a model of the national macroeconomy. Even restricting the set to theories of the small open economy, many sophisticated models exist with varying assumptions and varying implications. For example, some models assume that international financial markets work efficiently to finance current account deficits with net capital inflows and offset current account surpluses with net capital outflows, so that governments need not be concerned with these measures of external balance, while other models assume that capital

9
flows are as likely to exacerbate current account imbalances as to counteract them.13 Similarly, some models assume that the real exchange rate is the same regardless whether the nominal exchange rate is fixed or floating,14 while others assume that movements in the nominal exchange rate often cause movements in the real exchange rate.
This paper attempts a less ambitious empirical exercise. We focus on Gulf countries. For any given country, it is easy to show what the path of the exchange rate would have been since the year 2000 if the Currency-‐plus-‐Commodity Basket had been the regime in effect, and to see how it compares with the actual exchange rate policy that was followed. We will label as “undervalued” any periods when the actual foreign exchange value of the national currency lay substantially below the value it would have had under the CCB proposal, and label as “overvalued” any periods when the actual foreign exchange value of the national currency lay substantially above the value it would have had under the CCB proposal. We define “substantially” as a gap that exceeds a particular threshold, here taken to be 5%.
We will then look at some indicators of internal balance and external balance with which national authorities are concerned or should be concerned.15 Our primary indicator of internal balance is the inflation rate, though others of interest could include the GDP growth rate, employment growth, credit growth, housing prices, and equity prices. Our primary indicator of external balance is the overall balance of payments as measured by the change in international reserves, though others of interest could include the current account balance and the level of foreign exchange reserves. Our hypothesis is that during periods of “undervaluation,” the countries will, on average, show evidence of high reserve inflows and experience symptoms of overheating such as high inflation; during periods of “overvaluation,” they should show low reserve inflows and evidence of slack in the economy, such as low inflation.
An advantage of this approach is that it is not dependent on any particular macroeconomic model. A disadvantage is that there is no way of allowing for the many other influences on internal and external balance, such as changes in government spending, domestic political disturbances, immigration, natural disasters, and other shocks in the global economic and financial environment.
(a) Identifying periods of overvaluation or undervaluation by means of the CCB
Figures 1 show the actual exchange rate and the alternative CCB exchange rate for six Gulf countries: Saudi Arabia, Kuwait, UAE, Bahrain, Oman, and Qatar. As throughout this paper, for expositional ease we choose to show the foreign exchange value of the currency, rather than its inverse (the exchange rate defined as units of domestic currency per unit of foreign currency). Thus an upward movement in the graph is an appreciation. Furthermore, in these

10
graphs we use the SDR as the neutral numeraire for valuing the national currencies. (To use the dollar as the numeraire would give a misleading picture, for countries that trade more with Europe, Asia, and the rest of the world than they do with the United States.)
The story is mostly similar for each of the six. The actual value of their currencies fluctuated only modestly, as a consequence of their pegging policies. The counterfactual value of the Currency-‐plus-‐Commodities basket moved more and, this paper would argue, moved in the desirable direction in each case.
(i) The Saudi riyal (Figure 1a) depreciated in terms of the SDR from 2003 to 2008 and appreciated a bit from 2014 to 2015. These movements were a consequence of the riyal’s peg to the dollar and the dollar’s depreciation against other SDR components (particularly the euro) during the first period and appreciation during the latter period. The counterfactual CCB exchange rate, by contrast, shows that there would have been a strong and steady rise in value from 2004 to mid-‐2008, following the world price of oil upward; an abrupt plunge in late 2008; a renewed rise to a high plateau 2011-‐2013; and again a sharp fall from mid 2014 through 2015.
Figures 1: The actual exchange rate and Currency-‐Plus-‐Commodities basket for some Gulf countries
Figure 1a: Foreign exchange value of Saudi riyal and CCB
If the hypothesis is correct that the movement in the CCB resembles something like an equilibrium path, then the situation is worse than the observation that the riyal’s peg to the dollar did not allow any accommodation of the fluctuations in the global oil market. The riyal
11
actually tended, if any thing, to move the wrong direction. When the dollar appreciates sharply, as in 2008-‐09 and 2014-‐15, the riyal appreciates with it (against the SDR) -‐-‐ which is the opposite of the direction that one wants the Saudi currency to move at a time when the dollar price of oil is falling sharply. This is probably the sort of logic that persuaded Kuwait to abandon the simple dollar peg and return to a basket peg.
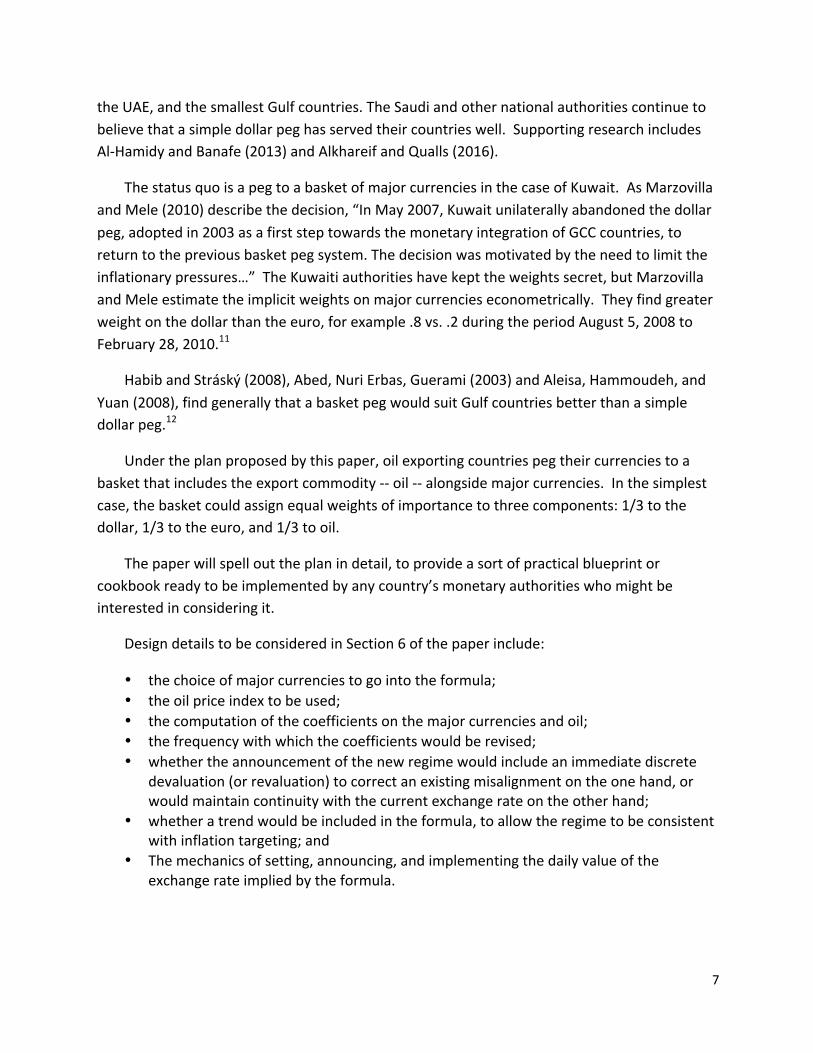
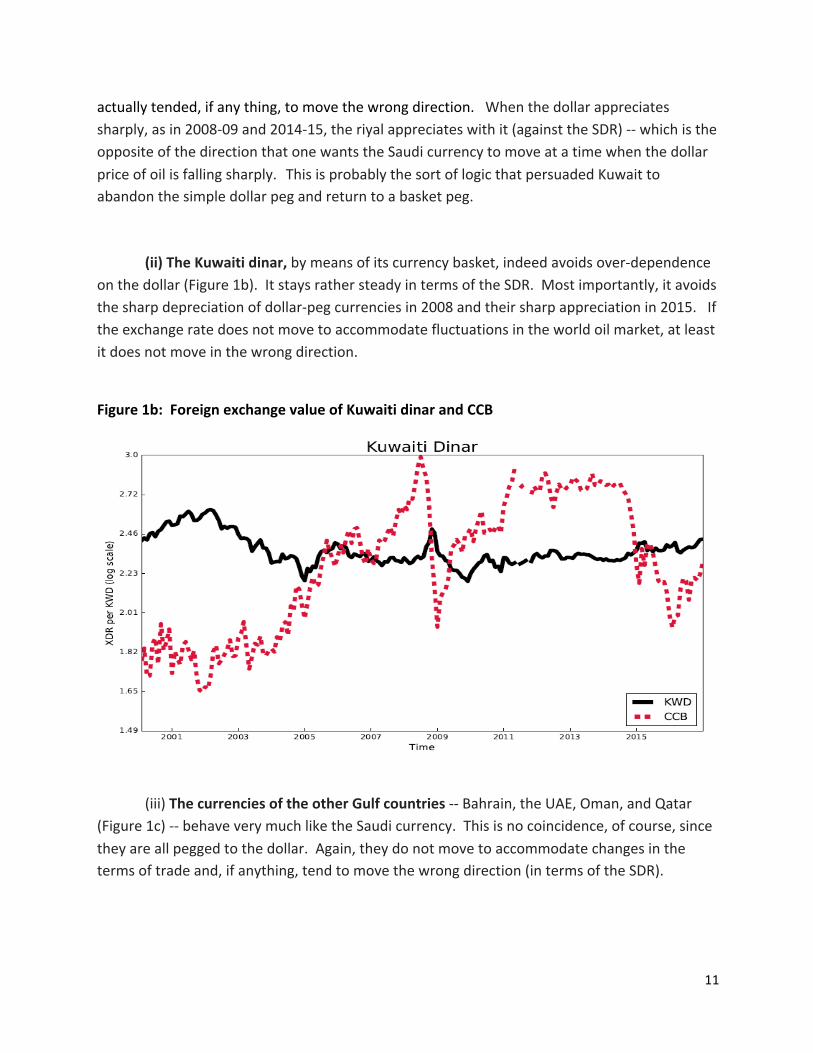
(ii) The Kuwaiti dinar, by means of its currency basket, indeed avoids over-‐dependence on the dollar (Figure 1b). It stays rather steady in terms of the SDR. Most importantly, it avoids the sharp depreciation of dollar-‐peg currencies in 2008 and their sharp appreciation in 2015. If the exchange rate does not move to accommodate fluctuations in the world oil market, at least it does not move in the wrong direction.
Figure 1b: Foreign exchange value of Kuwaiti dinar and CCB
(iii) The currencies of the other Gulf countries -‐-‐ Bahrain, the UAE, Oman, and Qatar (Figure 1c) -‐-‐ behave very much like the Saudi currency. This is no coincidence, of course, since they are all pegged to the dollar. Again, they do not move to accommodate changes in the terms of trade and, if anything, tend to move the wrong direction (in terms of the SDR).

12
Figure 1c: Foreign exchange value of four other Gulf currencies and CCB
(b) Consequences of overvaluation or undervaluation
To pronounce the Gulf currencies undervalued or overvalued at any point in time, because their foreign exchange values lie below or above the CCB line, is not especially compelling until we see evidence of economic consequences. The next step is to see if these countries experiences symptoms of excess demand for goods or rapid reserve accumulation during the periods when their currencies were undervalued by our criterion, and symptoms of excess supply of goods or reserve loss during the periods when their currencies were overvalued by our criterion.
For a symptom of excess demand, we focus on the inflation rate. For a symptom of international payments imbalance we focus on the change in foreign exchange reserves.
(i) Saudi Arabia
Table 1 reports for Saudi Arabia measures of internal balance and external balance: inflation and change in reserves (as a percent of GDP), respectively, for each of two periods of undervaluation and three periods of overvaluation. Under-‐ and overvaluation in this case are defined as a gap between the actual riyal exchange rate and the CCB rate (the two lines shown in the first set of graphs, Figure 1a) in excess of 5 per cent in absolute value.
The results are as was hypothesized. Inflation is substantially higher during the two periods of undervaluation, averaging 4.7%, than during the three periods of overvaluation,

13
when it averaged only 1.4%. For example, inflation was virtually zero during the years 2001-‐04, when oil prices were low but a high dollar dictated a high riyal.
Meanwhile, Saudi Arabia ran large balance of payments surpluses, as reflected in additions to international reserves during each of the two periods of undervaluation, which were the peaks in oil prices centered on 2007-‐08 and 2010-‐13. The Kingdom ran balance of payments deficits, as reflected in reserve losses, during the two periods when overvaluation resulted from abrupt declines in the price of oil (2008-‐09 and 2014-‐15) without corresponding declines in the riyal. It ran a small surplus during the overvaluation period (2001-‐04). Averaging over the three overvaluation periods, and computed as a share of GDP, the balance of payments was greater than zero, but was smaller than the undervaluation periods, which is the main point. Table 1: SAUDI ARABIA internal and external balance
Undervaluation Overvaluation Inflation (annual %)
Change in reserves (US$ mn, avg monthly)
Change in reserves /GDP (avg monthly)
JAN 2001 -‐ JAN 2005 0.03 1606.1 0.51 MAR 2007 -‐ SEP 2008 6.66 10933.2 2.29 NOV 2008 -‐ MAR 2009 7.55 -‐5884.2 -‐1.35 MAY 2009 -‐ NOV 2014 4.20 5014.3 0.74 JUN 2015 -‐ OCT 2016† 3.50 -‐8229.2 -‐1.52
Average for over-‐valuation periods 1.36 -‐1177.0 0.15
Average for under-‐valuation periods 4.69 6322.0 1.08 Source: Global Financial Data, WDI
† Reserves data end Dec.2015
Note: "Undervaluation (overvaluation)" indicates that the actual value of the currency in terms of SDRs was at least 5% below (above) what the CCB formula with weights 1/3, 1/3/1/3 would have given.
(ii) Kuwait
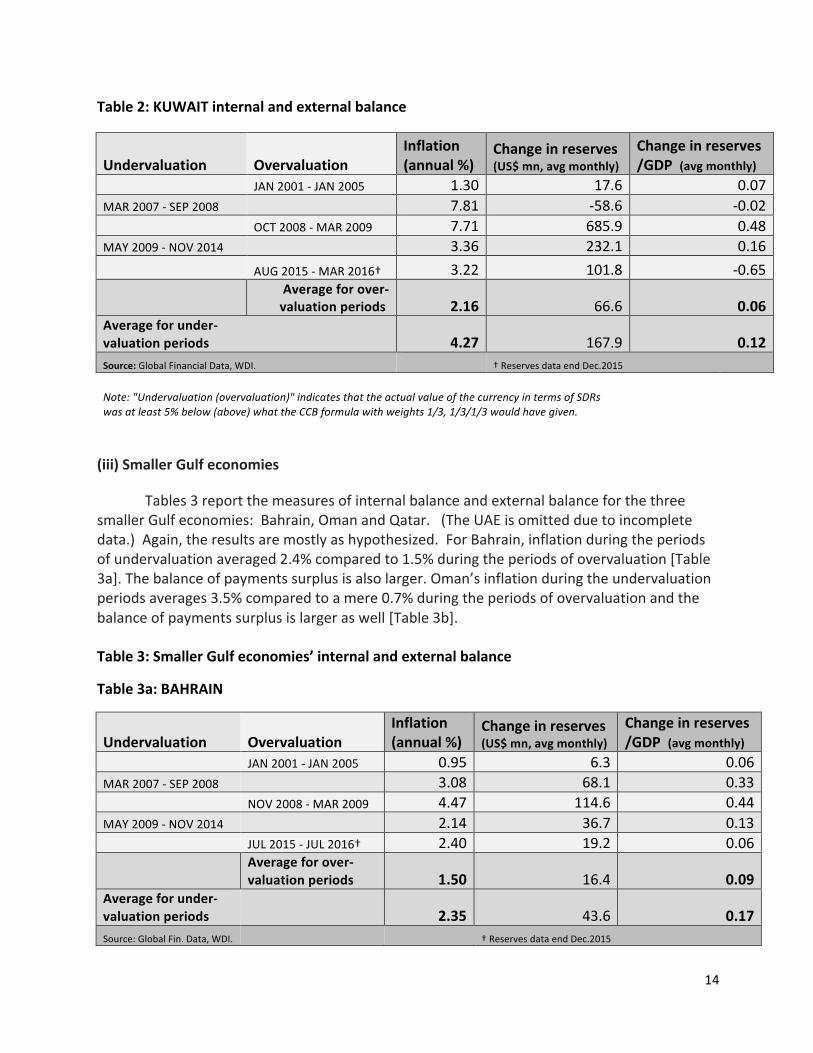
Table 2 reports the measures of internal balance and external balance for Kuwait. Again, the results are as hypothesized: inflation during the two periods of undervaluation averaged 4.3% compared to 2.2% during the three periods of overvaluation.
Meanwhile, the results also hold up regarding external balance. Kuwait ran large balance of payments surpluses on average during the periods of undervaluation, larger than during the three overvaluation periods.
14
Table 2: KUWAIT internal and external balance
Undervaluation Overvaluation Inflation (annual %)
Change in reserves (US$ mn, avg monthly)
Change in reserves /GDP (avg monthly)
JAN 2001 -‐ JAN 2005 1.30 17.6 0.07 MAR 2007 -‐ SEP 2008 7.81 -‐58.6 -‐0.02 OCT 2008 -‐ MAR 2009 7.71 685.9 0.48 MAY 2009 -‐ NOV 2014 3.36 232.1 0.16 AUG 2015 -‐ MAR 2016† 3.22 101.8 -‐0.65
Average for over-‐valuation periods 2.16 66.6 0.06
Average for under-‐ valuation periods 4.27 167.9 0.12 Source: Global Financial Data, WDI. † Reserves data end Dec.2015
Note: "Undervaluation (overvaluation)" indicates that the actual value of the currency in terms of SDRs was at least 5% below (above) what the CCB formula with weights 1/3, 1/3/1/3 would have given.
(iii) Smaller Gulf economies
Tables 3 report the measures of internal balance and external balance for the three smaller Gulf economies: Bahrain, Oman and Qatar. (The UAE is omitted due to incomplete data.) Again, the results are mostly as hypothesized. For Bahrain, inflation during the periods of undervaluation averaged 2.4% compared to 1.5% during the periods of overvaluation [Table 3a]. The balance of payments surplus is also larger. Oman’s inflation during the undervaluation periods averages 3.5% compared to a mere 0.7% during the periods of overvaluation and the balance of payments surplus is larger as well [Table 3b]. Table 3: Smaller Gulf economies’ internal and external balance
Table 3a: BAHRAIN
Undervaluation Overvaluation Inflation (annual %)
Change in reserves (US$ mn, avg monthly)
Change in reserves /GDP (avg monthly)
JAN 2001 -‐ JAN 2005 0.95 6.3 0.06 MAR 2007 -‐ SEP 2008 3.08 68.1 0.33 NOV 2008 -‐ MAR 2009 4.47 114.6 0.44 MAY 2009 -‐ NOV 2014 2.14 36.7 0.13 JUL 2015 -‐ JUL 2016† 2.40 19.2 0.06
Average for over-‐valuation periods 1.50 16.4 0.09
Average for under-‐valuation periods 2.35 43.6 0.17 Source: Global Fin. Data, WDI. † Reserves data end Dec.2015

15
Table 3b: OMAN
Undervaluation Overvaluation Inflation (annual %)
Change in reserves (US$ mn, avg monthly)
Change in Reserves /GDP (avg monthly)
JAN 2001 -‐ JAN 2005 -‐0.04 25.6 0.12 MAR 2007 -‐ SEP 2008 8.78 280.7 0.64 NOV 2008 -‐ MAR 2009 9.09 248.8 0.42 MAY 2009 -‐ NOV 2014 2.17 83.3 0.12 JUL 2015 -‐ OCT 2016† 0.40 267.7 -‐0.40
Average for over-‐valuation periods 0.73 89.2 0.10
Average for under-‐valuation periods 3.50 126.9 0.24 Source: Global Fin. Data, WDI. † Reserves data end Dec.2015
Table 3c: QATAR
Undervaluation Overvaluation Inflation (annual %)
Change in reserves (US$ mn, avg monthly)
Change in reserves /GDP (avg monthly)
JAN 2001 -‐ JAN 2005 7.17 48.6 0.20 MAR 2007 -‐ SEP 2008 9.12 277.2 0.33 NOV 2008 -‐ MAR 2009 7.14 69.0 0.10 MAY 2009 -‐ NOV 2014 1.13 501.0 0.34 JUN 2015 -‐ JUL 2016† 2.58 -‐294.3 -‐0.49
Average for over-‐valuation periods 5.30 -‐16.4 0.13
Average for under-‐valuation periods 2.83 451.6 0.34 Source: Global Financial Data, WDI. † Reserves data end Dec.2015
Note: "Undervaluation (overvaluation)" indicates that the actual value of the currency in terms of SDRs was at least 5% below (above) what the CCB formula with weights 1/3, 1/3/1/3 would have given.
Qatar shows the one data point that goes the wrong way: its inflation rate averaged a lower level during its undervaluation periods, 2.8%, compared to 5.3% during its overvaluation period [Table 3c]. This was a consequence of its success at sharply bringing down inflation after 2008 (even when oil prices were high), from the elevated inflation levels experienced during the preceding years. But Qatar like the other countries does show a higher balance of payments surplus during the undervaluation years than during the overvaluation years.

16
(c) Corroborating evidence from IMF Article IV Reports Besides the raw data on inflation and reserves, an alternative source of information for evaluating disequilibria in these episodes is the annual Article IV reports from the International Monetary Fund. A table in the appendix presents a selection of quotes from the reports on the relevant countries in the relevant years. (A still longer table giving a more extensive set of excerpts from the IMF reports, and including the three smaller Gulf countries as well, is available in an unpublished appendix.) It is important to note that most of the Article IV consultations do not recommend that any of these countries in question change their exchange rate regimes. Usually they support the views of the national authorities that the existing currency pegs provide useful monetary anchors. (Only in 2009, in the context of a Saudi Arabia consultation, did some IMF directors encourage the authorities in all GCC countries to consider a more flexible exchange rate regime.)
For the period 2001-‐04, during which the foreign exchange value of these countries’ currencies lay well below the CCB level, the IMF comments repeatedly on the low level of inflation in Kuwait, Saudi Arabia, and the UAE.
For 2007 and the first half of 2008, when high oil prices pushed the CCB well above the countries’ actual exchange rates, the Article IV reports show concern about accelerating inflation, particularly in the housing market. There are references to strong demand for goods and labor and high asset prices (equities and real estate). The Saudi balance of payments surplus piled up reserves, to a level equal to 19 months’ worth of imports. Efforts to sterilize the inflow were not sufficient to “contain the expansion in monetary aggregates.” This presumably contributed to Saudi inflation which “poses the main challenge for the authorities.” The UAE was described as “vulnerable in the wake of an unprecedented credit and asset price boom.”
When the global financial crisis hit in late 2008, some floating-‐rate countries in other parts of the world achieved a measure of insulation by means of currency depreciation and monetary expansion. But the IMF Article IV reports describe abrupt downturns for the Gulf countries through 2009. Inflation fell substantially in all three. In the UAE, “After peaking at about 12 percent in 2008, inflation declined to 1 percent in 2009." In addition, in Kuwait, “Equity prices continued to decline, money growth slowed, and credit growth plunged.” The UAE was hit by a stalling of “all three growth engines in 2009. Oil receipts plummeted, global trade and logistics contracted, and property development all but ground to a halt as incomes fell and property prices plunged. A second bout of disruption arose when the government of Dubai announced in late November 2009 that DW [Dubai World] would seek a six-‐month

17
standstill on repayments...." Also in 2009, the UAE began to run a rare current account deficit, equaling almost 3% of GDP.
The years 2011 to mid-‐2014 constitute the most prolonged period of currency undervaluation, judged by the CCB criterion. Sure enough, the IMF documents regarding all three countries starting in 2011 are once again full of concerns about rising inflation. They also note large external surpluses in Saudi Arabia and the UAE (reaching the vicinity of 10% of GDP). They note concerns about a high equity market in Saudi Arabia and attendant risks of a correction. An economic recovery in the UAE was welcome, but by 2014 the “risk of potentially large private credit growth” called for a macroprudential policy response. In Dubai from May 2013 to May 2014, real estate prices evidently rose 27 percent and the DFM stock index by 100 percent.
With the plunge in global oil prices and rise in the dollar after mid-‐2014, the situation reversed yet again. The IMF reports deteriorating external balances in all three countries in 2015 and 2016. The Saudi Arabian Monetary Authority’s reserves fell substantially, while in the UAE “the external position is moderately weaker than the level consistent with medium-‐term fundamentals” as illustrated by a sharp decline in the current account. Real GDP growth and inflation fell in Saudi Arabia. The UAE saw a tightening of monetary conditions and a return of decline in the real estate market. “Price-‐to-‐rent ratios have declined since mid-‐2014 in both metropolitan areas [Dubai and Abu Dhabi].” Persistently lower oil prices “weighed on the outlook…including on asset prices.”
None of the foregoing information regarding the cycles over the last 16 years is surprising. But it is instructive that the more impressionistic language from the IMF confirms the evidence from the unadorned numbers on inflation and reserves: During periods when the currency was undervalued according to the CCB criterion, the disequilibrium shows up with signs of money inflows and overheating of the real economy and asset markets, and vice versa during periods when the currency was overvalued.
(d) Overview of the statistical evidence for GCC countries
Figure 2 summarizes in one graph for these Gulf countries the average relationship between inflation and currency overvaluation as judged by the CCB criterion. The slope of the regression line is negative: inflation tends to fall when the currency appreciates relative to the basket that includes oil along with the dollar and euro, and to rise when the currency appreciates relative to the basket. The negative slope of the regression line is statistically significant at the 10% level. (Qatar in 2003-‐05 and 2009-‐14 is an outlier.)

18
Figure 2: Relationship between inflation and over-‐/under-‐valuation
Note: "Undervaluation (overvaluation)" indicates that the actual value of the currency in terms of SDRs was at least 5% below (above) what the CCB formula with weights 1/3, 1/3/1/3 would have given Data source: Global Financial Data, World Development Indicators
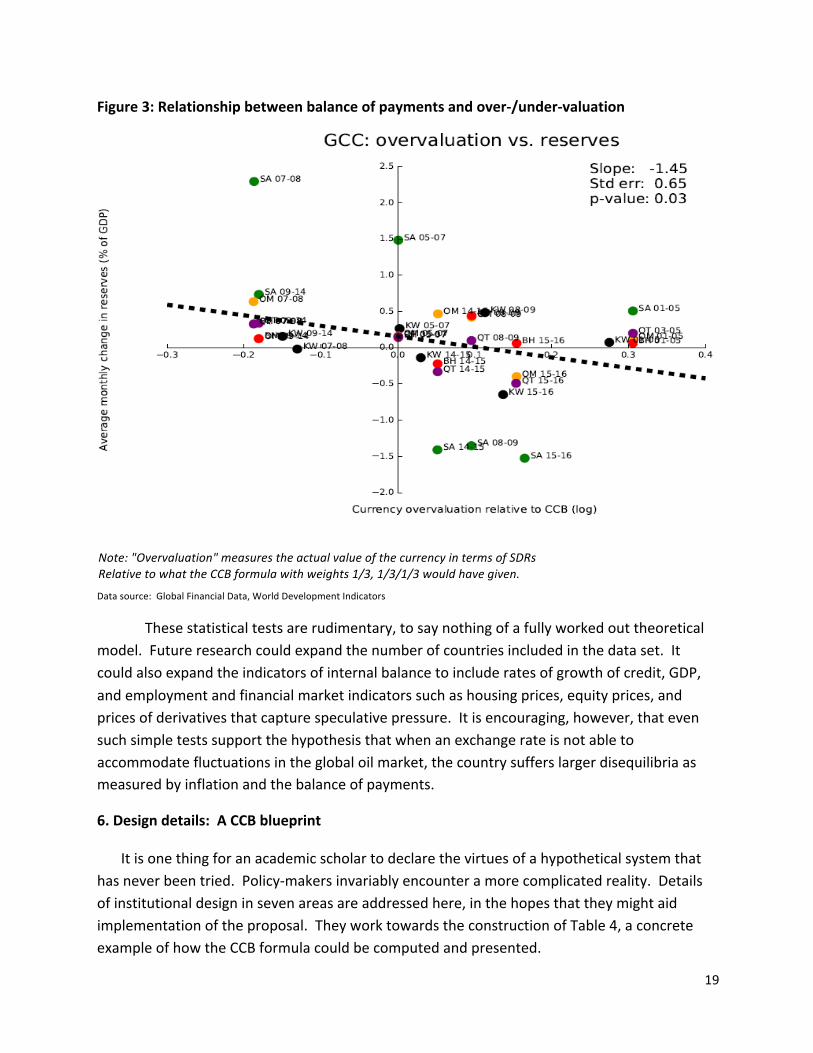
Figure 3 summarizes in one graph for the Gulf countries the relationship between reserve changes and the overvaluation as judged by the CCB criterion. The relationship is again negative: The balance of payments tends to fall when the currency appreciates relative to the basket, and to rise when the currency depreciates relative to the basket. The negative slope of the regression line is now statistically significant at the 5 % level.
19
Figure 3: Relationship between balance of payments and over-‐/under-‐valuation
Note: "Overvaluation" measures the actual value of the currency in terms of SDRs Relative to what the CCB formula with weights 1/3, 1/3/1/3 would have given.
Data source: Global Financial Data, World Development Indicators
These statistical tests are rudimentary, to say nothing of a fully worked out theoretical model. Future research could expand the number of countries included in the data set. It could also expand the indicators of internal balance to include rates of growth of credit, GDP, and employment and financial market indicators such as housing prices, equity prices, and prices of derivatives that capture speculative pressure. It is encouraging, however, that even such simple tests support the hypothesis that when an exchange rate is not able to accommodate fluctuations in the global oil market, the country suffers larger disequilibria as measured by inflation and the balance of payments.
6. Design details: A CCB blueprint
It is one thing for an academic scholar to declare the virtues of a hypothetical system that has never been tried. Policy-‐makers invariably encounter a more complicated reality. Details of institutional design in seven areas are addressed here, in the hopes that they might aid implementation of the proposal. They work towards the construction of Table 4, a concrete example of how the CCB formula could be computed and presented.

20
i. The choice of basket currencies
The first question is what major currencies are to go into the basket. Beyond the dollar, the currencies of others of the most important trading partners are the obvious candidates. When Kazakhstan had an official basket peg (2013-‐14), for example, the constituent currencies included not only the dollar and euro, but also the Russian ruble.
Among governments that declare that the official policy is to follow a basket of currencies, it is common to keep secret the weights on those currencies and even which currencies are on the list. Often in such cases, the actual exchange rate policy -‐-‐ the de facto regime as opposed to de jure -‐-‐is at best a very loose link to the basket. This can be verified by analyzing the exchange rate history econometrically.
Chile in the 1990s is one example of a commodity-‐exporting country that faithfully followed a transparent basket peg with components and coefficients that were publically announced.16 The components and coefficients of the formula must be publically announced and implemented and explained in a readily accessible way on the central bank’s website if the goals of credibility and transparency are to be achieved. This does not preclude periodic revisions in the coefficients or other parameters of the formula, so long as each change is clearly announced and implemented. Chile changed its parameters once a year on average, during the 1980s and 1990s (including not just basket weights but also, initially, a rate of crawl and the width of a band).
Economists have tried various approaches to modeling the optimal currencies for a basket peg and the optimal weights to be placed on them. Major foreign currencies are often allotted basket weights related to their shares of global output or their shares in the home country’s bilateral trade. The dollar often receives disproportionate weight in practice, due to its importance in international financial markets and in the invoicing of oil and other commodities. Governments in practice may also have political goals, wishing to signal or encourage stronger or weaker ties with the United States, the European Union, or other major countries.
The simulations of the CCB exchange rate in this paper include just two currencies in the basket, the dollar and the euro, and assign equal importance to the two, which has the advantage of simplicity and which may be reasonable for countries in the Middle East and North Africa.
ii. The oil price index to be used

21
The oil price measure that enters the formula should be an index that is determined on
liquid world markets daily, easily observed, and exogenous to the domestic economy. Subject to those constraints, it is also desirable that the type of oil that it measures be highly correlated with the type of oil produced by the country in question. The two most important indices are Brent and WTI (West Texas Intermediate). We have chosen to use Brent in this paper. An index like Dubai/Oman is presumably more highly correlated with the output of Gulf countries, but is less exogenous and reflects markets that may be less flexible, transparent and liquid.
iii. The computation and presentation of the coefficients on the major currencies and oil
Further research could attempt to estimate weights on the various major currencies and on the oil price index, according to some criterion. One approach would be to estimate the relative weights according to what maximizes the fit in a regression of a measure of excess demand against undervaluation of the currency (e.g., during the period 2001-‐16) as implied by the difference between the actual exchange rate and the basket. If the measure of excess demand were the inflation rate, the resulting equation could be viewed as a way to implement inflation targeting.
In this paper’s illustrative exercises, we apply the same weight to oil as to the dollar and the euro: 1/3, 1/3, 1/3. Again, this choice has the advantage of simplicity.
One must distinguish between (i) the importance to be assigned to each of the various components (when the euro or oil rises 1% in price, the dollar price of the local currency rises in price by 1/3 of one percent; this is the economically relevant question); and (ii) the absolute coefficient to be assigned to a unit of the component (how many euros and how many barrels of oil are to define one unit of the domestic currency? This way of framing the question is probably the most intuitive for presenting the novel regime to the public).
Whatever the weights, it is suggested that in actual implementation the central bank should use an easily understood formula that expresses each day’s currency value as a linear function of the values of that day’s dollar, euro and barrel of oil. For full transparency and verifiability, the central bank would publish on its website the formula’s coefficients, and show how they have been computed from the weights. For example, assume that on the day when the weights are calculated, the dollar and euro are of equal value and that the price of oil is $50 a barrel. Then the weights of 1/3, 1/3, 1/3 on that day translate into relative coefficients of 1 dollar plus 1 euro plus 1/50th of a barrel of oil. The public can be encouraged to envision a literal basket that contains one dollar bill, one euro note, and one-‐fiftieth of a barrel of oil.17 If the yen were to be added to basket, a ¼ share in importance would translate into about 25 yen

22
(because the recent exchange rate has been about 100 yen to the dollar).
iv. The frequency with which the coefficients would be revised.
The coefficients could and should be revised occasionally, but in a transparent way. Ideally this would happen once a year, say on January 1. [Normally they would be adjusted in such a way that, whatever the new relative weights of the currency plus commodity components, there would be no jump in the absolute value of the currency on that day.]
There are two reasons why the coefficients in the formula might be adjusted. The purely technical reason is that, even if there is no desire to change weights that capture the relative importance of the components (say, still 1/3, 1/3, 1/3) the dollar/euro exchange rate and the dollar price of oil are likely to have evolved over the year. If, for example, the price of oil has risen from $50 a barrel to $60 a barrel, then the coefficient that has been used in the formula now translates into a weight that is 20% higher than the desired 1/3. The coefficients need to be adjusted correspondingly, to return the weights back to their desired levels. (There is an analogy with periodic rebalancing of an investment portfolio to keep desired weights.)
Secondly, the authorities may wish to adjust the weights themselves. If one trading partner or another, or oil itself, has grown or fallen in importance to the national economy, or if the authorities decide that they want to encourage movement in that direction, then they can adjust the weights and hence the formulas. There need no loss of credibility or consistency, if they remain within the same CCB framework.
v. Would the announcement of the new regime include an immediate discrete devaluation to correct an existing overvaluation (or revaluation to correct an existing undervaluation) on the one hand, or maintain continuity with the current exchange rate on the other hand?
If a country is eventually going to leave a simple dollar peg for a more flexible exchange rate arrangement, it is best to do so in “good times”, rather than waiting until the currency comes under severe downward pressure so that the change in regime takes the form of a large devaluation under circumstances of lost reserves, mismatched balance sheets, lost credibility.18 Often, however, it is not until a time of crisis that changes in monetary regime are seriously contemplated. Examples are oil-‐exporters who resisted depreciation of their currencies when oil prices fell in 2014-‐15, clinging to their exchange rate targets until faced with crisis circumstances (Azerbaijan, Kazakhstan, Nigeria, Algeria, and Venezuela). When reserves run short, devaluation is usually unavoidable.

23
The Currencies-‐Plus-‐Commodity Basket proposal can still be implemented together with a devaluation (or revaluation upward). Mechanically in Table 4, in place of row 4 (which shows the current exchange rate at the time of CCB implementation, a new row 4d can be inserted showing the desired new exchange rate, e.g., a 10% fall (or increase) in the dollar value of the domestic currency. The absolute coefficients on each basket component in row 5 are then computed as the relative coefficient weight from row 3 multiplied by the new exchange rate in row 4d.
A country that has been repeatedly forced by economic developments to abandon declared exchange rate targets, and thus needs to salvage some credibility after a new devaluation, might be able to make a virtue out of necessity. Kazakhstan’s devaluation of the tenge on August 20, 2015, for example, followed earlier regime abandonments that had been forced by declines in the price of oil and in the foreign exchange value of the Russian ruble. The Kazakh authorities could have announced a CCB regime at the time of the 2015 devaluation and explained that they were now formalizing the determinants that had been driving the exchange rate all along. They could even have chosen parameters (weights on the dollar, euro, ruble and oil, plus a possible rate of crawl) so that the CCB formula roughly fit some segment of past history of the actual exchange rate. If the actual exchange is judged to have been in equilibrium at various points in the past, even if the equilibria were arrived at only late and painfully, choosing the coefficients to fit the past history might be better than an arbitrary choice like 1/3-‐1/3-‐1/3.
vi. Should a trend be included in the formula, to allow the regime to be consistent with inflation targeting in the longer term?
Exchange rate crawls were especially popular in the 1980s and 1990s, when inflation rates were quite high in most developing countries and the authorities wanted to offset what would otherwise be a steady loss of price competitiveness on international markets. It has not been uncommon to combine a rate of crawl in the exchange rate together with a basket.19 Even today, it might make sense to add a trend parameter to the formula, the value of which could be adjusted periodically just like the coefficients. The trend allows the CCB system to be consistent with inflation targeting. If the inflation target in the coming year is the same as the expected inflation rate among major trading partners, say 2% a year, then the trend can be set equal to zero. But a country may want to set a higher trend. If, for example, its inertial inflation rate has been recently running 8 per cent a year and it wants to gradually bring it down to 2%, it could add to the formula a trend of 6% in the first year, 5% in the second, and so forth until in the seventh year the trend is set to zero. Or it may choose even in the long run to
24
allow a positive trend if there is believed to be a need for steady-‐state real appreciation due, for example, to rapid productivity growth and the Balassa Samuelson effect.
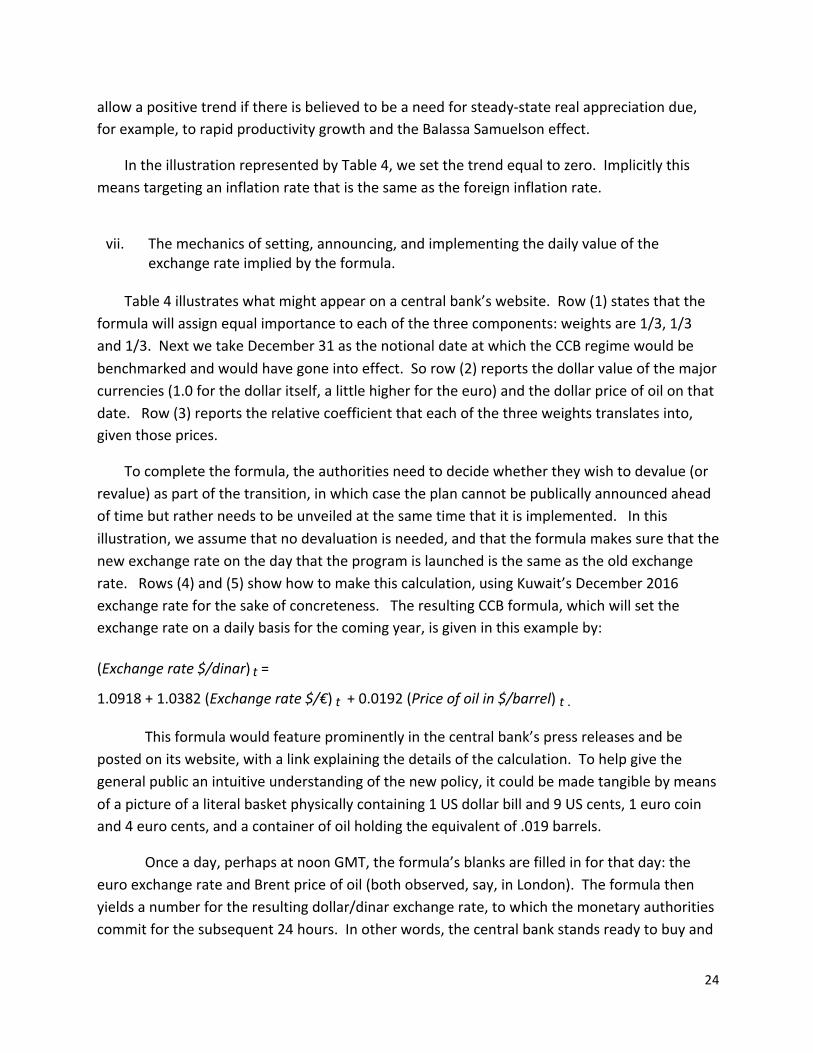
In the illustration represented by Table 4, we set the trend equal to zero. Implicitly this means targeting an inflation rate that is the same as the foreign inflation rate.
vii. The mechanics of setting, announcing, and implementing the daily value of the exchange rate implied by the formula.
Table 4 illustrates what might appear on a central bank’s website. Row (1) states that the formula will assign equal importance to each of the three components: weights are 1/3, 1/3 and 1/3. Next we take December 31 as the notional date at which the CCB regime would be benchmarked and would have gone into effect. So row (2) reports the dollar value of the major currencies (1.0 for the dollar itself, a little higher for the euro) and the dollar price of oil on that date. Row (3) reports the relative coefficient that each of the three weights translates into, given those prices.
To complete the formula, the authorities need to decide whether they wish to devalue (or revalue) as part of the transition, in which case the plan cannot be publically announced ahead of time but rather needs to be unveiled at the same time that it is implemented. In this illustration, we assume that no devaluation is needed, and that the formula makes sure that the new exchange rate on the day that the program is launched is the same as the old exchange rate. Rows (4) and (5) show how to make this calculation, using Kuwait’s December 2016 exchange rate for the sake of concreteness. The resulting CCB formula, which will set the exchange rate on a daily basis for the coming year, is given in this example by:
(Exchange rate $/dinar) t =
1.0918 + 1.0382 (Exchange rate $/€) t + 0.0192 (Price of oil in $/barrel) t .
This formula would feature prominently in the central bank’s press releases and be posted on its website, with a link explaining the details of the calculation. To help give the general public an intuitive understanding of the new policy, it could be made tangible by means of a picture of a literal basket physically containing 1 US dollar bill and 9 US cents, 1 euro coin and 4 euro cents, and a container of oil holding the equivalent of .019 barrels.
Once a day, perhaps at noon GMT, the formula’s blanks are filled in for that day: the euro exchange rate and Brent price of oil (both observed, say, in London). The formula then yields a number for the resulting dollar/dinar exchange rate, to which the monetary authorities commit for the subsequent 24 hours. In other words, the central bank stands ready to buy and

25
sell dinars in exchange for foreign exchange at that price. A variant could be to proclaim a band around the price, perhaps a band of plus or minus 1%.
The hypothetical example illustrated for the case of Kuwait in rows (4)-‐(7) shows what would have happened if the new CCB regime had been implemented on December 31, 2016. We assume no need for realignment on that day, so the exchange rate begins at $3.2755 per dinar. What would the formula dictate for the exchange rate on March 1? The euro appreciated by more than 3 per cent during January-‐February (from $1.052 to 1.088). The price of oil fell, but only by about 2% (from $ 56.82 a barrel to $55.72). As a result, the CCB formula would have produced an exchange rate on March 1 of $ 3.292, about 0.5 percent stronger than it was at the end of 2016.
The authorities should be prepared with enough reserves to intervene heavily, if necessary, to keep the market rate at the announced rate. Intervention could continue to be carried out in dollars or whatever mix of international currency the authorities are already comfortable with. But if the initial level is not overvalued or undervalued, there is no reason why heavy intervention should in fact be needed. Indeed, after a few days, it is likely that banks and other foreign exchange traders would become sufficiently familiar with the system that they would not challenge the rate.

26
Table 4: Example of how CCB formula could be computed and presented
Date on which determined US dollar euro
Barrel of oil
(Brent)
Value of local
currency
1. Weights 1-‐Jul-‐16 0.3333 0.3333 0.3333 1
2. Value of unit in dollars on benchmark day Dec. 31, 2016 1 $1.0517 56.8200
3. Relative coefficient in basket formula = (1)/(2)
For daily setting of the $ exchange rate during
the coming year 0.3333 $0.3169 0.0059
4. To take the example of Kuwait, $ value of dinar on benchmark date
Dec. 31, 2016
$3.2755
5. Absolute coefficient in basket formula, assuming no discrete devaluation or revaluation at date of implementation = (3)*(4)
Dec. 31, 2016 1.0918 1.0382 0.0192
6. Check value of formula on benchmark day (i) observed rates = (2)
Dec. 31, 2016 1 1.0517 56.82
(ii) exchange rate on benchmark day implied by basket formula = (5)*(6), then summed.
$1.092 $1.092 $1.092 $3.276
7. Example i) observed rates at time t, e.g., t = March 1, 2017 $1.000 $1.088 $55.720 $3.282
ii) exchange rate at time t implied by basket formula = (5)*(7), then summed
t = March 1, 2017 $1.092 $1.129 $1.071 $3.292

27
References
Abed G., S. Nuri Erbas, B. Guerami, 2003, “The GCC Monetary Union: Some Consideration for the Exchange Rate Regime,” IMF Working Paper, April.
Aguiar, Mark, and Gita Gopinath, 2007, "Emerging Market Business Cycles: The Cycle is the Trend," Journal of Political Economy 115(1): 69-‐102. Aleisa, Eisa A., and Sel Dibooĝlu, 2002, "Sources of real exchange rate movements in Saudi Arabia," Journal of Economics and Finance 26.1: 101-‐110. Aleisa, E., S. Hammoudeh, and Y.Yuan, 2008, “External and Regional Shocks in the GCC Region: Implications for a Common Exchange Rate Regime,” Economic Research Forum Working Paper No. 426 (Cairo).
Al-‐Hamidy, Abdulrahman A., and Ahmed Banafe, 2013, “Foreign Exchange intervention in Saudi Arabia,” in Market volatility and foreign exchange intervention in EMEs: what has changed? BIS Papers No 73 (Bank for International Settlements: Basel), pp. 301-‐306
Alkhareif, Ryadh M., and John H. Qualls, 2016, “Saudi Arabia's Exchange Rate Policy: Its Impact on Historical Economic Performance,” SAMA Working Paper 16/4 (Riyadh: Saudi Arabian Monetary Authority), April.
Broda, Christian, 2004, "Terms of Trade and Exchange Rate Regimes in Developing Countries," Journal of International Economics, 63(1), pp. 31-‐58.
Buiter, Willem H., 2008, "Economic, Political, and Institutional Prerequisites for Monetary Union among the Members of the Gulf Cooperation Council," Open Economies Review 19.5: 579-‐612.
Cashin, Paul, Luis F. Céspedes, and Ratna Sahay, 2004, "Commodity Currencies and the Real Exchange Rate," Journal of Development Economics 75, no.1: 239-‐268.
Céspedes, Luis Felipe, and Andrés Velasco, 2012,"Macroeconomic Performance during Commodity Price Booms and Busts," IMF Economic Review 60, no.4: 570-‐599.
Chen, Yu-‐chin, and Kenneth Rogoff, 2003, "Commodity Currencies," Journal of International Economics 60, no.1: 133-‐160.
Corden, W. Max, 1960, "The Geometric Representation of Policies to Attain Internal and External Balance," The Review of Economic Studies 28.1: 1-‐22.

28
Edwards, Sebastian, and Eduardo Levy Yeyati, 2005, “Flexible Exchange Rates as Shock Absorbers,” European Economic Review, Vol. 49, Issue 8, November, pp. 2079-‐05.
Eichengreen, Barry, R.B. Johnston, Paul Masson, Esteban Jadresic, Hugh Bredenkamp, Javier Hamann, and Inci Ötker, Exit Strategies: Policy Options for Countries Seeking Exchange Rate Flexibility, Occasional Paper No. 168, International Monetary Fund).
Fraga, Arminio, Ilan Goldfajn, and André Minella, 2003, “Inflation Targeting in Emerging Market Economies,” NBER Macro Annual 2003, Ken Rogoff and Mark Gertler, eds. (MIT Press: Cambridge).
Frankel, Jeffrey, 2002, "A Proposed Monetary Regime for Small Commodity-‐Exporters: Peg the Export Price (‘PEP’)," International Finance (Blackwill Publishers), no.1, spring 2003, 61-‐88.
-‐-‐-‐ 2003a "A Crude Peg for the Iraqi Dinar," Financial Times, June 13.
-‐-‐-‐ 2003b, "Iraq’s Currency Solution? Tie the Dinar to Oil," The International Economy, Fall.
-‐-‐-‐ 2005, “Peg the Export Price Index: A Proposed Monetary Regime for Small Countries,” in Journal of Policy Modeling, June. HKS RWP03-‐003.
-‐-‐-‐, 2005b, “Contractionary Currency Crashes in Developing Countries,” IMF Staff Papers, 52, no. 2, 149-‐192.
-‐-‐-‐, 2007, “On the Rand: Determinants of the South African Exchange Rate,” South African Journal of Economics, vol.75, no.3, September, 425-‐441.
-‐-‐-‐ 2008, "UAE & Other Gulf Countries Urged to Switch Currency Peg from the Dollar to a Basket That Includes Oil," VoxEU, 9 July.
-‐-‐-‐ 2011a, A Comparison of Monetary Anchor Options, Including Product Price Targeting, for Commodity-‐Exporters in Latin America," Economic, vol.12, no.1, (Brookings): 1-‐57. CID WP 225, 2011. NBER WP 16362, 2010.
-‐-‐-‐ , 2011b,“How Can Commodity Exporters Make Fiscal and Monetary Policy Less Procyclical?” Beyond the Curse: Policies to Harness the Power of Natural Resources, R.Arezki, T.Gylfason & A.Sy, eds. (IMF). HKS RWP 11-‐015. Keynote address, High Level Seminar, Central Bank of Algeria, Algiers.
-‐-‐-‐ , 2011c ,"The Curse: Why Natural Resources Are Not Always a Good Thing,” Milken Institute Review, vol.13, no.4, 4th quarter: 28-‐39.
-‐-‐-‐ 2011d, "Barrels, Bushels and Bonds: How Commodity Exporters Can Hedge Volatility," Project Syndicate, October 17.
29
-‐-‐-‐, 2011e, “Escaping the Oil Curse,” Project Syndicate, Dec. 9.
-‐-‐-‐ 2012a, “The Natural Resource Curse: A Survey,” Chapter 2 in Beyond the Resource Curse, edited by Brenda Shaffer and Taleh Ziyadov (University of Pennsylvania Press). NBER WP 15836; HKS RWP10-‐005.
-‐-‐-‐ 2012b, "Product Price Targeting -‐-‐ A New Improved Way of Inflation Targeting," in MAS Monetary Review, pp.2-‐5. And Macroeconomic Review, Vol.XI, issue 1, April 2012 (Monetary Authority of Singapore), 78-‐81.
-‐-‐-‐ 2012c, “The Natural Resource Curse: A Survey of Diagnoses and Some Prescriptions,” in Commodity Price Volatility and Inclusive Growth in Low-‐Income Countries,, edited by Rabah Arezki, Catherine Patillo, Marc Quintyn & Min Zhu (International Monetary Fund: Washington DC). HKS RWP12-‐014. CID WP 233 April 2012.
-‐-‐-‐ 2014, Nominal GDP Targeting for Middle-‐Income Countries, Central Bank Review (Ankara, Turkey); 14, 3: 1-‐14.
-‐-‐-‐ 2016, “How to Cope with Volatile Commodity Export Prices: Four Proposals,” High Level Seminar, Natural Resources, Finance & Growth, sponsored by Bank of Algeria, Algiers, May 28-‐29. Forthcoming in a proceedings volume edited by Rabah Arezki and Raouf Boucekkine.
Frankel, Jeffrey, Sergio Schmukler, and Luis Servén, 2000, ”Verifiability and the Vanishing Intermediate Exchange Rate Regime,” Brookings Trade Forum 2000, edited by Susan Collins and Dani Rodrik; Brookings Institution, Washington DC.
Frankel, Jeffrey, Eduardo Fajnzylber, Sergio Schmukler, and Luis Servén, 2001, "Verifying Exchange Rate Regimes,” Journal of Development Economics, vol. 66, no. 2, 351-‐386.
Frankel, Jeffrey, and Ayako Saiki, 2002, "A Proposal to Anchor Monetary Policy by the Price of the Export Commodity," Journal of Economic Integration, September, Vol.17, No.3, 417-‐448.
Habib, Maurizio Michael, and Margarita M. Kalamova, 2007, "Are There Oil Currencies? The Real Exchange Rate of Oil Exporting Countries," BIS Working Paper 839, December.
Habib, Maurizio M., Jan Stráský, 2008, “Oil Exporters in Search of an External Anchor,” European Central Bank, Working Paper Series, N. 958, November https://papers.ssrn.com/sol3/papers.cfm?abstract_id=1291166 Hebous, Shafik, 2006. “On the Monetary Union of the Gulf States,” The Kiel Institute for the World Economy.

30
International Monetary Fund, Article IV Consultation Reports for Bahrain, Kuwait, Oman, Qater, Saudi Arabia, and United Arab Emirates, 2002-‐2016. Kaminsky, Graciela L., Carmen M. Reinhart, and Carlos A. Végh, 2005, "When It Rains It Pours: Procyclical Capital Flows and Macroeconomic Policies," NBER Macroeconomics Annual 2004, Volume 19 (MIT Press): 11-‐82. Laabas, Belkacem, and Imed Limam, 2002, "Are GCC Countries Ready for Currency Union?" Arab Planning Institute, April. Marzovilla, Olga, and Marco Mele, 2010, “From Dollar Peg to Basket Peg: The Experience of Kuwait in View of the GCC Monetary Unification,” Munich Personal RePEc Archiv, April. https://mpra.ub.uni-‐muenchen.de/22484/3/MPRA_paper_22484.pdf
Meade, James E., 1951, The Balance of Payments (Oxford University Press: London and New York).
Mendoza, Enrique G., 1997, "Terms-‐of-‐trade Uncertainty and Economic Growth," Journal of Development Economics 54.2: 323-‐356. Merza, Ebrahim, and Hanas Cader, 2009, "Determining the Exchange Rate of the Common GCC Currency under a Fixed Exchange Rate Regime," International Review of Business Research Papers 5.4: 192-‐199.
Rafiq, M. Sohrab, 2011, "Sources of Economic Fluctuations in Oil-‐exporting Economies: Implications for Choice of Exchange Rate Regimes," International Journal of Finance & Economics 16, no.1: 70-‐91.
Rutledge, Emilie, 2008, Monetary Union in the Gulf: Prospects for a Single Currency in the Arabian peninsula (Routledge).
Salter, Wilfred, 1959 "Internal and External Balance: The Role of Price and Expenditure Effects." Economic Record 35.71: 226-‐238.
Swan, Trevor W., 1963, "Longer-‐run Problems of the Balance of Payments," The Australian Economy: A volume of readings 384-‐95.
Williamson, John, 2001, “The Case for a Basket, Band and Crawl (BBC) Regime for East Asia,” in D. Gruen & J. Simon, eds., Future Directions for Monetary Policies in East Asia (Reserve Bank of Australia), 97-‐109.

31
Appendix: Selected quotes regarding internal and external balance from IMF Article IV reports. [A more extensive version of this table, including more excerpts and also Bahrain, Oman and Qatar, is available in on electronic appendix.]
Period (classified by currency valuation)
Kuwait
Saudi Arabia
UAE
2001 to 2004: Over-‐valued by CCB criterion
2002: "noninflationary environment." 2003: "low inflation." 2003: "The net foreign assets of the Central Bank of Kuwait (CBK) fell to the equivalent of about eight months of imports in 2002...."
2002: "in 2001 [inflation] remained negative." 2002: "...absence of inflationary pressures..." 2003: "Inflation [in 2002], however, remained negative and involuntary unemployment stood at about 9 percent." 2003: "Saudi Arabian Monetary Agency's (SAMA) net foreign assets fell to the equivalent of nine months of prospective imports of goods and services due to larger private capital outflows."
2003: "Inflation is projected to trend downward to about 2 percent..." 2003: " Inflation is estimated at about 2.8 percent in 2003..." 2003: "...low inflation..."
2007 to mid-‐2008: Under-‐valued by CCB criterion
2008: "Inflation has been gradually picking up, reaching 7 percent y/y in October 2007, driven both by domestic demand pressures (especially rents) and higher import prices (mostly food). Asset prices surged, with a 25 percent increase of the Kuwait Stock Exchange (KSE) index during 2007 and even higher increases in real estate prices." 2008: "Rising oil wealth has boosted demand, including for nontradable items and expatriate labor, pushing up prices for housing, communication, and other services as well as asset prices (notably real estate)." 2008: "While there is no generally accepted methodology to assess the level of the exchange rate for oil exporters, it seems reasonable to assume that the large positive terms-‐of-‐trade (TOT) shock during 2003–07 appreciated the equilibrium real effective exchange rate (ERER). This is consistent with staff estimates using CGER-‐type equilibrium exchange rate and macroeconomic balance approaches (see Box 3). Either approach suggests that a moderate undervaluation was caused by the oil price shock, but has been absorbed already or will disappear in the near future. The authorities view both assessment methodologies as ill-‐suited for oil economies..."
2008: "Inflation accelerated during 2007 and reached a historical high of 10.5 percent year-‐on-‐year in April 2008 driven by domestic demand pressures (especially rents) and higher import prices (mostly food)." 2008: "The surplus was used to build up the net foreign assets (NFA) of the central bank US$301 billion (19 months of imports)." 2008: "Monetary policy was accommoda-‐tive, given the peg to the U.S. dollar, and despite efforts to sterilize the build up in NFA. Broad money grew by 20 percent in 2007, similar to 2006, but private sector credit growth more than doubled to 21.4 percent. The central bank sought to contain the expansion in monetary aggregates by raising reserve requirements in late 2007 and early 2008. Speculation for a revaluation of the riyal emerged in 2007 and was reflected in forward premia in offshore futures markets." 2008: "Anecdotal evidence suggests that real estate prices increased by double digits in 2007." 2008: "Inflation is projected to peak around 10.6 percent in 2008..." 2008: "...inflation...has accelerated recently, and poses the main challenge for the authorities...." 2008: "In view of the limitations imposed on interest rate policy by the currency peg, fiscal restraint will be critical. " 2009: "Monetary policy contended with rising inflation in the first half of 2008..."
2008: "The Authorities: Agreed that the dirham might be moderately undervalued...[but]…" 2008: "Inflation has steadily accelerated since 2004 and is projected to reach 12.7 percent in 2008, reflecting housing shortages, imported inflation, U.S. dollar depreciation, and strong domestic demand fuelled also by the expansionary monetary policy imported from the United States through the dollar peg." 2008: "Credit to the private sector rose by 51 percent (y-‐o-‐y) in September 2008, up from 40 percent in December 2007, driven by the economic boom and highly negative real interest rates. Credit was financed by strong deposit growth, but in 2007 also by large foreign borrowing." "...continued housing shortages....[I]nvestors were often seeking to make capital gains..." 2008: "Strong growth, investment, and job-‐creation...[E]xternal current account surpluses remain large." " ... vulnerable in the wake of an unprecedented credit and asset price boom." 2008: "...inflation still high...."

32
Mid-‐2008 to 2009: Over-‐valued by CCB criterion
2010: "Lower domestic demand and a 12 percent drop in import prices reduced average consumer price inflation to 4 percent [in 2009]. Equity prices continued to decline, money growth slowed, and credit growth plunged on account of lower demand and higher risk aversion by banks."
2009: " Inflation...subsided to 5.2 percent y/y in April 2009 owing to weaker demand and lower import prices." 2009: "Directors noted the staff’s view that the likely undervaluation of the Saudi riyal in 2008 was temporary and expected to close over the medium term. Some Directors encouraged the authorities to consider a more flexible exchange rate regime for the Gulf Cooperation Council (GCC) monetary union, in consultation with other members of the union. " 2010: "Inflation [in 2009] fell substantially from its peak in 2008 (11.1 percent)...."
2009: "Signs of a slowdown were already emerging in Dubai from the bursting of the property bubble in 2008. 2009: "The global recession, the bursting of the Dubai property bubble, and the post-‐Lehman shutdown of international capital markets hit simultaneously all of the U.A.E.’s three growth engines in 2009. Oil receipts plummeted, global trade and logistics contracted, and property development all but ground to a halt as incomes fell and property prices plunged. A second bout of disruption arose when the government of Dubai announced in late November 2009 that DW would seek a six-‐month standstill on repayments...." 2009: "After peaking at about 12 percent in 2008, inflation declined to 1 percent in 2009, reflecting lower import prices (-‐10 percent in 2009) and a reduction in rents..." 2009: "The external current account balance is estimated to have shifted to a deficit of 2.7 percent of GDP in 2009, the first deficit in decades....[H]ydro-‐carbon export revenues dropped by about 45 percent in 2009...."
2010-‐2014:
Under-‐valued by CCB criterion
2011: "Headline inflation increased in 2010..." 2011: "Inflation is projected to pick up in 2011."
2011: "Headline inflation increased in 2010..." 2011: "Inflation risks have risen due to both external and domestic factors." The exchange rate peg limits the policy tools available to SAMA to contain inflation..." 2014: "Rising oil prices and production have resulted in large external and fiscal surpluses." 2014: "The equity market has risen strongly over the past year, and may continue to rise in the period ahead given the still abundant liquidity in the domestic economy. While this would positively impact growth in the near-‐term, the risks of a later correction would increase. Even current equity valuations appear somewhat on the rich side..."
2011: "Benefiting from higher oil prices …, real GDP grew by an estimated 3.2 percent in 2010." 2011: "High oil prices, stronger growth in Asia, and low global interest rates are contributing to the recovery. ...[R]eal GDP is projected to continue to grow at 3.3 percent in 2011..[T]he CPI inflation rate is expected to rise..." 2012: "The large property overhang continues to be a drag on the economy." 2012: "Supported by high oil prices, the external current account surplus is projected to further increase to 10.3 percent of GDP." 2014: "… the risk of potentially large private credit growth, and could be supported by macroprudential tightening should deposit and credit growth accelerate further." 2014: "Further measures, such as setting higher fees for reselling properties within a short time, and restrictions on reselling off-‐plan properties, are warranted, particularly if rapid price increases continue. These measures could be supported by targeted macroprudential tightening in case real estate lending picks up further." 2014: "The real estate sector has been recovering quickly in some segments, especially in the Dubai residential market. …[S]ales prices …increased 27 percent year-‐over-‐ year in May 2014.” 2014: "The Dubai Financial Market (DFM) stock index rose by 100 percent year-‐over-‐year in May 2014… Credit default swap spreads have further tightened. Foreign capital flows, particularly to domestic banks, have risen." 2014: "An improving global economy and strengthening domestic confidence, associated with a rebounding real estate market, recently announced megaprojects, and the Expo 2020, also support nonhydrocarbon growth…. Inflation is expected to increase, driven by higher rents." 2014: "The strengthening real estate cycle, particularly in the Dubai residential market, could attract increased—and potentially destabilizing—speculative demand, creating the risk of unsustainable price dynamics and an eventual, potentially disruptive correction. An acceleration

33
of the Dubai megaprojects… could exacerbate this risk. Moreover, the projects could weaken Dubai’s still substantially indebted GREs...With rent controls recently relaxed, rising real estate prices may also feed more strongly into inflation." 2014: "Further policy action is needed to address potential risks from the real estate market, particularly in case of continued rapid house price increases. The situation in the real estate market is different from 2008 in that price increases still partially reflect a recovery from the post-‐ crisis trough and demand (stemming to a large extent from foreign buyers) is significantly less bank-‐ financed. Nonetheless, by some measures, nominal residential real estate prices in Dubai have already reached their 2008 peak. The rapid pace of price increases, if continued, could trigger an intensification of destabilizing speculative demand, and thus warrants close monitoring. " 2014: "…[H]eadline inflation started to increase moderately. The current account and fiscal surpluses continue to be sizable owing to high hydrocarbon prices." 2015: "Lower oil prices are eroding long-‐standing fiscal and external surpluses…. Real estate prices have declined somewhat since mid-‐201,…."

34
Mid-‐2014 – 2016: Over-‐valued by CCB criterion
2015: "The fiscal and external positions are projected to deteriorate further in 2015 and 2016..."
2015: "Real GDP growth has slowed since 2014 and inflation has eased. Following a strong start, real GDP growth slowed during the course of 2014, reflecting a decline in oil production and weakening non-‐oil output growth...remained much weaker than the 6.4 percent growth in 2014Q1. Inflation was 2.2 percent in June 2015..., with the decline largely due to global food price trends and the effective appreciation of the exchange rate." 2015: "The appreciation of the U.S. dollar will impact the real effective exchange rate, making imported goods cheaper...." 2016: "The decline in oil prices is expected to dampen growth this year." 2016: "SAMA’s NFA are expected to fall substantially further in 2016..." 2016: "...slowing growth over the year..."
2015: "Lower oil prices and the appreciation of the effective exchange rate are weighing on the macro-‐economic outlook and credit risks and have led to a tightening of monetary and financial conditions." 2015: "Real estate prices have edged down since mid-‐2014... reflecting ...slowing demand stemming from lower oil prices, U.S. dollar appreciation, and structural measures ... Following Dubai, house price growth has also started to decline in Abu Dhabi." 2015: "…Dubai’s sales’ prices are expected to further decline over the course of the year...Price-‐to-‐rent ratios have declined since mid-‐2014 in both metropolitan areas..." 2016: "... the sharp fall in oil prices and revenues, followed by sizable fiscal consolidation and, to a lesser extent, the appreciation of the real effective exchange rate have dampened non-‐oil growth and increased credit risk....contributed to liquidity pressures and tightening of monetary and financial conditions, which could be an additional drag on economic activity." 2016: "The slowdown in 2015 was driven by ...lower contribution from domestic private demand as business and consumer confidence weakened and credit to the private sector slowed. Inflation has eased to 1.4 percent year-‐over-‐year by end-‐March 2016." 2016: "The current account surplus declined sharply in 2015 to 3.3 percent of GDP from 10 percent in 2014..." 2014: "… Dubai’s real estate average residential prices falling by 11 percent in 2015..." 2016: "Persistently lower oil prices... have weighed on the outlook...including on asset prices." 2016: "Inflation is projected to decline to 3.3 percent in 2016." 2016: "[W]ith the continued appreciation of the real effective exchange rate while terms of trade have deteriorated, the external position is moderately weaker than the level consistent with medium-‐term fundamentals, as illustrated by the estimated current account gap..."
End-‐notes
1 Mendoza (1997) is an example of a model in which terms of trade uncertainty per se is bad for economic growth. Frankel (2012c) surveys the “natural resource curse” more generally.
2 Heads of state are twice as likely to lose office in the six months following a large sudden devaluation than in normal times. The odds are even higher for central bank governors and finance ministers. This is especially true if the official in question had previously promised not to devalue. But even controlling

35
for broken promises, much of the effect is due to other causes, such as the adverse balance sheet effect that comes from the combination of devaluation and currency mismatch. Frankel (2005b). 3 Among those who find that countries are not suited to floating exchange rates until they have achieved a certain standard of development are Aghion, Bacchetta, Ranciere and Rogoff (2005) and Husain, Mody and Rogoff (2005). 4 The Fed and some other of the most important central banks may have, for the time being, given up on the attempt to communicate monetary policy intentions in terms of a single variable such as the money supply or inflation rate even via forward guidance, let alone an explicit target. The presumption is still in favor of transparency and simple clear communication, however. Many still feel the need to announce a specific target or anchor. Most developing countries, in particular, need the reinforcement to credibility (Fraga, Goldfajn, and Minella, 2003). Monetary policy-‐makers in emerging market and developing countries often have more need for credibility than those in advanced countries due to high-‐inflation histories, absence of credible institutions, or political pressure to monetize big budget deficits. But one would think that announcing a target that one can expect often to miss (such as the money supply or the CPI) does little to enhance credibility.
5 Céspedes and Velasco (2012), for example, examine across 107 major country commodity boom-‐bust cycles, and find that the output loss from a given price decline is smaller, the more flexible is the exchange rate .
6 In the face of an adverse shift in the terms of trade, a target for the CPI, or even a target for core CPI, would not allow an accommodating depreciation, because that would raise the domestic-‐currency price of imports, and thereby exacerbate the change in the terms of trade. This assumes a narrow definition of targeting inflation, as opposed to the malleable notion of “Flexible Inflation Targeting.” 7 Frankel (2002; 2003b, c; 2008; 2011e) and Frankel and Saiki (2002). 8 Frankel (2005). 9 Frankel (2011a, b; 2011b). 10 Frankel (2014). 11 The high weight assigned to the dollar, well beyond the US share of Kuwait’s trade, may be an attempt to accommodate the importance of oil. If so, it is a very limited means of achieving this end. Even though oil sales are usually denominated, invoiced and settled in dollars, the dollar price of oil tends to fall quickly in response to an appreciation of the dollar. (The 2014-‐16 appreciation of the dollar was one reason that the dollar price of oil fell sharply during this period.) 12 If plans to form a common monetary union among the GCC countries were to go ahead, that would of course require a single decision for all members regarding exchange rate arrangements vis-‐à-‐vis the rest of the world, whether it is a dollar peg, basket peg, float, or something else (Merza and Cader, 2009). GCC currency union plans appear to be in deep freeze for now. So this paper will treat the regime
36
choices of Gulf countries as independent of each other. (Studies of the proposed GCC monetary union include Buiter, 2008; Hebous, 2006; Laabas and Limam, 2002; and Rutledge, 2008.) But if the plans were revived, the CCB proposal would apply as strongly to the group as a whole as to the individual members. Indeed, it would apply more strongly: the optimum currency area theory teaches us that the need for some flexibility in the external exchange rate rises, as the economic size of the geographical entity grows. There might also be political support for a move away from the dollar. 13 E.g., Kaminsky, Reinhart and Végh (2005). Aguiar and Gopinath (2007) argue that the apparent pro-cyclicality of capital flows to emerging markets is essentially an illusion.
14 In those models, a productivity shock or terms of trade shock will show up in the nominal exchange rate under floating or in the price level if the nominal exchange rate is fixed. Aleisa and Dibooĝlu (2002) is an application to Saudi Arabia. 15 The language of internal and external balance, as the two main goals of macroeconomic stabilization policy, goes back to Meade (1951). The framework was later developed, especially graphically, in the context of a small open economy (i.e., one in which the prices of exportables and importables are taken as given on world markets, but in which non-‐tradable goods are not exposed to foreign competition) by Corden (1960), Salter (1959) and Swan (1963).
16 Frankel, Schmukler, and Servén (2000), and Frankel, Fajnzylber, Schmukler, and Servén (2001). Chile subsequently moved to a floating exchange rate regime which was able to accommodate big fluctuations in the global price of copper.
17 We are following the American convention of measuring oil in barrels, usually defined as 42 US gallons. But of course any country could choose cubic meters or whatever familiar unit of oil it wished. 18 The question of timing regarding a shift from peg to a more flexible exchange rate regime is the question of exit strategy (Eichengreen, et al, 1998). Examples of countries that exited from an exchange rate target when there was still a health two-‐way supply and demand for their currencies include Australia, Chile and Colombia. 19 When combined as well with a target zone around the central parity, the regime is called a Band-‐Basket-‐Crawl (Williamson, 2001). This was also Chile’s arrangement in the 1990s.