the connected bus: connected and sustainable … pilot results introduction the connected bus is a...
TRANSCRIPT
Pilot Results
The Connected Bus: Connected and Sustainable Mobility Pilot
A partnership between the City and County of San Francisco and Cisco
Authors
Shane Mitchell Wolfgang Wagener
Cisco Internet Business Solutions Group
1
Pilot Results
IntroductionThe Connected Bus is a landmark innovation and a key element of the Cisco® Connected Urban Development (CUD) program—a public-private partnership focused on innovative use of information and communications technology (ICT) to make knowl-edge, people, traffic, and energy flow more efficiently. Increased efficiency enhances how people experience urban life, streamlines the management of cities, and decreases the urban environmental footprint.
As cities grow, traffic congestion increases, imposing huge costs on local and global economies, and impacting both the environment and quality of life for citizens. Attempts to reduce carbon emissions by cutting consumption of greenhouse-gas-producing fuels have been largely unsuccessful and viewed, by many, as counterproductive to economic growth—such measures are difficult to implement and impossible to enforce. Developing a new approach to the problem is critical, given the urgency posed by rapid climate change.
The Connected Bus is one approach cities can take to address these issues, and is a physical representation of a CUD architecture called “Connected and Sustainable Mobility.”1 In today’s knowledge-based society, people often require mobility to gather information or collaborate with others. Moving information to people and conducting virtual collaboration are increasingly possible under this architecture. In this way, people and goods can move freely and safely while preserving the environment and ensuring economic vitality and quality of life.
Connected Public TransitWithin this mobility architecture is a program called Connected Public Transit (CPT), which is a set of information services that improves passengers’ experience through ubiquitous connectivity. It is intended to make public transportation convenient, com-fortable, efficient, and reliable. Connected Public Transit can incorporate various “smart traveler” features that provide dynamic (changeable) guidance based on user profiles and context using real-time information. Some CPT features will integrate with Personal Travel Assistant (PTA) services that use handheld devices and public monitors located at transit stops and on transit vehicles to provide users with information along their route.
The Connected Bus—a proof of concept within the CPT program—is a best practice that, through CUD’s partnership with the city of San Francisco, can be referenced by other cities and scaled around the globe.
The Connected Bus: Connected and Sustainable Mobility Pilot
1. http://www.connectedurbandevelopment.org/connected_and_sustainable_mobility
2
Pilot Results
2
The Connected Bus: OverviewThe Connected Bus project began in the third quarter of 2007 and is a collabor ative effort between the Cisco Internet Business Solutions Group (IBSG) and the San Francisco Municipal Transportation Agency (SFMTA).2
The Connected Bus Vision Our vision for The Connected Bus was to develop a smart transportation system that would enhance the customer experience when using public transportation in the City and County of San Francisco, thereby attracting more riders. The pilot was designed to provide passengers with real-time information prominently displayed and accessible on the bus—such as the status of connecting lines at key transfer points—allowing riders to reach their destinations with certainty.
In addition, we wanted the bus to streamline transportation-management operations and deliver capabilities and services that address the reduction of carbon emissions and operational costs.
The Connected Bus is a 95 percent emissions-free hybrid vehicle3 that helps offset up to 55,000 car trips (270 tons of carbon emissions) each year. Key features include:
• High-speedwirelessInternetaccessforallpassengers
• “NextMuni”real-timetravelinformation(location,routes,waittimes,andmore)viaonboard touch screens
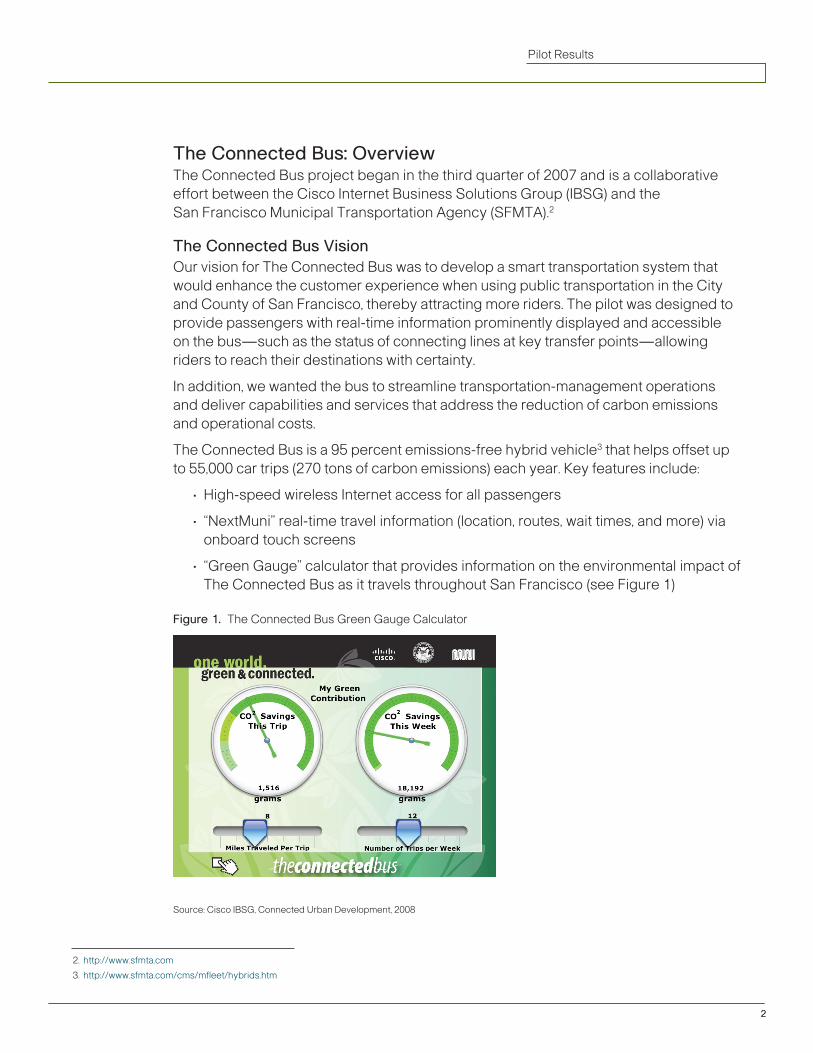
• “GreenGauge”calculatorthatprovidesinformationontheenvironmentalimpactofThe Connected Bus as it travels throughout San Francisco (see Figure 1)
Figure 1. The Connected Bus Green Gauge Calculator
Source: Cisco IBSG, Connected Urban Development, 2008
2. http://www.sfmta.com
3. http://www.sfmta.com/cms/mfleet/hybrids.htm
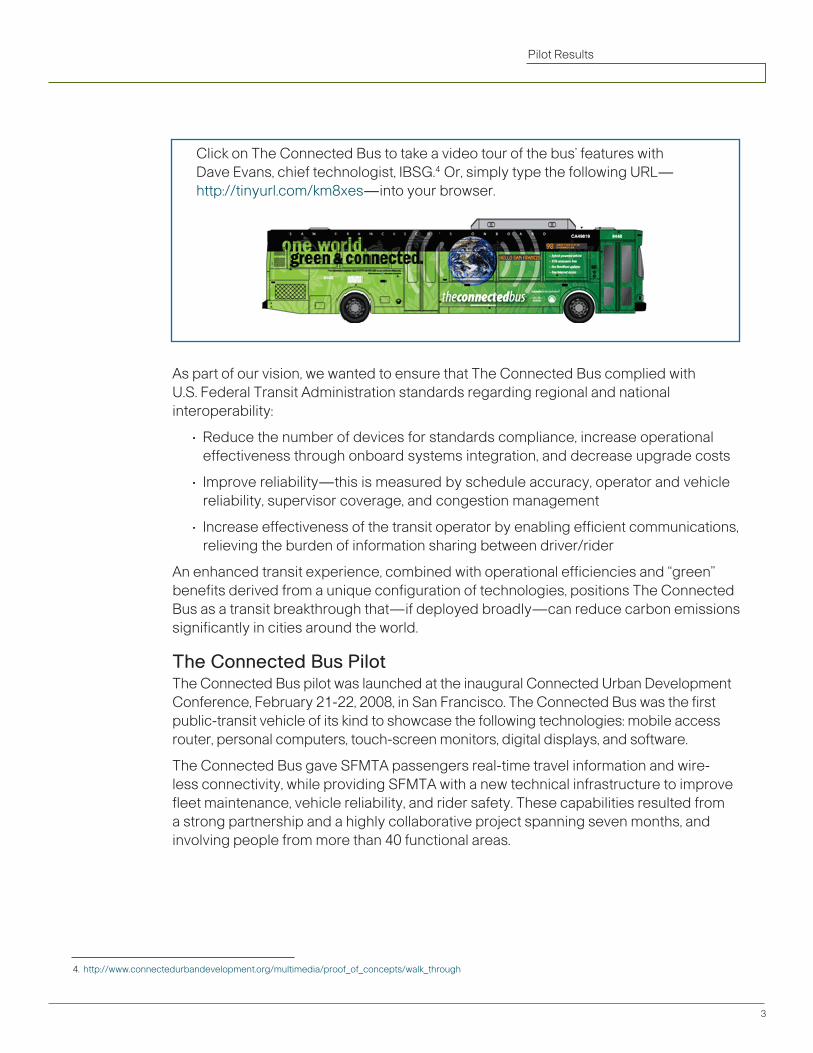
Click on The Connected Bus to take a video tour of the bus’ features with Dave Evans, chief technologist, IBSG.4 Or, simply type the following URL— http://tinyurl.com/km8xes—into your browser.
As part of our vision, we wanted to ensure that The Connected Bus complied with U.S. Federal Transit Administration standards regarding regional and national interoperability:
• Reducethenumberofdevicesforstandardscompliance,increaseoperationaleffectiveness through onboard systems integration, and decrease upgrade costs
• Improvereliability—thisismeasuredbyscheduleaccuracy,operatorandvehiclereliability, supervisor coverage, and congestion management
• Increaseeffectivenessofthetransitoperatorbyenablingefficientcommunications,relieving the burden of information sharing between driver/rider
An enhanced transit experience, combined with operational efficiencies and “green” benefits derived from a unique configuration of technologies, positions The Connected Bus as a transit breakthrough that—if deployed broadly—can reduce carbon emissions significantly in cities around the world.
The Connected Bus Pilot The Connected Bus pilot was launched at the inaugural Connected Urban Development Conference, February 21-22, 2008, in San Francisco. The Connected Bus was the first public-transit vehicle of its kind to showcase the following technologies: mobile access router, personal computers, touch-screen monitors, digital displays, and software.
The Connected Bus gave SFMTA passengers real-time travel information and wire-less connectivity, while providing SFMTA with a new technical infrastructure to improve fleet maintenance, vehicle reliability, and rider safety. These capabilities resulted from a strong partnership and a highly collaborative project spanning seven months, and involving people from more than 40 functional areas.
3
Pilot Results
4. http://www.connectedurbandevelopment.org/multimedia/proof_of_concepts/walk_through
4
Pilot Results
Pilot testing took place over a 12-month period in San Francisco, where the bus ran on one route. Feedback from citizen surveys, analysis from value cases, and data from test results of the bus’ features and functions were compiled.
The “10 Townsend” line—which runs from the commuter train station through San Francisco’s Financial District, around the waterfront, and past several high schools—was the first SFMTA line selected for operational trials because it serves a segment of the population that owns wireless devices and would most likely use it on the bus. It also serves a heavily traveled tourist area, which was a good proving ground for real-time connection information displayed onboard.
The bus followed a six-week burn-in schedule that mirrored the original burn-in schedule for the electric-hybrid buses. By mirroring the original schedule, SFMTA planned to collect vehicle maintenance data that could be compared with that of the initial burn-in period to see if there was a significant change in vehicle health, given the increased electrical load.
After six weeks, the bus was switched to the “18–46th Avenue,” a relatively long cross-town bus line on the west side of San Francisco. This line tends to operate at higher speeds and with fewer stops than most SFMTA lines, and has medium-to-low ridership. The line was selected for an extended test of The Connected Bus primarily because it caters to San Francisco residents, services a large number of university/college students, has moderate passenger loads and high Internet use, and has less potential for vandalism.
Assessing the Impact of the PilotAssessing the economic and environmental impact of The Connected Bus and testing the CUD hypothesis that technology has a net positive impact are crucial components of the pilot. In addition, the pilot’s ability to change citizens’ behavior patterns and per-ceptions about public transportation is important in delivering a sustainable technology solution. In this context, the goals established at the start of the project resulted in the following criteria for the pilot:
• Improvecustomerexperienceforpublictransportationusers
• Increaseuseofpublictransportation
• ReduceSanFrancisco’senvironmentalfootprint
• Integratepublictransportationresources
• Takeadvantageofbestpracticesinallrelatedcoreareas
• Incorporateindustrystandards
• Presentpilotprojectmaterialwithmeaningfulcontent
• Engagecitizensandcivilsocietyinthepilot
• Createpublicawarenessthroughmediaexposure
• ImplementtechnologiesthatcanbescaledacrosstheSFMTAfleet
5
Pilot Results
Based on past performance and prior assumptions regarding public transportation in San Francisco, data from the pilot study was used to form a number of metrics—both qualitative and quantitative—to determine public perceptions, use trends, and the economic and environmental value case. Several measurements were put in place to record data and account for these broad metrics. Some measurements were taken automatically, while others were derived from riders who shared their opinions about their experiences on The Connected Bus. Furthermore, the value-case approach required a scenario model to capture data acquired in conjunction with the pilot.
Public AwarenessPublic awareness was critical to the pilot. A public relations campaign,5 launched in February 2008 between Cisco and the city of San Francisco, raised considerable awareness among the media. At this time, and subsequently when San Francisco Mayor GavinNewsomhighlightedTheConnectedBusduringEarthDaythefollowingApril,theinitiative was covered by a number of television, print, and online media.
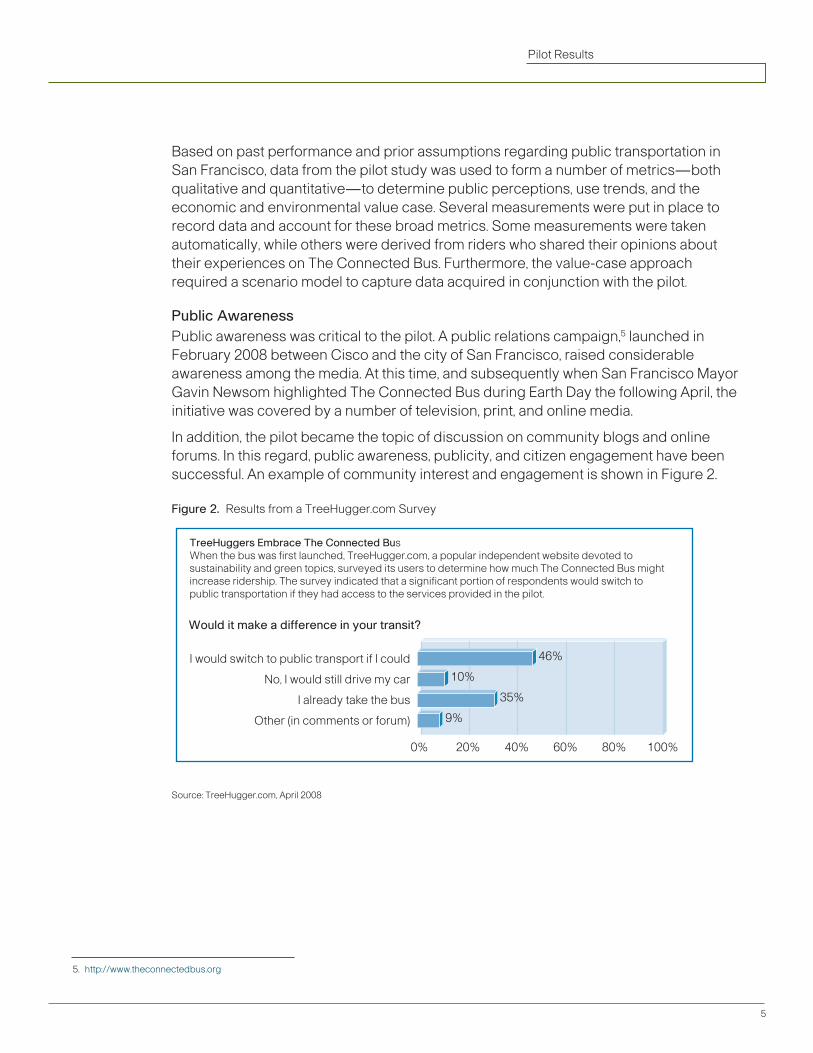
In addition, the pilot became the topic of discussion on community blogs and online forums. In this regard, public awareness, publicity, and citizen engagement have been successful. An example of community interest and engagement is shown in Figure 2.
Figure 2. ResultsfromaTreeHugger.comSurvey
I would switch to public transport if I could
Would it make a difference in your transit?
No, I would still drive my car
I already take the bus
Other (in comments or forum)
0% 100%80%60%40%20%
46%
10%
35%
9%
TreeHuggers Embrace The Connected BusWhen the bus was first launched, TreeHugger.com, a popular independent website devoted to sustainability and green topics, surveyed its users to determine how much The Connected Bus might increase ridership. The survey indicated that a significant portion of respondents would switch to public transportation if they had access to the services provided in the pilot.
Source:TreeHugger.com,April2008
5. http://www.theconnectedbus.org
6
Pilot Results
Pilot Survey and Results SFMTA and IBSG conducted a survey halfway through the year-long pilot. We followed the bus over one day, surveying 64 riders of the “18 Townsend” line. In addition, visitors to SFMTA’s website were invited to participate in an online survey. Although the sample size was small, the survey provides useful and insightful findings.
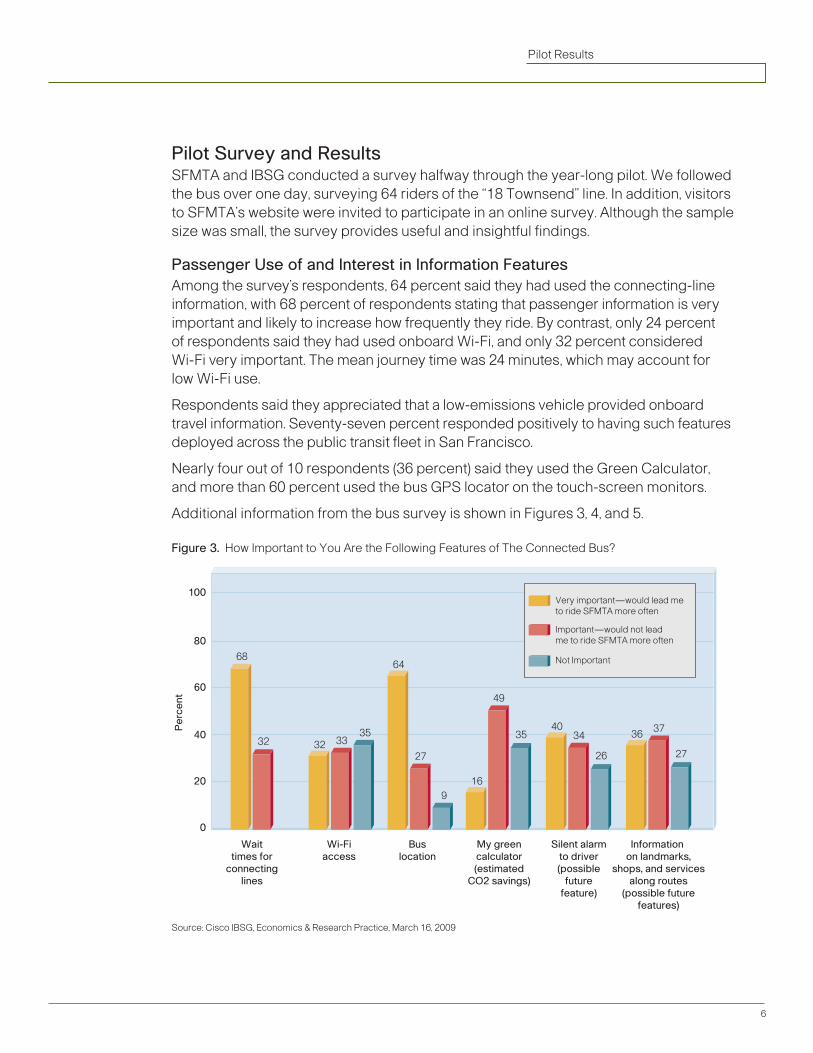
Passenger Use of and Interest in Information FeaturesAmong the survey’s respondents, 64 percent said they had used the connecting-line information, with 68 percent of respondents stating that passenger information is very important and likely to increase how frequently they ride. By contrast, only 24 percent of respondents said they had used onboard Wi-Fi, and only 32 percent considered Wi-Fi very important. The mean journey time was 24 minutes, which may account for low Wi-Fi use.
Respondents said they appreciated that a low-emissions vehicle provided onboard travel information. Seventy-seven percent responded positively to having such features deployed across the public transit fleet in San Francisco.
Nearlyfouroutof10respondents(36percent)saidtheyusedtheGreenCalculator, and more than 60 percent used the bus GPS locator on the touch-screen monitors.
Additional information from the bus survey is shown in Figures 3, 4, and 5.
Figure 3.HowImportanttoYouAretheFollowingFeaturesofTheConnectedBus?
Source: Cisco IBSG, Economics & Research Practice, March 16, 2009
Waittimes for
connectinglines
Wi-Fiaccess
Buslocation
My greencalculator(estimated
CO2 savings)
Silent alarmto driver(possible
futurefeature)
Information on landmarks,
shops, and servicesalong routes
(possible futurefeatures)
100
Pe
rce
nt
0
20
40
60
80
68
3235
3332
9
27
64
35
49
16
26
3440
27
3736
Very important—would lead me to ride SFMTA more often
Important—would not leadme to ride SFMTA more often
Not Important
7
Pilot Results
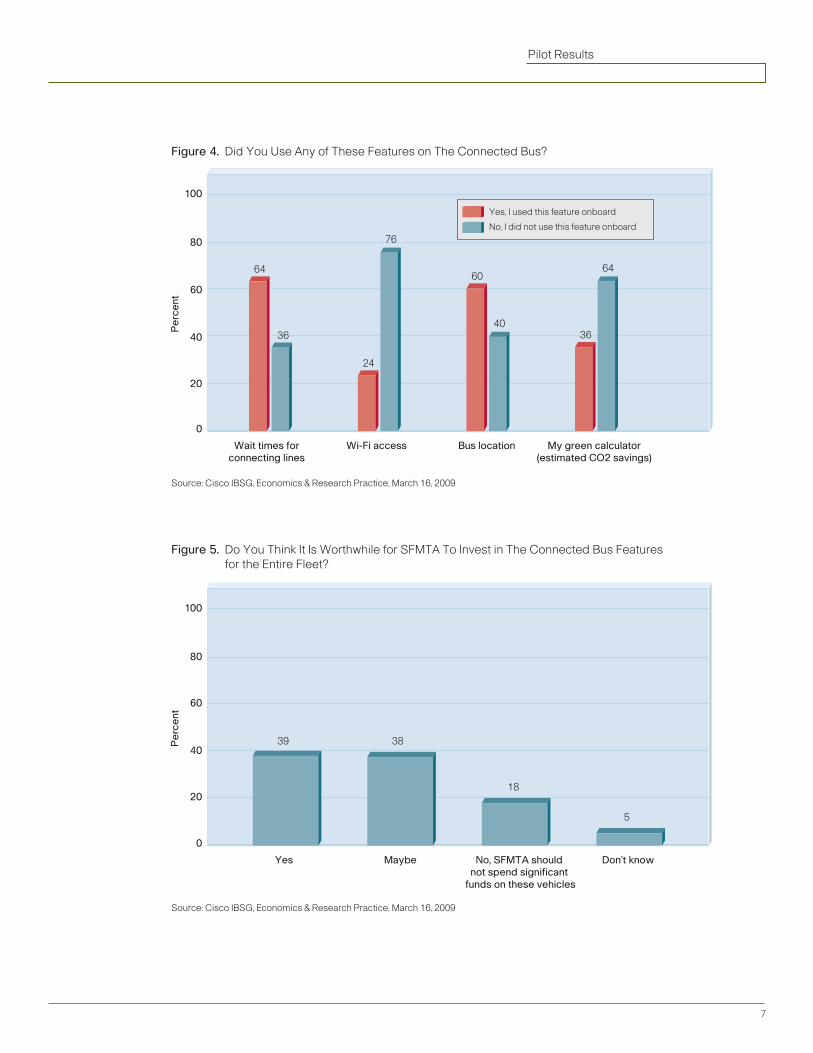
Figure 4.DidYouUseAnyofTheseFeaturesonTheConnectedBus?
Source: Cisco IBSG, Economics & Research Practice, March 16, 2009
Figure 5.DoYouThinkItIsWorthwhileforSFMTAToInvestinTheConnectedBusFeatures fortheEntireFleet?
Source: Cisco IBSG, Economics & Research Practice, March 16, 2009
Wi-Fi access Wait times forconnecting lines
Bus location My green calculator(estimated CO2 savings)
100
Pe
rce
nt
0
20
40
60
80
36
64
76
24
40
6064
36
Yes, I used this feature onboard
No, I did not use this feature onboard
MaybeYes No, SFMTA should not spend significant
funds on these vehicles
Don’t know
100
Pe
rce
nt
0
20
40
60
80
39 38
18
5
8
Pilot Results
Suggestions by respondents for future developments include:
• Implementingtechnologyatbusstopstoprovideaneasywaytopayfares;havingmore zero-emissions vehicles
• Providinginformationonroutesandarrivaltimestootherbusesandtransportationsystems such as Bay Area Rapid Transit (BART) and Caltrain
• Adding“tripplanners”toonboardcomputermonitors;havinglargermonitors onboard even if they are not touch screens, since some passengers have difficulty reaching screens
• ProvidinginformationonhowmanymilespergallonatypicalSFMTAbusgets during a route
• EnablingInternetaccessontouchscreensforpassengerswhodonothavelaptops
Value-Case AnalysisIBSG developed a value-case model6 to estimate the economic argument for bus travel, to register net environmental impact, and to assess the range of possible reductions in cost and environmental impact enabled by The Connected Bus.
The value-case hypothesis is that any investments in improving the effectiveness of the bus’servicewouldresultinapositiveNetPresentValue(NPV)propositionthatcanleadto a net reduction in carbon emissions. A standard SFMTA bus was the baseline for the value case, comparing it to the technologies deployed on The Connected Bus.
We then compiled findings from the prior assumptions value-case model to define the economic and environmental costs and benefits.
Economic Costs and BenefitsFunctionality. Delivering the specific functionality displayed on The Connected Bus requiresacumulativeinvestmentofUS$144,500,ornearly$68,000(NPV)over10years.This represents a 10-year total cost per passenger of 6.8 cents, compared with the operating cost of $2.38 per passenger over this same period for a standard bus.
Reliability. The Connected Bus is available for an additional 30 hours per year, resulting in an increase in ridership of 3,000 passengers and revenue growth of $2,070 per year.
Passenger Information. The principal benefit of the bus is to reduce perceived transfer times among passengers, resulting in an additional 62 bus trips per year and annual revenue of $3,202.
6. For a full description of the methodology, assumptions, sensitivities of the value-case model, and the scenarios explained in this paper, refer to the Connected Urban Development solutions toolkit at http://www.connectedurbandevelopment.org/toolkit.
Vendor Integration. An IP platform allows equipment vendors to swap and transmit information using IP rather than proprietary standards. This enables tighter and more effective integration of vendor services, likely leading to lower costs in the long term. Over the 10-year life of the bus, this is equivalent to $500 a year.
Traffic-Light Integration. The Connected Bus allows transportation systems to send information to local traffic lights indicating either to hold the green light for an extended time or to shorten the red-light cycle. Doing so provides a 3.13 percent decrease in the usual bus route trip of 90 minutes, suggesting a 1.56 percent improvement in ridership, some 7,734 additional riders each year, and $5,337 in revenue.
Other Revenue. Internet access and additional advertising enabled through digital signage are estimated to generate incremental revenue of $500 per bus per year.
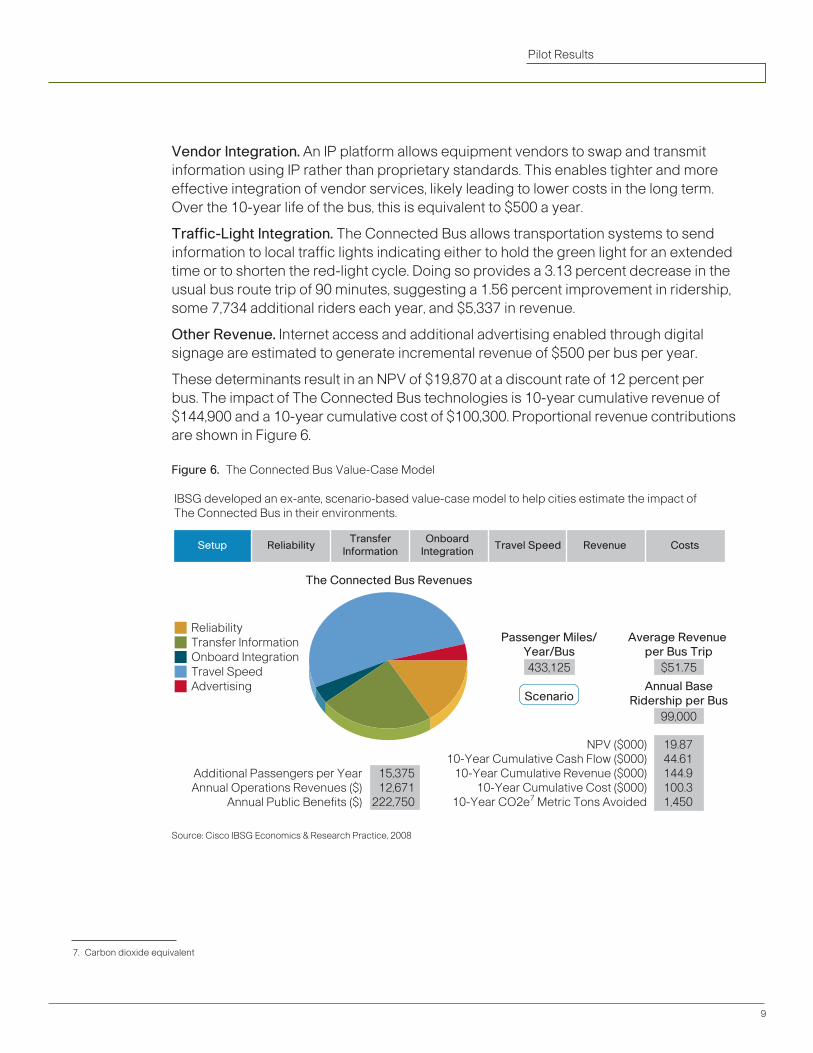
ThesedeterminantsresultinanNPVof$19,870atadiscountrateof12percentperbus. The impact of The Connected Bus technologies is 10-year cumulative revenue of $144,900 and a 10-year cumulative cost of $100,300. Proportional revenue contributions are shown in Figure 6.
Figure 6. TheConnectedBusValue-CaseModel
ReliabilityTransfer InformationOnboard IntegrationTravel SpeedAdvertising
Passenger Miles/Year/Bus433,125
Scenario
Average Revenue per Bus Trip
$51.75
Annual BaseRidership per Bus
99,000
Additional Passengers per YearAnnual Operations Revenues ($)
Annual Public Benefits ($)
15,37512,671
222,750
NPV ($000)10-Year Cumulative Cash Flow ($000)
10-Year Cumulative Revenue ($000)10-Year Cumulative Cost ($000)
10-Year CO2e7 Metric Tons Avoided
19.8744.61144.9100.31,450
The Connected Bus Revenues
Setup ReliabilityOnboard
IntegrationTransfer
InformationTravel Speed Revenue Costs
IBSG developed an ex-ante, scenario-based value-case model to help cities estimate the impact of The Connected Bus in their environments.
Source: Cisco IBSG Economics & Research Practice, 2008
9
Pilot Results
7. Carbon dioxide equivalent
Environmental BenefitsThe environmental benefits of The Connected Bus in Figure 6 are calculated in a simple manner that avoids some of the complexity of a detailed environmental impact analysis. Aggregate increased ridership per year is estimated at 15,375. Assuming that 5 percent of bus trips replaced a car trip, then 769 additional car trips were avoided. Compared with an average car trip of 6.3 miles (10 kilometers), the bus reduces carbon emissions by 1,537 metric tons. Subtracting the 87-metric-ton construction footprint, estimated in the value-case model, yields a net environmental benefit of 1,450 metric tons over 10 years.
LearningsThe Connected Bus pilot has been successful in terms of the measurement metrics stated earlier in this paper. There are, however, some practical considerations that must be addressed regarding the functioning and positioning of the touch screens for easy access by all riders, including disabled citizens, and protection against vandalism. Also, heavy passenger loads and shorter rides were found to limit the use of Wi-Fi Internet access by bus riders.
Other learnings include:
Provisioning citywide transportation information on The Connected Bus. Information on bus locations and transfer wait times is currently available at SFMTA stations and bus shelters. It was important to make sure the appearance of information displayed in The Connected Bus complemented that of the stations and shelters.
Setting for the pilot. San Francisco provides a challenging operating environment in several ways. First, shorter rides compared to suburban express trains and buses make Wi-Fi potentially less attractive. Second, heavy passenger loads on SFMTA buses makeitharderforriderstoaccesstouchscreensoruselaptopcomputers.Vandalism to the touch screens is a significant concern. On the other hand, with a high transfer rate on many SFMTA lines, connecting-service wait times are valuable, especially to The Connected Bus passengers, since Internet use is high in San Francisco.
Mayoral endorsement. When conducting a public transportation pilot like The Connected Bus, it is essential to have high-level endorsement from government leader-shiprightfromthestart.InannouncingTheConnectedBuspilot,MayorNewsomreferredto the use of green technology to furnish passengers an “office on wheels” and provide amenitiesthatwouldattractdrivers.HehighlightedthevalueofSFMTA’spartnershipwithCisco in working toward changing citizens’ perceptions of public transportation.
This paper provides a preliminary evaluation of The Connected Bus pilot during the first six months of use. Our findings focus on passenger-information features. A more exten-siveassessmentisneededinthefuturetoprovideaholisticperspective;itwouldincorporate a review of operational efficiency measures and considerations of the business model for potential adoption of The Connected Bus fleetwide.
10
Pilot Results
Next StepsThis pilot review has proved valuable in determining the priority SFMTA must give to integrating the features of The Connected Bus into the city’s public transportation fleet. The Connected Bus pilot ended March 15, 2009 and was documented in the CUD program as an exemplar for integrated and sustainable technology within a public transit system.
Future enhancements to The Connected Bus concept that are under consideration include integrated operator log-on for all onboard applications, shared location information across driver and rider accessed by onboard electronic services, and Wi-Fi downloads of vehicle status in the fleet yard to aid fleet and vehicle diagnostics.
During the next stage of this project, plans include extending the technology architec-ture embedded into The Connected Bus to other CPT projects. To date, The Connected Bus architecture has generated significant interest in scaling the model in other cities globally. Further applications of CPT technology, as applied to “connected bus stops” and citizen services such as PTAs, are currently being developed in the CUD partner cities of Amsterdam and Seoul, as well as in other cities outside the CUD program.
AcknowledgementsThe Connected Bus pilot has been a partnership between SFMTA and Cisco. Many organizations and individuals were instrumental in delivering the pilot, most notably:
•CityandCountyofSanFrancisco
•SanFranciscoMunicipalTransportationAgency(SFMTA)
•CiscoCorporateAffairs
•CiscoInternetBusinessSolutionsGroup(IBSG)Innovations,PublicSector,andStrategic Communications practices
11
Pilot Results
CB/LW 15738 0609