the complete guide to analytics on facebook -...
TRANSCRIPT
The Complete Guide toAnalytics on Facebook
2
Introduction • 03 Defining the Metrics • 04 Page Likes Engagement Engaged Users Reach & Impressions Engagement Rate Basic Analyses • 14 How to Understand Your Facebook Audience Beyond Likes How to Determine Which Posts to Promote with Facebook Ads How to Measure the Impact of Visual Content How to Deal with Negative Feedback Advanced Analyses • 28 How to Identify Growth Opportunities How to Perform a Competitive Industry Analysis How to Build Video Content Using Insights Data Conclusion • 42 About Simply Measured • 43
TABLE OF CONTENTS
Facebook is ripe with possibility for content marketers and social media managers. With more than 890 million daily active users as of December 2014, marketers have an ever-increasing audience to engage with. Facebook users are becoming more and more receptive to communicating with brands on the network, and brands are getting smarter about how they tailor content to Facebook.
Brands want to know, “What’s the best way to engage people who like our Page?” or “How do we set goals and which tactics will help us reach them?” or “How do we know if our program is working?” There are three steps that sophisticated Facebook marketers take as they strive to interact with their social audiences and answer these important questions.
Plan It. You won’t get what you want out of Facebook if you can’t define specific goals for yourself. Are you looking to amp up customer service response? Drive people to your blog? Get people to shop in your online store? Increase brand awareness?
Execute It. Don’t be afraid to try new things, but stay true to your brand voice. Internal brand consistency is key, but so is finding a way to stand out in the noise of people’s News Feeds.
Measure It. Learn if your tactics are working or not, and how to make improvements going forward.
In this definitive guide, we’ll walk you through both basic and more advanced Facebook metrics, explaining specific ways to use them in formulating better Facebook strategies and results.
Many of these explanations include information using Facebook Insights, Facebook’s tool which provides information about your Page’s performance and is available after at least 30 people like your Page.
INTRODUCTION
3
To effectively leverage Facebook actions, you must first understand how they work, and how to measure your success or failure using them.
In this section, we’ll outline the different ways that users interact with your brand and the different activities your brand can use on the network. On your journey from your campaign’s first post to that sweet moment of ROI, when you choose the most relevant benchmarking metrics you’re bound to get the best results. You’ll get a holistic picture by keeping an eye on:
• The number of Page Likes added
• The number of actions taken (engagements)
• The number of unique people who engaged with your brand during a given time period
• The number of click-throughs on your links
• The number of unique people who could have seen your posts
• The number of times those people could have seen your posts
• Your engagement rate
You can reach massive audiences when your audience and influencers engage, both spreading your content and increasing brand awareness. Great content leads to engagement and amplification. In turn, you increase your reach as more fans opt-in, adding fuel to the machine.
These calculations may seem complicated, so we’ll break down and define each component that plays an active role in your brand’s Facebook success.
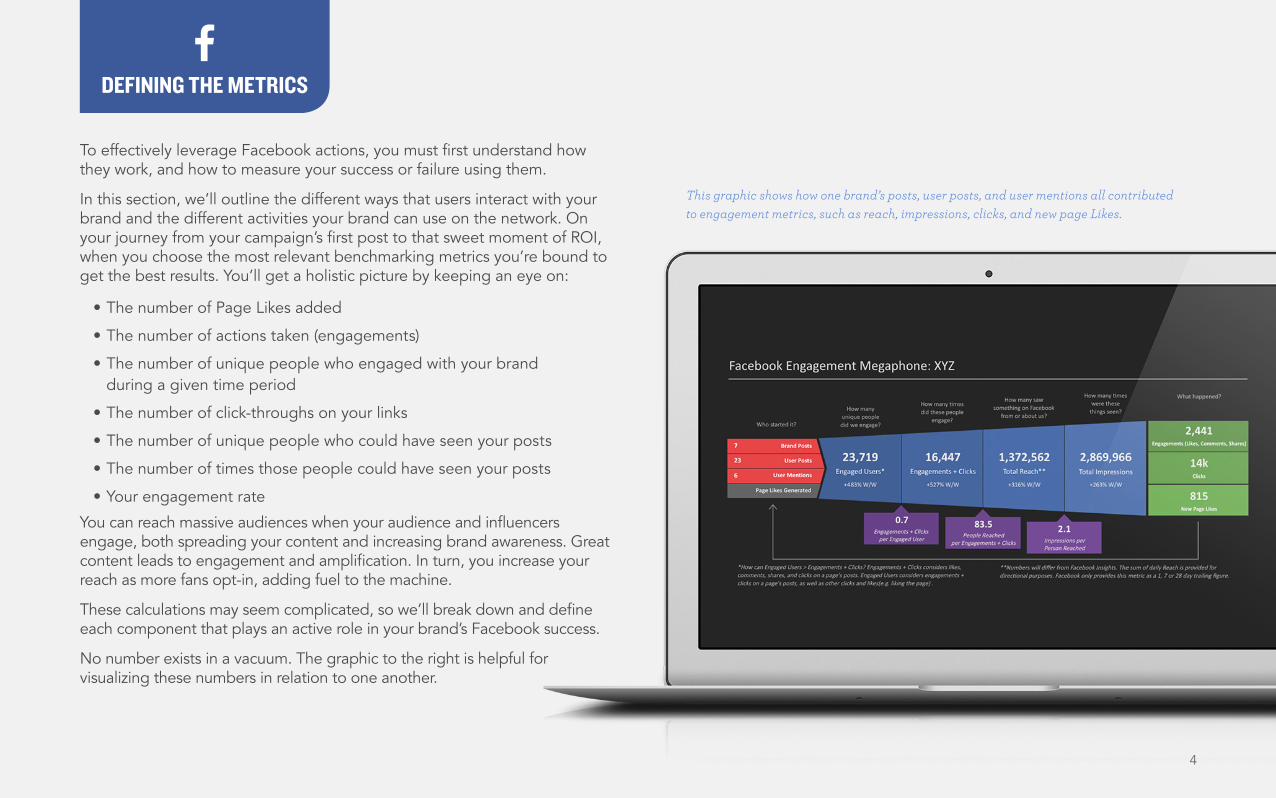
No number exists in a vacuum. The graphic to the right is helpful for visualizing these numbers in relation to one another.
This graphic shows how one brand’s posts, user posts, and user mentions all contributed to engagement metrics, such as reach, impressions, clicks, and new page Likes.
DEFINING THE METRICS
4
5
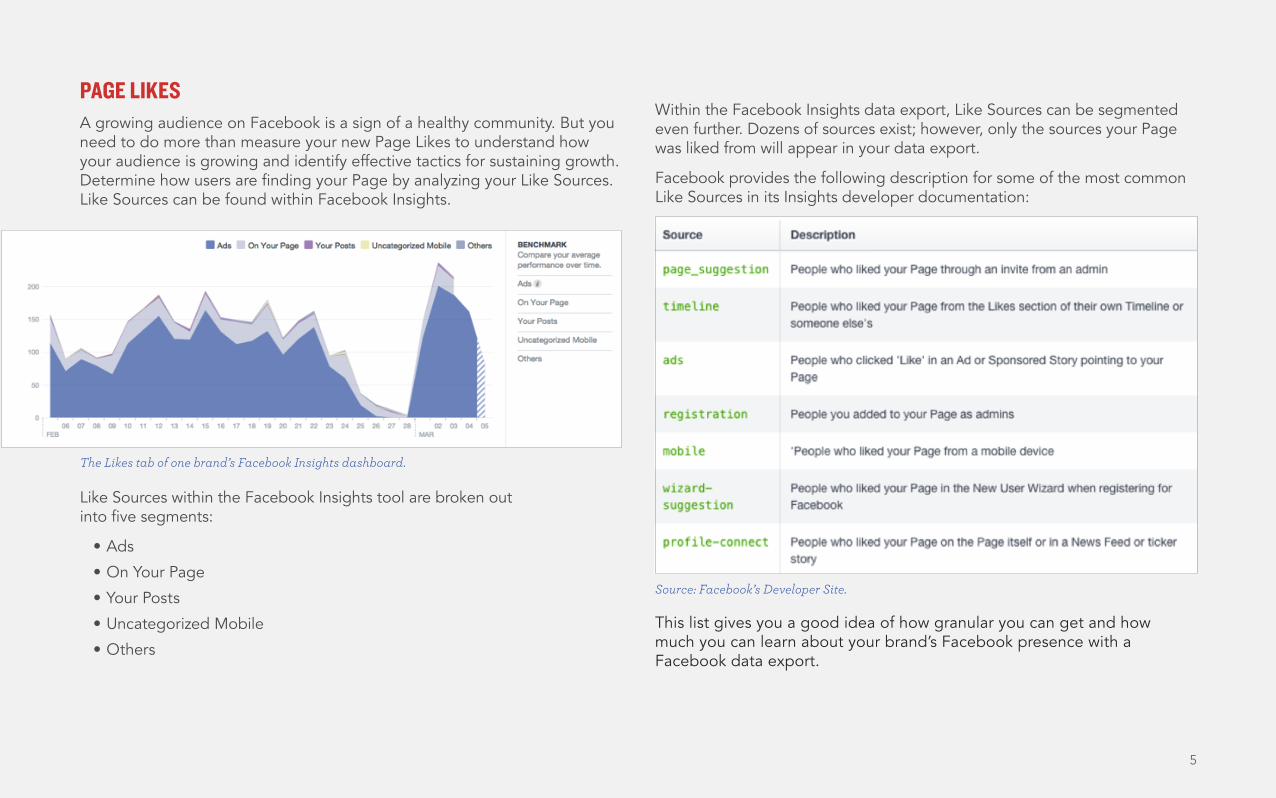
PAGE LIKESA growing audience on Facebook is a sign of a healthy community. But you need to do more than measure your new Page Likes to understand how your audience is growing and identify effective tactics for sustaining growth. Determine how users are finding your Page by analyzing your Like Sources. Like Sources can be found within Facebook Insights.
Like Sources within the Facebook Insights tool are broken out into five segments:
• Ads
• On Your Page
• Your Posts
• Uncategorized Mobile
• Others
Within the Facebook Insights data export, Like Sources can be segmented even further. Dozens of sources exist; however, only the sources your Page was liked from will appear in your data export.
Facebook provides the following description for some of the most common Like Sources in its Insights developer documentation:
This list gives you a good idea of how granular you can get and how much you can learn about your brand’s Facebook presence with a Facebook data export.
The Likes tab of one brand’s Facebook Insights dashboard.
Source: Facebook’s Developer Site.
6
What Do Like Sources Mean to You? Like Sources can help you understand how users are discovering and liking your Page, and provide context for how your other digital marketing components impact Like growth. Here are the major questions Like Sources help you answer.
• Are external connects (e.g., clicks on social plugins) from your website effectively driving users to your Facebook Page? For instance, if you place social plugins on a specific page on your site and subsequently see a significant uptick in Facebook Page Likes, you should consider posting content from that specific web page on your Facebook Page, since it clearly resonates with your customers.
• When you make changes to better integrate social plugins, do you see more Likes? This is a good place to do some testing. Put your social plugin on the top of your website for one month and at the bottom of the site during the next month to learn which works better for your brand.
• What percentage of new Likes is driven by Facebook Ads? Looking at this percentage side-by-side with similar metrics from Twitter and other social networks will help you understand how much money you need to devote to Facebook Ads in relationship to budget for other networks.
• Is the third-party app from your latest campaign contributing to fan growth? Facebook Insights can be a very good tool if you’re evaluating and comparing third-party apps to find out what’s most effective for your brand.
• How many users liked your Page from a mobile device? For instance, if a large percentage of users liked your page from a mobile device, you might want to spend some time making sure your content is optimized for mobile to enable more engagement with those users.
These are questions you can answer with data from Like Sources. From there, you can make more informed decisions about tactics designed to grow your Page.
Paid vs. Unpaid Likes Facebook advertising is a must for modern marketers, with most brands devoting at least a portion of their social media budget to advertising on the network.
It’s important to be able to segment social media performance by paid vs. organic activities so that you can see how these activities complement one another, and know which content to put ad spend behind.
Likes are counted as paid when they occur within one day of viewing your ad or 28 days of clicking your ad.
Paid LikesThe number of people that liked your page from an Ad or a Sponsored Story
7
ENGAGEMENTWhether you seek increased site activity and financial ROI or brand awareness and overall market penetration, checking your engagement is the best way to get a general overview of how you’re doing, conduct content and competitive analyses, and set benchmarks.
What Does Engagement Mean to You? Engagement on Facebook accounts for the public ways your social audience can interact with your brand posts or make them show up in their Newsfeeds and those of their Facebook friends. It measures people’s interactions with your content and promotion of your content to their circles of influence.
The variety of methods by which people can engage with your content, whether by sharing, commenting, liking, or clicking through, is what makes Facebook such a powerful, versatile network for marketers. The people with whom you’re engaging on Facebook can act as advocates for your company, provide feedback on products or services, purchase products, and help you better understand your customers. Understanding how well your brand engages users on Facebook is a vital step towards developing your marketing campaigns on the network.
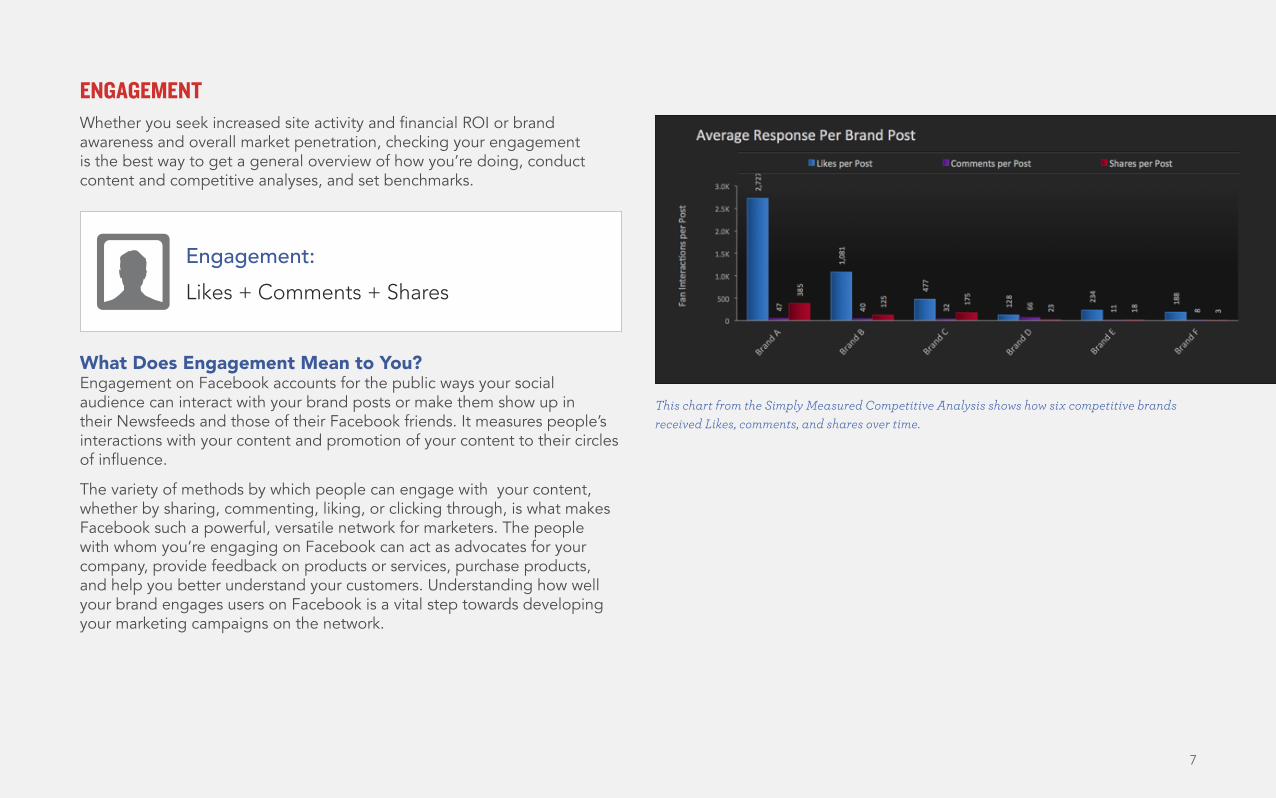
This chart from the Simply Measured Competitive Analysis shows how six competitive brands received Likes, comments, and shares over time.
Engagement:Likes + Comments + Shares
8
How Is Engagement Calculated?Engagement is the total of several components during a given time period:
Likes: When a user likes a brand post on your page.
Comments: When a user comments on your brand post.
Shares: When a user shares one of your brand posts with his or her friends.
Why Engagement Is ImportantThe amount of engagement your posts receive can help you understand:
• Your content’s ability to capture user attention
• Your content’s ability to compel user action
• The number of people who were served your post
• Your brand visibility, because the engagement metric is a major factor in Facebook’s News Feed algorithm, which determines the News Feeds your posts are displayed in and, ultimately, how many users you’re able to reach
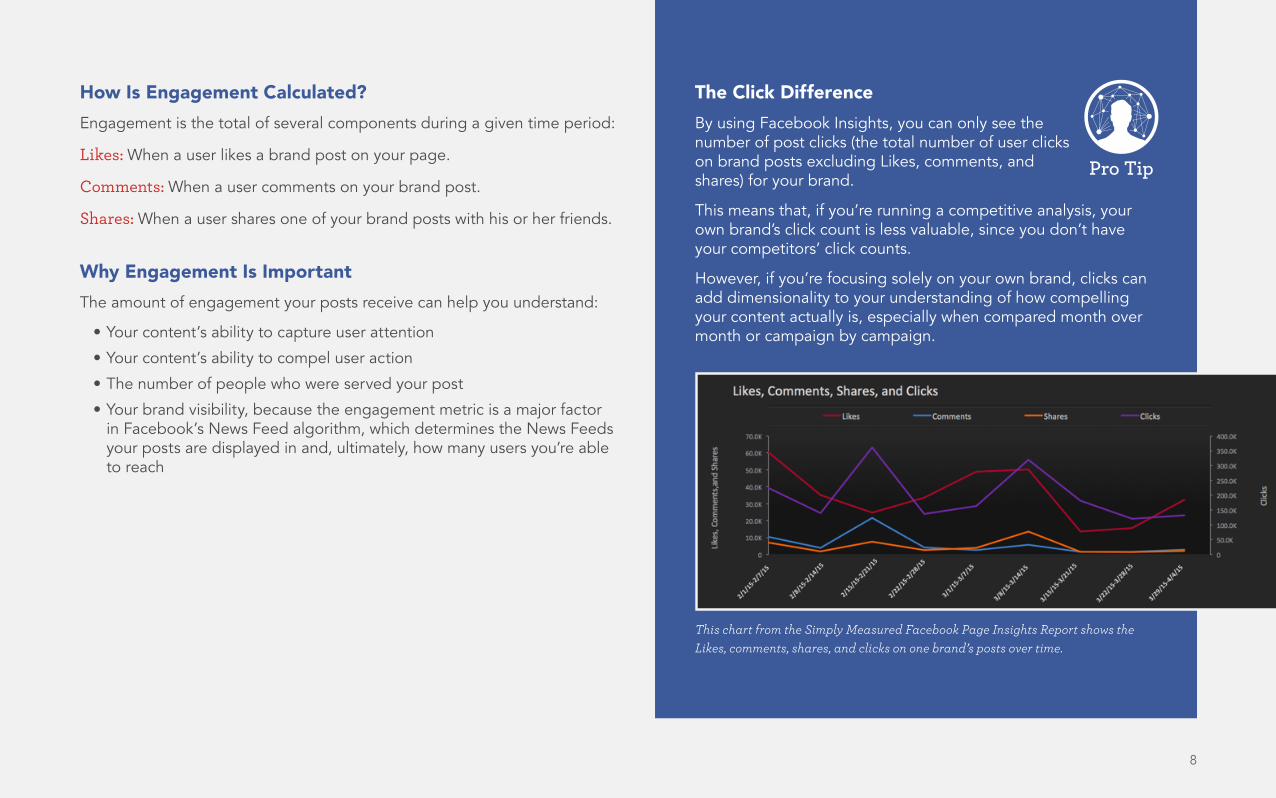
This chart from the Simply Measured Facebook Page Insights Report shows the Likes, comments, shares, and clicks on one brand’s posts over time.
The Click DifferenceBy using Facebook Insights, you can only see the number of post clicks (the total number of user clicks on brand posts excluding Likes, comments, and shares) for your brand.
This means that, if you’re running a competitive analysis, your own brand’s click count is less valuable, since you don’t have your competitors’ click counts.
However, if you’re focusing solely on your own brand, clicks can add dimensionality to your understanding of how compelling your content actually is, especially when compared month over month or campaign by campaign.
Pro Tip
9
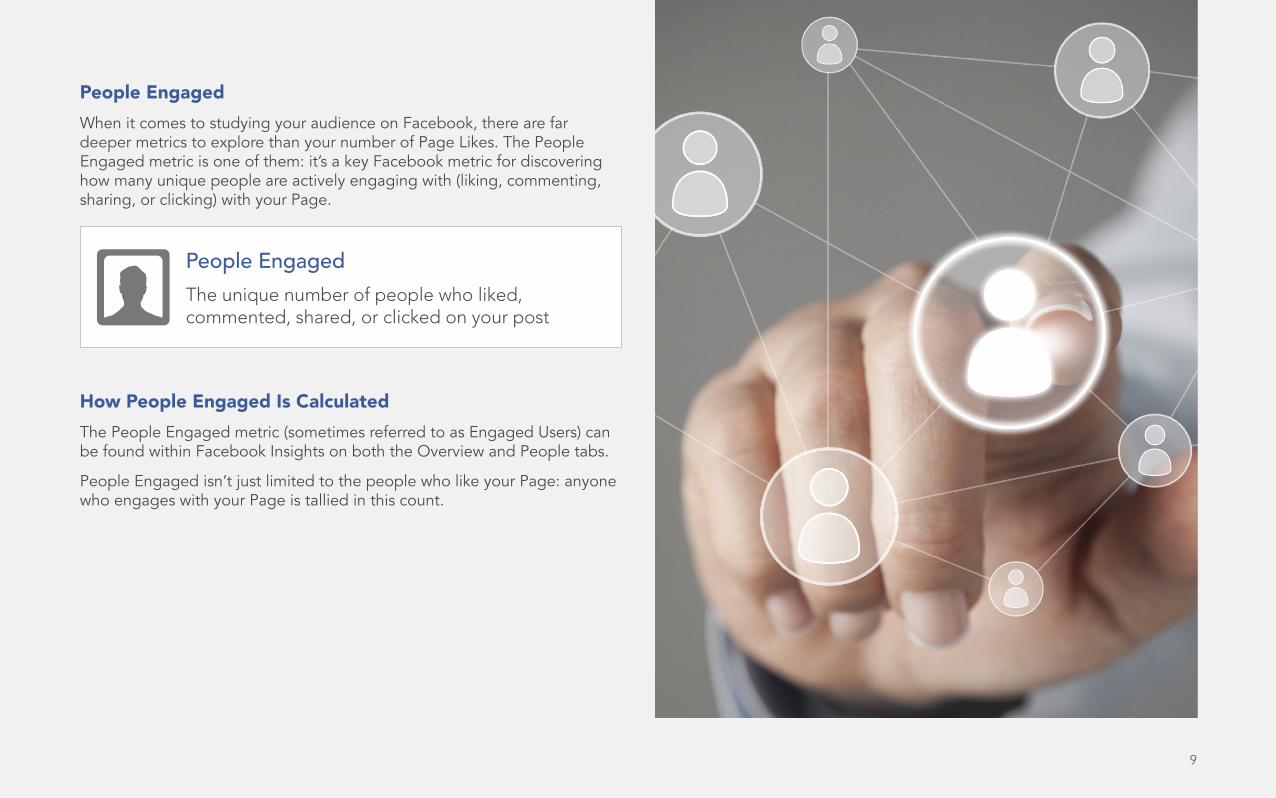
People Engaged When it comes to studying your audience on Facebook, there are far deeper metrics to explore than your number of Page Likes. The People Engaged metric is one of them: it’s a key Facebook metric for discovering how many unique people are actively engaging with (liking, commenting, sharing, or clicking) with your Page.
How People Engaged Is Calculated The People Engaged metric (sometimes referred to as Engaged Users) can be found within Facebook Insights on both the Overview and People tabs.
People Engaged isn’t just limited to the people who like your Page: anyone who engages with your Page is tallied in this count.
People EngagedThe unique number of people who liked, commented, shared, or clicked on your post
10
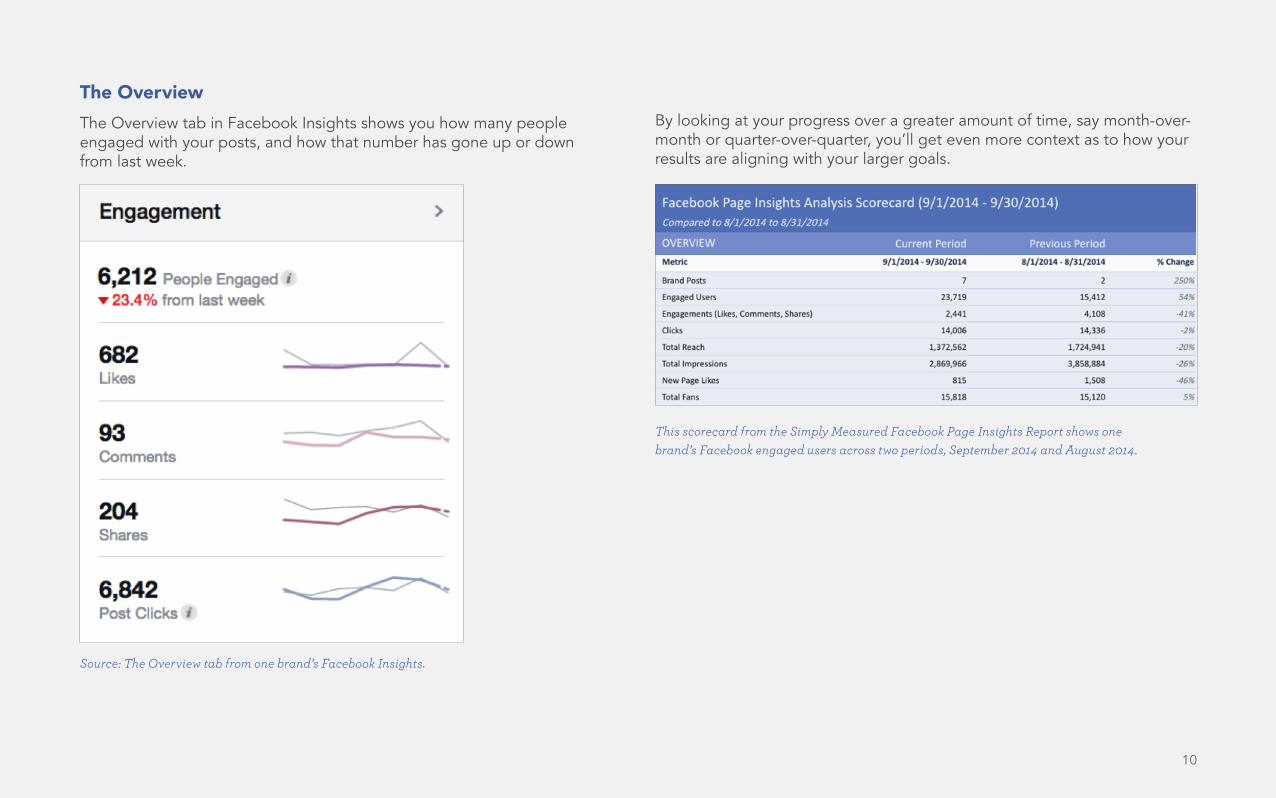
The OverviewThe Overview tab in Facebook Insights shows you how many people engaged with your posts, and how that number has gone up or down from last week.
By looking at your progress over a greater amount of time, say month-over-month or quarter-over-quarter, you’ll get even more context as to how your results are aligning with your larger goals.
Source: The Overview tab from one brand’s Facebook Insights.
This scorecard from the Simply Measured Facebook Page Insights Report shows one brand’s Facebook engaged users across two periods, September 2014 and August 2014.
11
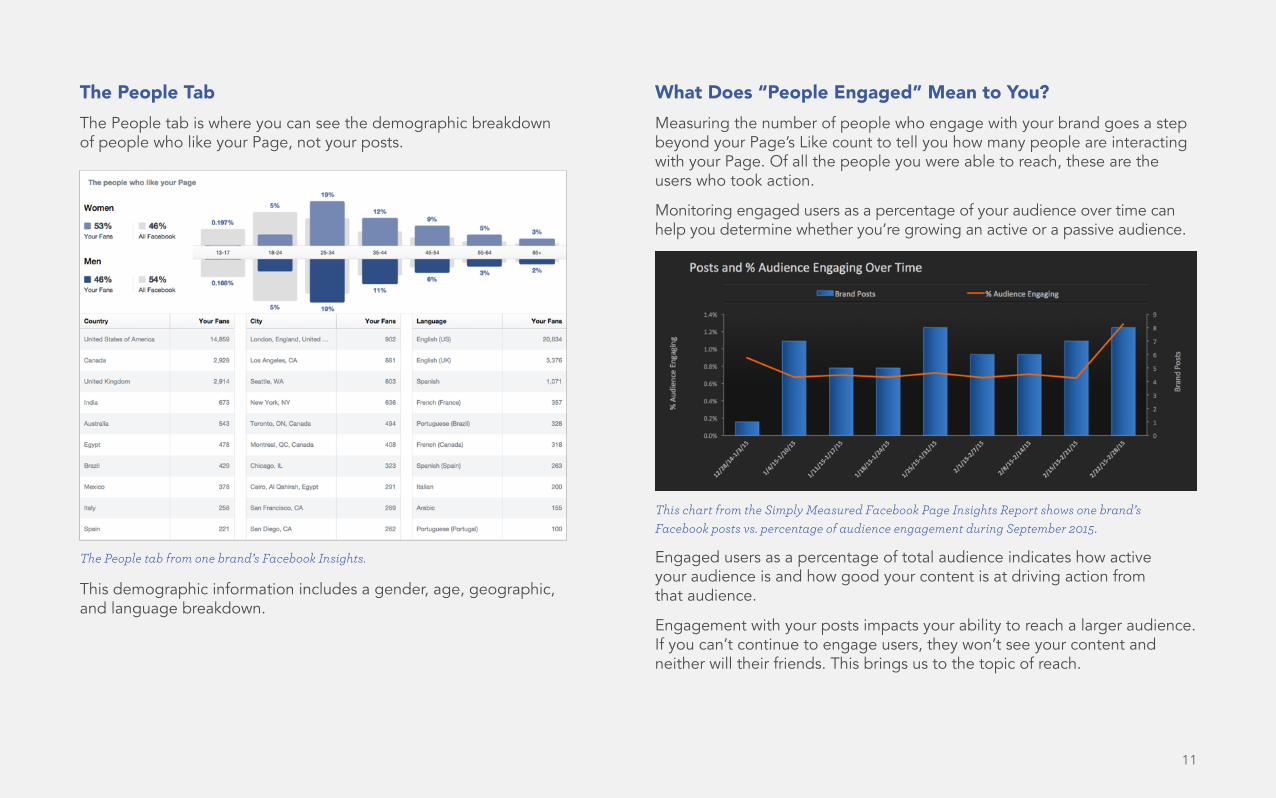
The People Tab The People tab is where you can see the demographic breakdown of people who like your Page, not your posts.
This demographic information includes a gender, age, geographic, and language breakdown.
What Does “People Engaged” Mean to You?Measuring the number of people who engage with your brand goes a step beyond your Page’s Like count to tell you how many people are interacting with your Page. Of all the people you were able to reach, these are the users who took action.
Monitoring engaged users as a percentage of your audience over time can help you determine whether you’re growing an active or a passive audience.
Engaged users as a percentage of total audience indicates how active your audience is and how good your content is at driving action from that audience.
Engagement with your posts impacts your ability to reach a larger audience. If you can’t continue to engage users, they won’t see your content and neither will their friends. This brings us to the topic of reach.
The People tab from one brand’s Facebook Insights.
This chart from the Simply Measured Facebook Page Insights Report shows one brand’s Facebook posts vs. percentage of audience engagement during September 2015.
12
REACH & IMPRESSIONSAs a marketer, your greatest concern on Facebook should be how many people are seeing your content (especially when you’re spending money to boost posts). This is where reach comes in.
Reach tells you how many people could possibly have seen your content. It’s a performance metric and powerful indicator of how well your social strategy is working.
How Reach Is Calculated There are two types of reach: organic and paid. Understanding and measuring each tells you how and why your audience changes over time.
Organic Reach: The number of unique people who saw your content in their News Feeds, tickers (where you see the latest news show up in real time on the right-hand side of your New Feed), or on your Page.
Paid Reach: The number of unique people who saw your paid content.
Measuring reach by type can help you pinpoint the factors that contributed to content views. If organic reach increased, it might be the result of more Likes on your Page or a particularly alluring piece of content. Monitoring paid reach alongside organic reach tells you whether changes in reach were due to ads on the network or organic activity, and can help you modulate your ad spend.
What Does Reach Mean to You? Reach tells you how big your brand’s effective audience is. It can be a more accurate measure of your Facebook audience than Page Likes, since not all the people who like your Page see your posts and many users who do see your posts do not like your Page.
ReachThe number of unique people who have seen content associated with your page.
What About Impressions? The largest challenge for many brands on Facebook is appearing in users’ News Feeds. Use the Impressions metric to understand how frequently users are exposed to your content.
How Impressions Are Calculated Like reach, there are two types of impressions on Facebook: organic and paid.
Organic Impressions: The number of times your content was displayed in a user’s News Feed, ticker, or on your Page.
Paid Impressions: The number of times your paid content was displayed.
The key difference between impressions and reach is that impressions measure the number of times your content is displayed, while reach measures the number of unique people who were served your content. For example, if five people were served your post twice, the result would be ten impressions (times displayed) and a reach of five (unique people who were served the post).
ImpressionsThe number of times content associated with your page is displayed
Pro Tip
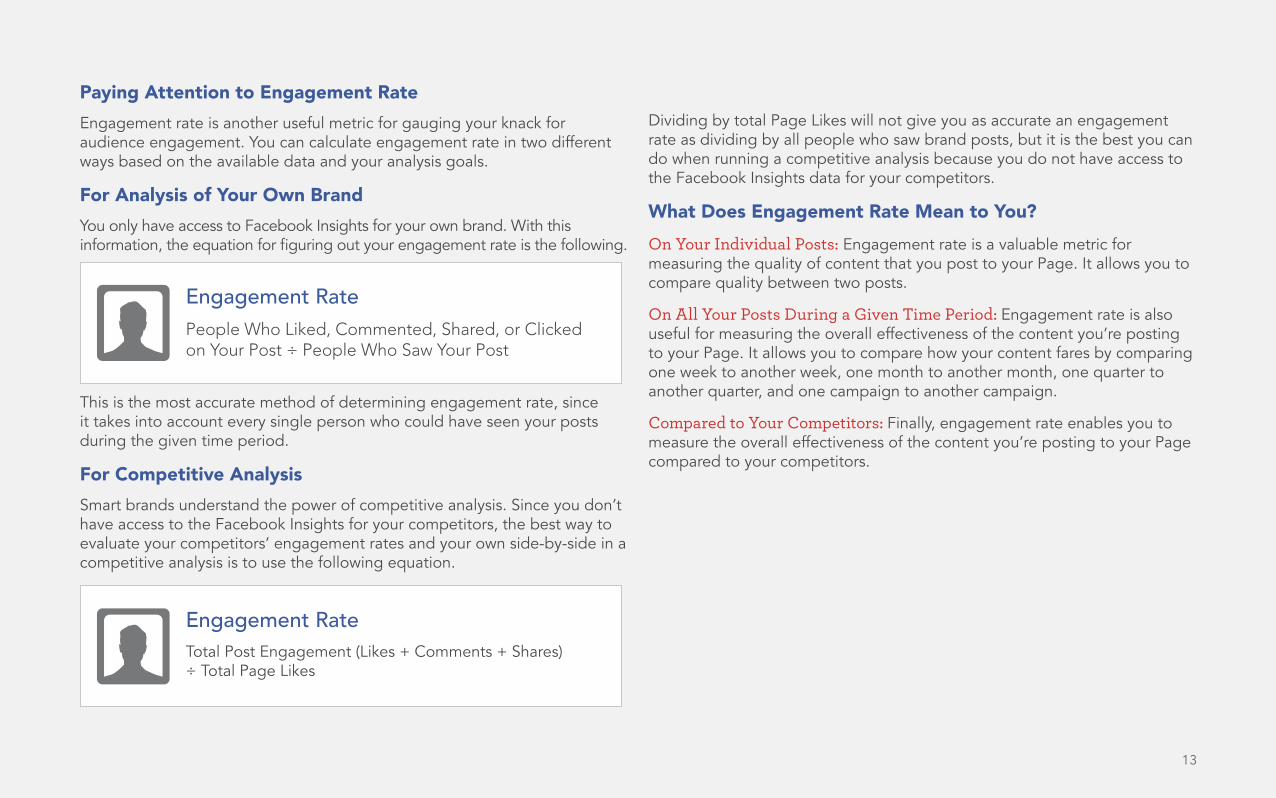
Paying Attention to Engagement RateEngagement rate is another useful metric for gauging your knack for audience engagement. You can calculate engagement rate in two different ways based on the available data and your analysis goals.
For Analysis of Your Own Brand You only have access to Facebook Insights for your own brand. With this information, the equation for figuring out your engagement rate is the following.
This is the most accurate method of determining engagement rate, since it takes into account every single person who could have seen your posts during the given time period.
For Competitive Analysis Smart brands understand the power of competitive analysis. Since you don’t have access to the Facebook Insights for your competitors, the best way to evaluate your competitors’ engagement rates and your own side-by-side in a competitive analysis is to use the following equation.
Dividing by total Page Likes will not give you as accurate an engagement rate as dividing by all people who saw brand posts, but it is the best you can do when running a competitive analysis because you do not have access to the Facebook Insights data for your competitors.
What Does Engagement Rate Mean to You?On Your Individual Posts: Engagement rate is a valuable metric for measuring the quality of content that you post to your Page. It allows you to compare quality between two posts.
On All Your Posts During a Given Time Period: Engagement rate is also useful for measuring the overall effectiveness of the content you’re posting to your Page. It allows you to compare how your content fares by comparing one week to another week, one month to another month, one quarter to another quarter, and one campaign to another campaign.
Compared to Your Competitors: Finally, engagement rate enables you to measure the overall effectiveness of the content you’re posting to your Page compared to your competitors.
Engagement RatePeople Who Liked, Commented, Shared, or Clicked on Your Post ÷ People Who Saw Your Post
Engagement RateTotal Post Engagement (Likes + Comments + Shares) ÷ Total Page Likes
13
14
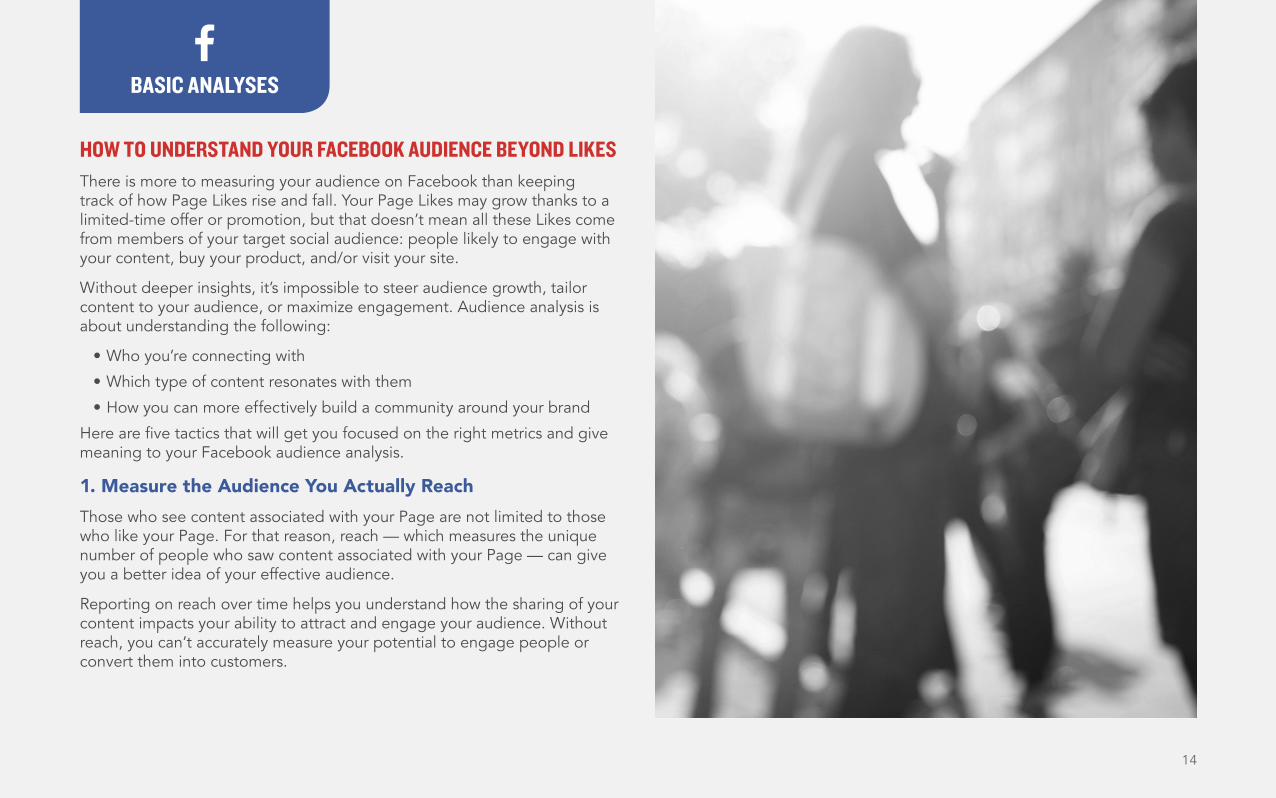
HOW TO UNDERSTAND YOUR FACEBOOK AUDIENCE BEYOND LIKESThere is more to measuring your audience on Facebook than keeping track of how Page Likes rise and fall. Your Page Likes may grow thanks to a limited-time offer or promotion, but that doesn’t mean all these Likes come from members of your target social audience: people likely to engage with your content, buy your product, and/or visit your site.
Without deeper insights, it’s impossible to steer audience growth, tailor content to your audience, or maximize engagement. Audience analysis is about understanding the following:
• Who you’re connecting with
• Which type of content resonates with them
• How you can more effectively build a community around your brand
Here are five tactics that will get you focused on the right metrics and give meaning to your Facebook audience analysis.
1. Measure the Audience You Actually ReachThose who see content associated with your Page are not limited to those who like your Page. For that reason, reach — which measures the unique number of people who saw content associated with your Page — can give you a better idea of your effective audience.
Reporting on reach over time helps you understand how the sharing of your content impacts your ability to attract and engage your audience. Without reach, you can’t accurately measure your potential to engage people or convert them into customers.
BASIC ANALYSES
15
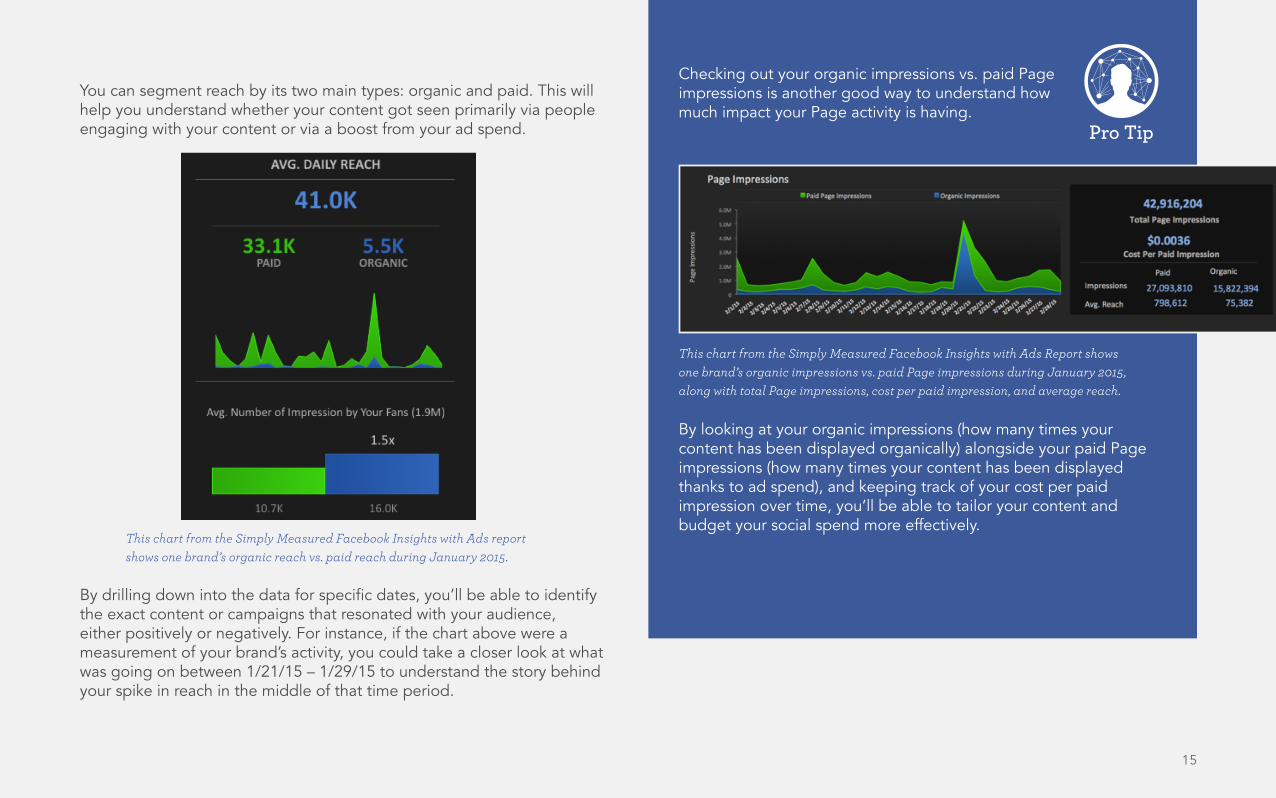
You can segment reach by its two main types: organic and paid. This will help you understand whether your content got seen primarily via people engaging with your content or via a boost from your ad spend.
By drilling down into the data for specific dates, you’ll be able to identify the exact content or campaigns that resonated with your audience, either positively or negatively. For instance, if the chart above were a measurement of your brand’s activity, you could take a closer look at what was going on between 1/21/15 – 1/29/15 to understand the story behind your spike in reach in the middle of that time period.
This chart from the Simply Measured Facebook Insights with Ads report shows one brand’s organic reach vs. paid reach during January 2015.
This chart from the Simply Measured Facebook Insights with Ads Report shows one brand’s organic impressions vs. paid Page impressions during January 2015, along with total Page impressions, cost per paid impression, and average reach.
Checking out your organic impressions vs. paid Page impressions is another good way to understand how much impact your Page activity is having.
By looking at your organic impressions (how many times your content has been displayed organically) alongside your paid Page impressions (how many times your content has been displayed thanks to ad spend), and keeping track of your cost per paid impression over time, you’ll be able to tailor your content and budget your social spend more effectively.
Pro Tip
16
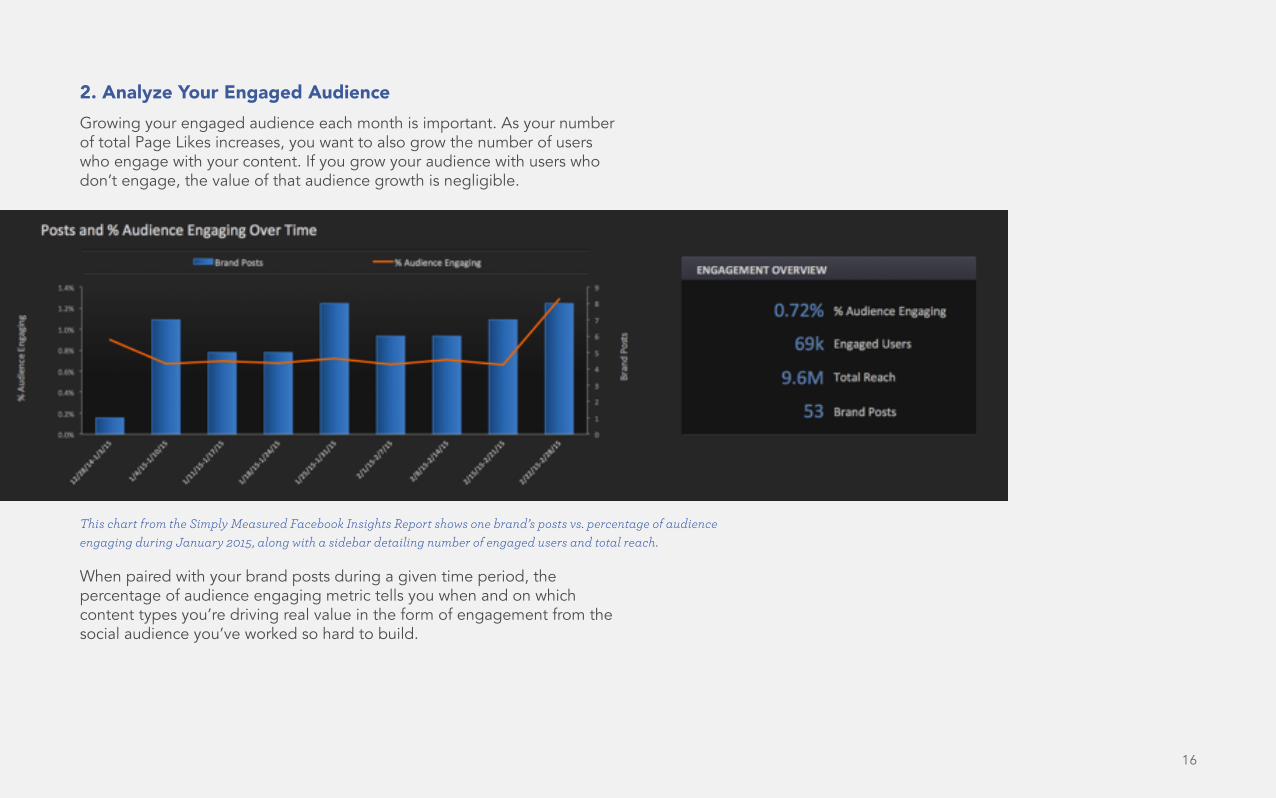
2. Analyze Your Engaged AudienceGrowing your engaged audience each month is important. As your number of total Page Likes increases, you want to also grow the number of users who engage with your content. If you grow your audience with users who don’t engage, the value of that audience growth is negligible.
When paired with your brand posts during a given time period, the percentage of audience engaging metric tells you when and on which content types you’re driving real value in the form of engagement from the social audience you’ve worked so hard to build.
This chart from the Simply Measured Facebook Insights Report shows one brand’s posts vs. percentage of audience engaging during January 2015, along with a sidebar detailing number of engaged users and total reach.
17
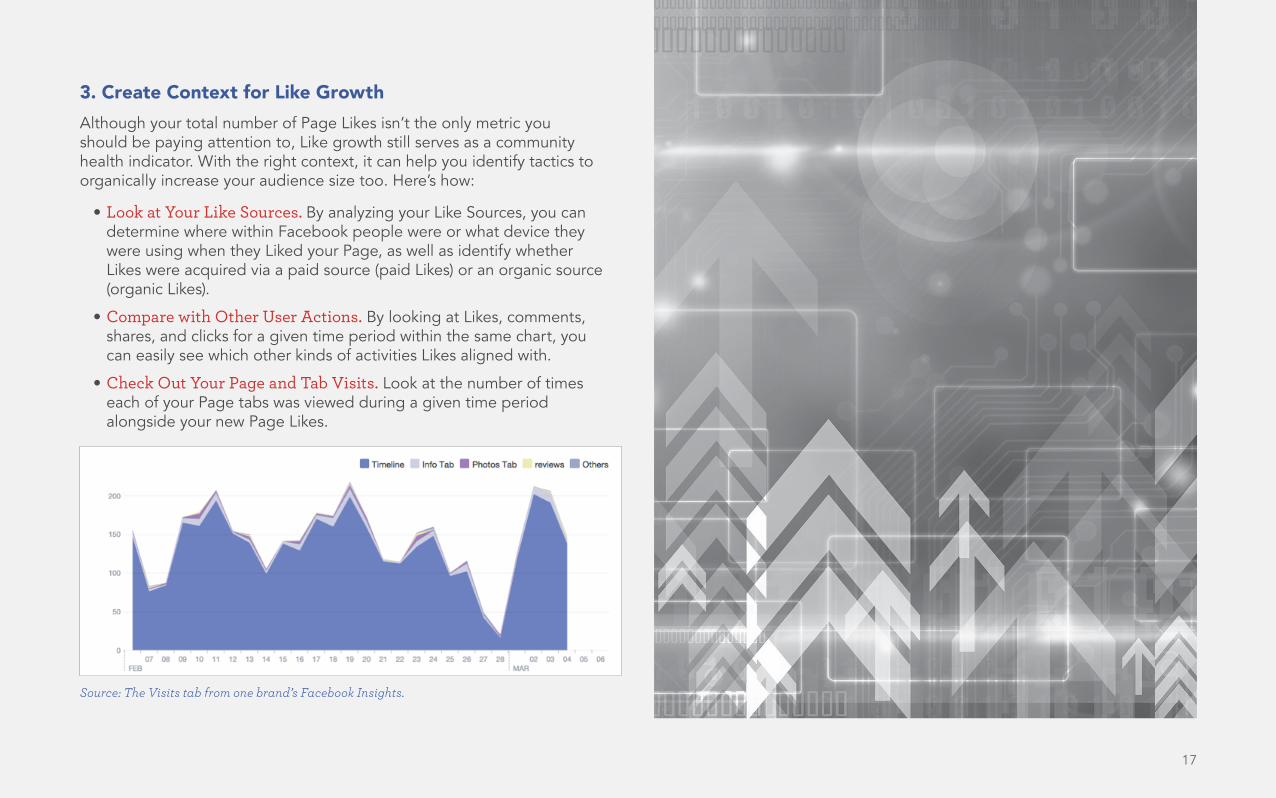
3. Create Context for Like GrowthAlthough your total number of Page Likes isn’t the only metric you should be paying attention to, Like growth still serves as a community health indicator. With the right context, it can help you identify tactics to organically increase your audience size too. Here’s how:
• Look at Your Like Sources. By analyzing your Like Sources, you can determine where within Facebook people were or what device they were using when they Liked your Page, as well as identify whether Likes were acquired via a paid source (paid Likes) or an organic source (organic Likes).
• Compare with Other User Actions. By looking at Likes, comments, shares, and clicks for a given time period within the same chart, you can easily see which other kinds of activities Likes aligned with.
• Check Out Your Page and Tab Visits. Look at the number of times each of your Page tabs was viewed during a given time period alongside your new Page Likes.
Source: The Visits tab from one brand’s Facebook Insights.
18
This information from your Visits tab will tell you which part of your Page is a major attraction for people who newly Like you or people who are deciding whether they should Like you.
• Consider Your External Referrers. Finally, look at your Likes progress over time in context with the number of people visiting your Page from off-Facebook sites.
With this analysis, you’ll be able to find out which off-Facebook activities drive the most Likes.
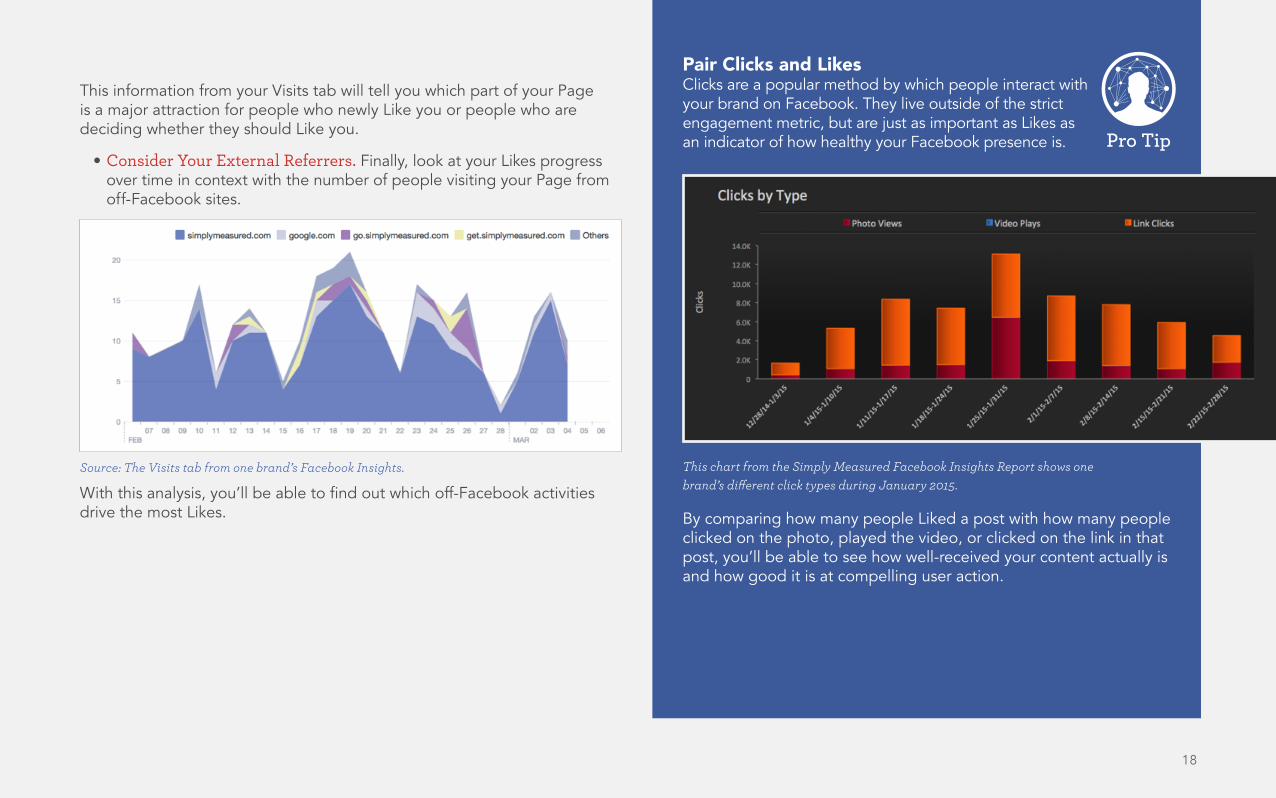
Pair Clicks and Likes Clicks are a popular method by which people interact with your brand on Facebook. They live outside of the strict engagement metric, but are just as important as Likes as an indicator of how healthy your Facebook presence is.
By comparing how many people Liked a post with how many people clicked on the photo, played the video, or clicked on the link in that post, you’ll be able to see how well-received your content actually is and how good it is at compelling user action.
This chart from the Simply Measured Facebook Insights Report shows one brand’s different click types during January 2015.
Source: The Visits tab from one brand’s Facebook Insights.
Pro Tip
19
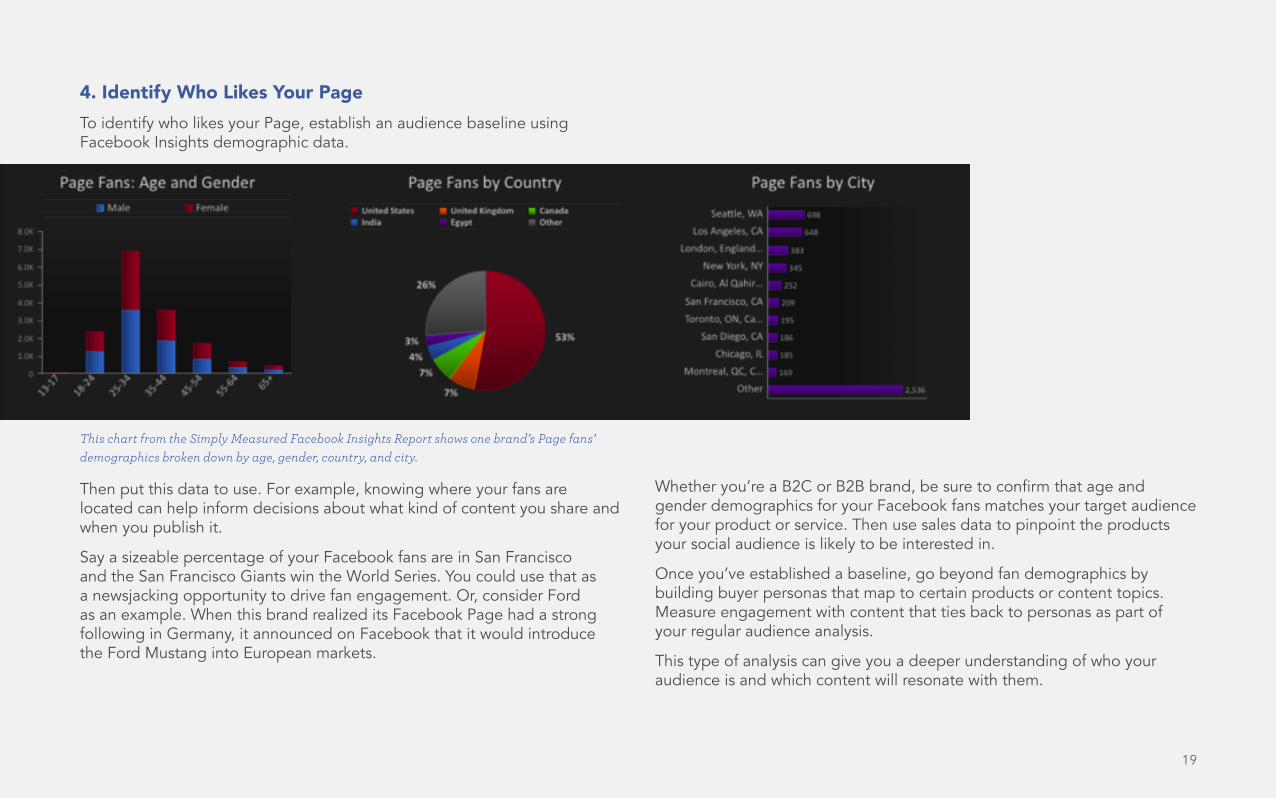
4. Identify Who Likes Your PageTo identify who likes your Page, establish an audience baseline using Facebook Insights demographic data.
Then put this data to use. For example, knowing where your fans are located can help inform decisions about what kind of content you share and when you publish it.
Say a sizeable percentage of your Facebook fans are in San Francisco and the San Francisco Giants win the World Series. You could use that as a newsjacking opportunity to drive fan engagement. Or, consider Ford as an example. When this brand realized its Facebook Page had a strong following in Germany, it announced on Facebook that it would introduce the Ford Mustang into European markets.
Whether you’re a B2C or B2B brand, be sure to confirm that age and gender demographics for your Facebook fans matches your target audience for your product or service. Then use sales data to pinpoint the products your social audience is likely to be interested in.
Once you’ve established a baseline, go beyond fan demographics by building buyer personas that map to certain products or content topics. Measure engagement with content that ties back to personas as part of your regular audience analysis.
This type of analysis can give you a deeper understanding of who your audience is and which content will resonate with them.
This chart from the Simply Measured Facebook Insights Report shows one brand’s Page fans’ demographics broken down by age, gender, country, and city.
20
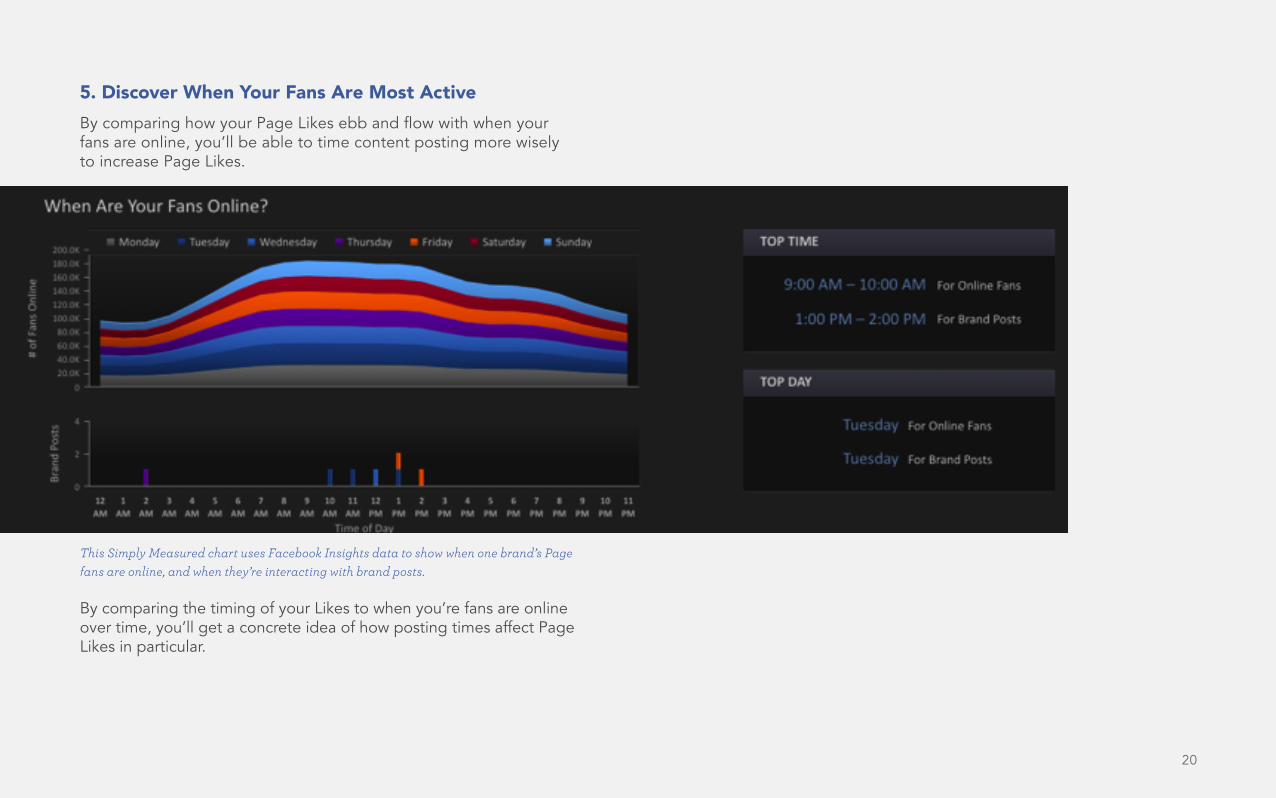
5. Discover When Your Fans Are Most ActiveBy comparing how your Page Likes ebb and flow with when your fans are online, you’ll be able to time content posting more wisely to increase Page Likes.
By comparing the timing of your Likes to when you’re fans are online over time, you’ll get a concrete idea of how posting times affect Page Likes in particular.
This Simply Measured chart uses Facebook Insights data to show when one brand’s Page fans are online, and when they’re interacting with brand posts.
21
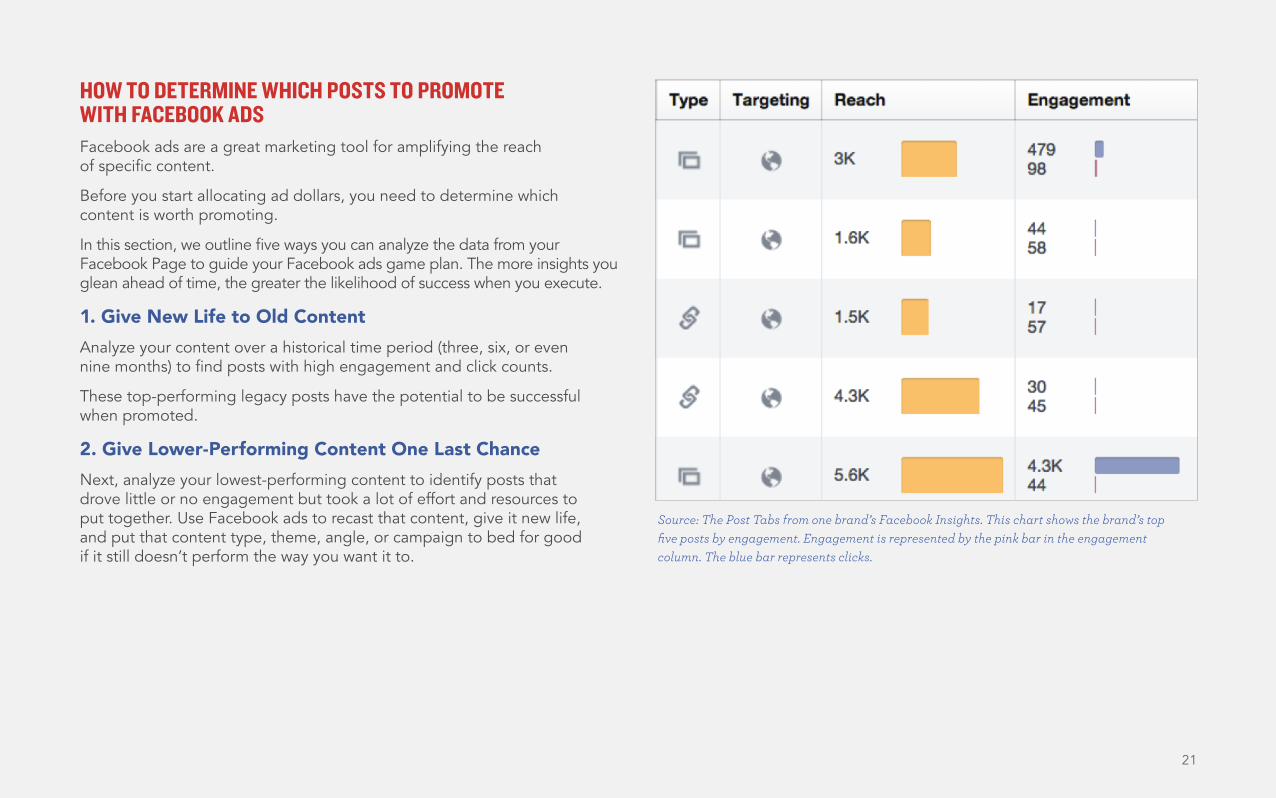
HOW TO DETERMINE WHICH POSTS TO PROMOTE WITH FACEBOOK ADSFacebook ads are a great marketing tool for amplifying the reach of specific content.
Before you start allocating ad dollars, you need to determine which content is worth promoting.
In this section, we outline five ways you can analyze the data from your Facebook Page to guide your Facebook ads game plan. The more insights you glean ahead of time, the greater the likelihood of success when you execute.
1. Give New Life to Old ContentAnalyze your content over a historical time period (three, six, or even nine months) to find posts with high engagement and click counts.
These top-performing legacy posts have the potential to be successful when promoted.
2. Give Lower-Performing Content One Last ChanceNext, analyze your lowest-performing content to identify posts that drove little or no engagement but took a lot of effort and resources to put together. Use Facebook ads to recast that content, give it new life, and put that content type, theme, angle, or campaign to bed for good if it still doesn’t perform the way you want it to.
Source: The Post Tabs from one brand’s Facebook Insights. This chart shows the brand’s top five posts by engagement. Engagement is represented by the pink bar in the engagement column. The blue bar represents clicks.
22
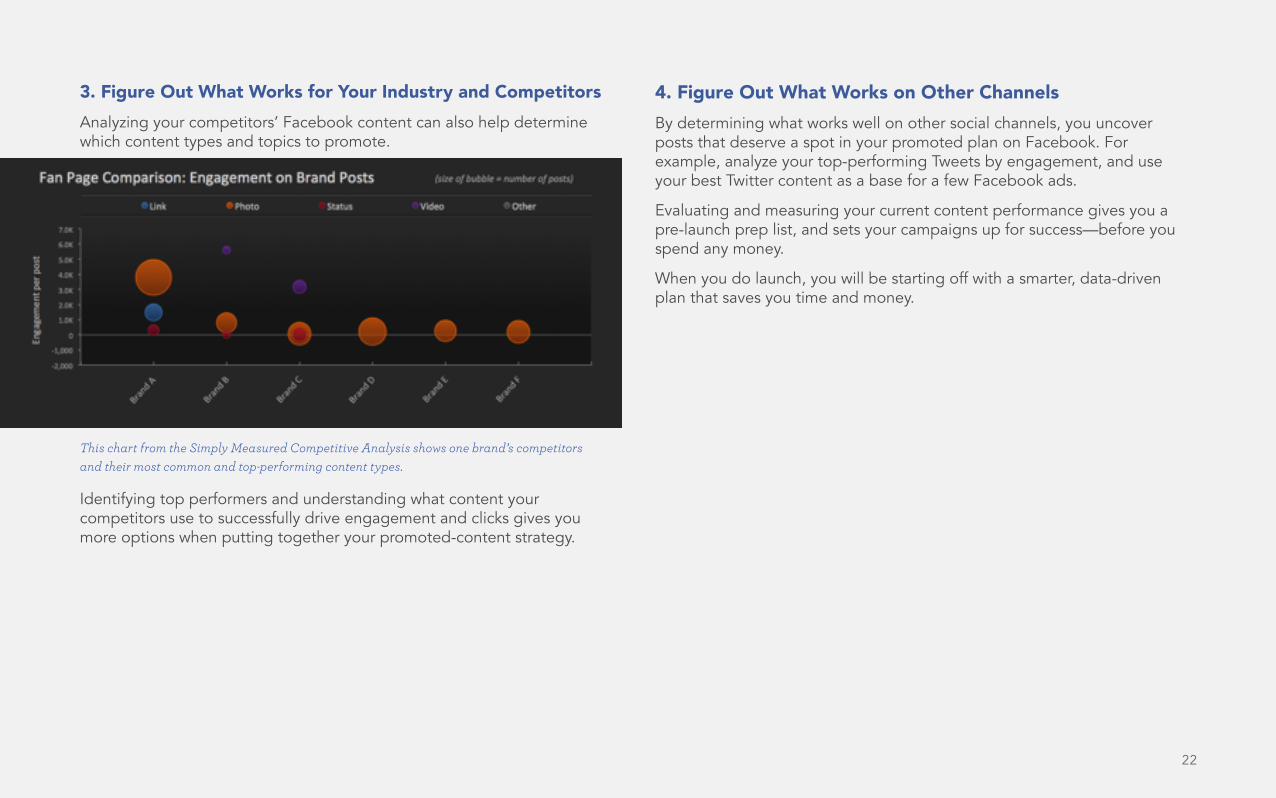
3. Figure Out What Works for Your Industry and CompetitorsAnalyzing your competitors’ Facebook content can also help determine which content types and topics to promote.
Identifying top performers and understanding what content your competitors use to successfully drive engagement and clicks gives you more options when putting together your promoted-content strategy.
4. Figure Out What Works on Other ChannelsBy determining what works well on other social channels, you uncover posts that deserve a spot in your promoted plan on Facebook. For example, analyze your top-performing Tweets by engagement, and use your best Twitter content as a base for a few Facebook ads.
Evaluating and measuring your current content performance gives you a pre-launch prep list, and sets your campaigns up for success—before you spend any money.
When you do launch, you will be starting off with a smarter, data-driven plan that saves you time and money.
This chart from the Simply Measured Competitive Analysis shows one brand’s competitors and their most common and top-performing content types.
23
HOW TO MEASURE THE IMPACT OF VISUAL CONTENTVisual content has become more and more impactful as a way to reach potential customers on social. But with so many services for creating and distributing images, and so many types of visual content, from photos to videos, how can you tell which works best for your brand? Here are some quick ways to analyze your visual content and create a strategy based on previous success.
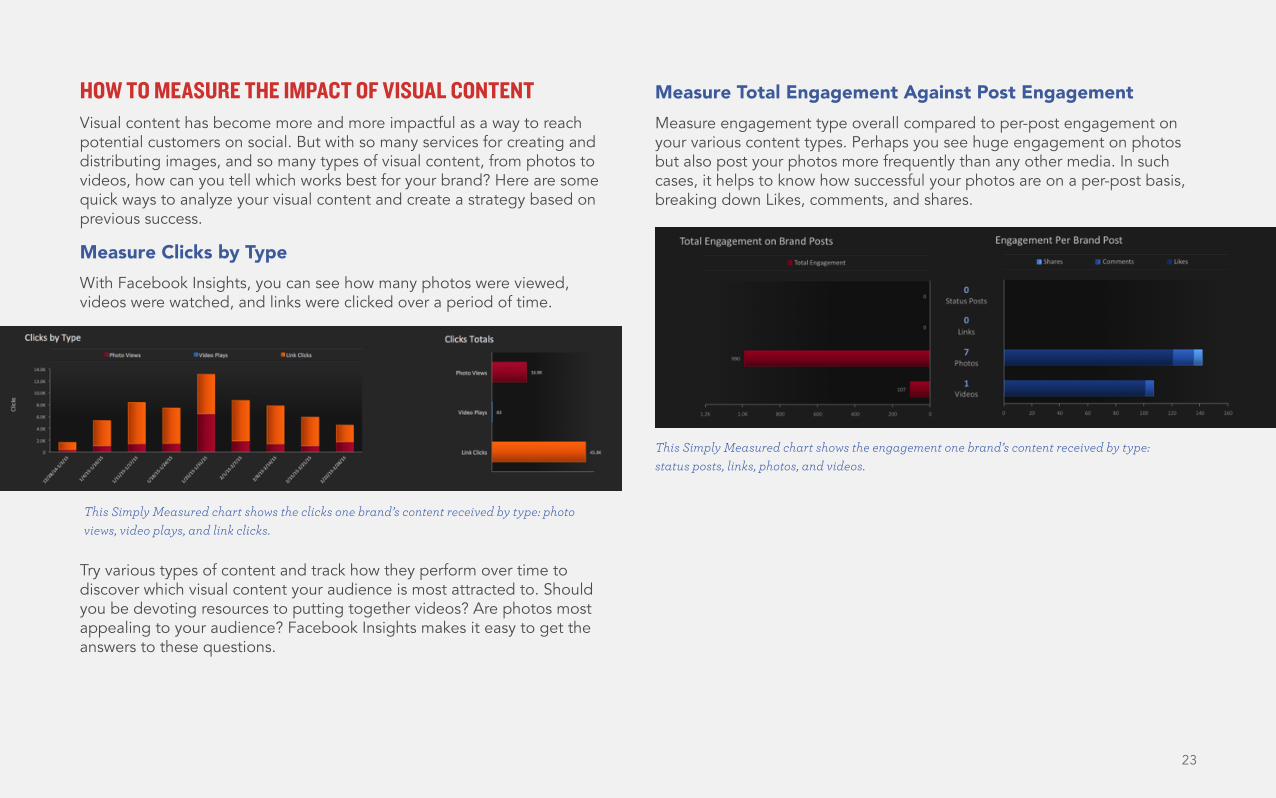
Measure Clicks by TypeWith Facebook Insights, you can see how many photos were viewed, videos were watched, and links were clicked over a period of time.
Try various types of content and track how they perform over time to discover which visual content your audience is most attracted to. Should you be devoting resources to putting together videos? Are photos most appealing to your audience? Facebook Insights makes it easy to get the answers to these questions.
Measure Total Engagement Against Post EngagementMeasure engagement type overall compared to per-post engagement on your various content types. Perhaps you see huge engagement on photos but also post your photos more frequently than any other media. In such cases, it helps to know how successful your photos are on a per-post basis, breaking down Likes, comments, and shares.
This Simply Measured chart shows the clicks one brand’s content received by type: photo views, video plays, and link clicks.
This Simply Measured chart shows the engagement one brand’s content received by type: status posts, links, photos, and videos.
24
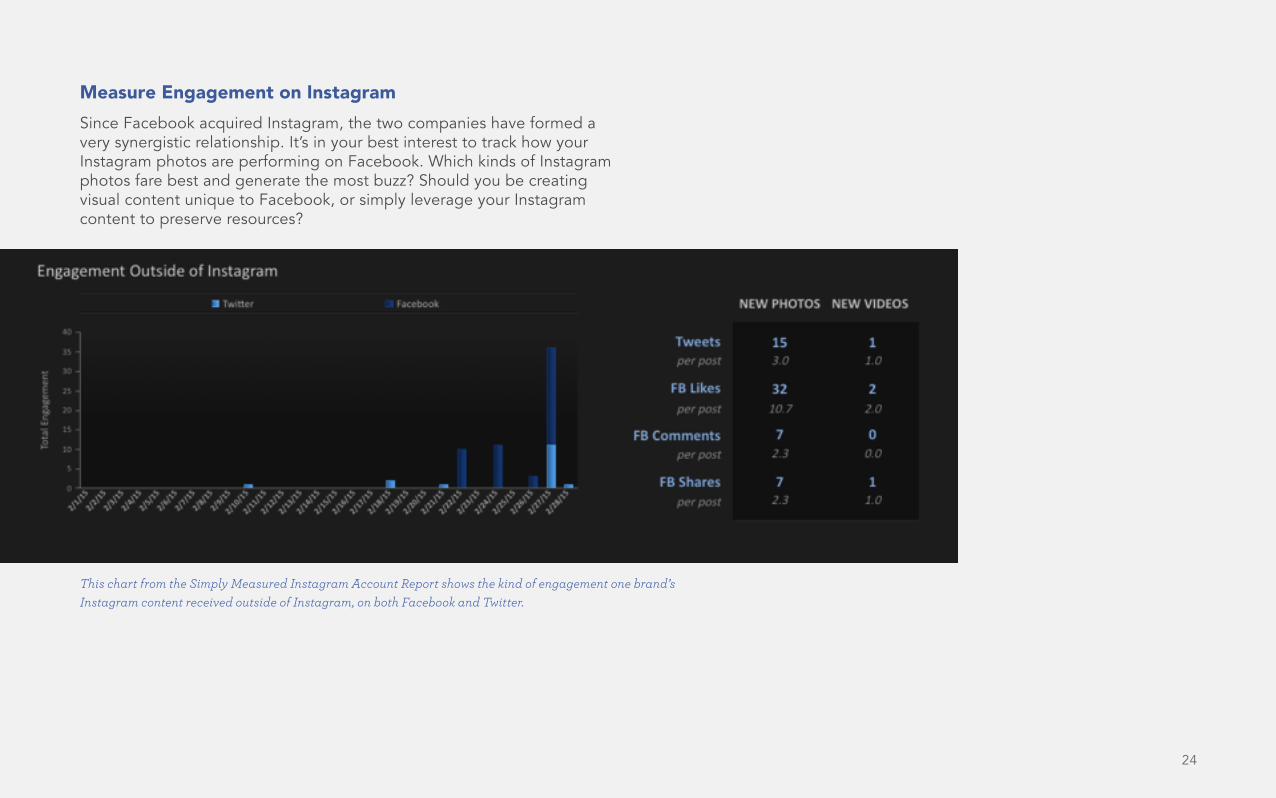
Measure Engagement on InstagramSince Facebook acquired Instagram, the two companies have formed a very synergistic relationship. It’s in your best interest to track how your Instagram photos are performing on Facebook. Which kinds of Instagram photos fare best and generate the most buzz? Should you be creating visual content unique to Facebook, or simply leverage your Instagram content to preserve resources?
This chart from the Simply Measured Instagram Account Report shows the kind of engagement one brand’s Instagram content received outside of Instagram, on both Facebook and Twitter.
25
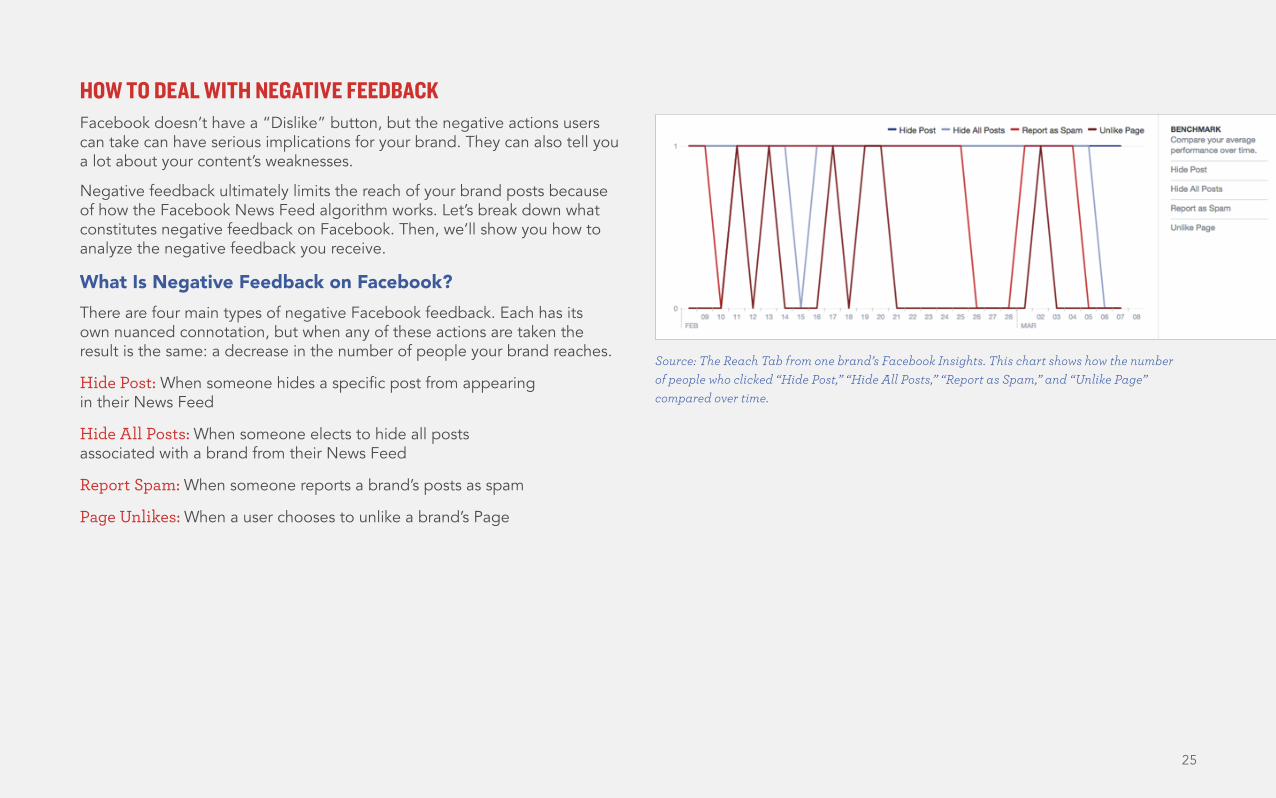
HOW TO DEAL WITH NEGATIVE FEEDBACKFacebook doesn’t have a “Dislike” button, but the negative actions users can take can have serious implications for your brand. They can also tell you a lot about your content’s weaknesses.
Negative feedback ultimately limits the reach of your brand posts because of how the Facebook News Feed algorithm works. Let’s break down what constitutes negative feedback on Facebook. Then, we’ll show you how to analyze the negative feedback you receive.
What Is Negative Feedback on Facebook?There are four main types of negative Facebook feedback. Each has its own nuanced connotation, but when any of these actions are taken the result is the same: a decrease in the number of people your brand reaches.
Hide Post: When someone hides a specific post from appearing in their News Feed
Hide All Posts: When someone elects to hide all posts associated with a brand from their News Feed
Report Spam: When someone reports a brand’s posts as spam
Page Unlikes: When a user chooses to unlike a brand’s Page
Source: The Reach Tab from one brand’s Facebook Insights. This chart shows how the number of people who clicked “Hide Post,” “Hide All Posts,” “Report as Spam,” and “Unlike Page” compared over time.
26
Segment Negative Feedback Actions Segmenting negative feedback can help you understand how it’s affecting your brand. For example, a person hiding your brand’s individual post is a less severe form of negative feedback than if they were to hide all of your posts. When a user hides all of your posts, you lose the ability to share content with them in the future.
That said, viewing individual feedback metrics like “Hide All Posts” can give you an accurate picture of how many of your fans are opting out of seeing your content. On the other hand, tracking Page unlikes can show your effectiveness at retaining fans.
When considered over time, peaks in negative feedback will quickly notify you when you’re off track. By cross-referencing these spikes with the type of posts and content you published around that time, you may be able to identify the root cause.
Create Benchmarks for Your BrandAcceptable levels of negative feedback vary by brand. The volume of negative feedback you receive is influenced by how much reach you get generally, the size and quality of your audience, and your industry.
Since these factors are unique to your brand, one of the best ways to determine acceptable feedback levels is to establish benchmarks based on the average volume of negative feedback you receive, either by day or by post. Then set goals for decreasing your negative feedback average to help maximize your post reach.
27
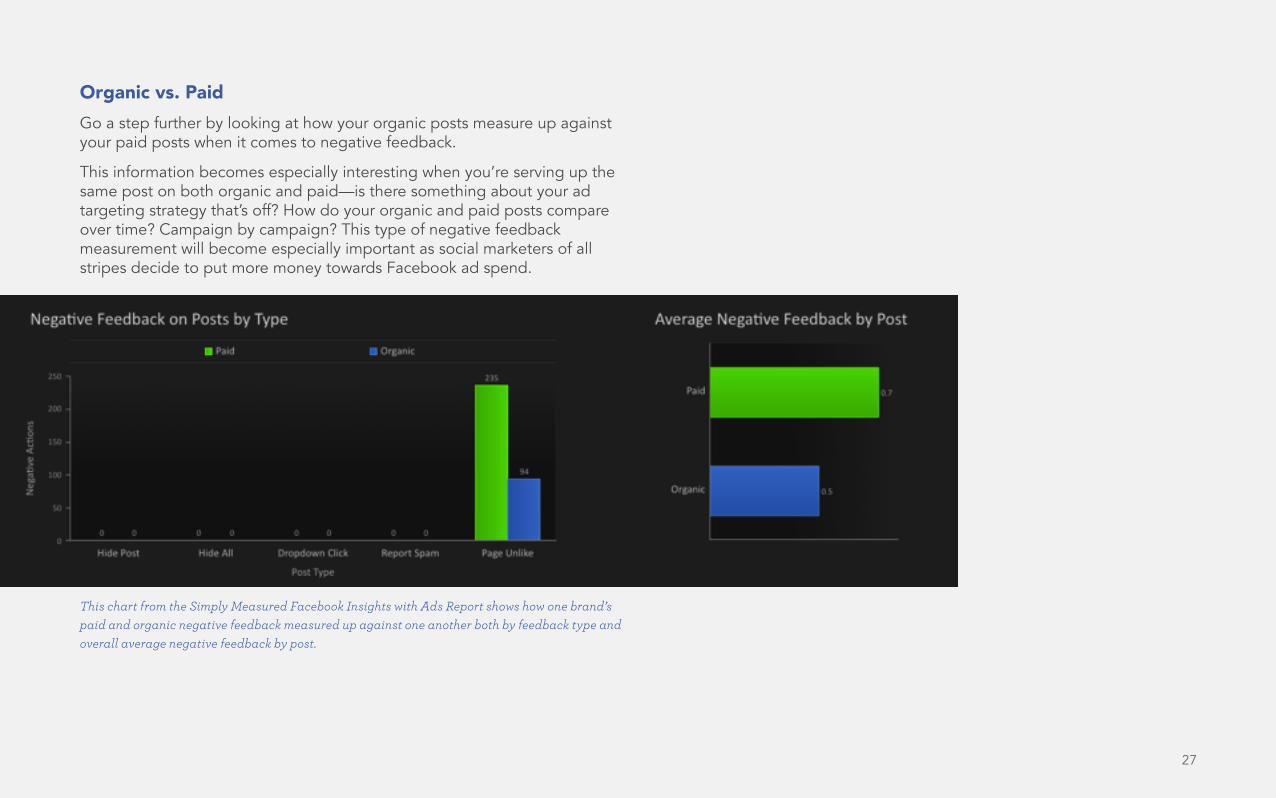
Organic vs. PaidGo a step further by looking at how your organic posts measure up against your paid posts when it comes to negative feedback.
This information becomes especially interesting when you’re serving up the same post on both organic and paid—is there something about your ad targeting strategy that’s off? How do your organic and paid posts compare over time? Campaign by campaign? This type of negative feedback measurement will become especially important as social marketers of all stripes decide to put more money towards Facebook ad spend.
This chart from the Simply Measured Facebook Insights with Ads Report shows how one brand’s paid and organic negative feedback measured up against one another both by feedback type and overall average negative feedback by post.

28
HOW TO IDENTIFY GROWTH OPPORTUNITIES
1. Discover the Pages and People Mentioning YouFinding Pages or people that mention your Page gives you the opportunity to develop content and nurture that relationship, ultimately leveraging another Page’s audience.
By identifying the top posters on your brand Page or your mentioner’s Page, you’ll get a good idea of whether or not your target audiences overlap significantly and where your outreach should start.
For example, let’s take a look at Ducati’s Facebook top posters by both engagement and number of posts:
ADVANCED ANALYSES
These charts from the Simply Measured Facebook Fan Page Report show Ducati’s top posters by total engagement and top users by number of posts for the given time period.
Top Posters by Total Engagement
Ducatisti Integralisti
Zacks Garage
Franck Carini
Ben Kreten
(The users whose posts on your timeline have received the most engagement)
Melanie Kreten
Juan Carlos
Kelly Cook
Vijay Nalanaglu
Yumi Kawaguchi
Top Users by # of Posts
Ducatisti Integralisti
Ducatisti Integralisti
Valentino Rossi Fan Club
Alpinestars
(The users who have posted most frequently on your timeline)
SPEED
Alex Tondini
Franck Carini
Juan Carlos
1,052
37
29
19
17
13
9
8
7
Ben Kreten
8
5
3
3
3
3
2
2
2

29
Right away, it’s clear that Ducatisti Integralisti is both the most frequent poster on Ducati’s Page, and that their posts have received the most engagement of anything posted on Ducati’s timeline. To get a closer look at that engagement, we can open this data in Excel, and go to the “Posters” tab.
Of the engagement on Ducatisti Integralisti posts to Ducati’s wall, 219 were shares and 786 were Likes. This suggests that there is both an overlap of Page fans and interest. Since Ducatisti Integralisti is a Ducati-focused site, this isn’t surprising, but it’s very possible that not everyone who Likes that page also Likes the Ducati page.
Ducati could take advantage of this opportunity by tagging Ducatisti Integralisti in their Page Posts. With Facebook’s algorithm, this gives Ducati potential to show up in relevant, fresh feeds.
According to Facebook: “We look at many factors to make sure the most relevant stories appear in News Feed, including which posts are getting the most engagement (such as“Likes,” comments, shares and clicks) across all of Facebook. We also consider which posts are getting the most engagement from people who Like both the Page that posted and the Page that was tagged.”
This chart from a Simply Measured report highlights Ducatisti Integralisti’s engagement breakdown for the given time period.
30
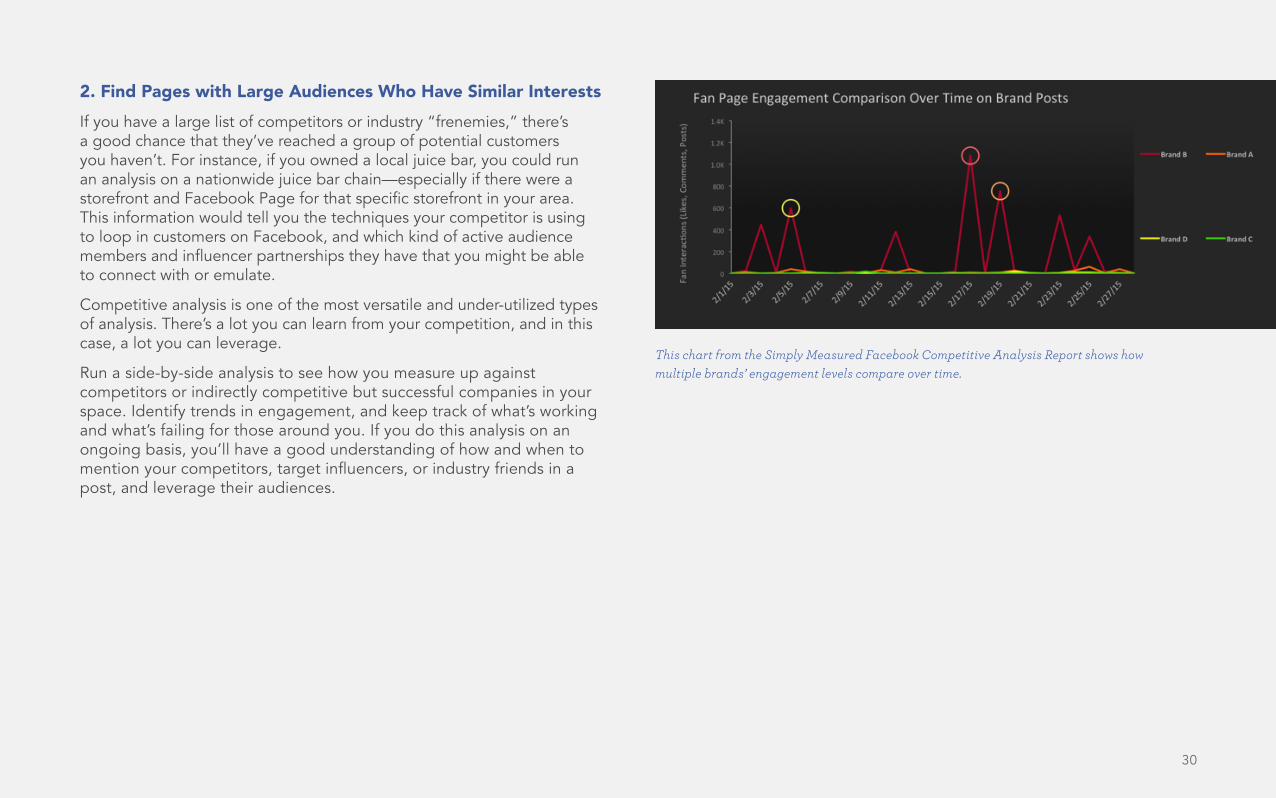
2. Find Pages with Large Audiences Who Have Similar InterestsIf you have a large list of competitors or industry “frenemies,” there’s a good chance that they’ve reached a group of potential customers you haven’t. For instance, if you owned a local juice bar, you could run an analysis on a nationwide juice bar chain—especially if there were a storefront and Facebook Page for that specific storefront in your area. This information would tell you the techniques your competitor is using to loop in customers on Facebook, and which kind of active audience members and influencer partnerships they have that you might be able to connect with or emulate.
Competitive analysis is one of the most versatile and under-utilized types of analysis. There’s a lot you can learn from your competition, and in this case, a lot you can leverage.
Run a side-by-side analysis to see how you measure up against competitors or indirectly competitive but successful companies in your space. Identify trends in engagement, and keep track of what’s working and what’s failing for those around you. If you do this analysis on an ongoing basis, you’ll have a good understanding of how and when to mention your competitors, target influencers, or industry friends in a post, and leverage their audiences.
This chart from the Simply Measured Facebook Competitive Analysis Report shows how multiple brands’ engagement levels compare over time.
31
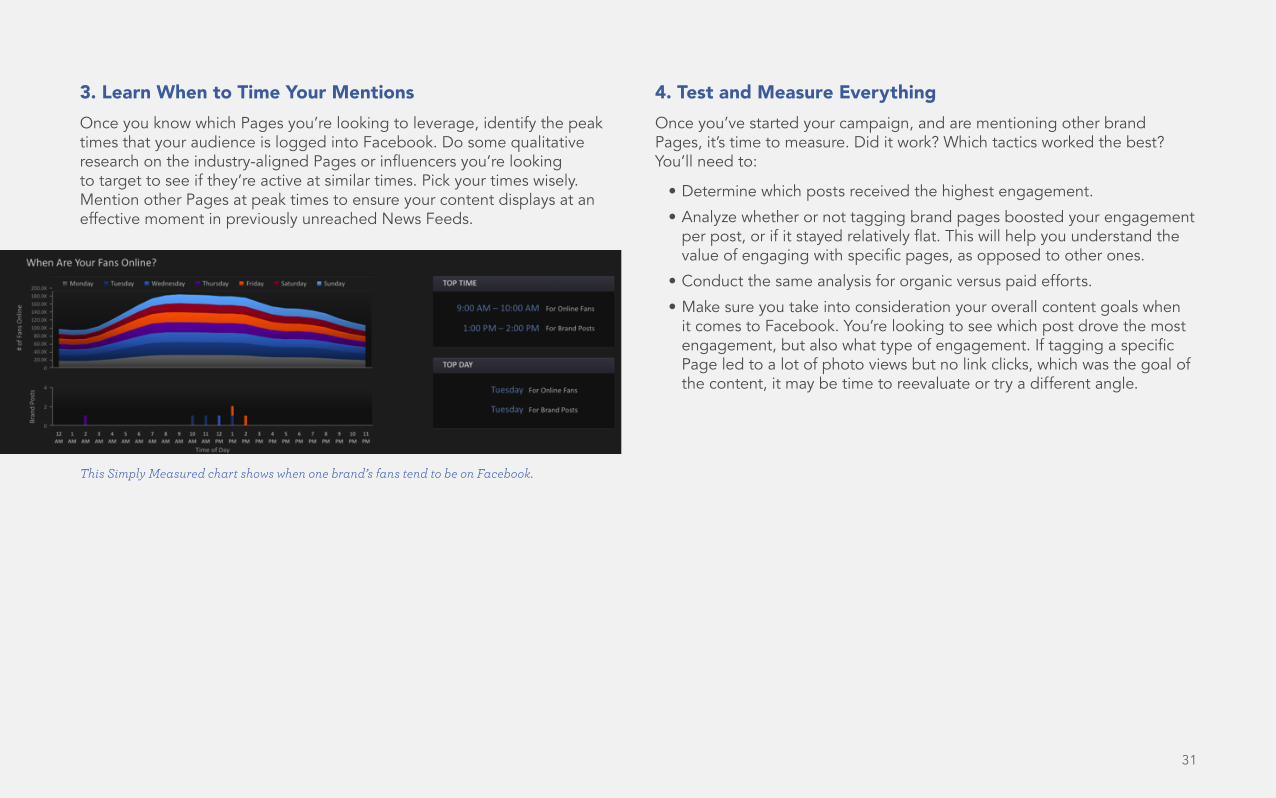
3. Learn When to Time Your MentionsOnce you know which Pages you’re looking to leverage, identify the peak times that your audience is logged into Facebook. Do some qualitative research on the industry-aligned Pages or influencers you’re looking to target to see if they’re active at similar times. Pick your times wisely. Mention other Pages at peak times to ensure your content displays at an effective moment in previously unreached News Feeds.
4. Test and Measure EverythingOnce you’ve started your campaign, and are mentioning other brand Pages, it’s time to measure. Did it work? Which tactics worked the best? You’ll need to:
• Determine which posts received the highest engagement.
• Analyze whether or not tagging brand pages boosted your engagement per post, or if it stayed relatively flat. This will help you understand the value of engaging with specific pages, as opposed to other ones.
• Conduct the same analysis for organic versus paid efforts.
• Make sure you take into consideration your overall content goals when it comes to Facebook. You’re looking to see which post drove the most engagement, but also what type of engagement. If tagging a specific Page led to a lot of photo views but no link clicks, which was the goal of the content, it may be time to reevaluate or try a different angle.
This Simply Measured chart shows when one brand’s fans tend to be on Facebook.
32
HOW TO PERFORM A COMPETITIVE INDUSTRY ANALYSISBefore you set your social strategy, it’s essential to have a solid understanding of your brand’s particular competitive landscape, both online and off. Competitive analysis helps you identify important trends, impactful tactics, and new competition as you plan your social marketing efforts.
In addition to keeping you updated on your competitors’ activities, a solid competitive analysis empowers you with:
Market Context: Study the norms for your market, especially on social where longstanding benchmarks don’t exist.
Opportunities for Growth and Expansion: Inform your roadmap for the next week, quarter, and year.
Content Insight: Learn which content increases engagement and social audience size among your competitors.
Fresh Thoughts: Spark new ideas for staying competitive.
33
Identify Your CompetitionOne way to identify potential Facebook competitors is to look at the three following factors.
Share of Conversation Are there brands being discussed organically in conversations that you’d like your brand to dominate?
Share of Audience How many people follow that brand on different networks? Do these people align with your target audience and ideal customer?
Share of Engagement Which of your competitors are excelling on Facebook for engagement? Which are faltering?
By focusing on these three factors, you can compile lists of competitors to analyze and learn from.
34
Metrics to MeasurePage Like Growth How many Page Likes are your competitors gaining on a weekly or monthly basis? Jot down their baselines now and then check in regularly.
It’s also important to watch for outliers and spikes in Page Like growth. Where are your competitors finding success? Which campaigns are working especially well? This will help you look for key factors to emulate or avoid.
Engagement Levels How often do people comment, like, and share your competitors’ content on social and tag or mention them? These engagement stats are a signal that their content and tactics are resonating (or not) with people.
Benchmarking engagement levels and noticing changes over a period of time will allow you to zero in on brand content that resonates with your own target audience.
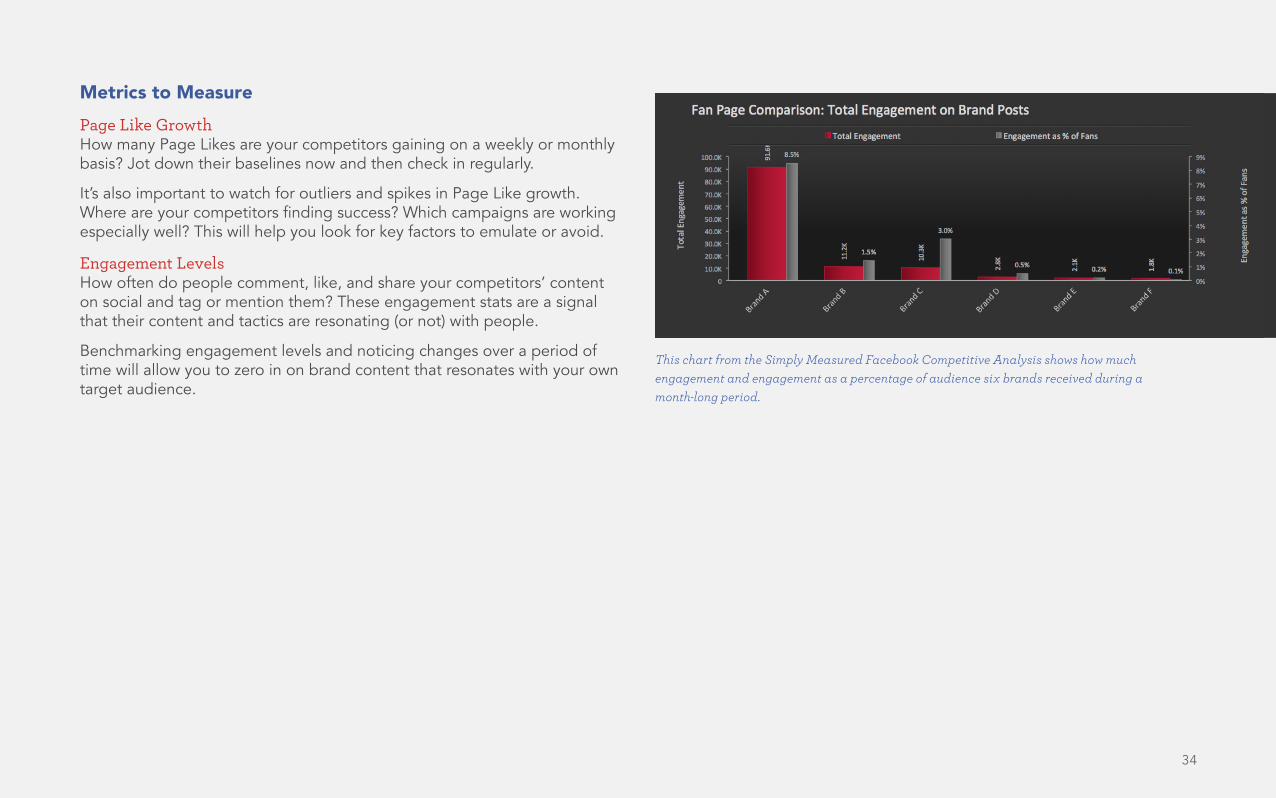
This chart from the Simply Measured Facebook Competitive Analysis shows how much engagement and engagement as a percentage of audience six brands received during a month-long period.
35
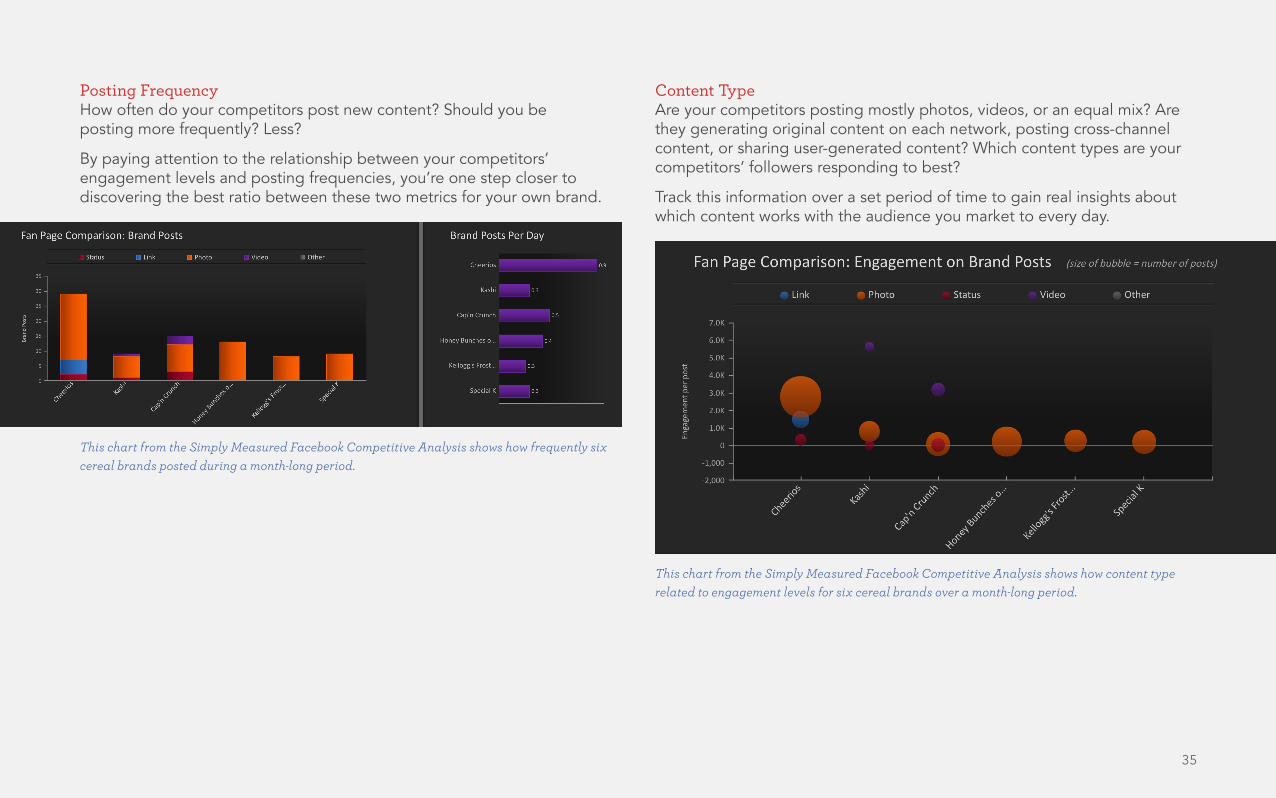
Posting Frequency How often do your competitors post new content? Should you be posting more frequently? Less?
By paying attention to the relationship between your competitors’ engagement levels and posting frequencies, you’re one step closer to discovering the best ratio between these two metrics for your own brand.
Content Type Are your competitors posting mostly photos, videos, or an equal mix? Are they generating original content on each network, posting cross-channel content, or sharing user-generated content? Which content types are your competitors’ followers responding to best?
Track this information over a set period of time to gain real insights about which content works with the audience you market to every day.
This chart from the Simply Measured Facebook Competitive Analysis shows how frequently six cereal brands posted during a month-long period.
This chart from the Simply Measured Facebook Competitive Analysis shows how content type related to engagement levels for six cereal brands over a month-long period.
36
Search Results Find out what your competitors’ CMOs, social media managers, and community managers are saying about their social marketing efforts. Look for industry articles and other write-ups.
Supplement the data you’ve digested in your analyses with strategic insights straight from the mouths and blogs of your competitors themselves.
Create four different competitive groups to keep track of on a regular basis: one that holds brands with impressive follower counts, one that holds brands with staggering engagement levels, one that holds brands with high posting frequencies, and one that holds brands with low posting frequencies.
Watching how these competitive groups evolve will give you a good idea of your industry’s social trends.
Pro Tip
37
Establish Benchmarks and Brand AveragesIn order to keep your analysis manageable and effective, you need to create a reliable, data-based benchmarking process.
That means it’s time to calculate averages, which represent certain minimum standards over a period of time in relationship to your competitors’ performance. These averages can help you plan your tactics and activities for the coming quarters.
You can do this by taking averages from the members of your competitive lists and benchmarking period-over-period for Facebook. We recommend monthly reviews or, at a minimum, quarterly.
Benchmarks vary from industry to industry, depending on your priorities and goals. You also may have to update the metrics you’re focusing on as the year unfolds, depending on what your monthly competitive analyses show you.
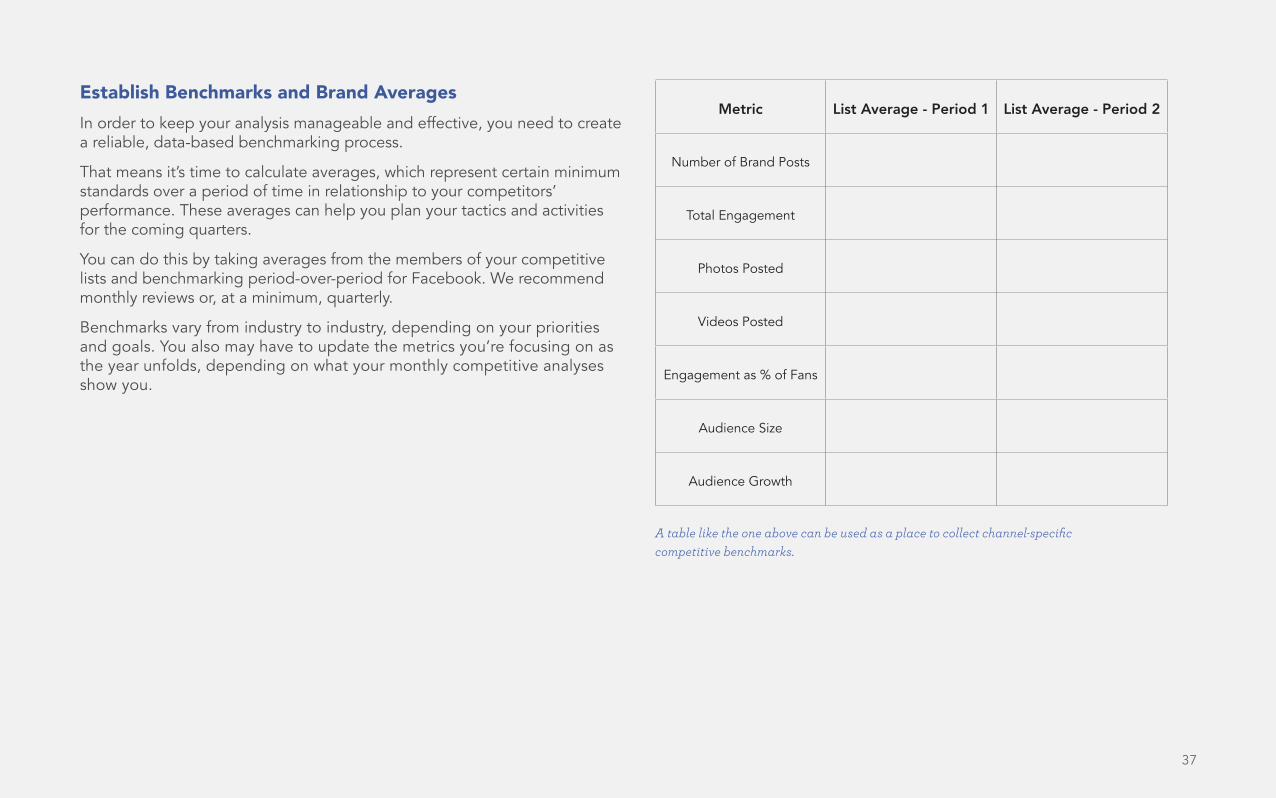
Metric List Average - Period 1 List Average - Period 2
Number of Brand Posts
Total Engagement
Photos Posted
Videos Posted
Engagement as % of Fans
Audience Size
Audience Growth
A table like the one above can be used as a place to collect channel-specific competitive benchmarks.
38
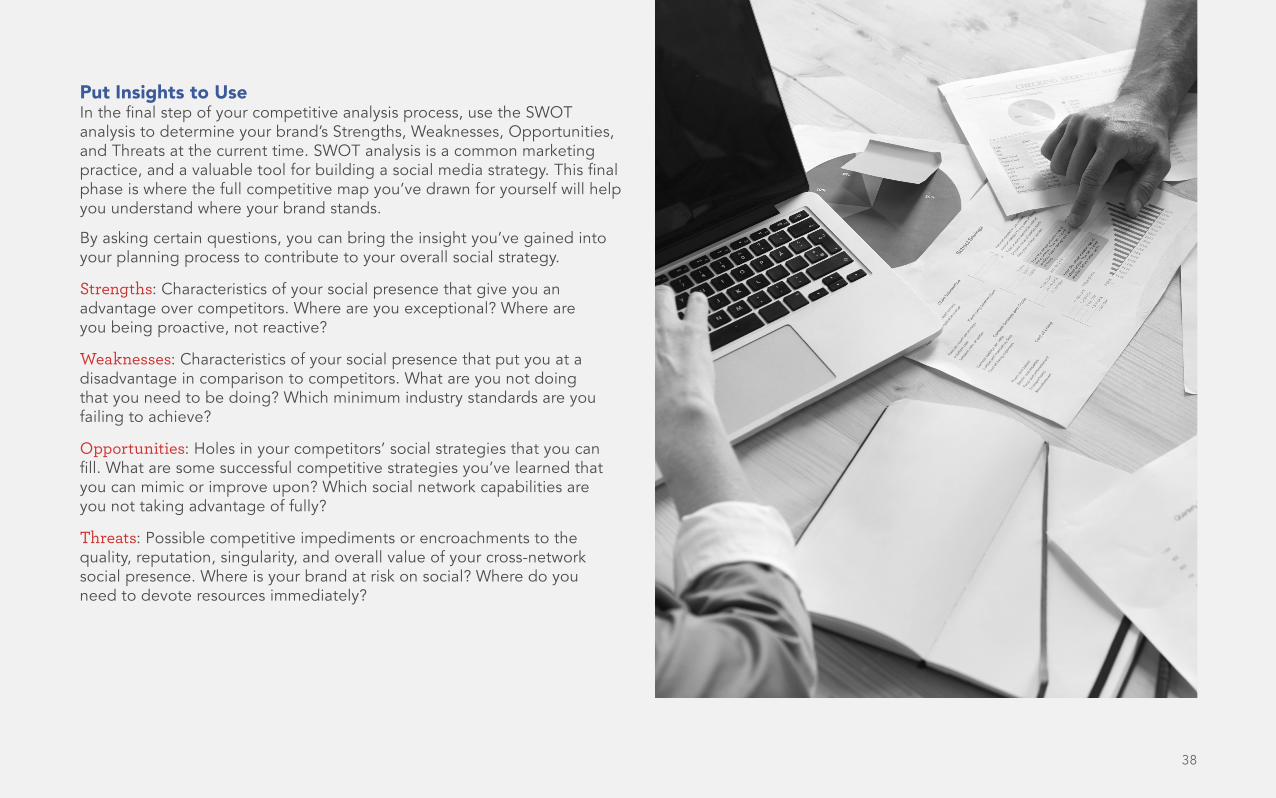
Put Insights to Use In the final step of your competitive analysis process, use the SWOT analysis to determine your brand’s Strengths, Weaknesses, Opportunities, and Threats at the current time. SWOT analysis is a common marketing practice, and a valuable tool for building a social media strategy. This final phase is where the full competitive map you’ve drawn for yourself will help you understand where your brand stands.
By asking certain questions, you can bring the insight you’ve gained into your planning process to contribute to your overall social strategy.
Strengths: Characteristics of your social presence that give you an advantage over competitors. Where are you exceptional? Where are you being proactive, not reactive?
Weaknesses: Characteristics of your social presence that put you at a disadvantage in comparison to competitors. What are you not doing that you need to be doing? Which minimum industry standards are you failing to achieve?
Opportunities: Holes in your competitors’ social strategies that you can fill. What are some successful competitive strategies you’ve learned that you can mimic or improve upon? Which social network capabilities are you not taking advantage of fully?
Threats: Possible competitive impediments or encroachments to the quality, reputation, singularity, and overall value of your cross-network social presence. Where is your brand at risk on social? Where do you need to devote resources immediately?
39
HOW TO BUILD VIDEO CONTENT USING INSIGHTS DATAFacebook is putting serious weight behind native videos, which now autoplay in users feeds. Many marketers on Facebook have started to see more reach from videos than other media types, including photos.
While videos may be seeing more organic reach than photos, producing high-quality and relevant videos can be a much bigger task than producing photos, so many marketers are tentative to focus too much effort on this content type.
How do you ensure that your time is well spent on a Facebook video? Simple: You use your data. Facebook provides some crucial metrics that you may be overlooking when planning your videos.
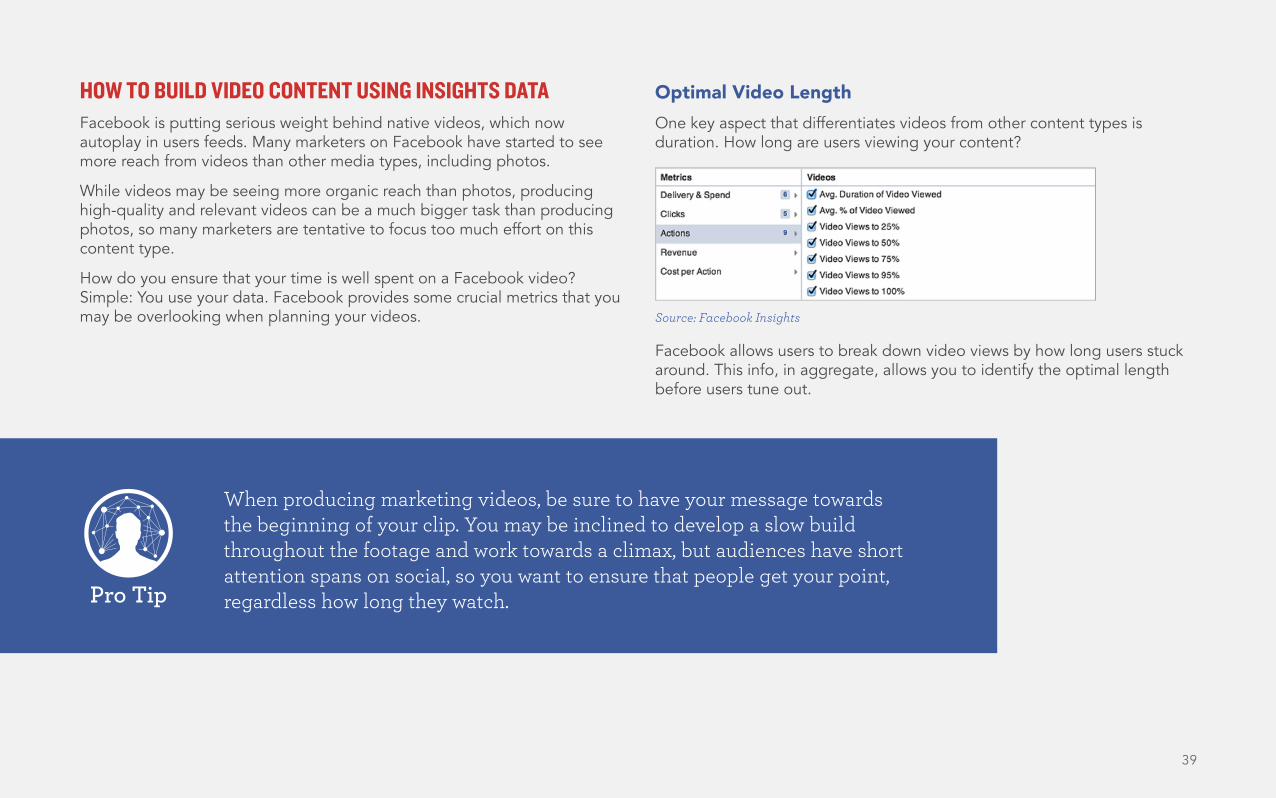
Optimal Video Length One key aspect that differentiates videos from other content types is duration. How long are users viewing your content?
Facebook allows users to break down video views by how long users stuck around. This info, in aggregate, allows you to identify the optimal length before users tune out.
Source: Facebook Insights
When producing marketing videos, be sure to have your message towards the beginning of your clip. You may be inclined to develop a slow build throughout the footage and work towards a climax, but audiences have short attention spans on social, so you want to ensure that people get your point, regardless how long they watch. Pro Tip
40
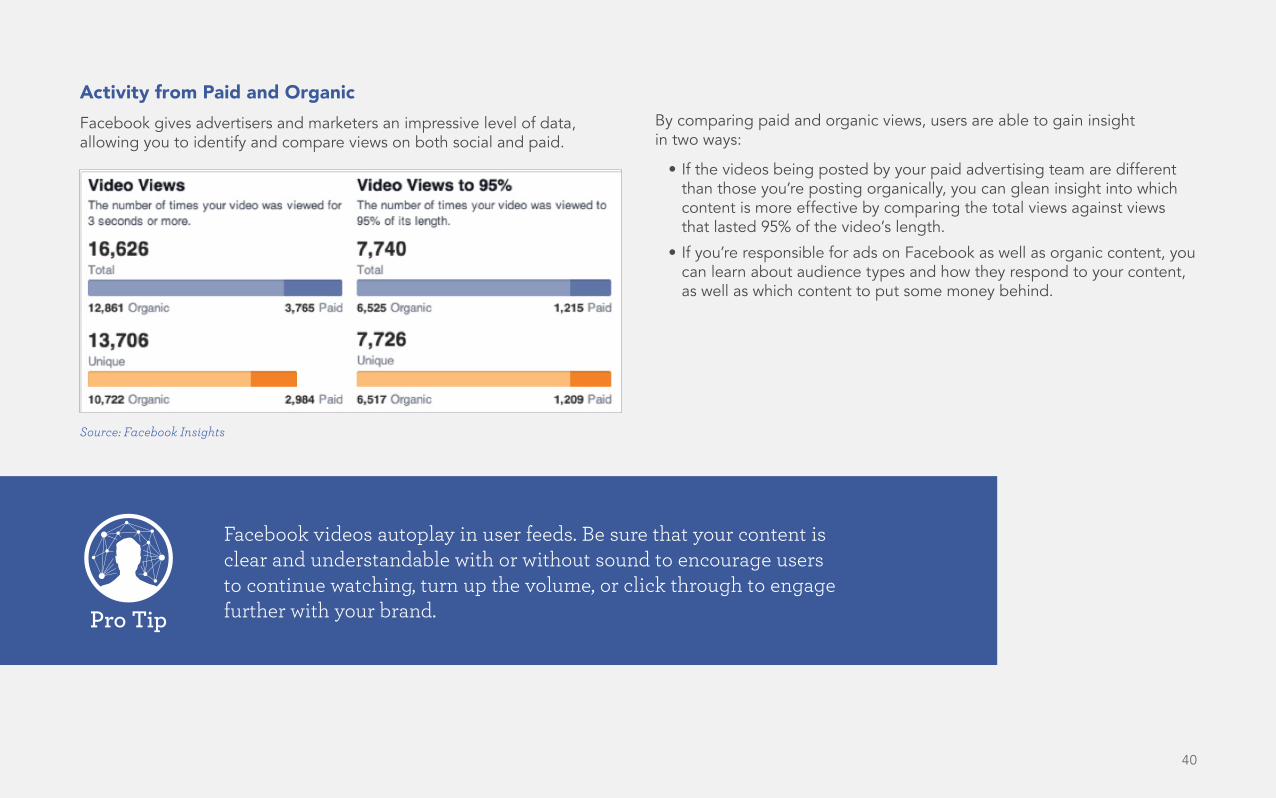
Activity from Paid and OrganicFacebook gives advertisers and marketers an impressive level of data, allowing you to identify and compare views on both social and paid.
By comparing paid and organic views, users are able to gain insight in two ways:
• If the videos being posted by your paid advertising team are different than those you’re posting organically, you can glean insight into which content is more effective by comparing the total views against views that lasted 95% of the video’s length.
• If you’re responsible for ads on Facebook as well as organic content, you can learn about audience types and how they respond to your content, as well as which content to put some money behind.
Source: Facebook Insights
Facebook videos autoplay in user feeds. Be sure that your content is clear and understandable with or without sound to encourage users to continue watching, turn up the volume, or click through to engage further with your brand.Pro Tip
41
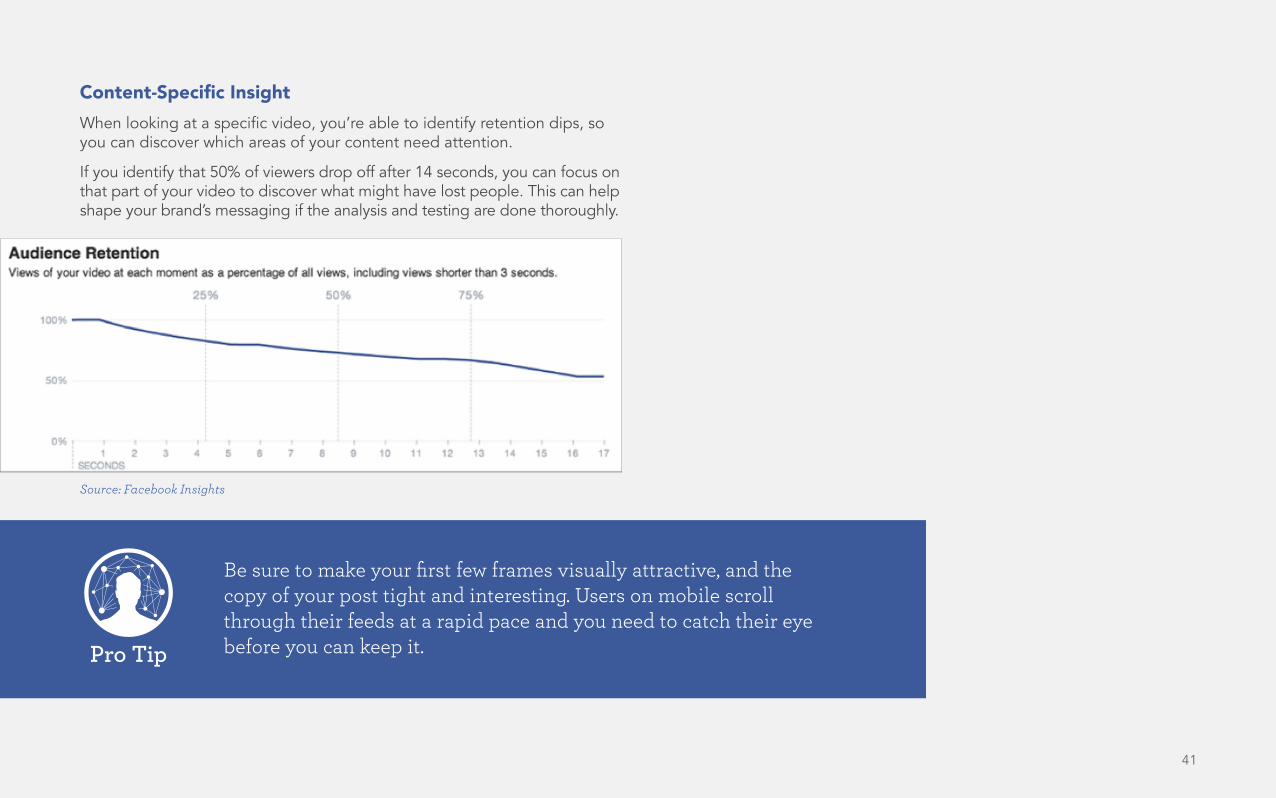
Content-Specific InsightWhen looking at a specific video, you’re able to identify retention dips, so you can discover which areas of your content need attention.
If you identify that 50% of viewers drop off after 14 seconds, you can focus on that part of your video to discover what might have lost people. This can help shape your brand’s messaging if the analysis and testing are done thoroughly.
Source: Facebook Insights
Be sure to make your first few frames visually attractive, and the copy of your post tight and interesting. Users on mobile scroll through their feeds at a rapid pace and you need to catch their eye before you can keep it.Pro Tip
42
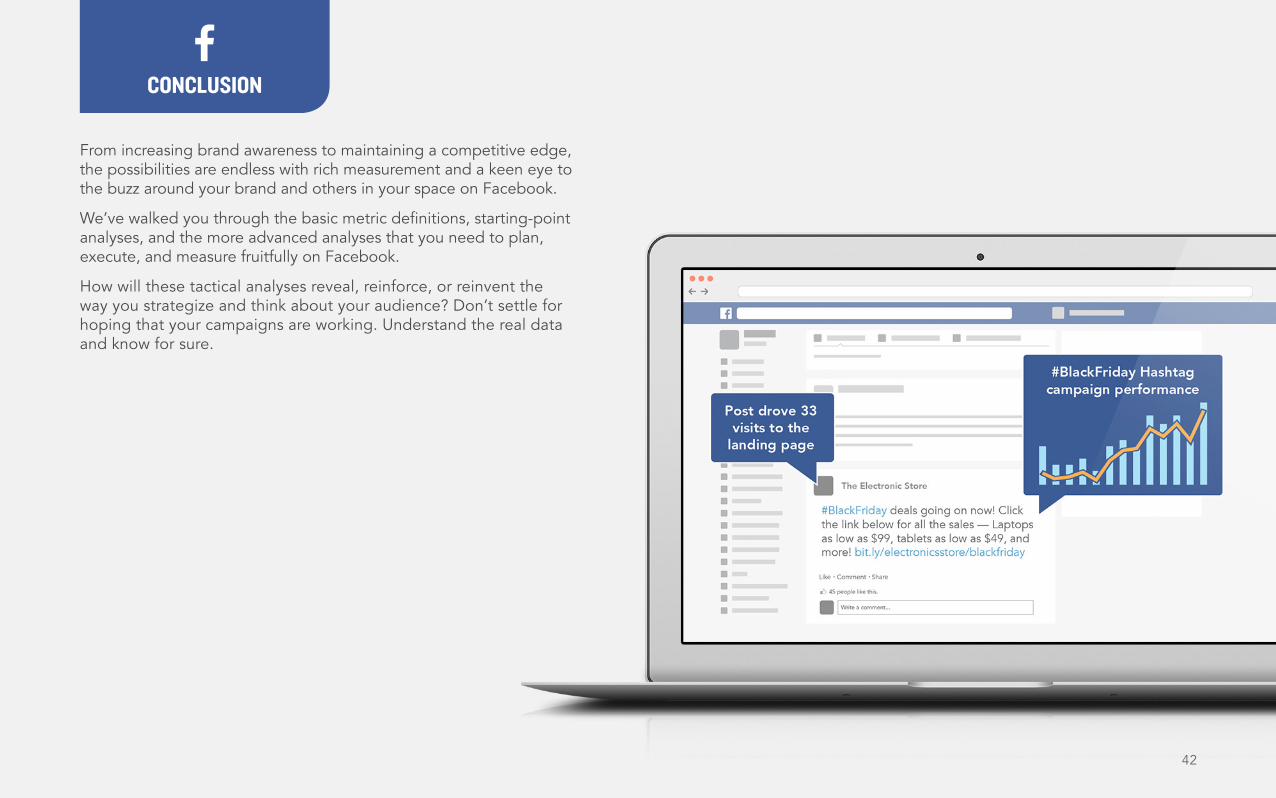
From increasing brand awareness to maintaining a competitive edge, the possibilities are endless with rich measurement and a keen eye to the buzz around your brand and others in your space on Facebook.
We’ve walked you through the basic metric definitions, starting-point analyses, and the more advanced analyses that you need to plan, execute, and measure fruitfully on Facebook.
How will these tactical analyses reveal, reinforce, or reinvent the way you strategize and think about your audience? Don’t settle for hoping that your campaigns are working. Understand the real data and know for sure.
CONCLUSION
About Simply MeasuredSimply Measured is the most complete social analytics solution, empowering marketers with unmatched access to their social data to more clearly define their social strategy and to optimize their tactics for maximum impact.
Our goal is to put the tools to understand business data in the hands of business users. We think reporting should be simple, attractive, and accessible for everyone – not just data scientists. Our software streamlines the process from data to deliverables and eliminates the countless hours spent on everyday reporting tasks. We do this by putting cloud data sources at your fingertips, providing a marketplace of best practice reports, and allowing you to generate beautiful solutions on the web, in Excel, and in PowerPoint with a couple of clicks.
Want to try Simply Measured?
Request a Free Trial Today
Copyright © 2010–2014 Simply Measured, Inc. All Rights Reserved.