the competitiveness of new development of ten tourist
TRANSCRIPT

The Competitiveness of New Development of
Ten Tourist Destination in Indonesia.
Candra Hidayat
1Sekolah Tinggi Pariwisata Trisakti, Jakarta, Indonesia
Email: [email protected]
Abstract-This research investigates the competitiveness of new development ten tourist destinations
performance in Indonesia. It deeply analyzes fourteen pillars organized into four broad factors of
competitiveness. First board is the enabling environment has five pillars: 1.Business environment, 2.Safety
and security, 3.Health and hygiene, 4.Human resources and labour market and 5.ICT readiness. Second
board is travel and tourism policy and enabling conditions has four pillars:1.Prioritization of travel &
tourism, 2.International openness, 3.Price competitiveness and environmental sustainability. Third board is
the infrastructure has three pillars:1.Air transport infrastructure, 2.Ground and port infrastructure and
3.Tourist service infrastructure. Fourth board is the natural and cultural resources has two pillars: 1.Natural
resources and2.Cultural resources and business travel. Type of study is descriptive and the research focuses
use secondary data. According to the result, the rank of new development tourist destinations will be number
ten is North Maluku with score 3.032, number nine is East Nusa Tenggara with score 3.783, number eight is
Southeast Sulawesi with score 3.946, number seven is Bangka Belitung with score 4.155, number six is West
Nusa Tenggara with score 5.113, number five is North Sumatra with score 5.500, number four is Central Java
with score 5.794, number three is Jakarta with score 5.931, number two is Banten with score 5.978 and
number one is East Java with score 6.906.
Keywords: Economic, Travel & Tourism, Tourism Destination, Travel & Tourism Competitive Index, Indonesia
Tourism
I. INTRODUCTION
According to Ocean Health Index said the travel and tourism industry is an important part of the
overall global economy, and is particularly important in some developing nations, where it can
help to reduce poverty. (Ocean Health Index, 2017)
Moreover based on research information from Travel & Tourism is a key sector for economic
development and job creation throughout the world. In 2016, Travel & Tourism directly contributed
US$2.3 trillion and 109 million jobs worldwide. Taking its wider indirect and induced impacts into
account, the sector contributed US$7.6 trillion to the global economy and supported292 million jobs in
2016. This was equal to 10.2% of the world’s GDP, and approximately 1 in 10 of all jobs. (WTTC, 2017)
Lonely planet defined Indonesia's numbers astound: more than 17,000 islands, of which 8000 are
inhabited, and over 300 languages spoken across them. It's a beguiling country offering myriad
adventures. The world’s fourth most populous country is a sultry kaleidoscope draped along the equator
for 5000km. From Sumatra's western tip to Papua's eastern edge, Indonesia defies homogenization. It's a
land of so many cultures, peoples, animals, customs, plants, sights, artworks and foods that it's like 100
countries melded into one. The people are as radically different from each other as if they came from
different continents, with every island a unique blend of the people who live there. Over time, deep and
rich cultures have evolved, from the mysteries of the spiritual Balinese to the utterly non-Western belief
system of the Asmat people of Papua. (Lonely planet, 2017).
The government has announced ten new destination brands to support the Wonderful Indonesia
campaign in an attempt to attract 15 million foreign tourists in 2017 and 20 million in 2018. The ten
tourist destinations are Lake Toba in North Sumatra, Tanjung Kelayang in Bangka Belitung, Tanjung
Lesung in Banten, Thousand Islands regency in Jakarta, Borobudur in Central Java, the areas of Bromo,
212Copyright © 2018, the Authors. Published by Atlantis Press. This is an open access article under the CC BY-NC license (http://creativecommons.org/licenses/by-nc/4.0/).
2nd International Conference on Tourism, Gastronomy, and Tourist Destination (ICTGTD 2018)Advances in Economics, Business and Management Research (AEBMR), volume 52

Tengger and Semeru in East Java, Mandalika in West Nusa Tenggara, Labuan Bajo in East Nusa
Tenggara, Wakatobi in Southeast Sulawesi and Morotai in North Maluku.(The Jakarta post, 2017).
II. LITERATURE REVIEW A. Travel &Tourism.
Travel & Tourism is an important driver of economic, social, and cultural development in both
developed and developing countries. Unlike traditional industries (e.g. manufacturing, communications,
financial services, etc.), Travel & Tourism can be a significant economic driver in remote areas of
countries far from economic centers, as well as in the major business and administrative centers. And The
World Travel & Tourism Council (WTTC) divided on three levels. Firstly Direct, this includes only those
employees and the related value added for the relevant sector. In the case of Travel & Tourism, we only
count the value added of the accommodation, recreation, transportation, and other related sectors.
Secondly Indirect, this measures the supply chain impact (also called inter-industry linkages) for each
sector (Printing/publishing, utilities, financial services, sanitation services, furnishing & equipment
suppliers, security services, rental car manufacturing, transportation, administration, ship building,
tourism promotion, aircraft manufacturing, resort development, glass products, iron/steel). Thirdly
Induced, this measures the impacts of incomes earned directly and indirectly as they are spent in the local
economy. The sum of direct, indirect, and induced impacts equals the total economic impact of a sector.
(WTTC, 2012)
B. Travel & Tourism Competitiveness Index
The Travel & Tourism Competitiveness Index (TTCI) measures “the set of factors and policies that
enable the sustainable development of the Travel & Tourism sector, which, in turn, contributes to the
development and competitiveness of a country”. The T&T Competitiveness Index measures four broad
factors of competitiveness. These factors are organized into sub indexes, which are further divided into 14
pillars: A).The Enabling Environment sub index, which captures the general settings necessary for
operating in a country: 1.Business Environment, 2.Safety and Security,3.Health and Hygiene, 4.Human
Resources and Labour Market, 5.ICT Readiness. B).The T&T Policy and Enabling Conditions sub index,
which captures specific policies or strategic aspects that impact the T&T industry more directly:
6.Prioritization of Travel and Tourism, 7.International Openness, 8.Price Competitiveness,
9.Environmental Sustainability. C).The Infrastructure sub index, which captures the availability and
quality of physical infrastructure of each economy: 10.Air Transport Infrastructure, 11.Ground and Port
Infrastructure, 12.Tourist Service Infrastructure. D).The Natural and Cultural Resources sub index, which
captures the principal “reasons to travel”: 13.Natural Resources, 14.Cultural Resources and Business
Travel. (WEF,2017)
C. Foreign direct investment
Foreign Direct Investment is defined as “an investment involving a long-term relationship and
reflecting a lasting interest of a resident entity (individual or business) in one economy (direct investor) in
an entity resident in an economy other than that of the investor (host Country).There are several
classification effects of foreign direct investment listed of the seven major effects: 1.Income effects
through the contribution of foreign direct investment in total capital formation in the host country. This
effect is positive to the extent that the newly generated investment raises gross domestic product and
national incomes. 2.Employment effects, i.e. job opportunities created by FDI which did not exist before.
3.Balance of payment affects embracing not only the balance between increased exports and the rise in
imports required to support new production but also the inflow of fresh capital against remittances and
retrievals. 4.Structural effects such as the emergence of new lines of production for facilitating or further
processing, i.e. backward and forward linkages. A generalized structural effect refers to the sectorial
composition of the economy as a whole. 5.Technology transfer through the application of more
sophisticated knowhow in production. The transfer may be affected through the technology embodied in
213
Advances in Economics, Business and Management Research (AEBMR), volume 52
foreign direct investment and also through the upgrading of skills associated with foreign direct
investment activities. 6.Market effects which may be either positive when foreign direct investment sets a
good example for domestic entrepreneurs to follow or negative when domestic businessmen are crowded
out by foreign ones. 7.Taxation effects appearing as a logical corollary to rising corporate and personal
incomes. Benefits accruing to host country governments on this account are often significantly reduced by
tax holidays and other incentives to attract foreign direct investment, at least during the initial stage of
building up foreign direct investment. (Linblad, 1998).
D. Tax
Local government revenues (PAD) are revenues sourced and levied by the local government. PAD
sources consist of: local taxes, regional restitution, profits from regionally-owned enterprises (BUMD),
and other legitimate local revenue. Warsito (2001: 128)
E. Health and Hygiene
The definition of sanitation improvement facility is a hygiene of separation human excreta from
human, animal and insect contact. Therefore, the improvement of sanitation facilities consists of
flush/pour-flush toilets that connected to a sewer, septic tank or pit, improvement of ventilation of pit
latrines, pit latrines is a platform of any material which covers the pit entirely, except for the drop hole;
and composting toilets/latrines. However, unimproved facilities consist of shared facilities which
flush/pour-flush toilets that discharge directly into an open sewer or ditch or elsewhere pit latrines without
a slab; bucket latrines; hanging toilets or latrines; and the practice of open defecation in the bush, field or
directly on the river. (mdgs.un.org, 2017)
On the other hand, a drinking water source is also protected from outside contamination with fecal
matter to improve its hygiene. The improvement of drinking water sources includes dwelling, plot or yard
of piped water, tap/standpipe; borehole/tube well; protected dug well; protected spring; rainwater
collection and bottled water. Moreover, the consideration of bottled water users is to have access to
improved sources only when they have a secondary source to an otherwise improved type. Nevertheless,
the improvement of drinking water sources do not include unprotected wells, unprotected springs, water
provided by carts with small tanks/drums, tanker truck-provided water and bottled water or surface water
taken directly from rivers, ponds, streams, lakes, dams, or irrigation channels. The reason is because
drinking water is set as water used for ingestion, food preparation and basic hygiene purposes.
(mdgs.un.org, 2017)
F. ICT readiness
Telecommunication means transmission, delivery and admission of information by signs, signals
writing, images, voices and sounds are through a wire, optical, radio, or other electromagnetic systems.
The provision of voice transmitters, data, text, sound and video using transmission facilities is
telecommunication activities that based on a single technology or a combination of any kinds of
technologies. (BPS, 2015).
Telecommunications subscribers are also used by individuals, legal entities, and government to utilize
telecommunications networks or services either by contract or without contract. (BPS, 2015).
A network component of cellular communication systems receive and send signals that called as Base
Transceiver Station (BTS). It serves the users’ communication device with the network to other networks.
(BPS, 2015).
G. Brand strategy rating
A Country, Region, or City Brand is a utility that managed by several of methodologies in order to
attain its desired objectives. Bloom Consulting establishes five different Country, Region, and City (CRC)
Branding objectives, which are Attraction of Investment, Attraction of Tourism, Attraction of Talent,
Strengthening Prominence and Strengthening Exports. (Bloom Consulting, 2017).
214
Advances in Economics, Business and Management Research (AEBMR), volume 52
H. Regional government budget
According to the Regulation of the Minister of finance Indonesia number 33 2004 is regional
government budget (APBD), is an annual financial plan of local government in Indonesia approved by the
regional representative council. APBD is determined by Regional Regulation.
I. Infrastructure
Based on American Public Works Association (Stone, 1974 in Kodoatie, R., 2005), infrastructure is
physical facilities developed for functions governance in the provision of water, electricity, waste
disposal, transportation and similar services to facilitate social and economic goal.
J. Natural resources
As permanent forest, forest area is a specific area of forest ecosystem determined by the government.
Their decision is significant to arrange maintain the size of forest area and to ensure its legitimation and
border demarcation of permanent forest.
The Minister of Forestry in the format of Ministerial Decree on the Designation of Provincial Forest
Area and Inland Water, Coastal, and Marine Ecosystem establishes Indonesian forest area. The formula of
the designation of Forest Area is based on integration and harmonization in Provincial Spatial Planning
and Forest Land Use by Consensus.
The design of forest area covers inland water, coastal and marine ecosystem that may become part of
Sanctuary Reserve Area and Nature Conservation Area. Sanctuary Reserve Area is a specific aquatic area
for ecosystem of biodiversity plant and animal and its life support system. Moreover, a Nature
Conservation area is a specific aquatic area that is to serve life support system of plant and animal species,
as well as sustainable living resources and their ecosystems.
According to the Act on Forestry No. 41/1999, forest area is classified by Conservation Forest,
Protection Forest and Production Forest. First, Conservation Forest is a forest area that has specific
characteristic in the purposes of conservation of animal and plant species as well as their ecosystem. It is
divided into Sanctuary Reserve area consists of Strict Nature Reserve and Wildlife Sanctuary, and Nature
conservation area consists of National Park, Grand Forest Park, and Nature Recreation Park. Second,
Protection Forest is a forest area that serves life support system, arrange hydrological system, prevent of
flood, erosion control, seawater intrusion, and maintain soil fertility. Third, Production Forest is a forest
area that promotes sustainable forest production; it is categorized into permanent production forest,
limited production forest, and convertible production forest.(BPS, 2017).
III. METHODS A. Research method
This research is aimed to study about the competitiveness of new development ten tourist
destinations’ performance in Indonesia. The object of the research will focus on the new development ten
tourist destinations in Indonesia. In order to get a balance and reliable understanding and representations
of the current situation toward son the new development ten tourist destinations in Indonesia. The number
of tourist destination is 10 destinations. This number is becoming the population of the study. Type of
study is descriptive and the research focuses use secondary data
B. Conceptual framework
This study intends to explore about the competitiveness of new development ten tourist destinations’
performance in Indonesia.
215
Advances in Economics, Business and Management Research (AEBMR), volume 52

FIGURE I. CONCEPTUAL FRAMEWORK
According to the program new development ten tourist destinations from the Minister of Tourism
Republic Indonesia and Travel and tourism competitiveness index from World Economic Forum.
Variable and Indicator showed in Table I.
TABLE I, CONCEPTUAL FRAMEWORK Variable Indicator
Enabling Environment
1. Business Environment 1.1 Impact of rules on FDI
1.2 Time required to deal with construction permits
1.3 Time to start a business
1.4 Cost to start a business
1.5 Total tax rate
2. Safety and Security
2.1 Business costs of crime and violence
2.2 Reliability of police services
2.3 Homicide rate
3. Health and Hygiene
3.1 Physician density
3.2 Access to improved sanitation
3.3 Access to improved drinking water
3.4 Hospital beds
3.5 HIV prevalence
3.6 Malaria incidence
4. Human Resource & Labour Market
Qualification of the labour force :
4.1 Primary education enrolment rate
4.2 Secondary education enrolment rate
Labour market :
4.3 Ease of finding skilled employees
4.4 Pay and productivity
4.5 Female labour force participation
216
Advances in Economics, Business and Management Research (AEBMR), volume 52

Variable Indicator
Enabling Environment
5. ICT Readiness 5.1 Internet use for business-to-consumer transactions
5.2 Individuals using the internet
5.3 Mobile telephone subscriptions
5.4 Mobile network coverage
5.5Quality of electricity supply
T&T Policy and Enabling Conditions
6. Prioritization of Travel & Tourism 6.1 Government prioritization of travel and tourism industry
6.2 T&T government expenditure
6.3 Effectiveness of marketing to attract tourists
6.4 Country Brand Strategy rating
7. International Openness 7.1 Visa requirements
8. Price Competitiveness 8.1 Ticket taxes and airport charges
8.2 Purchasing power parity
8.3 Fuel price levels
9. Environmental Sustainability 9.1 Sustainability of travel & tourism industry development
9.2 Particulate matter (2.5) concentration
9.3 Baseline water stress
9.4 Forest cover change
9.5 Wastewater treatment
9.6 Coastal shelf fishing pressure
Infrastructure
10. Air Transport Infrastructure 10.1Available seat kilometers, domestic
10.2Available seat kilometers, international
10.3Aircraft departures
10.4Airport density
11. Ground and Port Infrastructure 11.1Quality of roads
11.2Road density
11.3Paved road density
11.4Quality of port infrastructure
12. Tourist Service Infrastructure 12.1 Hotel rooms
12.2 Presence of major car rental companies
12.3 Automated teller machines per adult population
Natural and Cultural Resources
13. Natural Resources 13.1 Number of World Heritage natural sites
13.2 Total known species
13.3 Total protected areas
13.4Attractiveness of natural assets
14. Cultural Resources & Business Travel 14.1 Number of World Heritage cultural sites
14.2 Number of oral &intangible cultural heritage expression
14.3 Number of large sports stadiums
C. The variable and measurement
This study is trying to examine the competitiveness of new development ten tourist destinations’
performance in Indonesia. According to the program from the Minister of Tourism Republic Indonesia,
the new development ten tourist destinations are Lake Toba in North Sumatra, Tanjung Kelayang in
Bangka Belitung, Tanjung Lesung in Banten, Thousand Islands regency in Jakarta, Borobudur in Central
Java, the areas of Bromo, Tengger and Semeru in East Java, Mandalika in West Nusa Tenggara, Labuan
Bajo in East Nusa Tenggara, Wakatobi in Southeast Sulawesi and Morotai in North Maluku. And based
on Travel and tourism competitiveness index from World Economic Forum. The T&T Competitiveness
217
Advances in Economics, Business and Management Research (AEBMR), volume 52

Index measures four broad factors of competitiveness. These factors are organized into sub-indexes,
which are further divided into 14 pillars: A).The Enabling Environment sub index, which captures the
general settings necessary for operating in a country: 1.Business Environment, 2.Safety and
Security,3.Health and Hygiene, 4.Human Resources and Labour Market, 5.ICT Readiness. B).The T&T
Policy and Enabling Conditions sub index, which captures specific policies or strategic aspects that
impact the T&T industry more directly: 6.Prioritization of Travel and Tourism, 7.International Openness,
8.Price Competitiveness, 9.Environmental Sustainability. C).The Infrastructure sub index, which captures
the availability and quality of physical infrastructure of each economy: 10.Air Transport Infrastructure,
11.Ground and Port Infrastructure, 12.Tourist Service Infrastructure. D).The Natural and Cultural
Resources sub index, which captures the principal “reasons to travel”: 13.Natural Resources, 14.Cultural
Resources and Business Travel. Based on (Ridwan, 2007)The Ordinal scale is a scale built on the rank,
how to sort all objects high to the lowest level or vice versa. In this study, researchers used 10 Point
Numerical Rating Scale in data. The lowest scores is 1 and the highest scores is 10.
TABLE II, VARIABLE AND MEASUREMENT
Variable Indicator Scale of
Measurement
Source
Enabling Environment
1.Business Environment 1.1 Impact of rules on FDI
1.2 Time required to deal with construction permit
1.3 Time to start a business
1.4 Cost to start a business
1.5 Total tax rate
Ordinal
(1-10)
Ridwan
(2007)
2.Safety and Security
2.1 Business costs of crime and violence
2.2 Reliability of police services
2.3 Homicide rate
Ordinal
(1-10)
Ridwan
(2007)
3.Health and Hygiene
3.1 Physician density
3.2 Access to improved sanitation
3.3 Access to improved drinking water
3.4 Hospital beds
3.5 HIV prevalence
3.6 Malaria incidence
Ordinal
(1-10)
Ridwan
(2007)
4.Human Resource &
Labour Market
Qualification of the labour force :
4.1 Primary education enrolment rate
4.2 Secondary education enrolment rate
Labour market :
4.3 Ease of finding skilled employees
4.4 Pay and productivity
4.5 Female labour force participation
Ordinal
(1-10)
Ridwan
(2007)
5.ICT Readiness 5.1 Internet use for business-to-consumer transaction
5.2 Individuals using the internet
5.3 Mobile telephone subscriptions
5.4 Mobile network coverage
5.5 Quality of electricity supply
Ordinal
(1-10)
Ridwan
(2007)
T&T Policy and
Enabling Conditions
6.Prioritization of
Travel & Tourism
6.1 Government prioritization of travel & tourism
industry
6.2 T&T government expenditure
6.3 Effectiveness of marketing to attract tourists
6.4 Country Brand Strategy rating
Ordinal
(1-10)
Ridwan
(2007)
7.InternationalOpenness 7.1 Visa requirements Ordinal
(1-10)
Ridwan
(2007)
218
Advances in Economics, Business and Management Research (AEBMR), volume 52

Variable Indicator Scale of
Measurement
Source
Enabling Environment
8.Price Competitiveness 8.1 Ticket taxes and airport charges
8.2 Purchasing power parity
8.3 Fuel price levels
Ordinal
(1-10)
Ridwan
(2007)
9.Environmental
Sustainability
9.1 Sustainability of travel & tourism industry
development
9.2 Particulate matter (2.5) concentration
9.3 Baseline water stress
9.4 Forest cover change
9.5 Wastewater treatment
9.6 Coastal shelf fishing pressure
Ordinal
(1-10)
Ridwan
(2007)
Infrastructure
10.Air Transport
Infrastructure
10.1 Available seat kilometers, Domestic
10.2 Available seat kilometers, International
10.3 Aircraft departures
10.4 Airport density
Ordinal
(1-10)
Ridwan
(2007)
11.Ground and Port
Infrastructure
11.1 Quality of roads
11.2 Road density
11.3 Paved road density
11.4 Quality of port infrastructure
Ordinal
(1-10)
Ridwan
(2007)
12.Tourist Service
Infrastructure
12.1 Hotel rooms
12.2 Presence of major car rental Companies
12.3 Automated teller machines per adult pop
Ordinal
(1-10)
Ridwan
(2007)
Natural and Cultural
Resources
13.Natural Resources 13.1 Number of World Heritage natural sites
13.2 Total known species
13.3 Total protected areas
13.4 Attractiveness of natural assets
Ordinal
(1-10)
Ridwan
(2007)
14.Cultural Resources
& Business Travel 14.1 Number of World Heritage cultural sites
14.2 Number of oral & intangible cultural heritage
expressions
14.3 Number of large sports stadiums
Ordinal
(1-10)
Ridwan
(2007)
D. Data collection procedure
The research focuses use secondary data. Hox and Boeije (2005) defined that secondary data is data
originally collected for a different purpose and reused for another research question. Well-documented
data sets come with a detailed description of the methods and procedures used to collect the data. The data
in this research is 56 observations, from 10 tourist destinations. Secondary data is “data which collected
by person or other institutions such as annual report, company profile and so on.” The quantitative data
that would be used in this study are numeric data.(Kusmayadi and Sugiarto, 2000).
This research to know the competitiveness of new development ten tourist destinations’ performance
in Indonesia. The research project will, therefore, seek to explore and investigate the following:
1. How competitive business environment performance on new development ten tourist destinations in
Indonesia.
2. How competitive safety and security performance on new development ten tourist destinations in
Indonesia.
3. How competitive health and hygiene performance on new development ten tourist destinations in
Indonesia.
219
Advances in Economics, Business and Management Research (AEBMR), volume 52

4. How competitive human resource and labour market performance on new development ten tourist
destinations in Indonesia.
5. How competitive ICT readiness performance on new development ten tourist destinations in
Indonesia.
6. How competitive prioritization of travel & tourism performance on new development ten tourist
destinations in Indonesia.
7. How competitive international openness performance on new development ten tourist destinations in
Indonesia.
8. How competitive price competitiveness performance on new development ten tourist destinations in
Indonesia.
9. How competitive environmental sustainability performance on new development ten tourist
destinations in Indonesia.
10. How competitive air transport infrastructure performance on new development ten tourist destinations
in Indonesia.
11. How competitive ground and port infrastructure performance on new development ten tourist
destinations in Indonesia.
12. How competitive tourist service infrastructure performance on new development ten tourist
destinations in Indonesia.
13. How competitive natural resources performance on new development ten tourist destinations in
Indonesia.
14. How competitive cultural resources & business travel performance on new development ten tourist
destinations in Indonesia.
E. Method of data analysis
The Ordinal scale is a scale built on the rank, how to sort all objectshigh to the lowest level or vice
versa. (Ridwan, 2007:84). In this study, researchers used 10 Point Numerical Rating Scale in data. The
lowest scores is 1 and the highest scores is 10. A higher data indicates a higher score are indicator 1.1
Impact of rules on FDI,1.4 Cost to start a business, 1.5 Total tax rate, 2.2 Reliability of police services,
3.1 Physician density, 3.2 Access to improved sanitation, 3.3 Access to improved drinking water, 3.4
Hospital beds, 4.1 Primary education enrolment rate, 4.2 Secondary education enrolment rate, 4.3 Ease of
finding skilled employees, 4.4 Pay and productivity, 4.5 Female labour force participation, 5.1 Internet
use for business-to-consumer transactions, 5.2 Individuals using the internet, 5.3 Mobile telephone
subscriptions, 5.4 Mobile network coverage, 5.5 Quality of electricity supply, 6.1 Government
prioritization of travel and tourism industry, 6.2 T&T government expenditure, 6.3 Effectiveness of
marketing to attract tourists, 6.4 Country Brand Strategy rating, 8.2 Purchasing power parity, 9.1
Sustainability of travel and tourism industry development, 9.2 Particulate matter (2.5) concentration,9.4
Forest cover change, 9.5 Wastewater treatment, 10.1 Available seat kilometers, domestic, 10.2 Available
seat kilometers, international, 10.3 Aircraft departures, 10.4 Airport density, 11.1 Quality of roads, 11.2
Road density, 11.3 Paved road density, 12.1 Hotel rooms, 12.2 Presence of major car rental companies,
12.3 Automated teller machines per adult Population, 13.2 Total known species, 13.3 Total protected
areas, 13.4 Attractiveness of natural assets. And a higher data indicates a lower score are indicator 1.2
Time required to deal with construction permits, 1.3 Time to start a business, 2.1 Businesscosts of crime
and violence, 2.3 Homicide rate, 3.5 HIV prevalence, 3.6 Malaria incidence, 8.1 Ticket taxes and airport
charges, 9.6 Coastal shelf fishing pressure. With the exception of the unique indicator for score are 7.1
Visa requirements, 8.3 Fuel price levels, 9.3 Baseline water stress, 11.4 Quality of port infrastructure,
13.1 Number of World Heritage natural sites, 14.1 Number of World Heritage cultural sites, 14.2 Number
of oral and intangible cultural heritage expressions, 14.3 Number of large sports stadiums. After that
researcher analyze the data for this study, the statistical software SPSS version 20.0, was used as the
instrument for the dataanalysis.
220
Advances in Economics, Business and Management Research (AEBMR), volume 52

IV. RESULT AND DISCUSSION
The purpose of research will focus on four broad factors of competitiveness from new development
10 tourist destinations’ performance in Indonesia. These factors are organized into subindexes, which are
further divided into 14 pillars: A).The Enabling Environment sub index, which captures the general
settings necessary for operating in a country: 1.Business Environment, 2.Safety and Security,3.Health and
Hygiene, 4.Human Resources and Labour Market, 5.ICT Readiness. B).The T&T Policy and Enabling
Conditions sub index, which captures specific policies or strategic aspects that impact the T&T industry
more directly: 6.Prioritization of Travel and Tourism, 7.International Openness, 8.Price Competitiveness,
9.Environmental Sustainability. C).The Infrastructure sub index, which captures the availability and
quality of physical infrastructure of each economy: 10.Air Transport Infrastructure, 11.Ground and Port
Infrastructure, 12.Tourist Service Infrastructure. D).The Natural and Cultural Resources sub index, which
captures the principal “reasons to travel”: 13.Natural Resources, 14.Cultural Resources and Business
Travel.
A. Profile of the respondents
The research was conducted by using secondary data which is using 56 observations, from new
development 10 tourist destinations.
B. Finding for The Research Objectives
The Enabling Environment
Firstly it was conducted the descriptive statistic to see the competitiveness of business environment
from new development 10 tourist destinations’ performance in Indonesia.
TABLE III. BUSINESS ENVIRONMENT Province N Minimum Maximum Mean
North Sumatra 5 3 10 6.40
Bangka Belitung 5 0 3 1.00
Banten 5 0 9 4.60
Jakarta 5 6 10 8.20
Central Java 5 5 10 7.80
East Java 5 7 10 8.40
West Nusa Tenggara 5 5 9 6.60
East Nusa Tenggara 5 0 4 2.00
Southeast Sulawesi 5 0 8 2.60
North Maluku 5 0 4 1.40
From the descriptive statistic above for business environment, the highest is East Java with Mean
8.40, the second highest is Jakarta with Mean 8.20, the third highest is Central Java with Mean 7.80, the
fourth highest is West Nusa Tenggara with Mean 6.60, the fifth highest is North Sumatra with Mean
6.40,the lowest is Bangka Belitung with Mean 1.00,the second lowest is North Maluku with Mean 1.40,
the third lowest is East Nusa Tenggara with Mean 2.00, the fourth lowest is Southeast Sulawesi with
Mean 2.60, the fifth lowest is Banten with Mean 4.60.
Secondly it was conducted the descriptive statistic to see the competitiveness of safety and security
from new development 10 tourist destinations’ performance in Indonesia.
221
Advances in Economics, Business and Management Research (AEBMR), volume 52
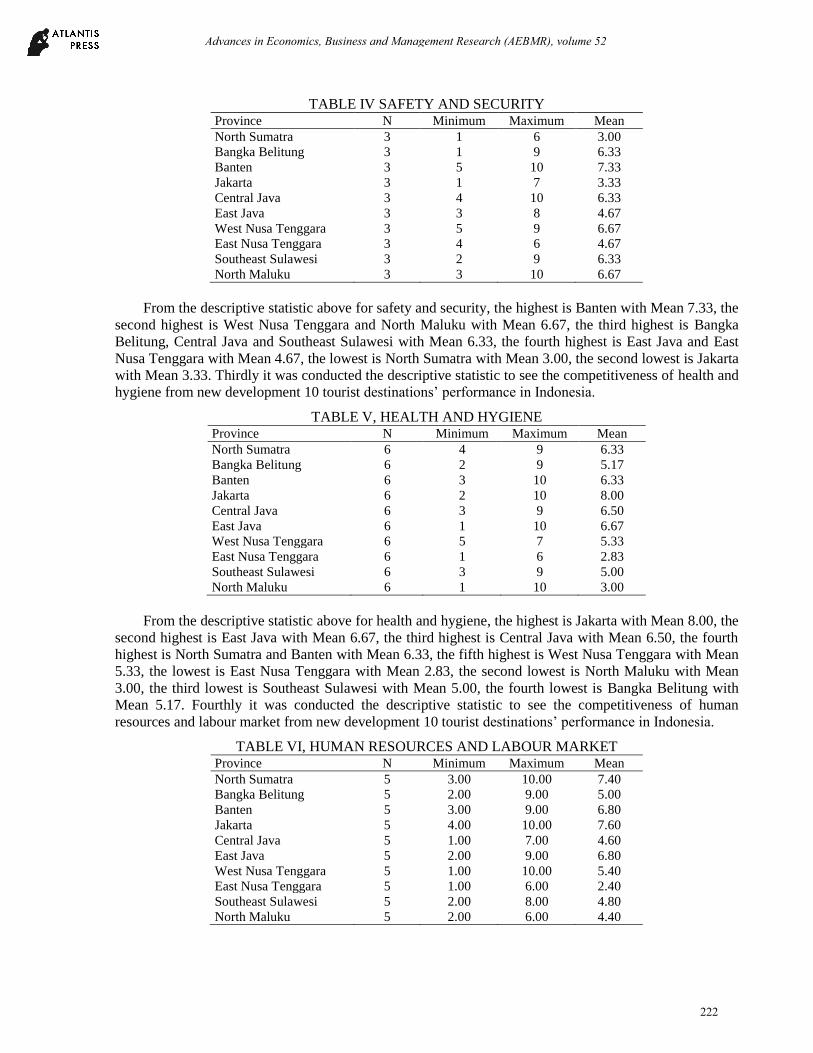
TABLE IV SAFETY AND SECURITY Province N Minimum Maximum Mean
North Sumatra 3 1 6 3.00
Bangka Belitung 3 1 9 6.33
Banten 3 5 10 7.33
Jakarta 3 1 7 3.33
Central Java 3 4 10 6.33
East Java 3 3 8 4.67
West Nusa Tenggara 3 5 9 6.67
East Nusa Tenggara 3 4 6 4.67
Southeast Sulawesi 3 2 9 6.33
North Maluku 3 3 10 6.67
From the descriptive statistic above for safety and security, the highest is Banten with Mean 7.33, the
second highest is West Nusa Tenggara and North Maluku with Mean 6.67, the third highest is Bangka
Belitung, Central Java and Southeast Sulawesi with Mean 6.33, the fourth highest is East Java and East
Nusa Tenggara with Mean 4.67, the lowest is North Sumatra with Mean 3.00, the second lowest is Jakarta
with Mean 3.33. Thirdly it was conducted the descriptive statistic to see the competitiveness of health and
hygiene from new development 10 tourist destinations’ performance in Indonesia.
TABLE V, HEALTH AND HYGIENE Province N Minimum Maximum Mean
North Sumatra 6 4 9 6.33
Bangka Belitung 6 2 9 5.17
Banten 6 3 10 6.33
Jakarta 6 2 10 8.00
Central Java 6 3 9 6.50
East Java 6 1 10 6.67
West Nusa Tenggara 6 5 7 5.33
East Nusa Tenggara 6 1 6 2.83
Southeast Sulawesi 6 3 9 5.00
North Maluku 6 1 10 3.00
From the descriptive statistic above for health and hygiene, the highest is Jakarta with Mean 8.00, the
second highest is East Java with Mean 6.67, the third highest is Central Java with Mean 6.50, the fourth
highest is North Sumatra and Banten with Mean 6.33, the fifth highest is West Nusa Tenggara with Mean
5.33, the lowest is East Nusa Tenggara with Mean 2.83, the second lowest is North Maluku with Mean
3.00, the third lowest is Southeast Sulawesi with Mean 5.00, the fourth lowest is Bangka Belitung with
Mean 5.17. Fourthly it was conducted the descriptive statistic to see the competitiveness of human
resources and labour market from new development 10 tourist destinations’ performance in Indonesia.
TABLE VI, HUMAN RESOURCES AND LABOUR MARKET Province N Minimum Maximum Mean
North Sumatra 5 3.00 10.00 7.40
Bangka Belitung 5 2.00 9.00 5.00
Banten 5 3.00 9.00 6.80
Jakarta 5 4.00 10.00 7.60
Central Java 5 1.00 7.00 4.60
East Java 5 2.00 9.00 6.80
West Nusa Tenggara 5 1.00 10.00 5.40
East Nusa Tenggara 5 1.00 6.00 2.40
Southeast Sulawesi 5 2.00 8.00 4.80
North Maluku 5 2.00 6.00 4.40
222
Advances in Economics, Business and Management Research (AEBMR), volume 52

From the descriptive statistic above for human resources and labour market, the highest is Jakarta
with Mean 7.60, the second highest is North Sumatra with Mean 7.40, the third highest is Banten and East
Java with Mean 6.80, the fourth highest is West Nusa Tenggara with Mean 5.40, the fifth highest is
Bangka Belitung with Mean 5.00, the lowest is East Nusa Tenggara with Mean 2.40, the second lowest is
North Maluku with Mean 4.40, the third lowest is Central Java with Mean 4.60, the fourth lowest is
Southeast Sulawesi with Mean 4.80. Fifthly it was conducted the descriptive statistic to see the
competitiveness of ICT readiness from new development 10 tourist destinations’ performance in
Indonesia.
TABLE VII, CT READINESS Province N Minimum Maximum Mean
North Sumatra 5 3 6 4.20
Bangka Belitung 5 5 9 7.60
Banten 5 6 9 7.60
Jakarta 5 10 10 10.00
Central Java 5 4 9 6.80
East Java 5 4 8 6.40
West Nusa Tenggara 5 3 6 4.40
East Nusa Tenggara 5 1 3 1.40
Southeast Sulawesi 5 2 7 3.80
North Maluku 5 1 7 2.80
From the descriptive statistic above, the highest ICT readiness is Jakarta with Mean 10.00, the
second highest ICT readiness is Bangka Belitung and Banten with Mean 7.60, the third highest ICT
readiness is Central Java with Mean 6.80, the fourth highest ICT readiness is East Java with Mean 6.40,
the fifth highest ICT readiness is West Nusa Tenggara with Mean 4.40, the lowest ICT readiness is East
Nusa Tenggara with Mean 1.40, the second lowest ICT readiness is North Maluku with Mean 2.80, the
third lowest ICT readiness is Southeast Sulawesi with Mean 3.80, the fourth lowest ICT readiness is
North Sumatra with Mean 4.20.
The T&T Policy and Enabling Conditions Firstly it was conducted the descriptive statistic to see the competitiveness of prioritization of travel
and tourism from new development 10 tourist destinations’ performance in Indonesia.
TABLE VIII, PRIORITIZATION OF TRAVEL AND TOURISM Province N Minimum Maximum Mean
North Sumatra 4 6 7 6.25
Bangka Belitung 4 2 7 4.00
Banten 4 2 8 5.25
Jakarta 4 9 10 9.75
Central Java 4 3 8 6.25
East Java 4 5 10 8.25
West Nusa Tenggara 4 5 9 6.75
East Nusa Tenggara 4 1 8 4.00
Southeast Sulawesi 4 2 4 3.00
North Maluku 4 1 3 1.50
From the descriptive statistic above, the highest prioritization of travel and tourism is Jakarta with
Mean 9.75, the second highest prioritization of travel and tourism is East Java with Mean 8.25, the third
highest prioritization of travel and tourism is West Nusa Tenggara with Mean 6.75, the fourth highest
prioritization of travel and tourism is North Sumatra and Central Java with Mean 6.25, the fifth highest
prioritization of travel and tourism is Banten with Mean 5.25, the lowest prioritization of travel and
tourism is North Maluku with Mean 1.50, the second lowest prioritization of travel and tourism is
Southeast Sulawesi with Mean 3.00, the third lowest prioritization of travel and tourism is Bangka
Belitung and East Nusa Tenggara with Mean 4.00, Secondly it was conducted the descriptive statistic to
223
Advances in Economics, Business and Management Research (AEBMR), volume 52
see the competitiveness of International Openness from new development 10 tourist destinations’
performance in Indonesia.
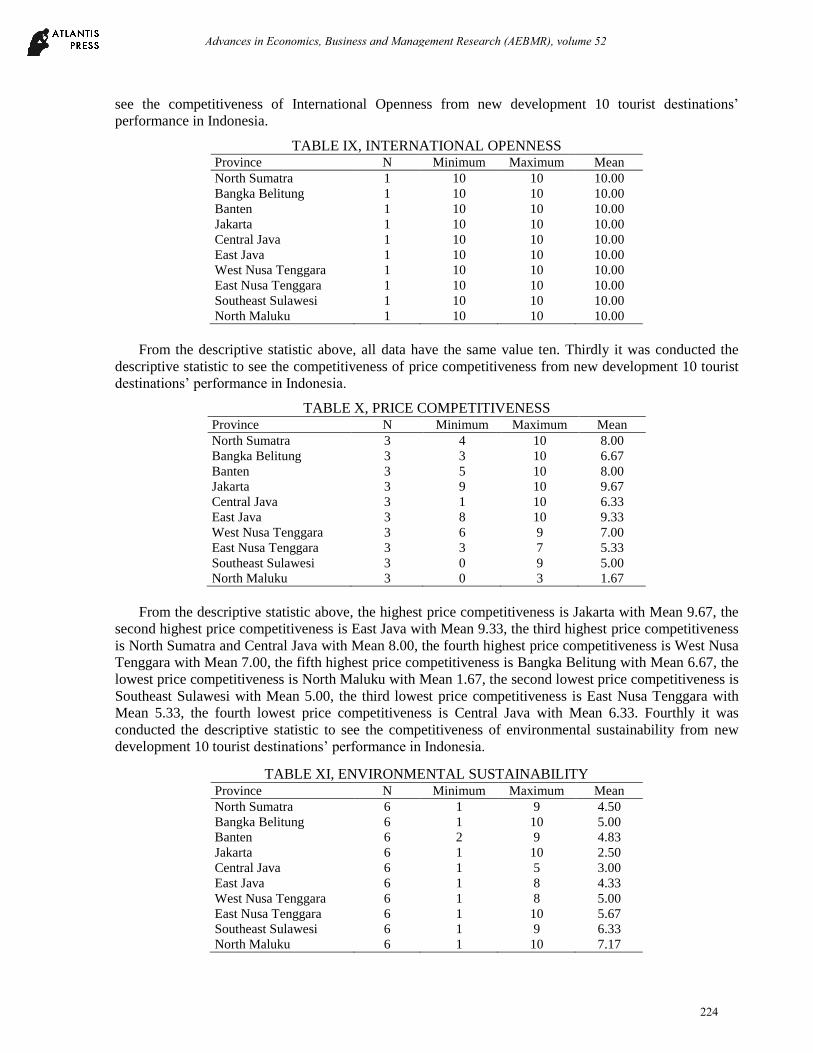
TABLE IX, INTERNATIONAL OPENNESS Province N Minimum Maximum Mean
North Sumatra 1 10 10 10.00
Bangka Belitung 1 10 10 10.00
Banten 1 10 10 10.00
Jakarta 1 10 10 10.00
Central Java 1 10 10 10.00
East Java 1 10 10 10.00
West Nusa Tenggara 1 10 10 10.00
East Nusa Tenggara 1 10 10 10.00
Southeast Sulawesi 1 10 10 10.00
North Maluku 1 10 10 10.00
From the descriptive statistic above, all data have the same value ten. Thirdly it was conducted the
descriptive statistic to see the competitiveness of price competitiveness from new development 10 tourist
destinations’ performance in Indonesia.
TABLE X, PRICE COMPETITIVENESS Province N Minimum Maximum Mean
North Sumatra 3 4 10 8.00
Bangka Belitung 3 3 10 6.67
Banten 3 5 10 8.00
Jakarta 3 9 10 9.67
Central Java 3 1 10 6.33
East Java 3 8 10 9.33
West Nusa Tenggara 3 6 9 7.00
East Nusa Tenggara 3 3 7 5.33
Southeast Sulawesi 3 0 9 5.00
North Maluku 3 0 3 1.67
From the descriptive statistic above, the highest price competitiveness is Jakarta with Mean 9.67, the
second highest price competitiveness is East Java with Mean 9.33, the third highest price competitiveness
is North Sumatra and Central Java with Mean 8.00, the fourth highest price competitiveness is West Nusa
Tenggara with Mean 7.00, the fifth highest price competitiveness is Bangka Belitung with Mean 6.67, the
lowest price competitiveness is North Maluku with Mean 1.67, the second lowest price competitiveness is
Southeast Sulawesi with Mean 5.00, the third lowest price competitiveness is East Nusa Tenggara with
Mean 5.33, the fourth lowest price competitiveness is Central Java with Mean 6.33. Fourthly it was
conducted the descriptive statistic to see the competitiveness of environmental sustainability from new
development 10 tourist destinations’ performance in Indonesia.
TABLE XI, ENVIRONMENTAL SUSTAINABILITY Province N Minimum Maximum Mean
North Sumatra 6 1 9 4.50
Bangka Belitung 6 1 10 5.00
Banten 6 2 9 4.83
Jakarta 6 1 10 2.50
Central Java 6 1 5 3.00
East Java 6 1 8 4.33
West Nusa Tenggara 6 1 8 5.00
East Nusa Tenggara 6 1 10 5.67
Southeast Sulawesi 6 1 9 6.33
North Maluku 6 1 10 7.17
224
Advances in Economics, Business and Management Research (AEBMR), volume 52

From the descriptive statistic above, the highest environmental sustainability is North Maluku with
Mean 7.17, the second highest environmental sustainability is Southeast Sulawesi with Mean 6.33, the
third highest environmental sustainability is East Nusa Tenggara with Mean 5.67, the fourth highest
environmental sustainability is Bangka Belitung and West Nusa Tenggara with Mean 5.00, the fifth
highest environmental sustainability is Banten with Mean 4.83, the lowest environmental sustainability is
Jakarta with Mean 2.50, the second lowest environmental sustainability is Central Java with Mean 3.00,
the third lowest environmental sustainability is East Java with Mean 4.33, the fourth lowest environmental
sustainability is North Sumatra with Mean 4.50.
The Infrastructure
Firstly it was conducted the descriptive statistic to see the competitiveness of air transport infra
structure from new development 10 tourist destinations’ performance in Indonesia.
TABLE XII, AIR TRANSPORT INFRASTRUCTURE Province N Minimum Maximum Mean
North Sumatra 4 8 8 8.00
Bangka Belitung 4 0 3 2.25
Banten 4 10 10 10.00
Jakarta 4 5 6 5.50
Central Java 4 6 7 6.50
East Java 4 9 9 9.00
West Nusa Tenggara 4 4 7 5.25
East Nusa Tenggara 4 4 7 4.75
Southeast Sulawesi 4 0 2 1.50
North Maluku 4 0 1 .75
From the descriptive statistic above, the highest air transport infrastructure is Banten with Mean
10.00, the second highest air transport infrastructure is East Java with Mean 9.00, the third highest air
transport infrastructure is North Sumatra with Mean 8.00, the fourth highest air transport infrastructure is
Central Java with Mean 6.50, the fifth highest air transport infrastructure is Jakarta with Mean 5.50, the
lowest air transport infrastructure is North Maluku with Mean 0.75, the second lowest air transport
infrastructure is Southeast Sulawesi with Mean 1.50, the third lowest air transport infrastructure is Bangka
Belitung with Mean 2.25, the fourth lowest air transport infrastructure is East Nusa Tenggara with Mean
4.75, the fifth lowest air transport infrastructure is West Nusa Tenggara with Mean 5.25.
Secondly it was conducted the descriptive statistic to see the competitiveness of ground and port
infrastructure from new development 10 tourist destinations’ performance in Indonesia.
TABLE XIII, GROUND AND PORT INFRASTRUCTURE Province N Minimum Maximum Mean
North Sumatra 4 2 6 4.25
Bangka Belitung 4 2 9 4.25
Banten 4 2 10 6.50
Jakarta 4 1 10 6.25
Central Java 4 2 9 6.75
East Java 4 1 8 6.25
West Nusa Tenggara 4 0 5 3.25
East Nusa Tenggara 4 1 5 3.25
Southeast Sulawesi 4 2 6 3.00
North Maluku 4 1 2 1.50
From the descriptive statistic above, the highest ground and port infrastructure is Central Java with
Mean 6.75, the second highest ground and port infrastructure is Banten with Mean 6.50, the third highest
ground and port infrastructure is Jakarta and East Java with Mean 6.25, the fourth highest ground and port
225
Advances in Economics, Business and Management Research (AEBMR), volume 52

infrastructure is North Sumatra and Bangka Belitung with Mean 4.25, the lowest ground and port
infrastructure is North Maluku with Mean 1.50, the second lowest ground and port infrastructure is
Southeast Sulawesi with Mean 3.00, the third lowest ground and port infrastructure is West Nusa
Tenggara and East Nusa Tenggara with Mean 3.25.
Thirdly it was conducted the descriptive statistic to see the competitiveness of tourist service
infrastructure from new development 10 tourist destinations’ performance in Indonesia.
TABLE XIV, TOURIST SERVICE INFRASTRUCTURE Province N Minimum Maximum Mean
North Sumatra 3 6 7 6.67
Bangka Belitung 3 2 6 3.67
Banten 3 5 7 6.33
Jakarta 3 9 10 9.33
Central Java 3 8 8 8.00
East Java 3 9 10 9.67
West Nusa Tenggara 3 5 7 6.00
East Nusa Tenggara 3 0 4 2.67
Southeast Sulawesi 3 2 5 3.33
North Maluku 3 0 1 .67
From the descriptive statistic above, the highest tourist service infrastructure is East Java with Mean
9.67, the second highest tourist service infrastructure is Jakarta with Mean 9.33, the third highest tourist
service infrastructure is Central Java with Mean 8.00, the fourth highest tourist service infrastructure is
North Sumatra with Mean 6.67, the fifth highest tourist service infrastructure is Banten with Mean 6.33,
the lowest tourist service infrastructure is North Maluku with Mean 0.67, the second lowest tourist service
infrastructure is East Nusa Tenggara with Mean 2.67, the third lowest tourist service infrastructure is
Southeast Sulawesi with Mean 3.33, the fourth lowest tourist service infrastructure is Bangka Belitung
with Mean 3.67, the fifth lowest tourist service infrastructure is West Nusa Tenggara with Mean 6.00.
Natural and Cultural Resources
Firstly it was conducted the descriptive statistic to see the competitiveness of natural resources from
new development 10 tourist destinations’ performance in Indonesia.
Table XV, Natural Resources Province N Minimum Maximum Mean
North Sumatra 4 1 8 5.75
Bangka Belitung 4 0 6 3.25
Banten 4 1 10 4.50
Jakarta 4 0 3 1.25
Central Java 4 0 10 3.25
East Java 4 0 10 5.50
West Nusa Tenggara 4 1 7 4.50
East Nusa Tenggara 4 0 9 5.00
Southeast Sulawesi 4 0 9 4.50
North Maluku 4 0 8 4.50
From the descriptive statistic above, the highest natural resources is North Sumatra with Mean 5.75,
the second highest natural resources is East Java with Mean 5.50, the third highest natural resources is
East Nusa Tenggara with Mean 5.00, the fourth highest natural resources is Banten, West Nusa Tenggara,
Southeast Sulawesi and North Maluku with Mean 4.50, the lowest natural resources is Jakarta with Mean
1.25, the second lowest natural resources is Bangka Belitung and Central Java with Mean 3.25.
226
Advances in Economics, Business and Management Research (AEBMR), volume 52

Secondly it was conducted the descriptive statistic to see the competitiveness of cultural resources &
business travel from new development 10 tourist destinations’ performance in Indonesia.
TABLE XVI, CULTURAL RESOURCES & BUSINESS TRAVEL Province N Minimum Maximum Mean
North Sumatra 3 0 1 .33
Bangka Belitung 3 0 1 .33
Banten 3 0 2 1.00
Jakarta 3 0 3 1.33
Central Java 3 3 4 3.33
East Java 3 0 8 4.00
West Nusa Tenggara 3 0 3 1.00
East Nusa Tenggara 3 0 1 .33
Southeast Sulawesi 3 0 2 .67
North Maluku 3 0 1 .33
From the descriptive statistic above, the highest cultural resources & business travel is East Java with
Mean 4.00, the second highest cultural resources & business travel is Central Java with Mean 3.33, the
third highest cultural resources & business travel is Jakarta with Mean 1.33, the fourth highest cultural
resources & business travel is Banten and West Nusa Tenggara with Mean 1.00, the lowest cultural
resources & business travel is North Sumatra, Bangka Belitung, East Nusa Tenggara and North Maluku
with Mean 0.33, the second lowest cultural resources & business travel is Southeast Sulawesi with Mean
0.67.
TABLE XVII, THE COMPETITIVENESS OF NEW DEVELOPMENT TEN TOURIST
DESTINATIONS IN INDONESIA
Province Rank Score
North Sumatra 5 5.500
Bangka Belitung 7 4.155
Banten 2 5.978
Jakarta 3 5.931
Central Java 4 5.794
East Java 1 6.906
West Nusa Tenggara 6 5.113
East Nusa Tenggara 9 3.783
Southeast Sulawesi 8 3.946
North Maluku 10 3.032
From the table above,the rank of new development tourist destinations will be number ten is North
Maluku with score 3.032, number nine is East Nusa Tenggara with score 3.783, number eight is Southeast
Sulawesi with score 3.946, number seven is Bangka Belitung with score 4.155, number six is West Nusa
Tenggara with score 5.113, number five is North Sumatra with score 5.500, number four is Central Java
with score 5.794, number three is Jakarta with score 5.931, number two is Banten with score 5.978 and
number one is East Java with score 6.906.
V. CONCLUSION
The top ten new development tourist destinations in Indonesia will be East Java, Banten, Jakarta,
Central Java, North Sumatra, West Nusa Tenggara, Bangka Belitung, South Sulawesi, East Nusa
Tenggara and North Maluku.
227
Advances in Economics, Business and Management Research (AEBMR), volume 52

According to the research, business environment performance has been successfully achieved by East
Java, Jakarta and Central Java to other ten tourist destinations in Indonesia. However, the research found
that several provinces are still in poor business environment performance. There are Banten, Bangka
Belitung, Southeast Sulawesi, East Nusa Tenggara and North Maluku.
Most of the new development ten tourist destinations in Indonesia still need to developed their safety
and security for tourist, even though they has already achieved in some of provinces, such as Banten,
Central Java, West Nusa Tenggara, Bangka Belitung, Southeast Sulawesi and North Maluku. However,
East Java, Jakarta, North Sumatra, East Nusa Tenggara is poor in safety and security.
Indonesia needs to improve health and hygiene performance for the new development their ten tourist
destinations. Health and hygiene problem are found in West Nusa Tenggara, Bangka Belitung, Southeast
Sulawesi, East Nusa Tenggara and North Maluku province. However, Jakarta is the most success
province in improving their health and hygiene performance in their tourist places.
The competitiveness of human resource and labor market performance are dominance with poor result
rather than ordinary result achievement. The poor achievement is in Central Java, Bangka Belitung,
Southeast Sulawesi, East Nusa Tenggara, and North Maluku. However, Jakarta is the top competitive in
its human resource and labor market performance.
Jakarta and Banten are successfully achieved especially in ICT readiness. However, North Sumatra,
West Nusa Tenggara, Southeast Sulawesi, East Nusa Tenggara and North Maluku need to improve their
ICT readiness.
East Java and Jakarta are the provinces that concern with their prioritization of travel and tourism
performance. However, Indonesia still has some of provinces in their poor prioritization of travel and
tourism performance, such as Banten, Bangka Belitung, Southeast Sulawesi, East Nusa Tenggara and
North Maluku.
All the top ten tourist destinations in Indonesia are successfully competitive in terms of their
international openness performance. This is the reason why the ten provinces have potentially increased
their tourist destinations internationally.
Most of large economy provinces, such as East Java, Banten, Jakarta and North Sumatra are
competitive enough in their price competitiveness performance. But, Southeast Sulawesi, East Nusa
Tenggara and North Maluku are still in their poor performance.
Environmental sustainability is a matter of issue on new development ten tourist destinations in
Indonesia. Most of provinces are still in poor achievement, such as East Java, Banten, Jakarta, Central
Java, North Sumatra, West Nusa Tenggara and Bangka Belitung. There are only Southeast Sulawesi East
Nusa Tenggara and North Maluku that improve their environmental sustainability performance.
The best air transport infrastructure performance for tourist destinations in Indonesia is in East Java,
Banten and North Sumatra. Additionally, Jakarta and Central Java have fulfilled ordinary performance for
air transport infrastructure. However, the rest of the provinces, such as West Nusa Tenggara, Southeast
Sulawesi, Bangka Belitung, East Nusa Tenggara and North Maluku are still in poor performance for air
transport infrastructure.
Ground and port infrastructure performance in Indonesia need to improve for tourist destinations.
Most of the provinces, such as North Sumatra, West Nusa Tenggara, Bangka Belitung, Southeast
Sulawesi, East Nusa Tenggara and North Maluku are in poor ground and port infrastructure performance.
Jakarta and Central Java have already competitive for the tourist service infrastructure. However, poor
performance is still found in provinces that lack of tourist service infrastructure, such as West Nusa
Tenggara, Bangka Belitung, Southeast Sulawesi, East Nusa Tenggara and North Maluku.
Most of the new development ten tourist destinations in Indonesia are in poor performance of natural
resources, such as Banten, Jakarta, Central Java, West Nusa Tenggara, Bangka Belitung, Southeast
Sulawesi, East Nusa Tenggara and North Maluku. However, East Java and North Sumatra still have
natural resources for the tourist destination.
All the provinces must increase their cultural resources & business travel to enhance successful
performance, such as East Java, Banten, Jakarta, Central Java, North Sumatra, West Nusa Tenggara,
Bangka Belitung, South Sulawesi, East Nusa Tenggara and North Maluku.
228
Advances in Economics, Business and Management Research (AEBMR), volume 52

REFERENCES
Base Transceiver Station (BTS) (Publication). (n.d.). (2015) Retrieved
Consulting, B. (n.d.). Nation Branding & City Branding. Retrieved January 05, 2018, from
https://www.bloom-consulting.com/en/nation-branding
Forest Area (Publication). (n.d.). (2017) Retrieved from
https://www.bps.go.id/publication/2016/11/30/613d3773b30c107a3c0d65cb/statistik-telekomunikasi
indonesia.html
https://www.bps.go.id/publication/2017/07/26/b598fa587f5112432533a656/statistik-indonesia
html
https://www.wttc.org/-/media/files/reports/economic-impact-research/2017-documents/global-
economic-impact-and-issues-2017.pdf
Lindblad, J. T. (1998). Foreign investment in southeast asia in the twentieth century. London: Macmillan
press.
Planet, L. (n.d.). Indonesia travel. Retrieved January 05, 2018, from
https://www.lonelyplanet.com/indonesia
Post, T. J. (n.d.). Indonesia announces 10 new destination brands. Retrieved December 28, 2017, from
http://www.thejakartapost.com/news/2017/06/15/indonesia-announces-10-new-destination-
brands.html
Telecommunication (Publication). (n.d.). Retrieved
https://www.bps.go.id/publication/2016/11/30/613d3773b30c107a3c0d65cb/statistik-telekomunikasi-indonesia-2015.html
Telecommunication subscribers(Publication). (n.d.). Retrieved
https://www.bps.go.id/publication/2016/11/30/613d3773b30c107a3c0d65cb/statistik-telekomunikasi-indonesia-2015.html
The Comparative Economic Impact of Travel & Tourism (Rep.). (n.d.). Retrieved from
https://www.wttc.org/-/media/files/reports/benchmark
reports/the_comparative_economic_impact_of_travel__tourism.pdf
The Travel & Tourism Competitiveness Report 2017 (Rep.). (n.d.). Retrieved from
http://www3.weforum.org/docs/WEF_TTCR_2017_web_0401.pdf
Travel & Tourism Competitiveness Index (TTCI). (n.d.). Retrieved December 28, 2017, from
http://www.oceanhealthindex.org/methodology/components/tourism-competitiveness-index-tci
Travel & tourism: global economic impact & issues 2017 (Rep.). (n.d.). Retrieved from
Warsito. (2001). Taxlaw. Jakarta: PT. Rajawali Grafindo Persada. Page 128.
229
Advances in Economics, Business and Management Research (AEBMR), volume 52