the coming wave: where do emerging market …ftp.iza.org/dp9405.pdfthe coming wave: where do...
TRANSCRIPT

Forschungsinstitut zur Zukunft der ArbeitInstitute for the Study of Labor
DI
SC
US
SI
ON
P
AP
ER
S
ER
IE
S
The Coming Wave:Where Do Emerging Market Investors Put Their Money?
IZA DP No. 9405
October 2015
G. Andrew KarolyiDavid T. NgEswar S. Prasad

The Coming Wave: Where Do Emerging Market Investors
Put Their Money?
G. Andrew Karolyi Cornell University
David T. Ng Cornell University
Eswar S. Prasad
Cornell University and IZA
Discussion Paper No. 9405 October 2015
IZA
P.O. Box 7240 53072 Bonn
Germany
Phone: +49-228-3894-0 Fax: +49-228-3894-180
E-mail: [email protected]
Any opinions expressed here are those of the author(s) and not those of IZA. Research published in this series may include views on policy, but the institute itself takes no institutional policy positions. The IZA research network is committed to the IZA Guiding Principles of Research Integrity. The Institute for the Study of Labor (IZA) in Bonn is a local and virtual international research center and a place of communication between science, politics and business. IZA is an independent nonprofit organization supported by Deutsche Post Foundation. The center is associated with the University of Bonn and offers a stimulating research environment through its international network, workshops and conferences, data service, project support, research visits and doctoral program. IZA engages in (i) original and internationally competitive research in all fields of labor economics, (ii) development of policy concepts, and (iii) dissemination of research results and concepts to the interested public. IZA Discussion Papers often represent preliminary work and are circulated to encourage discussion. Citation of such a paper should account for its provisional character. A revised version may be available directly from the author.

IZA Discussion Paper No. 9405 October 2015
ABSTRACT
The Coming Wave: Where Do Emerging Market Investors Put Their Money?*
We examine how emerging market (EM) investors allocate their stock portfolios internationally. Using both country-level and institution-level data, we find that the coming wave of EM investors systematically over- and under-weight their holdings in some target countries. These abnormal foreign allocation biases of EM investors offer robust support of the information endowment hypothesis of van Nieuwerburgh and Veldkamp (2009). Specifically, past capital and trade flows from a foreign country to the home country create an information endowment (or advantage) that lead home country investments to be overweight that foreign country. At the institutional level, information advantage proxies based on relationships between EM institutional investors and the headquarters of their parent companies have strong explanatory power for international portfolio allocations. The results remain robust after controlling for other factors like geographic and other measures of economic proximity, economic and capital market development, market integration, market returns and correlation, and corporate governance. The information advantage effect is stronger for EM investors for which external portfolios exhibit a higher degree of concentration. JEL Classification: G11, G15, F21 Keywords: global portfolio allocation, portfolio equity investment, institutional investors,
emerging market economies Corresponding author: Eswar Prasad Dyson School of Applied Economics and Management Department of Economics Cornell University 440 Warren Hall Ithaca, NY 14853 USA E-mail: [email protected]
* We gratefully acknowledge useful comments from seminar participants at Cornell and the Hong Kong Monetary Authority. Kai Wu provided excellent research assistance. Laura Ardila, Abhinav Rangarajan, and Boyang Zhang also contributed to this project. All remaining errors are of course the responsibility of the authors alone.

1
1. Introduction
Emerging market economies are playing an increasingly prominent role in global finance,
with outflows of financial capital from these economies rapidly gathering momentum. From 2000
to 2014, foreign exchange reserves of these economies increased by $7.5 trillion, with about half
of this buildup accounted for by China. These economies are now increasingly liberalizing private
outflows rather than accumulating more low-yielding assets on central bank balance sheets. Rising
domestic incomes have increased their private sector demand for foreign investments, both for
diversification purposes and for the acquisition of higher-quality assets. Institutional investors such
as mutual funds, pension funds, and insurance companies are investment vehicles creating ever
more avenues for portfolio diversification through outward investments. These factors, along with
continued capital account liberalization and domestic financial market development, are likely to
lead to further increases in private capital outflows from emerging markets.
The portfolio outflows from emerging markets are still relatively small, but growing
rapidly. According to IMF data on external assets and liabilities, emerging markets’ share of global
external portfolio equity assets rose from 5 percent in 2000 to 11 percent in 2011. Official data on
international investment positions show that emerging markets’ external portfolio equity assets
rose from $52 billion in 2000 to $347 billion in 2013. Inflows from emerging markets are playing
an increasingly important role in external portfolio liabilities of even major developed market
economies. Indeed, the share of foreign holdings of U.S. equities accounted for by emerging
market investors rose from 2 percent in 2002 to 8 percent in 2013.1
1 The updated Lane and Milesi-Ferretti (2008) database, referred to as “External Wealth of Nations” Dataset, 1970-2011, is available on the IMF website and that of Professor Philip R. Lane (http://www.philiplane.org/EWN.html). Data on international investment positions are from the IMF’s International Financial Statistics. The source for U.S. Treasury data is the Treasury International Capital System (http://www.treasury.gov/resource-center/data-chart-center/tic/Pages/index.aspx).

2
Our goal in this paper is to characterize comprehensively - to the best of our knowledge for
the first time - the global allocation of foreign portfolio equity assets of emerging market investors.
Part of our analysis is based on bilateral investment positions between countries, obtained from
the IMF’s Coordinated Portfolio Investment Survey (CPIS). But, to provide an alternative
perspective, we also use FactSet Ownership (formerly referred to as “Lionshares”), a database
covering thousands of institutional investors’ holdings in different countries. By using two
different datasets, we are also able to extend previous authors’ analysis of the portfolio allocations
of developed markets, which has largely been based on the CPIS. In addition, our use of the latest
waves of data from both sources allows us to examine the effects of the global financial crisis on
the portfolio allocations of investors in both developed and emerging market economies.
We study the behavior of institutional investors in detail given their importance in
intermediating portfolio flows. Prior research on cross-border equity investment patterns of
institutional investors has almost entirely focused on investments among developed markets or
from developed to emerging market economies. For instance, in an earlier study that we build on,
Chan, Covrig, and Ng (2005) examine the extent of foreign bias in mutual fund equity allocations
of 26 source countries that include only a couple of emerging markets. In another related paper,
Ferreira and Matos (2008) examine which firms attract institutional investors from around the
world using a dataset that has mostly developed and 3 emerging market source countries. We use
the existing body of research as a point of departure but emphasize the novelty of our analysis as
one of the first attempts to examine investments from emerging markets.2
2 Other theoretical and empirical studies on the determinants of foreign investments are mostly based on data for developed market economies. Insider holding and corporate governance have been found to limit investments by foreign investors (Dahlquist, Pinkowitz, Stulz, and Williamson, 2003). Information asymmetry leads to lower foreign investment (Brennan and Cao, 1996). Investors’ behavioral biases make them view foreign assets mainly as vehicles for placing risky bets, often resulting in poor portfolio performance (Bailey, Kumar, and Ng, 2008). Investors avoid investing in countries with less liquid financial markets

3
A basic theoretical benchmark is that investors in all countries, including emerging markets,
should hold the same market capitalization-weighted basket of major stock market indexes—the
world portfolio. But a large body of research in international finance has documented that this
benchmark is violated in two dimensions. First, home bias is a pervasive phenomenon.3 Second, a
substantial fraction of the aggregate outward portfolio investment reveals systematic over- and
under-weightings across countries – the so-called “foreign allocation bias” or “foreign bias” - that
tend to be driven by factors such as geographic proximity, linguistic similarity, cultural ties, and
other factors that reflect a “familiarity” (or regional) bias.4
In this paper, we focus on the foreign bias as our objective is to study foreign portfolio
investment patterns among emerging market investors. We specifically define the foreign
allocation bias as the extent to which international portfolio allocations across destination countries
deviate from their respective market-capitalization weights in the world market portfolio. We find
emerging market investors’ portfolio allocations on average exhibit significantly greater overall
foreign allocation biases in absolute magnitudes and higher country concentrations than those of
developed market economies. To guide our empirical analysis, we turn to the concept of
information immobility proposed by van Nieuwerburgh and Veldkamp (2009). Rather than relying
on information asymmetries, which should in principle decline over time, their theoretical model
recognizes that investors face a choice in deciding which assets to acquire information about when
there are multiple risky assets in the investment opportunity set. For instance, investors have a
(Karolyi, Lee, and van Dijk, 2012). Bartram, Griffin, Lim, and Ng (2013) document the effects of institutional investor ownership on correlations of asset prices across the world. 3 See for example, French and Poterba (1991), Bohn and Tesar (1996), Baxter and Jermann (1997), Coval and Moskowitz (1999), and Ahearne, Griever, and Warnock (2004). For a survey of the home bias literature, see Lewis (1999). 4 See, among many others, Portes and Rey (2005). Karolyi and Stulz (2003) position the literature on the home bias relative to theories on international portfolio choice. Cooper, Sercu, and Vanpeé (2013) furnish a useful up-to-date survey of the home and foreign bias literature.

4
comparative advantage in learning about their domestic assets. Even as information about foreign
markets becomes easier to obtain, the initial information endowment leads investors to exert more
effort in acquiring additional information about domestic assets, magnifying their comparative
advantage. Similarly, investors would prefer to invest in foreign countries where they had initial
information endowment. This provides a rationalization for the persistence of home bias and a
further prediction about where foreign allocation biases are likely to be most acute.
We propose empirical proxies on a country level and on an institutional investor level to
detect possible emerging market investors’ information endowments for a particular destination
country for their outward investments. On a country level, the proxies are historical foreign direct
investment (FDI) and trade flows between the home and destination country for outward portfolio
investments. 5 Such historical FDI and trade flows typically result in business contacts and
investment relationships that could serve as a source of the initial information endowment. We
focus on trade as the main source of information endowments, as they have become dominant in
gross inflows into emerging markets and are more likely to have information content for those
countries’ institutional investors than debt inflows.6
On an institutional investor level, we propose new empirical proxies for information
endowments by exploiting the granularity of the FactSet LionShares data. Many emerging market
institutions are foreign subsidiaries of parent institutions headquartered abroad. Through corporate
relationships between parent and subsidiary institutions, these subsidiaries may build up
5 FDI as an information endowment proxy was used by Andrade and Chhaochharia (2010), drawing upon the theoretical work of Razin, Sadka and Yuen (1998, 1999) and Goldstein and Razin (2006). As a motivation for the second proxy, Lane and Milesi-Ferretti (2008) find that bilateral trade in goods and services is an important determinant of cross-border portfolio equity holdings. 6 See Prasad (2012).

5
information endowments on their parent institutions’ home country and on “Peer” countries where
their parent institutions have set up other foreign subsidiaries.
We find strong and robust evidence to support our formulation of the information
endowment hypothesis. More importantly, information endowments show themselves to play an
even bigger role in explaining the investment patterns of emerging market allocations relative to
those of developed markets and to institutional investors domiciled in developed markets. The
results remain strong when we put the hypothesis to an even more rigorous test by examining the
investment patterns of specific institutional investors using information endowment proxies based
on the location of the parent company of emerging market institutional investors that are foreign
subsidiaries (for non-indigenous institutions) and the location of other foreign subsidiaries of the
parent company. Both of these proxies turn out to be important determinants of the allocation
patterns of emerging market institutional investors.
We also find that the information endowment proxies are more important in explaining
emerging market portfolio allocations when those portfolios are more concentrated. This finding
is consistent with van Nieuwerburgh and Veldkamp’s (2009, 2010) concept of information
advantage, where investors who can first collect information systematically deviates from holding
a diversified portfolio. These findings are consistent with those of Choi et al. (2014), who find
that—as suggested by the information advantage model—institutional investors with higher
industry and country concentration in their investment allocations exhibit better portfolio
performance. Finally, we examine an ancillary implication of van Nieuwerburgh and Veldkamp’s
(2009) model that the information endowment effect is more important when the investment
destination country is larger. In principle, the channels for securing an information advantage
should become more important in affecting portfolio allocations when the incentive to use this

6
information, as measured by the size of the destination market, is larger. However, we do not find
evidence to support this hypothesis.
Our paper is most closely related to the work of Andrade and Chhaochharia (2010), Chan,
Covrig, and Ng (2005), and others cited above, but it contributes to the larger debate in
international finance on what are the determinants of foreign portfolio choice. The work of Kang
and Stulz (1997), Ahearne et al. (2004), Gelos and Wei (2005) associate the home and/or foreign
biases revealed in foreign portfolio allocations to firm and country characteristics in the destination
market. Grinblatt and Keloharju (2001), Hau (2001), Choe et al. (2005), Dvorak (2005), Massa
and Simonov (2006), and Ke et al. (2012) emphasize the role of common firm/country attributes
of the source countries of the investors and of the destination countries for their investments toward
understanding familiarity-driven or informational asymmetry factors, in general (and thus not
necessarily in the context of information endowments or information immobility of van
Niewerburgh and Veldkamp, 2009).
We must acknowledge two recent, contemporaneous papers that draw on the theory of van
Niewerburgh and Veldkamp (2009). Schumacher (2015) uncovers how mutual funds in their
foreign investment choices overweight industries that are comparatively large in their domestic
markets, with which they are well familiar, and reveals superior investment performance that
arises. He, like us and like Choi et al. (2014), motivates this industry-based connection as a source
of information advantage in the spirit of van Nieuwerburgh and Veldkamp (2009). Bekaert et al.
(2015) study international equity allocations of 3.8 million individuals in 401(k) plans in the U.S.
showing enormous cross-individual variation, strong cohort effects by age and geographic location
within the U.S. and the critical influence of financial advisors. The authors associate the individual

7
investor’s heterogeneity in preferences or background to familiarity and information asymmetry
effects.7
We next outline our data and methodology in Section 2. Section 3 measures the
pervasiveness of the foreign allocation bias across emerging and developed countries and Section
4 evaluates the primary determinants of that bias. We turn our attention to specific tests of the
information endowment hypothesis in Section 5. A battery of robustness tests are discussed in
Section 6 before we conclude the paper.
2. Data and Methodology
In this section, we provide an overview of the main data sources employed in our analysis,
which covers the period 2001-2011. We then outline the basic empirical methodology.
2.1 Data
We use two sources to construct data on country-level external portfolio investment stocks.
The first is the IMF’s Coordinated Portfolio Investment Survey (CPIS), which provides data on
aggregate bilateral portfolio equity holdings for most major developed and emerging market
economies. This dataset has been employed in previous studies, mostly for analyzing portfolio
allocations of developed economies.
The second and relatively more novel source that we use is FactSet Lionshares, which
covers tens of thousands of security-level domestic and international holdings of institutional
investors (mostly mutual funds and investment companies) around the world. LionShares contains
two main databases: aggregate institutional filings (similar to 13f in the U.S.), and a mutual fund
7 Bekaert et al. (2015) further associate the intriguing finding in their study of the magnitude of foreign biases among individual investors across the U.S. based on their working for international versus domestic firms to the same phenomenon in Brown, et al. (2015) of an in-state equity bias for state pension plans in the U.S.

8
holdings database (similar to N-CSR mutual fund filings in the U.S.).8 LionShares provides the
number of shares held by a fund or institution, as well as the total number of shares outstanding
for each stock at a point in time. In order to maximize data coverage, we use the institutional
database as our primary source but incorporate additional ownership data from the fund database
if the parent institution’s holdings are not in the institutional ownership database. We carry the
holdings information forward to the next available report date for up to three quarters. We
complement this with Datastream, a source that provides source and destination country index
returns. We also incorporate demographic, economic, and governance data from IMF and various
alternative data sources.
Both investment holdings datasets have their strengths and weaknesses. The CPIS is based
on reporting by country authorities and does not contain data for a few important countries such
as China as a source country. However, China does appear in the dataset as a destination country
since other countries that report to the CPIS include it in their own portfolio asset allocations.
LionShares provides broader country coverage, including China, although the coverage of
institutions in some emerging markets is limited, especially in the early period of the sample. By
analyzing both sets of data, which no other authors have done, we aim to provide a more
comprehensive and reliable picture of patterns of international equity allocations of emerging
markets.
We start with a sample of 53 source countries from CPIS, classified into 26 developed
markets and 27 emerging markets based on the Morgan Stanley Capital International (MSCI)
8 We follow the procedures outlined in Ferreira and Matos (2008) and Bartram, Griffin, Lim, and Ng (2015) for cleaning this dataset and augment that with other standard checks for 13f filings. Thus, we obtain the historical FactSet LionShares database that is free from survivorship bias. FactSet Ownership data is compiled from publicly available information: filings obtained in various countries supplemented by companies’ annual reports. Wei (2010) analyzes the integrity of the data and finds that the U.S. and U.K. account for slightly over 70 percent of non-domestic capital.
9
Index Market Classification framework as of 2011. Nine other emerging market countries appear
only as destination countries. Appendix A contains the list of countries in CPIS and their
categorization into developed or emerging market economies.
Panel A of Appendix B shows the availability of CPIS data on source country-destination
country pairs, where the source countries are limited to the group of emerging markets. We
dropped countries that had no data or had missing data in certain years. The total number of
country-pair-year observations after applying these screens is 9,717, resulting in an average of 883
observations per year (a source-country destination-country pair with data available for a given
year counts as one observation). About two-third of the observations (6,335) indicate positive
holdings. The CPIS distinguishes between zeroes and missing observations, so the remainder
(3,382 observations) constitutes true zero holdings.
Panel B of Appendix B shows the extent of institutional coverage provided by FactSet
LionShares. Over the period 2001-2011, the average number (per year) of institutional investors
based in developed markets is 2,833 while the corresponding number for emerging markets is 73.
The coverage of institutional investors in both sets of countries increases over time, with 3,330
institutions in developed markets and 151 in emerging markets in 2011. The bottom rows of this
panel show the number of institution-destination country observations by year for institutions
based in emerging markets. The total number over the full sample is 9,970 observations (an
average of 906 per year). If we assume that the non-reported institution-destination country
observations in fact represent zero investments rather than missing observations, we add 34,510
observations (average of 3,147 per year) to yield a total of 44,480 observations (average of 4,044
per year). While it is plausible that missing observations are in fact zeroes, in the empirical work
we will examine the sensitivity of the results to this assumption.

10
We collected data on bilateral FDI, one of our key information endowment proxies, from
the website of the United Nations Conference on Trade and Development (UNCTAD). Among the
62 countries in our main sample, only 22 have profiles in the UNCTAD database. However, each
of these 22 country profiles often contains data on inward FDI from a source country of interest
that is not profiled. Analogously, each profile may contain data on outward FDI to a destination
country of interest that is not profiled. This allows us to obtain inward and outward FDI data for a
large fraction of our country list.9
Bilateral export and import data are available from the IMF’s Direction of Trade Statistics
(DOTS). We use the version of these data provided by Andrew Rose at
http://faculty.haas.berkeley.edu/arose/ (Rose and Spiegel, 2011). Data for the country
characteristics used in our study are taken from Rose (2005) and Karolyi (2015). Appendix C
contains a detailed description of all variables used in our empirical analysis, along with a fuller
description of data sources.
2.2 Methodology
We begin with a simple cross-country regression framework to examine international
portfolio allocations. The basic regression equation is:
𝐼𝐼𝑖𝑖,𝑗𝑗,𝑡𝑡 = 𝛼𝛼 + 𝛾𝛾1𝐶𝐶𝑗𝑗,𝑡𝑡1 + ⋯+ 𝛾𝛾𝑛𝑛𝐶𝐶𝑗𝑗,𝑡𝑡
𝑛𝑛 + 𝜀𝜀𝑖𝑖,𝑗𝑗,𝑡𝑡.
The independent variables, denoted by 𝐶𝐶𝑗𝑗,𝑡𝑡 , represent destination country characteristics. The
dependent variable 𝐼𝐼𝑖𝑖,𝑗𝑗,𝑡𝑡 is defined as the “excess investment” by investors in source country i in
9 The data are in FDI Country Profiles on the UNCTAD website. For each country profile, we collected both inward and outward FDI data. When a country pair appears twice, once as inward and once as outward investment flows, we take whichever number is larger.

11
destination country j at time t. This is given by the share of country i’s total external portfolio
allocation accounted for by country j, with this share then expressed relative to a benchmark ratio.
The baseline benchmark ratio is a traditional measure used in the literature on international
portfolio allocation: world market portfolio, which equals the stock market capitalization of
destination country j scaled by world stock market capitalization (where “world” excludes country
i). This benchmark is based on the concept that investors in every country should in theory hold
the market capitalization-weighted world portfolio. Excess investment in a particular country is
then a measure of how much investors in a given home country overweight or underweight
investments in a particular destination country relative to that benchmark.
In our empirical work, we use a large set of control variables drawing on various strands
of the literature, including the so-called “gravity approach” to modeling trade and financial flows.
The controls can be divided into the following categories: (1) Gravity variables, such as distance,
common border, common colonial heritage, colonial relationship, and common language; (2)
Market depth and size, including per capita GDP, the number of firms in the destination country,
the ratio of market capitalization to GDP, market turnover, and transaction fees in the destination
countries; (3) Returns-based measures, such as the differences in stock market returns between
destination and source countries in the past year, differences in stock market returns between
destination and source countries over the past five years, the variance ratio of destination country
returns over the past five years divided by the variance of source country returns over the past five
years, and return correlations between the source and destination countries over the past five years;
(4) Market integration variables, which include registration restrictions on foreign investors,
ownership restrictions on foreign investors, and currency convertibility limits in the destination

12
countries; and, (5) Governance indicators, including government effectiveness, regulatory burden,
and rule of law in the destination countries.
All of the regressions include three sets of fixed effects—for year, source country, and
destination country. We also allow for heteroscedasticity-consistent and robust standard errors
with double clustering at the destination country and year levels.
Our empirical evaluation of the information endowment hypothesis involves examining
how past inflows of FDI into an emerging market (indexed by i) from a particular foreign country
(indexed by j) affect portfolio investment from that emerging market into that specific foreign
country. Alternatively, the information endowment could be created by a historical trading
relationship, proxied by the share of the relevant emerging market’s past trade accounted for by a
particular foreign country. More specifically, we ask if bilateral FDI inflows (from country j to
country i) or bilateral trade (between country j and country i) during a reference period (1991-
2000) affect portfolio investment in the reverse direction (from country i to country j) during a
subsequent period (2000-2012). The regression equation then becomes:
𝐼𝐼𝑖𝑖,𝑗𝑗,𝑡𝑡 = 𝛼𝛼 + 𝛽𝛽1𝐼𝐼𝐸𝐸𝑖𝑖,𝑗𝑗,91−00 + 𝛾𝛾1𝐶𝐶𝑗𝑗,𝑡𝑡1 + ⋯+ 𝛾𝛾𝑛𝑛𝐶𝐶𝑗𝑗,𝑡𝑡
𝑛𝑛 + 𝜀𝜀𝑖𝑖,𝑗𝑗,𝑡𝑡,
where 𝐼𝐼𝐸𝐸𝑖𝑖,𝑗𝑗,91−00 denotes 𝑇𝑇𝑇𝑇𝑇𝑇𝑇𝑇𝑇𝑇𝑖𝑖,𝑗𝑗,91−00 or 𝐹𝐹𝐹𝐹𝐼𝐼𝑖𝑖,𝑗𝑗,91−00. Our use of lagged FDI inflows and trade
shares as information endowment proxies partly obviates potential concerns about endogeneity.
The choice of a reference period of the 1990s is an arbitrary one based on data availability, but it
predates the period of evaluation of the foreign portfolio allocations (2000s).
Other than the aggregate-level analysis, we are also interested in examining the portfolio
allocation patterns of individual institutional investors using a similar empirical framework. The
regression then takes the following form:
𝐼𝐼𝑖𝑖,𝑗𝑗,𝑡𝑡 = 𝛼𝛼 + 𝛽𝛽1𝐼𝐼𝐸𝐸𝑖𝑖,𝑗𝑗,91−00 + 𝛾𝛾1𝐶𝐶𝑗𝑗,𝑡𝑡1 + ⋯+ 𝛾𝛾𝑛𝑛𝐶𝐶𝑗𝑗,𝑡𝑡
𝑛𝑛 + 𝜀𝜀𝑖𝑖,𝑗𝑗,𝑡𝑡,

13
where the dependent variable now represents portfolio investments from an emerging market
institution i into destination country j at time t. It is defined as follows: excess investment equals
the portfolio investment from emerging market institution i into destination country j divided by
the portfolio investment from emerging market institution i to all countries, minus the benchmark
ratio. The dependent variable thus measures whether a particular emerging market institution’s
external portfolio equity investments are disproportionately weighted towards a specific foreign
country. The baseline benchmark remains the same as for the regressions using the aggregate data:
world market portfolio now equals the stock market capitalization of destination country j scaled
by world stock market capitalization, where “world” excludes the country in which institution i is
domiciled. The dependent variable captures how allocation patterns of emerging market
institutional investors deviate from the market capitalization-weighted world portfolio. The
dependent variable is constructed using data for the period 2001-2011.
3. How Pervasive is Foreign Allocation Bias?
We begin with a descriptive overview of patterns of external portfolio (equity) investment
from emerging market economies and compare them with the corresponding investment patterns
of developed market economies. 10 We define foreign allocation bias as the extent to which
countries deviate from the world market portfolio in their foreign allocations. That is, once
10 This part of the paper is related to the broader literature on emerging market countries’ capital market liberalizations. Some papers study the asset pricing effects of market integration and segmentation (Errunza and Losq, 1985) and the scope of international pricing (Harvey, 1991; Bekaert and Harvey, 1997, 2002, 2003; and Bekaert, Harvey, Lundblad, and Siegel, 2009). Others examine the macroeconomic consequences of relaxation of capital constraints (see Prasad and Rajan, 2008, for a survey). Our paper is also related to the literature on mutual fund investments in emerging markets. For instance, Kaminsky, Lyons, and Schmukler (2004) look at strategies of mutual funds in regard to their investments in emerging markets, and the role they play during crises. Jotikasthira, Lundblad, and Ramadorai (2011) show that domestic mutual funds can dislocate emerging market returns and induce higher correlations with developed markets. Again, almost all of this prior literature is about investments into emerging markets.

14
investors in a country have decided how much of their total portfolio will be allocated to foreign
investments, our aim is to examine how much that cross-country allocation deviates from the
market capitalization-weighted world portfolio.
We construct a measure of foreign allocation bias for each country as follows. We first
evaluate the deviation between the share of a country’s portfolio allocated to a particular
destination country and that destination country’s share in the world portfolio. We then sum up the
absolute values of that deviation for the home country relative to all of the potential destination
countries (including those countries where the home country might not have any investment at all).
To account for market size, this sum is adjusted so that each destination country’s weight is given
by its relative market capitalization (measured relative to the global total market capitalization,
expressed in a common currency and excluding the source country). All of these calculations are
based on CPIS data.
Figure 1 shows the absolute magnitude of foreign allocation bias for each of the source
countries covered in our sample. The extent of foreign allocation bias is generally higher for
emerging markets (Panel A) relative to developed markets (Panel B). The median of this measure
of foreign allocation bias is 0.11 for emerging markets and 0.08 for developed markets.11 A value
of 0.10 implies that, on average, the country’s portfolio overweights or underweights investments
in potential destination markets by 10 percent, with the weights of each of the potential destination
markets in that formula determined by their respective market capitalization. Among emerging
markets, foreign allocation bias ranges from 0.21 for Venezuela to 0.02 for Slovenia. Among
developed markets, this measure ranges from 0.17 for Hong Kong to 0.03 for the U.S. We do not
11 This refers to the cross-country median of the foreign allocation bias for all home countries in their respective groups. The median of the unweighted foreign allocation bias was 0.04 for emerging market economies and 0.02 for developed market economies.

15
have a well-defined metric for characterizing the extent of foreign allocation bias that we have
documented as being small or large. But it is clearly quantitatively significant and is on average
larger for emerging markets than for developed economies.
A complementary approach to that above is to compute concentration ratios for
international portfolios (Choi et al., 2014, Schumacher, 2015). This provides a summary measure
of how much a country’s portfolio allocation is concentrated among destination countries relative
to the benchmark of the market capitalization-weighted world market portfolio (results not shown
here). For emerging markets, the average concentration ratio was 0.90 in 2001, compared to 0.75
for developed economies, a statistically significant difference. The averages for the two groups of
countries rise to 1.08 and 0.86, respectively, by 2011 and the average is significantly higher for
emerging markets in every year of the sample. This exercise confirms the earlier result that
emerging markets’ international portfolios reveal higher absolute foreign allocation bias than those
of developed markets.
Next, we examine if there are certain destination countries that are systematically
underweight or overweight (relative to the world market portfolio benchmark described above) in
the international portfolio allocation decisions of the countries in our sample. Figure 2 shows how
much a given destination country is overweighted (or underweighted) in the international
portfolios of developed and emerging market countries, respectively. Only the destination
countries among the 10 largest in overweightings and 10 largest in underweightings are displayed.
For each destination country, we calculate the excess (positive or negative) investment ratio for
each source country in each year, and then take a weighted average across source countries and

16
years. Each source country is weighted by its share of the total market capitalization in its
respective group of source countries.12
Among developed market economies (Panel A), there seems to be a systematic
overweighting of many European countries in international portfolios. This could be the result of
a regional bias among these countries, which tend to invest heavily in each other’s markets. There
is significant underweighting of China, Japan, and the U.S., and also of the major emerging
markets. Emerging markets (Panel B) also underweight China, Japan, and the U.S. in their
international portfolios, although the extent of this underweighting of the U.S. is less severe than
in the case of developed market portfolios.
Figure 3 shows how the allocations of emerging market and developed market investors to
four major destination countries—U.S., U.K., Japan, and Germany—have evolved over time. In
2001, both groups of source countries underweighted the U.S. in their international portfolios
(relative to U.S. market capitalization) by 15% and 35%, respectively. For emerging market
investors, investments in the U.S. account for a rising share of their portfolios over time. After a
downward blip in 2008, the trend resumes and in 2010-11, investors from these countries were
actually overweight U.S. markets. Developed market investors have remained slightly (5%)
underweight in U.S. markets as of 2011. Investors from both sets of countries have consistently
overweighted the U.K. and underweighted Japan in their foreign investment portfolios. In both
cases, the extent of the bias was larger in absolute terms for developed market investors. While
developed market investors have consistently overweighted Germany, in recent years emerging
market investors have alternated between being slightly overweight and slightly underweight.
12 The unweighted results are similar, although the degree of over- or under-weighting of specific destination countries was in general larger in absolute terms.

17
Table 1 reports the external equity investment positions by emerging and developed market
investors according to the top 20 destination markets averaged across the 2000-2011 period. This
is for the CPIS dataset only. In addition to the average investment (in current U.S. dollars millions),
we report the average investment ratio for that destination market, the average benchmark ratio
(according to the world market portfolio), and the average excess allocation. For both emerging
and developed market investors, the U.S. is the destination market with the largest average
investment ($43 billion among emerging, $1.65 trillion among developed), the highest average
investment ratio, but also strikingly the largest negative excess allocations relative to the
benchmark (-6.98% for emerging markets, -12.10%, for developed markets). Many European
markets, such as the U.K., Germany, Switzerland, Netherlands, find themselves among the ranks
of the top destination markets for both sets of investors. But there are also important distinctions
between the two groups. The emerging market investors feature Bahrain, Singapore, UAE, Russia,
and Turkey, for example, none of which make the top 20 markets for developed investors.
Furthermore, there are destination countries, like Switzerland, which feature as an overweight (-
0.29%) for emerging market investors and an overweight (0.72%) for developed market investors.
The country holdings are concentrated among the top 20 destination countries for both sets of
investor countries: the top 20 destination markets represent 94.7% of the $159 billion for emerging
markets and 94.3% of the $9.04 trillion for developed markets.
One interesting question is whether the global financial crisis led to a substantial reordering
of investment destinations in foreign portfolios. Appendix Table A1 lists the absolute amounts of
international portfolio equity allocations (based on the CPIS dataset) in 2008-09. The table is
constructed in a parallel way to Table 1. For emerging market investors, the U.S and the U.K.
remained by far the top destinations in terms of equity holdings. Relative to market capitalization

18
of these two markets, however, investments in the U.S. were underweight about 4 percent while
those in the U.K. were overweight about 8 percent. Developed market investors were 9 percent
underweight the U.S. market and 4 percent overweight the U.K. markets during this turbulent
period. Investors from both groups of countries remained substantially overweight in Luxembourg
during this period. A number of emerging markets appear among the list of top 20 destination
countries for emerging market portfolio holdings. By contrast, only three emerging markets (China,
Brazil, and India) appear in the list of top 20 destinations for developed economy equity holdings.
China is not a major destination for equity holdings of other emerging markets, possibly because
of restrictions on foreign investors’ access to its stock markets.13
The descriptive analysis in this section demonstrates that, consistent with the work of other
authors, developed economies’ international portfolio holdings show a significant foreign
allocation bias. We find that this bias is even greater for emerging markets. But we also uncover
that there is significant cross-country variation by destination country and over time that may be
distinctly different for emerging and developed market investors. Therefore, in the analysis that
follows, our intended contribution is not just to characterize the determinants of emerging markets’
portfolio allocations but also to examine if there are systematic differences in the determinants of
those allocations relative to those for developed economies and if those differences are
meaningfully related to what existing theory predicts.
13 As noted earlier, while China does not report data to the CPIS, meaning that it does not appear in the dataset as a source country, other countries do report their holdings in China. Foreign equity investment in China is largely controlled through the Qualified Foreign Institutional Investor (QFII) program. Sharma (2015) provides a detailed analysis of the QFII program and shows that most QFIIs are based in developed markets.

19
4. Determinants of Emerging Markets’ External Portfolio Allocations
We now carry both the CPIS and FactSet Lionshares datasets forward to conduct a formal
analysis of the determinants of the portfolio allocation patterns of emerging market investors.
Table 2 presents summary statistics for the variables used in our regression analysis.14 The analysis
that follows draws on various strands of existing literature documenting the importance of several
country attributes in influencing allocation decisions. There are some important aspects of the
data that are worthy of note. First, the number of country-pair-years for which we could conduct
our analysis with the CPIS data (Panel A) ranges between 12,000 and 18,000 depending on the
control variable of choice. But the sample declines based on the availability of the main dependent
variable of interest based on the excess allocations. [Note that there are summary statistics on two
additional benchmarks for these excess allocations shown in the table that will be introduced later
in the paper.] Among the control variables, those that are the most constraining for our analysis
will be those related to market size and market integration, but they will not be as binding as the
dependent variable of interest. The sample size for the institution-country-years in the FactSet
Lionshares dataset is much larger averaging well over 40,000 observations.
Table 3 contains the baseline specifications using CPIS data. The first six columns of Panel
A report a set of regressions for emerging markets. As noted earlier, all of the regressions include
year fixed effects as well as source country and destination country fixed effects. For each
specification, we use the maximum available number of observations. This results in variations in
sample size across different specifications since not all variables are available for all countries.15
14 Summary statistics for the developed country sample of home countries are not presented, but are available from the authors. 15 To ensure that differences in sample size do not affect the results, we also re-estimated each specification using a common sample corresponding to the one used for the composite specification, listed as Model (6). It is based on 4,439 observations. Those results are not shown here but will be discussed briefly below.

20
Model (1) shows that, consistent with the results of other authors (e.g., Portes and Rey (2005)),
gravity variables that have been found to be strongly correlated with bilateral trade volumes are
also important for portfolio allocations. The level of excess allocations in specific destination
countries is negatively related to their distance from the source country, the existence of a common
border, and a common language. The latter two coefficients suggest that the notion of a “familiarity”
bias is not fully supported by the data. A colonial relationship does increase the excess allocation
of emerging market investors to a former colonial power. A common colonial heritage also drives
up excess allocations. These are economically large effects: a one-standard deviation increase in
geographic distance (0.861) is associated with a 2.5% lower excess allocation, or about 28% of its
unconditional variation. Similar economic magnitudes obtain for the other familiarity variables,
but they are, of course, correlated with each other, in turn. The adjusted R2 in this first specification
reaches as high as 25.7% with the fixed effects in tow.16
Model (2) controls for a number of destination country characteristics related to market
size and depth. The results show that the excess allocation among destination countries is
negatively related to the number of listed firms adjusted for population size in those countries
and—somewhat surprisingly—positively related to the fee variable, which measures transaction
costs. Variables that reflect the level of development and size of the destination country—per
capita GDP, the ratio of market capitalization to GDP, and market turnover—do not affect excess
allocations. Overall, the explanatory power from the market size proxies is lower with an adjusted
R2 of 19.9%.
16 We will discuss the explanatory power that comes from the source country, destination country, and year fixed effects later in the paper. An appendix table describes the relative importance of each of them by type.

21
Model (3) controls for a set of financial market variables: differences between destination
and source countries in returns; variance ratios; and return correlations. Return differentials
between the destination and source countries do not seem to influence portfolio allocations.17 A
higher variance ratio—defined as the five-year volatility of stock returns in the destination country
relative to the five-year volatility of stock returns in the source country—is associated with a lower
excess allocation. Contrary to the notion of improving diversification by investing in foreign
markets whose returns are less correlated with domestic returns, higher correlations with
destination country returns are in fact associated with larger excess allocations. Model (4) controls
for market integration variables, all of which have statistically significant coefficients that look
reasonable. Registration and ownership restrictions as well as limits on currency convertibility are
associated with smaller excess allocations. This group of variables has the weakest overall
explanatory power (adjusted R2 of only 18.7%).
Model (5) controls for country level governance variables. A higher regulatory burden has
a negative effect on excess allocations but low government effectiveness in the destination
countries does not seem to deter emerging market investors. In fact, a higher level of government
effectiveness has a slightly negative effect on excess allocations. [F-tests for the variables
examined in Models (1) to (5) indicated that each set of them was jointly statistically significant
at the 1 percent level.] Model (6) is a composite one that includes all the variables considered in
the previous columns. The statistical significance of the key coefficients from the previous
regressions is mostly preserved although not all the gravity variables remain significant, the odd
positive effect of return correlations on excess allocations disappears, and the governance variables
17 We also looked at one-year rather than five-year return differentials but that made little difference.

22
lose their significance. We replicated Models (1) to (5) using the common sample of 4,439
observations for which we had data on all control variables. There were few major differences
between those results and the results shown in Table 3.
The remaining columns of Table 3 in Models (6) to (12) replicate the benchmark CPIS
regressions but for developed markets. The determinants of developed markets’ international
portfolio allocations differ in some important ways from those of emerging markets. The gravity
variables as a group are strongly significant but, unlike in the case of emerging markets, a common
border and common language have positive effects on excess allocations. More developed
countries, as proxied by their per capita GDP, seem to receive reliably negative excess allocations
from developed market investors. A larger difference in stock returns reduces allocations while,
as in the case of emerging market allocations, positive return correlations are associated with
higher excess allocations, contrary to one criterion that ought to drive portfolio diversification.
The statistical significance of most of these coefficients is preserved in the composite
specification reported in Model (12). [Again, F-tests for the variables examined in Models (7) to
(11) indicated that each set of them was jointly statistically significant at the 1 percent level.] The
results in these columns were also largely preserved when we replicated them using the common
sample of 6,907 observations for which we had data on all of the explanatory variables.
Panel B of Table 3 contains estimates of the same twelve regressions as in Panel A but now
using the FactSet Lionshares data. The individual coefficient estimates are broadly consistent with
the results using CPIS but there are some differences. To investigate these further, we also run a
composite specification that includes all independent variables. Comparing the full composite
specifications for emerging market allocations using CPIS and LionShares in Model (6) in Panels
A and B shows considerable similarity in the results, although there are a few important differences

23
as well. Some of the gravity variables seem to have greater influence on the allocation decisions
of institutional investors than on aggregate country allocations. For institutional investors, a
common colonial heritage and common language have positive effects on excess allocations but a
past colonial relationship has a negative effect. Consistent with the results based on aggregate
allocations, higher transaction fees in the destination country are associated with larger excess
allocations by institutional investors but other market integration and market openness variables
do not affect their allocations. As expected, greater government effectiveness and a lower
regulatory burden are associated with larger excess allocations.
The remaining columns present results for institutional investors in developed markets. For
these investors as well, the gravity variables seem to have strong effects on portfolio allocation. In
addition, measures of destination market size and depth have a positive effect on excess allocations
while market restrictions have a negative effect. In other words, developed market institutional
investors seem to be more responsive to market factors than their emerging market counterparts.
One question at this juncture is whether, notwithstanding some statistically significant
coefficients, most of the explanatory power in our regressions comes from the various fixed effects.
To address this concern, we ran regressions just on each set of fixed effects. The results are
reported in Appendix Table A3.18
18 We only summarize the key conclusions here. For emerging market allocations, the year fixed effects have little explanatory power. In the CPIS data, the source country fixed effects account for about 25% of the adjusted R2 of the composite regression while the destination country fixed effects account for about 44%. When we switch to the FactSet LionShares data, the year and source country fixed effects become unimportant explanatory factors while the destination country fixed effects account for about two-thirds of the overall explanatory power of the composite regression. Our interpretation of these results is that, while destination country fixed effects are clearly very important in the overall adjusted R2 of the composite specifications, the other control variables in our regressions together still add considerable explanatory power. When we repeat this exercise for developed markets, the year and source country fixed effects turn out to be unimportant. The destination country fixed effects account for about 75% of the adjusted R2 of the composite specification using CPIS data and 83% using the FactSet LionShares data. Thus, the residual explanatory power of the variables other than the fixed effects in explaining international portfolio allocations is slightly greater for emerging markets than for developed markets.

24
Our main conclusion from the baseline regressions based on the CPIS and LionShares
datasets is that country attributes previously documented in other papers based on developed
economy data (e.g., Chan, Covrig, and Ng, 2005) are important for emerging market portfolio
allocations as well. Interestingly, there seem to be few destination country characteristics that
robustly influence EM international portfolio allocation decisions in a manner different from those
of DM allocations.19 Variables that capture (i) market size and depth and (ii) market integration of
destination countries seem to have differential effects, although few of these results are fully robust
across different datasets and different regression specifications.
5. Testing the Information Endowment Hypothesis
The results in the previous section suggest a limited explanatory role for certain economic
determinants of portfolio allocations that, based on theoretical priors, should be important. Gravity
variables matter strongly, despite the potential benefits from optimal portfolio diversification.
Moreover, there appear to be only a few differences in the determinants of the allocation patterns
of developed market and emerging market investors. These latter results, in particular, are
surprising given that portfolio outflows from emerging market economies are a relatively recent
phenomenon, with many of these economies freeing up capital outflows only in the last decade or
two, and also because investors in these economies are presumably less sophisticated than those
in developed economies.
In view of their limited exposure to international financial markets and their nascent
information processing abilities, it is plausible that emerging market investors rely to a greater
19 We also directly confirmed this by running regressions for emerging market portfolio allocations using as the benchmark the portfolio allocations of developed markets within the same region as the relevant emerging market source country. These results are not reported here but are available from the authors.

25
extent on information endowments accumulated through earlier trade and financial relationships.
This is the central hypothesis that guides us through this study. To explore this further, we now
turn to an empirical implementation of the information endowment hypothesis of van
Nieuwerburgh and Veldkamp (2009). Given that investors in developed markets presumably have
better channels for information gathering and processing, our analysis of emerging market
economies’ outward investments and the comparison of emerging versus developed economy
investors together offer a more powerful test of the information endowment hypothesis than the
existing literature to date.
5.1 Measuring information endowments
We now examine whether emerging market countries allocate a larger proportion of their
external equity portfolios to countries that have served as important trading partners or major
sources of FDI inflows. Past trade linkages can be seen as an important basis for information
endowments. To capture financial linkages, we focus on FDI inflows, which have become
dominant in gross inflows into emerging markets (Prasad, 2012). By the mid-2000s, FDI liabilities
accounted for more than half of external liabilities of emerging markets. Portfolio equity liabilities
account for less than 10 percent of external liabilities of emerging markets economies, many of
which still have relatively underdeveloped equity markets. Debt flows are usually intermediated
through foreign and domestic financial institutions such as banks and have lower information
content from the perspective of portfolio investors in emerging markets.
We construct two proxy measures to capture the notion of an information endowment: (1)
Trade, which equals the sum of all trade flows between emerging market i and country j during
the 1991-2000 period divided by the sum of emerging market i’s total external trade during that
same 1991-2000 period; and, (2) FDI, which equals the sum of FDI flows from country j into

26
emerging market i during 1991-2000 divided by the sum of all FDI inflows into emerging market
i during 1991-2000. Since we use data on trade and FDI shares from the prior decade to explain
portfolio holdings during the 2000s, our regressions are unlikely to be affected by endogeneity (or
reverse causality) problems.
5.2 Country-level regressions
Table 4 reports the results from CPIS regressions that include the full set of controls used
in Table 3 as well as each of the information endowment proxies. The coefficient on the
information endowment variable in Model (1) is statistically significant and large. The coefficient
indicates that a 1 percentage point increase in the past level of the home country’s trade (exports
plus imports) accounted for by a particular trading partner is associated with an increase of nearly
0.5 percentage points in the excess allocation of the source emerging market’s international
portfolio to that destination country (relative to the destination country’s market capitalization-
weighted share in the world portfolio).
The coefficient on the other information variable, captured by past FDI, is reported in
Model (2) and is also significantly positive, although smaller. A one percentage point increase in
the share of FDI from a particular country to the relevant emerging market subsequently increases
that emerging market’s allocation to the concerned destination country by about 0.03 percentage
points. The standard deviation of the FDI share is about four times that of the trade share variable
(0.028 versus 0.006, see Table A2), so the quantitative significance of these two information
endowment variables is in fact somewhat closer than suggested by the simple calculations above.
These results together constitute prima facie evidence in support of the information endowment
hypothesis.

27
In Models (3) and (4), we compare these results with those for developed market portfolio
allocations. The coefficients on both information endowment variables are positive and
statistically significant, suggesting that these endowments play an important role in determining
portfolio allocations even of reasonably sophisticated investors.
5.3 Do the Benchmarks for Measuring Excess Allocations Matter?
One question is whether the results are driven by our use of a benchmark based on the
market-capitalization weighted world market portfolio. A large body of work has documented that
country characteristics such as investability, market liquidity, quality of corporate and public
governance, political stability, and stability of macroeconomic policies affect both the volume and
composition of a country’s external liability portfolio. It is possible that both emerging market and
developed market portfolio allocations are driven by these factors in a way that we have failed to
control for in our various specifications, so our use of the world market portfolio weights as the
benchmark for the foreign allocation bias might throw a veil over interesting differences in the
portfolio allocation patterns of emerging market and developed market investors. To address this
point, we now present results using two alternative benchmarks that also provide a more direct
comparison with the results for developed markets.
We first construct a measure that directly compares emerging market allocations in a
particular destination country relative to the allocations of developed markets (within the same
region as the source country) in that destination country. In other words, we ask whether, relative
to their regional developed market counterparts, emerging market investors overweight a particular
country in their portfolios. This provides a direct comparison between the external investment
patterns of emerging market investors and their developed market counterparts, with the implicit
assumption that investors from both types of economies care about the same set of destination

28
country characteristics when making their portfolio allocation decisions. We call this benchmark,
Benchmark 2, a regional developed-market benchmark, which we compute as the portfolio
investment from all developed markets within the region of emerging market i to country j divided
by the portfolio investment from all developed markets within the region of emerging market i to
all countries. The dependent variable now captures how emerging market foreign allocation
patterns differ from those of developed markets.20
Models (5) and (6) show the results from regressions using regional developed market
benchmark. The coefficient on the trade variable is positive and significant. The estimate indicates
that a one percentage point increase in the home country’s share of past trade accounted for by a
particular trading partner country has a 0.6 percentage point higher effect on average emerging
market portfolio allocations to that trading partner country relative to average developed economy
allocations to that country. The FDI ratio, by contrast, does not have differential effects on the
allocation patterns of emerging versus developed market investors.
Next, instead of using developed markets in the same regions, we create an alternative
benchmark, which we call Benchmark 3, based on propensity score matching between a given
emerging market and all developed markets in the sample using a set of variables that include
physical distance, a dummy for a common border, common language, common colonial heritage,
previous colonial relationship, and participation in a regional trade agreement. The allocations of
the propensity-score matched developed market i are then used as the benchmark against which
the concerned emerging market’s allocations are evaluated. Specifically, the propensity score-
matched benchmark is equal to the portfolio investment from propensity score-matched developed
20 Depending on whether the regressions are based on CPIS or LionShares data, the benchmark is based on CPIS data or LionShares data aggregated up to the country level.

29
market i to destination country j divided by the portfolio investment from propensity score-
matched developed market i to all countries.
Models (7) and (8) show the results from regressions based on propensity score-matched
Benchmark 3. In this case, the coefficients on both the trade and FDI ratios are significantly
positive, confirming that the information endowments have a bigger effect on the allocation
patterns of emerging markets relative to developed markets. The coefficients on the trade ratio in
Model (7) and the FDI ratio in Model (8) are about the same as in the benchmark regressions in
Models (1) and (2), respectively, although the interpretation of the coefficients is not exactly the
same. The regression in Model (8) indicates that a 1 percentage point increase in the past share of
FDI inflows from a particular foreign country results in the average emerging market directing
0.03 percentage points more of its allocation to that country relative to the allocation of the average
developed economy.
Although we do not report the coefficients on other controls here, it is worth pointing out
that relatively few of the other coefficients were significant in Models (5) to (8) in this table. This
means that, other than the information endowment variables, the remaining explanatory variables
do not have markedly differential effects on emerging market versus developed economy foreign
portfolio allocations. When we include both information endowment variables simultaneously, the
trade share variable tends to dominate and the coefficient on the FDI ratio often turns insignificant.
These results suggest strongly that the information endowment hypothesis is of greater relevance
for portfolio allocations of emerging market economies than it is for those of developed economies.
The differences are not just statistically significant but also economically meaningful.
We conducted two further robustness tests for our baseline results. First, we used an
alternative measure of trade that includes only imports. That is, the import share is computed as

30
the sum of imports of emerging market i from trading partner country j during 1991-2000 divided
by the sum of total imports of emerging market i from all trading partner countries during 1991-
2000. The second robustness test is related to the large number of missing observations in our
dataset on account of the limited availability of FDI data. It is possible that some of these missing
observations in fact represent zeroes. We checked our main results by substituting zeroes for the
missing observations. These tests, whose results we do not report here, confirmed the robustness
of our main results regarding the effect of information endowments on portfolio allocations and
we do not pursue them further.21
5.4 Institution-level regressions
Next, we undertake a more rigorous test of the information endowment hypothesis using
institution-level data. To exploit the granularity of the LionShares dataset, we use characteristics
of the specific institutions in our dataset. The first information endowment proxy we construct is
a dummy variable called Parent Country that takes the value one if the destination country j is the
country where the emerging market institution’s parent is located. The second information
endowment is a dummy variable called Peer Country that takes the value one if the destination
country j contains a foreign subsidiary of the parent institution of emerging market institution i.22
We propose these two variables as information endowment proxies that are specific to each
institution, which is potentially more relevant to their allocation patterns than aggregate trade or
21 These results are available from the authors. 22 Creating these information endowment variables involved a matching exercise based on hand-collected information from websites. For each of the emerging market institutional investors in FactSet Lionshares, we started by using institution names, complemented by website reviews, to uncover evidence of subsidiary-parent relationships. These classifications are available from the authors upon request. Once we determine that a particular emerging market institution is the foreign subsidiary of a parent institution, we identify the country where its parent institution is domiciled. We then use the same procedure of a name-based search and a website search of parent company information to identify other emerging market countries where the parent institution has foreign subsidiaries.

31
FDI flows. The dependent variable and the baseline benchmark for the institution-level regressions
are as described above. The controls include the full set of destination country characteristics used
in the baseline regressions in Table 3, as well as year, source country, and destination country fixed
effects. Given how the information endowment proxies are constructed, we can not include
institution-specific fixed effects.
The results are presented in Panel B of Table 4. Using the world market portfolio weights
for the benchmark ratio to compute excess allocations, Models (1) and (2) show that both
information endowment variables are statistically significant. Institutions in emerging markets
tend to have an average excess allocation of 3.2 percentage points in the country that their parent
institution is located in. Interestingly, the peer effect is quantitatively larger than this parent
institution effect. For an emerging market institutional investor, the existence of a foreign
subsidiary of the same parent institution is associated with a 5.3 percentage point increase in the
excess investment allocation in that country relative to that country’s share in the market
capitalization-weighted world portfolio.
Next, we examine whether the allocations of individual institutional investors based in
emerging markets are on average more or less influenced by such information endowments than
the allocations of institutional investors based in developed market economies. Since developed
market institutional investors are likely to have longer investment histories and other channels of
information acquisition, one would expect that the information endowments matter less for their
allocation decisions. We first use Benchmark 2 for which the excess investment allocation is
calculated relative to the average investment allocations (ratios) of developed market in the same
region as the home country of institution i. The results, shown in Models (3) and (4) of Panel B,
32
indicate that the information endowment effect on allocation patterns is much greater for
institutional investors in emerging markets relative to those in developed markets.
We also computed the excess investment allocation relative to another benchmark,
Benchmark 3, based on the propensity-score matched developed market economies (similar to the
earlier aggregate analysis using the CPIS data). The results, presented in the last two columns of
Panel B in Table 4, confirm the greater importance of information endowments in determining
allocations of emerging market relative to developed market institutional investors.
The main conclusion from this section is that information endowments play an important
role in driving differences between the outward portfolio allocation patterns of emerging markets
relative to developed economies. The results hold up both at the country level and for individual
institutional investors.
6. Extensions and Robustness Tests
6.1 Portfolio Concentration and the Role of Information Endowments
One issue worth exploring is whether there is a relationship between information
endowments and the degree of portfolio concentration. Van Nieuwerburgh and Veldkamp (2010)
propose there are two types of learning strategies: deepening knowledge and broadening
knowledge. According to them, investors who deepen their knowledge would hold more assets
initially familiar to them, while investors who broaden their knowledge would learn about
unfamiliar assets, undo initial advantages and reduce portfolio bias imparted by differences in
initial information. We test this implication by showing when the portfolio allocation of a country
or institutional investor is less diversified, information endowments could play a more decisive
role in determining allocations. We do not take a stand on whether information endowments

33
generate or reduce concentration in a causal sense. Rather, we ask whether information
endowments influence allocations more given different levels of portfolio concentration.
For each country, we compute a Herfindahl index of the country-level external allocations.
We construct a dummy variable that takes the value one if the index is above the median level of
the index among all source countries in that year. We then interact the concentration dummy with
the information endowment variables. If the excess allocations of countries with more-than-
average concentrated portfolios were more influenced by information endowments, then the
coefficients on the interaction terms would be positive. This is exactly what we find, as shown in
the first two columns of Table 5, Panel A, where the excess allocations are measured relative to
world portfolio benchmark, the market capitalization weighted world portfolio. The interaction
coefficients remain positive and statistically significant when we use regional developed market
benchmark, which examines emerging market allocations relative to the allocations of developed
markets that are in the same region as the home country, as in Models (3) and (4).
We conducted a similar experiment to evaluate the effects of information endowments on
the allocations of institutional investors with different degrees of portfolio concentration. In this
case, the concentration dummy takes the value one if the Herfindahl index of the country-level
allocation of the source institution portfolio in a given year is above the median among all source
institutions (based in emerging markets) in that year. We allow this dummy variable to interact
with the parent country and peer country dummies that were used as information endowment
proxies in the previous exercise. The only significant interaction coefficient in Panel B of Table
5 is that on the Peer Country × Concentration interaction variable in Model (2). That is, among
emerging market institutional investors with more-than-average concentrated external portfolios,

34
there is a stronger positive effect on allocations towards countries where a foreign subsidiary of
the investor’s parent company is located.
6.2 Parsing Information Endowments by Size of Destination Market
An under-explored implication of van Nieuwerburgh and Veldkamp’s (2009) model is that
the potential benefits of acquiring information about an investment destination increases with the
relative size of the destination country (with the size measured relative to that of the source
country). We now examine whether the relative size of investment destinations compared to the
source country affects allocation decisions.
We use two measures of size—GDP and equity market capitalization. To focus on
substantive size differences relative to the home country, we express each of these variables as a
ratio of the corresponding variable in the home country. We then construct dummy variables that
equal one if this ratio is above the median ratio among all source-destination country pairs in a
given year. In the regressions, we interact these dummies with the information endowment
variables and, of course, also include levels of information endowment variables and size dummies.
Using a similar dummy variable approach, we also examine whether return volatility in the
destination country relative to the home country affects how information endowments influence
allocation decisions, in turn.
These results, using the CPIS dataset, are reported in Table 6. In none of the cases do we
find significant coefficients on the interaction terms. In other words, information endowments do
not have differential effects on emerging market portfolio allocations to large versus small
35
destination countries or across different levels of destination market relative to home country
return volatility.23
6.3 Results Using Raw Allocations
To this point, we have used different benchmarks against which we measure excess
allocations in each potential destination country. We now examine if information endowments
matter for explaining raw allocations that are not measured with reference to any of these
benchmarks. That is, for each emerging market source country we just regress the external
portfolio shares of each potential destination country on the destination country characteristics,
information endowment variables, and full set of fixed effects.
The results are presented in Table 7. Panel A, which contains the CPIS results, shows that
past trade and FDI relationships have a significant positive effect on raw allocations. Panel B,
which contains the LionShares results, shows that the parent country and peer country information
endowment proxies have strong positive effects on raw allocations of emerging market
institutional investors. Thus, the raw investment ratios confirm the earlier results that information
endowments do have a positive effect on portfolio allocation patterns.
6.4 Additional Tests and Extensions
We conducted a variety of additional tests to check the robustness of our main results and
to consider extensions. Since these results in general confirmed our main results, we only briefly
summarize them here.
23 We found similar results, though they are not reported here, when we examined the allocation patterns of emerging market institutional investors using the FactSet LionShares dataset.

36
The regressions we have presented thus far show average results across a large and varied
group of emerging market economies. We also ran regressions separately for each country to look
for patterns in the estimated coefficients on the information endowment variables that were
systematically related to specific country characteristics. The small sample sizes for some
countries meant that the coefficients were less precisely estimated. The coefficients on the
information endowment variables were in general positive using either the CPIS or LionShares
data. However, we did not find consistent evidence across all countries to support the secondary
proposition of the information endowment hypothesis—that the information endowment should
have stronger explanatory power when the relative size of the destination country is larger.
The global financial crisis is likely to have caused a reassessment of perceived risk and
return characteristics of different markets and, therefore, could have affected international
portfolio allocations. We re-estimated the main regressions using data for the period 2009-11. The
coefficients on the information endowment variables mostly remained statistically significant for
emerging market allocations (see Appendix Table A4). In the post-crisis period, the coefficients
estimated using the CPIS data were smaller than those for the pre-crisis period or the corresponding
ones from the full sample regressions. In other words, the effects of information endowments on
external portfolio allocations became attenuated after the crisis. By contrast, in the LionShares
regressions, the coefficient on the FDI relationship information endowment proxy was higher in
the post-crisis period relative to the pre-crisis period.
There were some interesting results related to other control variables when we used the two
alternative benchmarks, which allow for a direct comparison between the determinants of the
allocation patterns of emerging market versus developed market allocations (results not shown
here). Market liquidity entered with a significant positive coefficient, indicating that in the post-

37
crisis period this variable played a larger role in emerging markets’ allocations relative to those of
developed markets. The coefficient on the control of corruption variable turned significantly
negative in both CPIS and LionShares regressions. This could reflect emerging market investors
pulling back on their allocations to developed markets, which were undergoing macroeconomic
and equity market collapses in the aftermath of the crisis.
7. Concluding Remarks
Our objective in this paper was to characterize external portfolio equity allocations of
emerging markets and analyze their determinants. This subject has received little attention in the
existing literature, most of which has been focused on portfolio investments among developed
markets or in emerging markets. The topic of our paper is important given the rapidly rising
prominence of emerging markets in global financial flows and rising foreign portfolio asset
holdings of these economies.
Our main result is that emerging market’s foreign investment patterns are consistent with
the information endowment hypothesis. External equity investments from specific emerging
markets tend to be disproportionately allocated towards countries that in the past had served as
major trading partners or were important sources of FDI inflows. The results are robust to a variety
of controls that measure financial market development, economic size, macroeconomic factors,
and institutional quality. We also exploited a detailed database on institution-level data to test a
stricter version of the information endowment hypothesis. We found that institutional investors
based in emerging markets tend to have larger excess allocations of their foreign investment
portfolios in countries where the institution’s parent is located or if the destination country contains
a foreign subsidiary of the institution’s parent.

38
Information endowments seem to be more important for determining the external portfolio
allocations of emerging markets (or emerging market institutional investors) relative to developed
markets (or developed market institutional investors). Information endowments also seem to play
a larger role in explaining the allocations of countries that have more concentrated external
portfolios. While we use a large array of control variables based on alternative theories, we do not
use a nested model that formally tests the information endowment hypothesis against alternatives.
Nevertheless, we believe the results are interesting enough to warrant further theoretical and
empirical analysis.
39
References
Ahearne, A. G., Griever, W. L., Warnock, F. E., 2004. Information costs and home bias: an analysis of US holdings of foreign equities. Journal of International Economics 62(2), 313-336.
Andrade, S. C., Chhaochharia, V., 2010. Information immobility and foreign portfolio investment.
Review of Financial Studies 23(6), 2429-2463. Bailey, W., Kumar, A., Ng, D., 2008. Foreign investments of U.S. individual investors: causes and
consequences. Management Science 54, 443-459. Bartram, S., Griffin, J., Lim, T., Ng, D., 2015. How important are foreign ownership linkages for
international stock returns? Forthcoming, Review of Financial Studies. Baxter, M., Jermann, U. J., King, R. G., 1998. Nontraded goods, nontraded factors, and
international non-diversification. Journal of International Economics 44(2), 211-229. Bekaert, G., Harvey, C. R., 1997. Emerging equity market volatility. Journal of Financial
Economics, 43(1), 29-77. Bekaert, G., Harvey, C. R., 2002. Research in emerging markets finance: looking to the future.
Emerging Markets Review, 3(4), 429-448. Bekaert, G., Harvey, C. R., 2003. Equity market liberalization in emerging markets. Journal of
Financial Research, 26(3), 275-299. Bekaert, G., Harvey, C. R., Lundblad, C., Siegel, S., 2007. Global growth opportunities and market
integration. The Journal of Finance 62(3), 1081-1137. Bekaert, G., Hoyem, K., Hu, W.Y., Ravina, E., 2015. Who is internationally diversified? Evidence
from 296 401(K). NBER Working Paper No. w21236. Bohn, H., Tesar, L. L., 1996. US equity investment in foreign markets: portfolio rebalancing or
return chasing? The American Economic Review 1996, 77-81. Brennan, M., Cao, H., 1996. Information, trade, and derivative securities. Review of Financial
Studies 9, 163-208. Chan, K., Covrig, V., Ng, L., 2005. What determines the domestic bias and foreign bias? Evidence
from mutual fund equity allocations worldwide. Journal of Finance 60(3), 1495-1534. Choe, H., Kho, B.C., Stulz, R., 2005. Do domestic investors have an edge? The trading experience
of foreign investors in Korea, Review of Financial Studies 18(6), 795-829.

40
Choi, N., Fedenia, M., Skiba, H., Sokolyk, T., 2014. Portfolio concentration and performance of institutional investors worldwide. Working paper, University of Wyoming.
Coval, J. D., Moskowitz, T.J., 1999. Home bias at home: local equity preference in domestic
portfolios. The Journal of Finance 54(6), 2045-2073. Dahlquist, M., Pinkowitz, L., Stulz, R., Williamson, R., 2003. Corporate governance and the home
bias. Journal of Financial and Quantitative Analysis 38, 87-110. Dvorak, T., 2005. Do domestic investors have an information advantage? Evidence from Indonesia,
Journal of Finance 60(3), 817-839. Edison, H., Warnock, F., 2003. A simple measure of the intensity of capital controls. Journal of
Empirical Finance 10, 81-103. Errunza, V., Losq, E., 1985. International asset pricing under mild segmentation: theory and test.
The Journal of Finance 40(1), 105-124. French, K., Poterba, J., 1991. Investor diversification and international equity markets. American
Economic Review 81(2), 222–226. Ferreira, M., Matos, P., 2008. The colors of investors’ money: The role of institutional investors
around the world. Journal of Financial Economics 88(3), 499-533. Gelos, G., Wei, S.J., 2005. Transparency and international portfolio holdings. Journal of Finance
60(5), 2987-3020.
Goldstein, I., Razin, A., 2006. An information-based trade off between foreign direct investment and foreign portfolio investment. Journal of International Economics 70, 271-295.
Grinblatt, M., Keloharju, M., 2001. How distance, language, and culture influence stockholdings and trades. Journal of Finance 56(5), 1053-1073.
Harvey, C. R., 1991. The world price of covariance risk. The Journal of Finance 46(1), 111-157.
Hau, H., 2001. Location matters: An examination of trading profits. Journal of Finance 56 (3),
1959-1983. Jotikasthira, C., Lundblad, C., Ramadorai, T., 2012. Asset fire sales and purchases and the
international transmission of funding shocks. The Journal of Finance, 67(6), 2015-2050. Kaminsky, G., Lyons, R., Schmukler, S., 2004. Managers, investors, and crises: mutual fund
strategies in emerging markets. Journal of International Economics 64(1), 113– 134. Kang, J.K., Stulz, R., 1997. Why is there a home bias? An analysis of foreign portfolio equity

41
ownership in Japan, Journal of Financial Economics 46(3), 3-28. Karolyi, G. A. 2015. Cracking the Emerging Markets Enigma. Oxford University Press, New York,
NY. Karolyi, G. A., van Dijk, M., Lee, K.H., 2012. Understanding commonality in liquidity around the
world. Journal of Financial Economics 105(1), 82-112. Karolyi, G. A., Ng, D., Prasad, E., 2013. The coming wave. Finance and Development 50(2), 30-
33. Karolyi, G.A., Stulz, R., 2003. Are financial assets priced locally or globally? Handbook of the
Economics of Finance, Volume 1, Constantinides, G., Harris, M., and Stulz, R., eds., North Holland, 975-1020.
Ke, D., Ng, L., Wang, Q.H., 2010. Home bias in foreign investment decisions. Journal of
International Business Studies 41(2), 960-976. Lane, P., Milesi-Ferretti, G., 2008. International investment patterns. The Review of Economics
and Statistics 90, 538-549.
Lewis, K. K., 1999. Trying to explain home bias in equities and consumption. Journal of Economic Literature 1999, 571-608.
Massa, M., Simonov, A., 2006. Hedging, familiarity and portfolio choice. Review of Financial
Studies 19(3), 633-685. Portes, R., Rey, H., 2005. The determinants of cross-border equity flows. Journal of International
Economics 65(2), 269-296. Prasad, E., 2012. Role reversal in global finance. Proceedings - Economic Policy Symposium -
Jackson Hole, Federal Reserve Bank of Kansas City, 339-390. Prasad, E., Rajan, R., 2008. A pragmatic approach to capital account liberalization. Journal of
Economic Perspectives 22(3), 149-72. Razin, A., 2003. FDI flows and domestic investment. CESifo Economic Studies 49, 415-428.
Razin A., Sadka E., Yuen C., 1998. A pecking order of capital flows and international tax principles. Journal of International Economics 44, 45-68.
Razin, A., Sadka, E., Yuen, C., 1999. Excessive FDI flows under asymmetric information. Proceedings, Federal Reserve Bank of San Francisco, September.
Razin, A., Sadka, E., Yuen, C., 1999. An information-based model of foreign direct investment: the gains from trade revisited. International Tax and Public Finance 6 (4), 579-596.
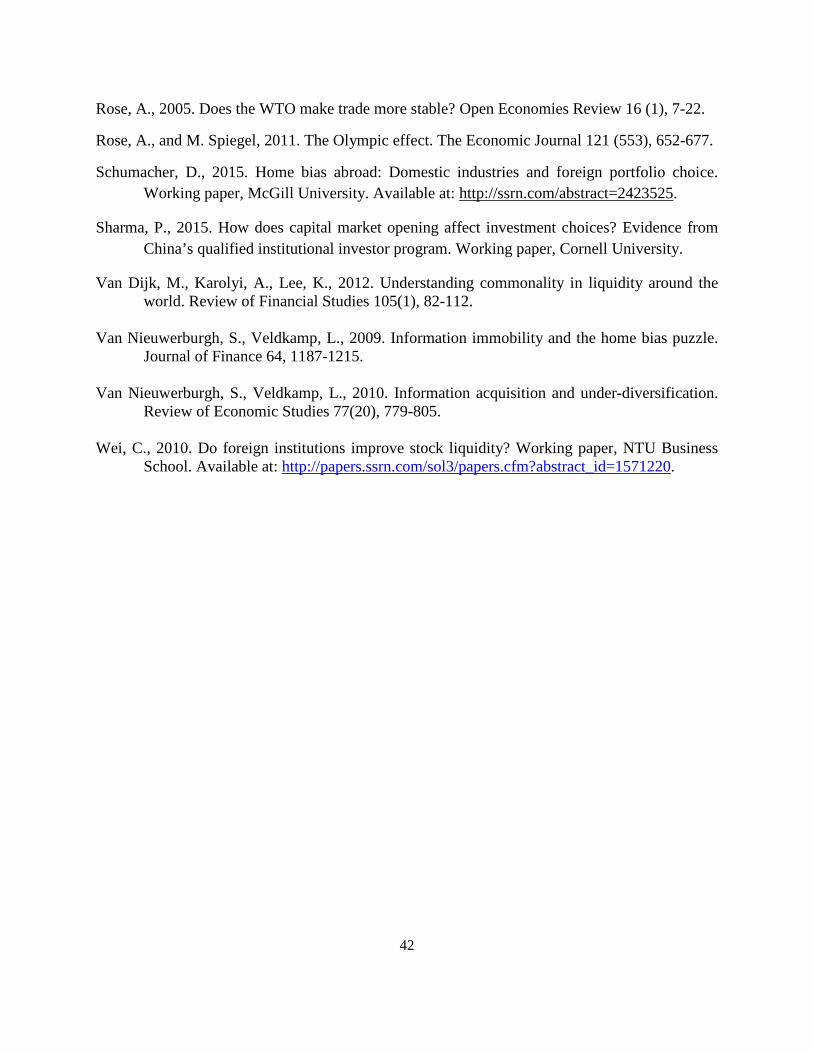
42
Rose, A., 2005. Does the WTO make trade more stable? Open Economies Review 16 (1), 7-22.
Rose, A., and M. Spiegel, 2011. The Olympic effect. The Economic Journal 121 (553), 652-677.
Schumacher, D., 2015. Home bias abroad: Domestic industries and foreign portfolio choice. Working paper, McGill University. Available at: http://ssrn.com/abstract=2423525.
Sharma, P., 2015. How does capital market opening affect investment choices? Evidence from China’s qualified institutional investor program. Working paper, Cornell University.
Van Dijk, M., Karolyi, A., Lee, K., 2012. Understanding commonality in liquidity around the world. Review of Financial Studies 105(1), 82-112.
Van Nieuwerburgh, S., Veldkamp, L., 2009. Information immobility and the home bias puzzle.
Journal of Finance 64, 1187-1215. Van Nieuwerburgh, S., Veldkamp, L., 2010. Information acquisition and under-diversification.
Review of Economic Studies 77(20), 779-805. Wei, C., 2010. Do foreign institutions improve stock liquidity? Working paper, NTU Business
School. Available at: http://papers.ssrn.com/sol3/papers.cfm?abstract_id=1571220.

Table 1. External equity investment positions, by emerging and developed market investors.
Table 1 shows the top investment destinations for external portfolio equity investments from emerging market (EM, left panel) and developed market (DM, right panel) economies. Each destination country is classified as an EM or DM economy, and the regions of the destination countries are broadly classified as North America (NA), Asia Pacific (AP), Eastern Europe, Middle East & Africa (EEMEA), and Latin America (LA). For each destination market, we compute average total equity investments across the years 2000-2011 in US dollar millions from emerging markets Panel A and from developed markets in Panel B. Destination markets are ranked by average total equity investment across years and the top twenty destination countries are displayed. The average investment ratio is calculated as follows. In each year, we calculate the investment ratio from a particular source country to a destination country as the ratio of total investment from the source country to that destination country, divided by the total investment from the source country to all destination countries. For each destination country, we take the equal-weighted average of the investment ratio across all source countries from each group (EMs in the left panel, DMs in the right panel) to compute the average investment ratio. In the left panel, the average benchmark for a destination country is calculated as follows. For each destination country in each year, we first compute the ratio of its market capitalization relative to world market capitalization minus a particular EM source country’s market capitalization. This calculation is repeated for each EM source country relevant to that destination country in that same year. For each destination country, we then take the equal-weighted average of the investment ratios across all EM source countries. Then we take the average of the benchmark ratios over the years 2000 to 2011. The difference between the average investment ratio and average benchmark gives the average excess allocation (or under allocation) for each destination country. In the right panel, we repeat the same calculations using DM source countries. In both panels, we use CPIS data to compute country-pair investment data.
Panel A. Emerging Markets (2000-2011) Panel B. Developed Markets (2000-2011)
Destination Market
Average Investment
(US $ mills.) Class Region
Average Investment
Ratio
Average Benchmark
Ratio
Average Excess
Allocation Destination
Market
Average Investment
(US $ million) Class Region
Average Investment
Ratio
Average Benchmar
k Ratio
Average Excess
Allocation United States 43,248 DM NA 0.3205 0.3902 -0.0698 United States 1,647,065 DM NA 0.2751 0.3961 -0.1210 United Kingdom 42,290 DM Europe 0.1238 0.0686 0.0552 United Kingdom 1,086,932 DM Europe 0.1102 0.0713 0.0389 Luxembourg 29,195 DM Europe 0.1606 0.0016 0.1590 Luxembourg 1,026,556 DM Europe 0.1763 0.0016 0.1747 Ireland 9,143 DM Europe 0.0381 0.0023 0.0358 Japan 699,650 DM AP 0.0489 0.0909 -0.0420 Bahrain 4,045 EM EEMEA 0.0361 0.0004 0.0357 France 601,939 DM Europe 0.0610 0.0433 0.0177 Singapore 2,584 DM AP 0.0395 0.0061 0.0334 Germany 527,861 DM Europe 0.0535 0.0323 0.0212 Brazil 2,386 EM LA 0.0087 0.0158 -0.0071 Switzerland 420,145 DM Europe 0.0308 0.0236 0.0072 Austria 2,278 DM Europe 0.0464 0.0021 0.0444 Netherlands 321,193 DM Europe 0.0301 0.0148 0.0153 France 2,023 DM Europe 0.0514 0.0416 0.0098 Canada 301,405 DM NA 0.0122 0.0341 -0.0218 Germany 1,805 DM Europe 0.0435 0.0311 0.0124 Ireland 266,204 DM Europe 0.0307 0.0024 0.0283 Netherlands 1,770 DM Europe 0.0432 0.0142 0.0289 Italy 208,200 DM Europe 0.0196 0.0164 0.0031 Belgium 1,503 DM Europe 0.0208 0.0060 0.0148 China 206,921 EM AP 0.0280 0.0560 -0.0280 Australia 1,431 DM AP 0.0263 0.0210 0.0053 Spain 193,389 DM Europe 0.0228 0.0248 -0.0020 UAE 1,429 EM EEMEA 0.0221 0.0015 0.0206 Australia 188,819 DM AP 0.0248 0.0218 0.0030 Hong Kong 1,387 DM AP 0.0232 0.0204 0.0028 Hong Kong 169,619 DM AP 0.0160 0.0212 -0.0052 Spain 1,344 DM Europe 0.0126 0.0238 -0.0113 Korea 164,259 DM AP 0.0111 0.0157 -0.0046 Russia 902 EM AP 0.0368 0.0133 0.0235 Brazil 161,816 EM LA 0.0095 0.0164 -0.0069 Switzerland 893 DM Europe 0.0198 0.0227 -0.0029 Sweden 121,485 DM Europe 0.0182 0.0098 0.0084 Japan 847 DM AP 0.0119 0.0876 -0.0757 Finland 110,772 DM Europe 0.0104 0.0048 0.0056 Turkey 665 EM EEMEA 0.0062 0.0035 0.0027 Taiwan 106,187 EM AP 0.0072 0.0126 -0.0054 Top 20 Markets 151,167 0.0546 0.0387 0.0159 Top 20 Markets 8,530,417 0.0498 0.0455 0.0043 Total Investments
159,568 Total Investments
9,039,573

Table 2. Summary statistics on excess portfolio allocations.
Panel A shows the summary statistics for the variables based on a data sample from the International Monetary Fund’s Coordinated Portfolio Investment Survey (CPIS). CPIS provides data on cross-border holdings of portfolio investment securities (equities, long-and short-term debt) annually from 2001. See Panel A of Appendix B for details. For each source market each year, we compute a ratio of a target market aggregate equity security holding in US dollars millions relative to all cross-border holdings for that source market and subtract one of three benchmark ratios: (1) the relative market capitalization of the target market in that year in the Morgan Stanley Capital International (MSCI) all-capital world market index (Benchmark 1); (2) a value-weighted average of cross-border allocations to a given target market from developed market source countries in the region of the source country (excluding potentially the developed market source country itself) (Benchmark 2); and, (3) a matched developed market source country’s allocations to a given target market with as similar as possible geographic distance to target, common border, common language, common colonial heritage, prior colonial relationship, and participation in a regional trade agreement (Benchmark 3). Panel B shows the equivalent summary statistics based on the FactSet LionShares data sample. FactSet Lionshares includes security level domestic and international holdings of more than 3,000 mutual funds, investment companies and other institutional investors domiciled in more than 80 countries with holdings in 23 target markets. See Panel B of Appendix B for details. For each variable, we report the number of country-pair-year observations (N), equal-weighted mean (mean), standard deviation (Std Dev), 25th percentile, median, and 75th percentile. Detailed variable definitions are in Appendix C.
Panel A CPIS sample Variable N Mean Std.Dev 25th Median 75th Excess allocation (Benchmark 1, world) 9,717 0.006 0.090 -0.011 -0.002 -0.000 Excess allocation (Benchmark 2, regional) 9,734 0.006 0.094 -0.012 -0.002 -0.000 Excess allocation (Benchmark 3, matched) 9,442 0.012 0.118 -0.004 -0.000 0.003 Trade 17,820 0.017 0.047 0.001 0.003 0.013 FDI 15,763 0.027 0.269 0.000 0.000 0.000 Distance 17,633 8.146 0.861 7.608 8.399 8.787 Border 17,633 0.033 0.179 0.000 0.000 0.000 Common Colonizer 17,633 0.038 0.191 0.000 0.000 0.000 Colony Relationship 17,633 0.012 0.111 0.000 0.000 0.000 Common Language 17,633 0.130 0.337 0.000 0.000 0.000 GDP per capita 18,013 9.272 1.325 8.428 9.610 10.446 Number of firms 12,500 2.600 1.329 1.482 2.708 3.592 Market capitalization/GDP 17,932 0.774 0.766 0.288 0.539 1.026 Market turnover 13,723 0.817 0.686 0.348 0.644 1.112 Transaction Fees 12,253 0.230 0.114 0.155 0.202 0.275 Difference in returns 13,233 -0.061 0.472 -0.303 -0.048 0.190 Variance ratio 14,701 1.027 0.602 0.645 0.893 1.244 Correlation 14,871 0.378 0.338 0.154 0.419 0.646 Registration restrictions 13,464 1.555 1.154 0.000 2.000 2.000 Ownership Restrictions 12,573 0.995 0.890 0.000 1.000 1.000 Currency convertibility limits 14,641 0.258 0.482 0.000 0.000 0.000 Government Effectiveness 14,641 0.966 0.819 0.170 1.040 1.740 Regulatory burden 14,641 0.889 0.752 0.310 1.050 1.560 Rule of law 14,641 0.821 0.876 0.070 0.960 1.650 Panel B. FactSet LionShares sample Excess allocation (Benchmark 1, world) 44,480 0.000 0.074 -0.010 -0.003 -0.001 Excess allocation (Benchmark 2, regional) 44,480 0.000 0.069 -0.010 -0.002 -0.000 Excess allocation (Benchmark 3, matched) 38,713 0.011 0.079 0.000 0.000 0.000 Parent country 44,480 0.005 0.074 0.000 0.000 0.000 Peer country 44,480 0.008 0.091 0.000 0.000 0.000

Table 3. Determinants of excess investment allocations across countries and institutions.
This table shows the results from regressions where the excess investment allocation from a source country i to a destination country j based on world portfolio benchmark is regressed upon five different groups of variables. In each year, we calculate the excess allocation from one emerging market to a destination country as the investment ratio, or the ratio of total investment from an emerging market country to a given destination country divided by the total investment from the emerging market country to all countries, less one of three benchmark investment ratios. We show results for Benchmark 1 (world) for each destination country each year is the ratio of the market capitalization of the destination country divided by the world market capitalization (excluding the source country market capitalization). The five groups of explanatory variables include: (1) “gravity” variables that measure affinity between a source and destination country, including geographic distance, common contiguous border, common colonial heritage, colonial relationship, and common language; (2) destination country market size variables, including per capita GDP, the number of listed firms per capita, the ratio of market capitalization to GDP, market turnover, and a measure of transaction fees; (3) returns-based measures, including the differences in stock market returns between destination and source countries in the past year, the variance ratios, or the variance of the destination country monthly returns over the past five years divided by that of source country, and correlations of monthly stock market returns in the source, destination countries over the past five years; (4) market integration variables, including Registration Restrictions, Ownership Restrictions, and Currency Convertibility Limits; and, (5) country-level governance variables, including Government Effectiveness, extent of Regulatory Burden, and a measure of the Rule of Law. All control variables are described in detail, including their sources, in Appendix C. Columns 1-5 report results from regressions that contain each of these groups of explanatory variables for emerging market source countries. Column 6 contains an omnibus regression with all of the control variables. All regressions include year, source country, and destination country fixed effects. Robust t-statistics are shown in parentheses below the coefficient estimates. The superscripts *, **, and *** indicate that a coefficient is statistically significant at the 10 percent, 5 percent, and 1 percent level, respectively. Columns 7-12 report a similar set of regressions for developed market source countries. Panel A. CPIS Holdings Data Sample. Emerging Markets Developed Markets (1) (2) (3) (4) (5) (6) (7) (8) (9) (10) (11) (12) Gravity Distance -0.029*** -0.028*** -0.011*** -0.011*** Variables (-5.84) (-5.10) (-4.93) (-4.44) Border -0.027** -0.028 0.035*** 0.039*** (-2.12) (-1.42) (3.17) (2.90) Common colonizer 0.037*** 0.019 -0.005 -0.011 (2.67) (1.24) (-0.63) (-0.86) Colonial relationship 0.118*** 0.152** -0.005 -0.018 (3.34) (2.55) (-0.63) (-1.46) Language -0.014* -0.017 0.013*** 0.019*** (-1.68) (-1.50) (2.89) (2.62) Market GDP per capita 0.001 -0.023 -0.033*** -0.025*** Size (0.03) (-0.89) (-4.33) (-3.28) Measures Number of firms -0.013** -0.013* -0.009*** -0.006*** (-1.97) (-1.92) (-4.27) (-3.30) Market cap/GDP -0.001 -0.004 0.003 0.002 (-0.26) (-0.65) (1.11) (0.83) Market turnover 0.005 0.005 0.001 0.002 (0.90) (0.75) (0.82) (1.30) Transaction fee 0.058* 0.066* 0.034*** 0.028*** (1.79) (1.72) (3.84) (3.03) Returns Difference in returns 0.001 0.001 -0.001*** -0.002** Based (0.83) (0.32) (-3.16) (-2.24) Measures Variance ratio -0.004*** -0.007*** -0.001 -0.002** (-2.93) (-2.71) (-1.36) (-1.98) Correlation 0.008** 0.002 0.008*** 0.007* (1.97) (0.27) (2.80) (1.87)

Table 3. Determinants of excess investment allocations across countries and institutions. (continued)
Emerging Markets Developed Markets (1) (2) (3) (4) (5) (6) (7) (8) (9) (10) (11) (12) Market Registration Rules -0.006*** 0.001 -0.002 0.011** Integration (-2.81) (0.08) (-0.89) (2.04) Measures Ownership Rules -0.008*** -0.027* -0.004* -0.010*** (-5.64) (-1.72) (-1.83) (-2.65) FX Convertibility -0.026*** -0.092*** -0.014** -0.069*** (-8.60) (-2.67) (-2.00) (-4.59) Governance Govt Effectiveness -0.015* 0.011 -0.013*** -0.008** Measures (-1.88) (0.76) (-4.69) (-2.31) Regulatory Burden -0.020** -0.010 -0.005** -0.004 (-2.19) (-0.74) (-2.31) (-1.44) Rule of Law 0.012 -0.006 0.009*** 0.005** (1.15) (-0.34) (3.64) (2.06) Year FE? Yes Yes Yes Yes Yes Yes Yes Yes Yes Yes Yes Yes Source Country FE? Yes Yes Yes Yes Yes Yes Yes Yes Yes Yes Yes Yes Destination Country FE? Yes Yes Yes Yes Yes Yes Yes Yes Yes Yes Yes Yes N 9521 6140 7747 7074 8316 4439 14448 9029 12000 10528 12353 6907 F-stats 12.25*** 1.41 3.83*** 68.94*** 2.60** 19.37*** 12.15*** 8.92*** 7.28*** 4.03*** 7.33*** 5.85*** Adj-R2 0.257 0.199 0.260 0.187 0.210 0.300 0.425 0.375 0.347 0.376 0.362 0.433 Panel B. FactSet Lionshares Holdings Data Sample. Emerging Markets Developed Markets (1) (2) (3) (4) (5) (6) (7) (8) (9) (10) (11) (12) Gravity Distance -0.020*** -0.023*** -0.002 -0.001 Variables (-5.63) (-5.77) (-1.25) (-0.67) Border 0.009 0.020 0.049*** 0.054*** (0.57) (0.93) (5.33) (5.28) Common colonizer 0.022* 0.047** 0.020* 0.048** (1.90) (2.23) (1.75) (2.39) Colonial relationship 0.137 -0.049*** -0.005 -0.014** (1.49) (-4.01) (-1.22) (-2.09) Language 0.022*** 0.017** 0.010*** 0.013*** (2.75) (2.04) (2.99) (2.76) Market GDP per capita 0.096*** 0.032 -0.044*** -0.052*** Size (3.03) (1.11) (-3.97) (-3.51) Measures Number of firms 0.001 -0.007 0.001 0.004* (0.15) (-1.30) (0.54) (1.79) Market cap/GDP 0.003 0.000 -0.001 -0.000 (0.72) (0.16) (-0.91) (-0.20) Market turnover -0.001 0.000 0.006*** 0.005*** (-0.13) (0.04) (3.62) (2.70) Transaction fee 0.070* 0.072** 0.015** 0.020** (1.90) (2.34) (2.09) (2.30) Returns Difference in returns 0.001 0.002 -0.001 0.000 Based (0.97) (1.11) (-1.10) (0.57) Measures Variance ratio -0.001 -0.000 -0.001 -0.001 (-0.68) (-0.12) (-1.13) (-1.49) Correlation -0.002 -0.002 0.005*** 0.005** (-0.66) (-0.53) (2.61) (2.43)
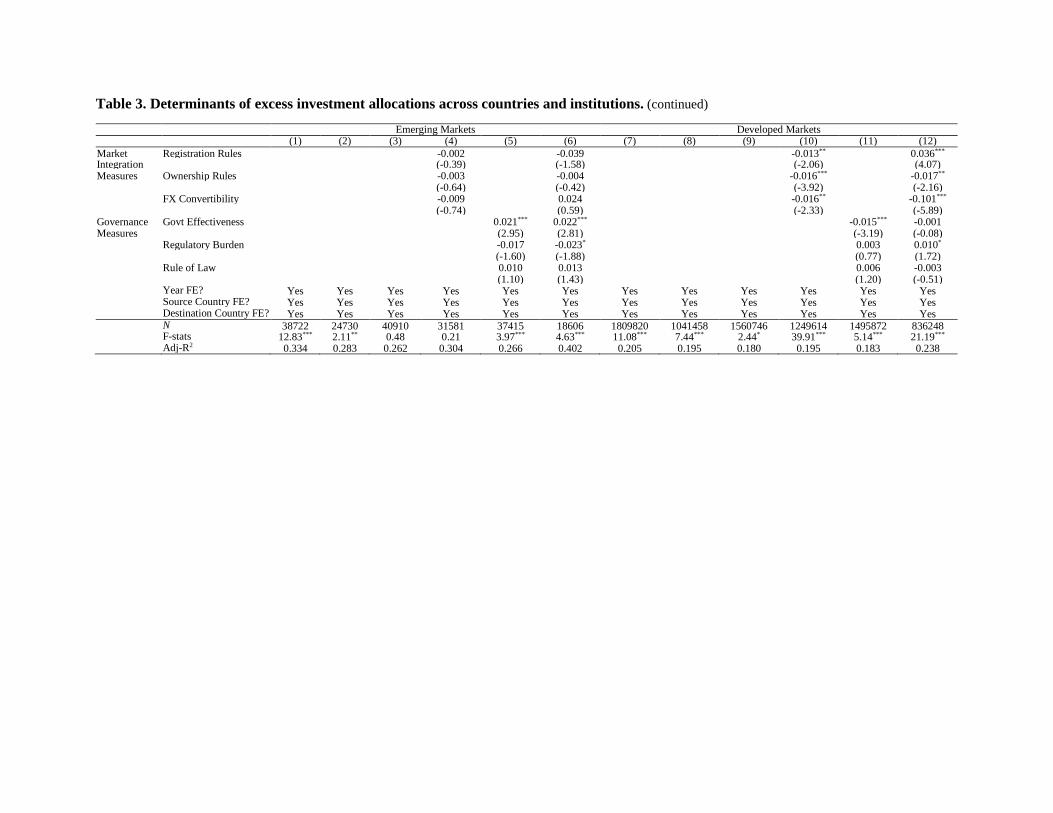
Table 3. Determinants of excess investment allocations across countries and institutions. (continued)
Emerging Markets Developed Markets (1) (2) (3) (4) (5) (6) (7) (8) (9) (10) (11) (12) Market Registration Rules -0.002 -0.039 -0.013** 0.036*** Integration (-0.39) (-1.58) (-2.06) (4.07) Measures Ownership Rules -0.003 -0.004 -0.016*** -0.017** (-0.64) (-0.42) (-3.92) (-2.16) FX Convertibility -0.009 0.024 -0.016** -0.101*** (-0.74) (0.59) (-2.33) (-5.89) Governance Govt Effectiveness 0.021*** 0.022*** -0.015*** -0.001 Measures (2.95) (2.81) (-3.19) (-0.08) Regulatory Burden -0.017 -0.023* 0.003 0.010* (-1.60) (-1.88) (0.77) (1.72) Rule of Law 0.010 0.013 0.006 -0.003 (1.10) (1.43) (1.20) (-0.51) Year FE? Yes Yes Yes Yes Yes Yes Yes Yes Yes Yes Yes Yes Source Country FE? Yes Yes Yes Yes Yes Yes Yes Yes Yes Yes Yes Yes Destination Country FE? Yes Yes Yes Yes Yes Yes Yes Yes Yes Yes Yes Yes N 38722 24730 40910 31581 37415 18606 1809820 1041458 1560746 1249614 1495872 836248 F-stats 12.83*** 2.11** 0.48 0.21 3.97*** 4.63*** 11.08*** 7.44*** 2.44* 39.91*** 5.14*** 21.19*** Adj-R2 0.334 0.283 0.262 0.304 0.266 0.402 0.205 0.195 0.180 0.195 0.183 0.238

Table 4. Effects of information endowments on external investment allocations. This table reports results from regressions of excess country allocations of emerging markets on the full set of controls used in both panels of Table 3, Column 6 as well as each of two new information endowment proxies. The excess portfolio allocations are calculated using CPIS data in Panel A. Columns 1 and 2 show the results for emerging market source countries when excess investment allocations are computed relative to Benchmark 1 (world portfolio benchmark), as explained in Table 3. Columns 3 and 4 repeat this exercise for developed market source countries. Columns 5 and 6 show the results from regressions for only for emerging market source countries but when excess investment is computed relative to the allocations of developed markets (within the same region as the source country) in that destination country, Benchmark 2 (regional) as described in the text. Columns 7 and 8 show the results from regressions only for emerging market source countries when excess investment is computed relative to the propensity-score matched benchmark developed market countries, Benchmark 3 (matched) as described in the text. We use two information endowment proxies for the CPIS results in Panel A: (1) information endowment proxy Trade is defined as sum of all trade flows between source emerging market i and destination country j during 1991-2000 divided by the sum of emerging market i’s total external trade during 1991-2000; and, (2) information endowment proxy FDI is defined as the sum of FDI flows from country j into emerging market i during 1991-2000 divided by the sum of all FDI inflows into emerging market country i during 1991-2000. The excess portfolio allocations are calculated using FactSet Lionshares data in Panel B. Only excess allocations specifications are reported. In Panel B, we use two new information endowment proxies for the FactSet Lionshares results: (1) information endowment proxy Parent is defined as a dummy variable that equals one if the destination country j is the country where the parent institution of the emerging market institution i is located, and zero otherwise; and, (2) information endowment proxy Peer is defined as a dummy variable that equals one if the destination country j contains a foreign subsidiary of the parent institution of emerging market institution i. Robust t-statistics are shown in parentheses below the coefficient estimates. The superscripts *, **, and *** indicate that a coefficient is statistically significant at the 10 percent, 5 percent, and 1 percent level, respectively. Panel A: Excess Portfolio Allocations (CPIS Data)
Excess allocation (Benchmark 1, world)
Excess allocation (Benchmark 2, regional)
Excess allocation (Benchmark 3, matched)
(1) (2) (3) (4) (5) (6) (7) (8) Emerging Markets Developed Markets Emerging Markets Emerging Markets
Trade 0.492*** 0.462*** 0.620*** 0.496*** (6.05) (4.15) (5.27) (5.57) FDI 0.033** 0.061** 0.017 0.029* (1.98) (2.14) (1.45) (1.69) Controls Yes Yes Yes Yes Yes Yes Yes Yes Year FE? Yes Yes Yes Yes Yes Yes Yes Yes Source Country FE? Yes Yes Yes Yes Yes Yes Yes Yes Destination Country FE? Yes Yes Yes Yes Yes Yes Yes Yes N 4439 4295 6907 6683 4439 4295 4423 4279 Adj-R2 0.349 0.308 0.494 0.455 0.236 0.164 0.391 0.369
Panel B: Excess Portfolio Allocations (FactSet Lionshares Data)
Excess allocation (Benchmark 1, world)
Excess allocation (Benchmark 2, regional)
Excess allocation (Benchmark 3, matched)
(1) (2) (3) (4) (5) (6) Emerging Markets Emerging Markets Emerging Markets
Parent country 0.032* 0.035* 0.037** (1.80) (1.91) (2.07) Peer country 0.053** 0.066*** 0.052** (2.11) (3.62) (2.01) Controls Yes Yes Yes Yes Yes Yes Year FE? Yes Yes Yes Yes Yes Yes Source Country FE? Yes Yes Yes Yes Yes Yes Destination Country FE? Yes Yes Yes Yes Yes Yes N 18606 18606 18606 18606 18606 18606 Adj-R2 0.403 0.405 0.215 0.219 0.177 0.179

Table 5. Portfolio concentration and information endowment effects. This table reports regression results when excess country allocations of emerging markets are regressed upon the full set of controls as in column 6 of Table 3, as well as each of the two information endowment proxies. Panel A shows the country-level results based on CPIS data. The excess country allocations are calculated from CPIS data relative to world portfolio benchmark and regional DM benchmark described in Table 4. The country-level information endowment proxies, Trade and FDI, are described in Table 4. Concentration is a dummy variable that equals one if the Herfindahl index of the country-level allocation in the emerging market source country’s external investment portfolio in a given year is above the median value of that index among all emerging market source countries in that year. Trade × Concentration is the interaction term between Trade and the portfolio concentration dummy. FDI × Concentration is the interaction term between FDI and the portfolio concentration dummy. Panel B shows the results based on institution-level regressions using the LionShares data. The excess allocations for each source institution-destination country pair are calculated relative to benchmarks 1 and 2 described in Table 5. The two information endowment proxies, Parent and Peer, are defined in Table 5. Concentration is a dummy variable that equals one if the Herfindahl index of the country-level allocation of the emerging market source institution portfolio is above the median among all emerging market source institutions in that year. Parent × Concentration is the interaction term between the Parent information endowment variable and the portfolio concentration dummy. Peer × Concentration is the interaction term between the Peer information endowment variable and the portfolio concentration dummy. All other explanatory variables are defined in Appendix C. Robust t-statistics are shown in parentheses below the coefficient estimates. The superscripts *, **, and *** indicate that a coefficient is statistically significant at the 10 percent, 5 percent, and 1 percent level, respectively. Panel A: Excess Portfolio Allocations (CPIS Data)
Excess allocation (Benchmark 1, world) Excess allocation (Benchmark 2, regional) (1) (2) (3) (4)
Trade 0.227*** 0.226** (3.11) (2.20) Trade × Concentration 0.397*** 0.592*** (4.17) (4.53) FDI 0.024*** 0.008 (2.99) (0.81) FDI × Concentration 0.248*** 0.240** (2.66) (2.13) Concentration -0.007 -0.005 -0.013** -0.005 (-1.61) (-1.11) (-2.33) (-0.86) Controls Yes Yes Yes Yes Year FE? Yes Yes Yes Yes Source Country FE? Yes Yes Yes Yes Destination Country FE? Yes Yes Yes Yes N 4439 4295 4439 4295 Adj-R2 0.366 0.347 0.272 0.198
Panel B: Excess Portfolio Allocations (FactSet Lionshares Data)
Excess allocation (Benchmark 1, world) Excess allocation (Benchmark 2, regional) (1) (2) (3) (4)
Parent country 0.034 0.031 (1.11) (1.63) Parent country × Concentration -0.005 0.008 (-0.10) (0.25) Peer country -0.013 0.066*** (-0.45) (3.53) Peer country × Concentration 0.117*** 0.001 (2.86) (0.03) Concentration -0.000 -0.001 -0.000 -0.000 (-0.17) (-0.84) (-0.42) (-0.40) Controls Yes Yes Yes Yes Year FE? Yes Yes Yes Yes Source Country FE? Yes Yes Yes Yes Destination Country FE? Yes Yes Yes Yes N 18606 18606 18606 18606 Adj-R2 0.403 0.409 0.215 0.219

Table 6. Relative country size, volatility, and information endowment effects
This table reports results from regressions of emerging market excess allocations on the full set of controls in column 6 of Table 3, each of the two information endowment proxies, and interactions of those proxies with the market capitalization, size, and volatility ratios of destination relative to parent countries. The regressions in this table are based on CPIS data. The two information endowment proxies, Trade and FDI, are defined in Table 4. Market cap ratio is a dummy variable that equals one if the stock market capitalization of the destination country in a given year divided by the stock market capitalization of the source country in that year is above the median value of that ratio among all source-destination country pairs in that year. GDP ratio is defined as a dummy variable that equals one if the GDP of the destination country in a given year divided by the GDP of the source country in that year (with both GDP values measured in current U.S. dollars) is above the median value of that ratio among all source-destination country pairs in that year. Volatility ratio is defined as a dummy variable that equals one if the volatility of stock returns in the destination country over a trailing five-year period divided by the volatility of stock returns in the source country over the same trailing five-year period is above the median value of that ratio among all source-destination country pairs. Trade × Market cap ratio is the interaction term between the Trade information endowment proxy and the market capitalization ratio. The other interaction terms shown in the table, Trade × GDP ratio, Trade × Volatility ratio, FDI × Market cap ratio, FDI × GDP ratio, and FDI × Volatility ratio, are defined in a similar manner. T-statistics are shown in parentheses below the coefficient estimates. The superscripts *, **, and *** indicate that a coefficient is statistically significant at the 10 percent, 5 percent, and 1 percent level, respectively.
Excess allocation (Benchmark 1, world) (1) (2) (3) (4) (5) (6)
Trade 0.388*** 0.697*** 0.499*** (3.05) (3.94) (4.74) Trade × Market cap ratio 0.103 (0.92) Trade× GDP ratio -0.203 (-1.24) Trade × Volatility ratio -0.016 (-0.18) FDI -0.021 0.065 0.039 (-0.27) (0.71) (1.64) FDI × Market cap ratio 0.056 (0.72) FDI × GDP ratio -0.034 (-0.37) FDI × Volatility ratio -0.009 (-0.55) Market cap ratio 0.001 0.002 (0.15) (0.25) GDP ratio -0.005 -0.005 (-0.80) (-0.60) Volatility ratio 0.003 0.002 (0.72) (0.58) Controls Yes Yes Yes Yes Yes Yes Year FE? Yes Yes Yes Yes Yes Yes Source Country FE? Yes Yes Yes Yes Yes Yes Destination Country FE? Yes Yes Yes Yes Yes Yes N 4439 4439 4439 4295 4295 4295 Adj-R2 0.349 0.350 0.349 0.309 0.308 0.308

Table 7. Robustness using raw country allocations.
This table reports regression results when raw country allocations of emerging markets are regressed upon the full set of controls as in column 6 of Table 3, as well as each of the two information endowment proxies. Panel A shows the country-level results for raw country allocations (not measured relative to any benchmarks) based on CPIS data. The country-level information endowment proxies, Trade and FDI, are described in Table 4. Panel B shows the results from regressions for emerging market institution-level country allocations based on LionShares data. The two information endowment proxies, Parent and Peer, are defined in Table 5. Robust t-statistics are shown in parentheses below the coefficient estimates. The superscripts *, **, and *** indicate that a coefficient is statistically significant at the 10 percent, 5 percent, and 1 percent level, respectively.
Panel A: CPIS Raw Portfolio Allocations (1) (2)
Trade 0.489*** (6.04) FDI 0.028* (1.69) Controls Yes Yes Year FE? Yes Yes Source Country FE? Yes Yes Destination Country FE? Yes Yes N 4439 4295 Adj-R2 0.498 0.462 Panel B: FactSet LionShares Raw Portfolio Allocations
(1) (2) Parent country 0.036** (1.99) Peer country 0.053** (2.11) Controls Yes Yes Year FE? Yes Yes Source Country FE? Yes Yes Destination Country FE? Yes Yes N 18606 18606 Adj-R2 0.216 0.219

Figure 1. Foreign allocation bias in external portfolio equity investments, by source country.
This figure shows the foreign allocation bias for each source country. We first evaluate the deviation between the share of a country’s portfolio allocated to a particular destination country and that destination country’s market capitalization weight in the MSCI all-capital world market index. We then sum up the absolute values of that deviation for the source country relative to all of the potential destination countries (including those countries where the source country might not have any investment at all). To account for market size, this sum is adjusted so that each destination country’s weight is given by its relative market capitalization (measured relative to the global total market capitalization, expressed in US dollars as a common currency and excluding the source country). Panel A shows the results of these calculations for developed market source countries. Panel B shows these calculations for emerging market source countries. These calculations are based on CPIS data.
.
0%
5%
10%
15%
20%
25%
Hong
Kon
gIs
rael
Belg
ium
Italy
Spai
nPo
rtug
alGe
rman
yFr
ance
Aust
riaFi
nlan
dSw
itzer
land
Luxe
mbo
urg
Gree
ceU
nite
d Ki
ngdo
mAu
stra
liaCa
nada
Swed
enKo
rea
Irela
ndDe
nmar
kN
orw
aySi
ngap
ore
Japa
nN
ew Z
eala
ndN
ethe
rland
sU
nite
d St
ates
Panel A. Developed Markets
0%
5%
10%
15%
20%
25%
Vene
zuel
aAr
gent
ina
Egyp
tRo
man
iaSo
uth
Afric
aIn
done
siaRu
ssia
Esto
nia
Phili
ppin
esCz
ech
Repu
blic
Thai
land
Pola
ndM
alay
siaTu
rkey
Colo
mbi
aHu
ngar
yPa
kist
anM
exic
oBr
azil
Leba
non
Chile
Kuw
ait
Ukr
aine
Kaza
khst
anIn
dia
Bahr
ain
Slov
enia
Panel B. Emerging Markets

Figure 2. Excess foreign allocations in specific destination countries comparing developed and emerging market investors.
This figure analyzes which destination countries are over-weighted (or underweighted) by DM versus EM source countries, separately. For each destination country, we calculate the excess (positive or negative) investment allocation for each source country (among DM or EM separately) in each year. Excess investment ratios are computed relative to the relative market capitalization weight in the MSCI all-capital world market index (excluding the source country of interest). We compute a weighted average across the group of source countries in DM or EM each year by the relative market capitalization of the source country in that group and average equally across all years in the sample. Panel A shows the results for the top 10 excess overweight destination markets and for the top 10 excess underweight destination markets among DM source countries (destination countries can be either DM or EM). Panel B shows the equivalent results among EM source countries.
Luxe
mbo
urg
UK
Net
herla
nds
Irela
nd
Switz
erla
nd
Germ
any
Fran
ce
Finl
and
Mex
ico
Cana
da
Taiw
an
Mal
aysia
Hong
Kon
g
Sout
h Af
rica
Russ
ia
Spai
n
Indi
a
Japa
n
Chin
a US
Panel A. Developed Market Investors
-15%
-10%
-5%
0%
5%
10%
15%
Luxe
mbo
urg
UK
Irela
nd
Net
herla
nds
Sing
apor
e
Aust
ralia
Bahr
ain
Ukr
aine
Port
ugal
Spai
n
Russ
ia
Italy
Swed
en
Sout
h Af
rica
Braz
il
Fran
ce
Cana
da
Chin
a
Japa
n US
Panel B. Emerging Market Investors

Figure 3. Average excess allocations over time in four major destination countries.
This figure exhibits how much a given destination country is over-weighted (or underweighted) by DM versus EM source countries, separately. For each destination country, we calculate the excess (positive or negative) investment allocation ratio for each source country from a given group of source countries (DM or EM) in each year. The excess allocation ratio is computed net of the relative market capitalization of that target country in the MSCI all-capital world market index (excluding the market capitalization of the source country of interest). We then take a weighted average across that group of source countries for each year. Each source country is weighted by its share of the total market capitalization in its respective group of source countries.
-35%
-30%
-25%
-20%
-15%
-10%
-5%
0%
5%
2001
2002
2003
2004
2005
2006
2007
2008
2009
2010
2011
United States
EM DM
-2%
0%
2%
4%
6%
8%
10%
12%
14%
16%
2001
2002
2003
2004
2005
2006
2007
2008
2009
2010
2011
United Kingdom
EM DM
-16%
-14%
-12%
-10%
-8%
-6%
-4%
-2%
0%
2001
2002
2003
2004
2005
2006
2007
2008
2009
2010
2011
Japan
EM DM-2%
-1%
0%
1%
2%
3%
4%
5%
6%
2001
2002
2003
2004
2005
2006
2007
2008
2009
2010
2011
Germany
EM DM

Appendix A. Country classifications into emerging or developed markets.
This appendix lists the countries that enter our analysis as source or destination countries for outward portfolio equity investments in CPIS, and classifies them as emerging market or developed market economies. The countries that only appear as destination countries are italicized.
AR Argentina Emerging MX Mexico Emerging AU Australia Developed MA Morocco Emerging AT Austria Developed NL Netherlands Developed BH Bahrain Emerging NZ New Zealand Developed BE Belgium Developed NG Nigeria Emerging BR Brazil Emerging NO Norway Developed CA Canada Developed OM Oman Emerging CL Chile Emerging PK Pakistan Emerging CN China Emerging PE Peru Emerging CO Colombia Emerging PH Philippines Emerging HR Croatia Emerging PL Poland Emerging CZ Czech Republic Emerging PT Portugal Emerging DK Denmark Developed QA Qatar Emerging EG Egypt Emerging RO Romania Emerging EE Estonia Emerging RU Russia Emerging FI Finland Developed SL Serbia Emerging FR France Developed SG Singapore Developed DE Germany Developed SI Slovenia Emerging GR Greece Emerging ZA South Africa Emerging HK Hong Kong Developed ES Spain Developed HU Hungary Emerging LK Sri Lanka Emerging IN India Emerging SE Sweden Developed ID Indonesia Emerging CH Switzerland Developed IE Ireland Developed TW Taiwan Emerging IL Israel Emerging TH Thailand Emerging IT Italy Developed TN Tunisia Emerging JP Japan Developed TR Turkey Emerging JO Jordan Emerging UA Ukraine Emerging KZ Kazakhstan Emerging AE United Arab Emirates Emerging KE Kenya Emerging GB United Kingdom Developed KR Korea Developed US United States Developed KW Kuwait Emerging VE Venezuela Emerging LB Lebanon Emerging VN Vietnam Emerging MY Malaysia Emerging MU Mauritius Emerging

Appendix B. Summary statistics for the two samples of data on cross-border investor holdings.
This panel describes the process by which we derived our baseline sample for country-level analysis using the CPIS dataset. Our sample starts with potential country pairs of MSCI Emerging Markets source countries to MSCI destination countries, which could be emerging markets or developed markets (refer to Appendix A for a full listing of countries and their classification into EMs and DMs). We excluded source countries for which there does not exist any investment data for the years 2001-2011. In addition, we excluded potential country-pair observations for which there did not exist investment data in some years. We further excluded missing benchmarks (Vietnam in 2001 and 2002).
Panel A: CPIS sample of country-pair observations by year.
2001 2002 2003 2004 2005 2006 2007 2008 2009 2010 2011 Total Average Total Potential MSCI EM Source to MSCI Destination Country Pairs (36 × 62 – 36)
2196 2196 2196 2196 2196 2196 2196 2196 2196 2196 2196 24156 2196
Country Pairs for which the Source Countries do not report investment data in the year (9 × 62 – 9)
549 549 549 549 549 549 549 549 549 549 549 6039 549
Country pairs for which the source countries have missing observations on the destination countries
893 1001 946 796 826 843 726 759 535 508 550 8383 762
Missing Benchmarks 9 8 0 0 0 0 0 0 0 0 0 17 2
No of non-missing country pairs with EM source country (including zeros) of which:
745 638 701 851 821 804 921 888 1112 1139 1097 9717 883
Number of EM source countries 22 22 24 26 26 26 26 26 27 27 27 279 25 Number of destination countries 61 61 62 62 62 62 62 62 62 62 62 680 62 Total number of zero observations 346 271 272 350 278 209 298 229 392 389 348 3382 307 Total number of positive observations 399 367 429 501 543 595 623 659 720 750 749 6335 576
Panel B: FactSet Lionshares sample of country-pair observations by year.
This panel describes the process by which we derived our baseline sample for institution-level analysis using the LionShares dataset. Our sample starts with equity and ADR holdings of MSCI institutional investors from 2001-2011 extracted from the LionShares database, limited to investments from institutions in MSCI emerging market countries to destination countries (both emerging market and developed market) that are in the MSCI (see Appendix A for a full list of these countries). For each year, we only consider destination countries that received positive investment from at least one EM institution. For pairs of EM institutions and destination countries that do not have any investment observations, we fill in zero investment. We further exclude observations with missing benchmarks.
2001 2002 2003 2004 2005 2006 2007 2008 2009 2010 2011 Total Average Number of MSCI source country institutions that invest in non-domestic MSCI countries
2001 2078 2417 2678 2800 3056 3294 3198 3395 3564 3481 31962 2906
From developed markets 2000 2071 2397 2643 2759 2984 3199 3104 3261 3416 3330 31164 2833 From emerging markets 1 7 20 35 41 72 95 94 134 148 151 798 73
Total number of EM institution-destination country observations of which:
23 280 842 1575 1968 3528 5510 5358 7906 8732 8758 44480 4044
With positive investments 4 97 182 400 460 819 1133 1236 1760 1958 1921 9970 906 With zero investments 19 183 660 1175 1508 2709 4377 4122 6146 6774 6837 34510 3137

Appendix C. Variable definitions.
This table briefly defines the main variables used in the paper.
Variable Name Description Source
Benchmark 1 (world) investment ratio Market capitalization of country j scaled by world market capitalization excluding country i. As described in the paper, country I is the source country and country j is the destination country.
World Federation of Exchanges and World Bank
Benchmark 2 (regional) investment ratio [Portfolio investment from all developed countries within the region of country I to country j ] /[Portfolio investment from all countries to country j ]
CPIS or Lionshares; own calculation
Benchmark 3 (matched) investment ratio [Portfolio investment from propensity-score-matched developed country i to country j ] / [Portfolio investment from propensity score matched developed market country i to all countries]
CPIS or Lionshares; own calculation
CPIS Excess allocation (Benchmark 1) [Portfolio investment from emerging market i to country j ] / [Portfolio investment from emerging market i to all countries]–- Benchmark 1
CPIS; see also benchmark 1 description
CPIS Excess allocation (Benchmark 2) [Portfolio investment from emerging market i to country j ] / [Portfolio investment from emerging market i to all countries]–- Benchmark 2
CPIS; see also benchmark 2 description
CPIS Excess allocation (Benchmark 3) [Portfolio investment from emerging market i to country j ] / [Portfolio investment from emerging market i to all countries]–- Benchmark 3
CPIS; see also benchmark 3 description
Lionshares Excess allocation (Benchmark 1) [Portfolio investment from emerging market institution i to country j ] / [Portfolio investment from emerging market institution i to all countries]–- Benchmark 1
FactSet Lionshares; see also Benchmark 1 (global) description
Lionshares Excess allocation (Benchmark 2) [Portfolio investment from emerging market institution i to country j ] / [Portfolio investment from emerging market institution i to all countries]–- Benchmark 2
FactSet Lionshares; see also Benchmark 2 (regional) description
Lionshares Excess allocation (Benchmark 3) [Portfolio investment from emerging market institution i to country j ] / [Portfolio investment from emerging market institution i to all countries]–- Benchmark 3
FactSet Lionshares; see also Benchmark 3 (matched) description
External Trade (Trade) [Sum of export and import between emerging market i and country j from 1991 to 2000] / [Sum of export and import of county j from 1991 to 2000]
United Nations Conference on Trade and Development (UNCTAD)
Foreign Direct Investment (FDI) [FDI from country j into emerging market i from 1991 to 2000] / [FDI from all countries into emerging market i between 1991 to 2000], zero if it is missing
Website of Professor Andrew Rose at Berkeley http://faculty.haas.berkeley.edu/arose
Parent Country Dummy equals 1 if the destination country j is the country where the parent institution of the emerging market institution i is located
Classified by hand
Peer Country Dummy equals 1 if the destination country j contains a foreign subsidiary of the parent institution of emerging market institution i.
Classified by hand
Variable Name Description Source
Distance Log of miles between country i and country j Website of Professor Andrew Rose at Berkeley http://faculty.haas.berkeley.edu/arose
Contiguous Land Border Dummy (Border) Dummy equals 1 if country i and country j share a common land-based border Website of Professor Andrew Rose at Berkeley http://faculty.haas.berkeley.edu/arose
Common Language Dummy equals 1 if country i and country j share common language Website of Professor Andrew Rose at Berkeley http://faculty.haas.berkeley.edu/arose
Common Colonizer Dummy equals 1 if country i and country j share common colonizer post 1945 Website of Professor Andrew Rose at Berkeley http://faculty.haas.berkeley.edu/arose
Colony Relationship (Colony) Dummy equals 1 if country i and country j are ever in colonial relationship with a common colonizer
Website of Professor Andrew Rose at Berkeley http://faculty.haas.berkeley.edu/arose
GDP Per Capita Log of GDP Per Capita IMF
Number of Firms Log of number of listed firms per population World Federation of Exchanges
Market cap/GDP Equity market capitalization / GDP IMF
Equity Market Turnover (Market turnover) Annul equity market trading volume over end-of-year market capitalization World Development Indicator
Transaction Fees Sum of brokerage commission, transfer fees and market impact cost. Elkins/McSherry LLC
Difference in returns Country j’s last year return-country i’s last year return Datastream
Variance ratio Country j’s return volatility divided by country i’s return volatility. Return volatility is calculated using MSCI country index returns over the past 5 years.
Datastream
Correlation Correlation of stock returns between country i and country j, based on monthly MSCI country index returns over the past 5 years.
Datastream
Market cap ratio Market cap ratio is a dummy variable that equals one if the stock market capitalization of the destination country in a given year divided by the stock market capitalization of the source country in that year is above the median value of that ratio among all source-destination country pairs in that year.
IMF
GDP ratio GDP ratio is defined as a dummy variable that equals one if the GDP of the destination country in a given year divided by the GDP of the source country in that year (with both GDPs measured in current U.S. dollars) is above the median value of that ratio among all source-destination country pairs in that year.
IMF
Volatility ratio Volatility ratio is defined as a dummy variable that equals one if the volatility of stock returns in the destination country over a trailing five-year period divided by the volatility of stock returns in the source country over the same trailing five-year period is above the median value of that ratio among all source-destination country pairs.
Datastream

Variable Name Description Source
Concentration Concentration is a dummy variable that equals one if the Herfindahl index of the country-level allocation in the emerging market source country’s external investment portfolio in a given year is above the median value of that index among all emerging market source countries in that year.
Authors’ calculations from FactSet Lionshares database.
Registration Rules Sum of points. 1 point if registration required; 1 point if annual review of performance; 1 point if compliance requirements are mandated
Salomon Smith Barney, Deutsche Custody Services Fact Book 2005, and other web based resources; see Karolyi (2015, Chapter 6) for details on construction.
Ownership Rules Sum of points. 1 point if only some sectors restricted from foreign investors; 1 point if broad-based restrictions with cap limits; 1 point if other market restrictions.
Salomon Smith Barney, Deutsche Custody Services Fact Book 2005, and other web based resources; see Karolyi (2015, Chapter 6) for details on construction.
FX Convertibility Limits Sum of points. 1 point if only partially or non-convertible currency; 2 points if exchange rate is not freely floating.
Salomon Smith Barney, Deutsche Custody Services Fact Book 2005, and other web based resources see Karolyi (2015, Chapter 6) for details on construction.
Govt Effectiveness This variable measures the quality of public service provision, the quality of the bureaucracy, the competence of civil servants, the independence of the civil service from political pressures, and the credibility of the government’s commitment to policies. The main focus of this index is on “inputs” required for the government to be able to produce and implement good policies and deliver public goods. This variable ranges from -2.5 to 2.5 where higher values equal higher government effectiveness.
Kauffmann-Kraay Governance Indicators; see World Bank’s World Governance Indicators http://databank.worldbank.org/data/reports.aspx?source=Worldwide-Governance-Indicators
Regulatory Burden Measures the incidence of market-unfriendly policies. The indicators are based on 352 different underlying variables measuring perceptions of a wide-range of governance issues drawn from 32 separate data sources constructed by 30 different organizations worldwide. Each measure is constructed on a scale of -2.5 to 2.5 with a standard deviation of 1.0 using standard unobserved components models.
Kauffmann-Kraay Governance Indicators; see World Bank’s World Governance Indicators http://databank.worldbank.org/data/reports.aspx?source=Worldwide-Governance-Indicators
Rule of Law Rule of law measures the extent to which agents have confidence in and abide by the rules of society. These include perceptions of the incidence of both violent and non-violent crime, the effectiveness and predictability of the judiciary, and the enforceability of contracts. The indicators are based on 352 different underlying variables measuring perceptions of a wide-range of governance issues drawn from 32 separate data sources constructed by 30 different organizations worldwide. Each measure is constructed on a scale of -2.5 to 2.5 with a standard deviation of 1.0 using standard unobserved components models.
Kauffmann-Kraay Governance Indicators; see World Bank’s World Governance Indicators http://databank.worldbank.org/data/reports.aspx?source=Worldwide-Governance-Indicators

Appendix D. Total equity investments by key institutional investors domiciled in MSCI source countries by year.
This table presents summary statistics on total equity investments by institutional investors (“Total AUM”) for each MSCI source country by year and total number of institutions (“Number”) in each source country by year. We report the Top 5 institutions in 2011 by market capitalization (in US dollars millions).
Panel A. Emerging Markets Country 2001 2002 2003 2004 2005 2006 2007 2008 2009 2010 2011 Top Five Institutions (2011) Argentina Total AUM: - - - - 24 32 93 15 36 106 44 1: INVESTIS ASSET MANAGEMENT SA SGFCI $44m (AR) Number: 0 0 0 0 2 1 1 1 2 2 1 Bahrain Total AUM - - - - - - - 120 1 - 102 1: SECURITIES & INVESTMENT COMPANY BSC
$102m
(BH) Number 0 0 0 0 0 0 0 1 1 0 1 Brazil Total AUM 327 250 390 870 1,424 2,701 6,962 1,806 16,147 39,930 10,205 1: BB GESTAO DE RECURSOS DTVM SA $5,611m (BR) Number 5 5 5 7 6 6 11 11 51 189 13 2: HSBC GESTAO DE RECURSOS LTDA $1,230m 3: GOLDMAN SACHS ASSET MANAGEMENT
$1,130m
4: BNP PARIBAS ASSET MANAGEMENT BRASIL
$781m 5: BANCO JPMORGAN SA $468m Chile Total AUM - 52 51 73 91 286 594 186 476 2,038 308 1: PINEBRIDGE INVESTMENTS LATIN AMERICA
$308m
(CL) Number 0 2 1 1 1 2 2 2 3 5 1 China Total AUM - - - - 37 - - 125,731 208,878 215,982 161,787 1: CHINA ASSET MANAGEMENT CO LTD $15,874m (CN) Number 0 0 0 0 1 0 0 52 55 59 60 2: E FUND MANAGEMENT CO LTD $12,227m 3: HARVEST FUND MANAGEMENT CO LTD $10,201m 4: BOSERA ASSET MANAGEMENT CO LTD $8,864m 5: GF FUND MANAGEMENT CO LTD $7,140m Colombia Total AUM - - - - - - - - - - 102 1: SEGURIDAD CIA ADMINISTRADORA DE
$102m
(CO) Number 0 0 0 0 0 0 0 0 0 0 1 Croatia Total AUM - - - - - 24 712 185 200 349 126 1: NFD AUREUS INVEST DD $35m (HR) Number 0 0 0 0 0 2 5 6 6 11 8 2: HPB INVEST DOO $35m 3: ERSTE INVEST DOO $19m 4: ZB INVEST DOO $17m 5: ILIRIKA INVESTMENTS DOO $10m Czech Republic Total AUM 65 88 132 520 816 1,329 2,146 920 1,372 1,594 1,159 1: ING INVESTMENT MANAGEMENT CR AS $366m (CZ) Number 2 2 3 7 7 7 9 9 8 7 7 2: INVESTICNI SPOLECNOST CESKE SPORITELNY
$272m
3: GENERALI PPF ASSET MANAGEMENT AS $204m 4: CSOB ASSET MANAGEMENT AS $190m 5: CONSEQ INVESTMENT MANAGEMENT AS $48m Egypt Total AUM - - - - - - - 38 50 70 35 1: EFG HERMES ASSET MANAGEMENT SAE $35m (EG) Number 0 0 0 0 0 0 0 1 1 1 1 Estonia Total AUM 52 86 237 510 967 1,619 2,473 588 1,423 1,998 1,263 1: SEB VARAHALDUS AS $1,065m (EE) Number 1 3 4 4 4 5 7 8 8 8 7 2: SWEDBANK INVESTMENT FUNDS AS $97m 3: TRIGON FUNDS AS $49m 4: AVARON ASSET MANAGEMENT AS $21m 5: DANSKE CAPITAL AS ESTONIA $18m Hungary Total AUM - - - 243 377 734 1,161 991 758 867 374 1: ING INVESTMENT MANAGEMENT HUNGARY RT $159m (HU) Number 0 0 0 8 8 7 8 7 7 7 7 2: OTP FUND MANAGEMENT LTD $124m 3: PIONEER INVESTMENT FUND MANAGEMENT
$26m
4: CONCORDE ASSET MANAGEMENT LTD $24m 5: BUDAPEST FUND MANAGEMENT CO LTD $21m

Country 2001 2002 2003 2004 2005 2006 2007 2008 2009 2010 2011 Top Five Institutions (2011) India Total AUM 76 89 3,684 5,871 13,507 21,368 29,159 20,408 42,309 60,207 46,872 1: HDFC ASSET MANAGEMENT CO LTD $7,232m (IN) Number 3 3 22 23 28 25 27 38 39 49 48 2: ICICI PRUDENTIAL LIFE INSURANCE CO LTD $7,145m 3: RELIANCE CAPITAL ASSET MANAGEMENT LTD $5,645m 4: UTI ASSET MANAGEMENT CO LTD $4,752m 5: ICICI PRUDENTIAL ASSET MANAGEMENT CO
$3,067m
Indonesia Total AUM - - - - - - - - - 204 1,073 1: PT SCHRODER INVESTMENT MANAGEMENT
$997m
(ID) Number 0 0 0 0 0 0 0 0 0 2 2 2: PT BATAVIA PROSPERINDO ASET MANAJEMEN $77m Israel Total AUM - - - - - - - - 3,141 655 726 1: MENORA MIVTACHIM LIFE INSURANCE $726m (IL) Number 0 0 0 0 0 0 0 0 30 1 1 Jordan Total AUM - - - - - - - 15 12 13 12 1: AL ARABI INVESTMENT GROUP CO /INVT
$12m
(JO) Number 0 0 0 0 0 0 0 1 1 1 1 Kazakhstan Total AUM - - - - - - 240 - - - - (KZ) Number 0 0 0 0 0 0 1 0 0 0 0 Kenya Total AUM - - - - - - - 3 2 5 - (KE) Number 0 0 0 0 0 0 0 1 1 1 0 Kuwait Total AUM - - - - - 14 8 23 37 543 598 1: GLOBAL INVESTMENT HOUSE ASSET
$598m
(KW) Number 0 0 0 0 0 1 1 1 1 1 1 Lebanon Total AUM - - - - - - 13 - 18 12 7 1: FEDERAL BANK OF LEBANON SAL $7m (LB) Number 0 0 0 0 0 0 1 0 1 1 1 Malaysia Total AUM - - 419 966 1,071 1,210 2,153 1,628 2,909 3,558 3,607 1: CIMB PRINCIPAL ASSET MANAGEMENT BHD $1,332m (MY) Number 0 0 8 9 12 13 19 20 21 20 19 2: PERMODALAN NASIONAL BHD $740m 3: PACIFIC MUTUAL FUND BHD $285m 4: HONG LEONG ASSET MANAGEMENT BHD $234m 5: OSK UOB INVESTMENT MANAGEMENT BHD $231m Mexico Total AUM 781 327 291 379 645 852 1,306 366 388 7,578 7,867 1: IMPULSORA Y PROMOTORA BLACKROCK
$6,656m
(MX) Number 2 4 4 4 4 4 4 3 3 4 4 2: BBVA BANCOMER GESTION SA DE CV $834m 3: IMPULSORA DEL FONDO MEXICO SC $306m 4: PICHARDO ASSET MANAGEMENT SA DE CV $70m Morocco Total AUM - - - - - - - - - - - (MA) Number 0 0 0 0 0 0 0 0 0 0 0 Oman Total AUM - - - - - - - 18 35 43 47 1: BANKMUSCAT SAOG /INVT MGMT $39m (OM) Number 0 0 0 0 0 0 0 1 1 2 2 2: INVESTMENT MANAGEMENT GROUP /OMAN
$8m
Pakistan Total AUM - - - - - - 497 344 1,472 1,258 838 1: NATIONAL INVESTMENT TRUST LTD $604m (PK) Number 0 0 0 0 0 0 6 14 16 18 15 2: AL MEEZAN INVESTMENT MANAGEMENT LTD $71m 3: JS INVESTMENTS LTD /INVT MGMT $65m 4: ARIF HABIB INVESTMENTS LTD /INVT MGMT $26m 5: UBL FUND MANAGERS LTD $16m Philippines Total AUM - 2 3 4 10 44 217 68 202 251 336 1: SUN LIFE ASSET MANAGEMENT CO INC $219m (PH) Number 0 1 1 1 1 1 1 1 2 1 3 2: BDO TRUST & INVESTMENTS GROUP $102m 3: ATR KIMENG ASSET MANAGEMENT INC $15m Poland Total AUM - - 1,067 2,832 4,993 23,358 45,892 17,181 30,768 40,197 27,513 1: ING PTE SA $4,981m (PL) Number 0 0 14 15 16 30 33 34 34 35 37 2: AVIVA PTE AVIVA BZ WBK SA $4,567m 3: POLSKIE TOWARZYSTWO EMERYTALNE PZU
$2,817m
4: ING INVESTMENT MANAGEMENT POLSKA SA $1,682m 5: AMPLICO PTE SA $1,558m

Country 2001 2002 2003 2004 2005 2006 2007 2008 2009 2010 2011 Top Five Institutions (2011) Portugal Total AUM 512 1,257 2,396 2,894 4,021 4,957 6,280 2,834 4,089 4,298 2,346 1: BPI GESTAO DE ACTIVOS SGFIM SA $736m (PT) Number 2 18 33 32 24 26 28 29 30 26 24 2: ESAF ESPIRITO SANTO FUNDOS DE
$412m
3: BES VIDA COMPANHIA DE SEGUROS SA $349m 4: CAIXAGEST TECNICAS DE GESTAO DE FUNDOS
$216m
5: ESPIRITO SANTO ACTIVOS FINANCEIROS SGPS
$216m Romania Total AUM - - - 2 9 19 1,387 316 619 599 623 1: SOCIETATEA DE INVESTITII FINANCIARE
$255m
(RO) Number 0 0 0 4 5 4 10 17 17 17 16 2: SOCIETATEA DE INVESTITII FINANCIARE
$251m 3: ING INVESTMENT MANAGEMENT ROMANIA $72m 4: BT ASSET MANAGEMENT SAI SA $12m 5: KD INVESTMENTS ROMANIA SAI SA $6m Russian Federation Total AUM 1 5 7 222 14 144 116 125 64 263 245 1: TKB BNP PARIBAS INVESTMENT PARTNERS
$126m
(RU) Number 1 1 1 2 1 1 1 1 1 2 3 2: PROSPERITY CAPITAL MANAGEMENT RF LTD $108m 3: ALLIANZ ROSNO ASSET MANAGEMENT OJSC $11m Slovenia Total AUM - - 205 617 1,071 1,745 3,580 1,423 1,910 2,017 1,503 1: TRIGLAV SKLADI DOO $445m (SI) Number 0 0 5 5 9 9 9 9 9 9 9 2: KD FUNDS MANAGEMENT CO LLC $320m 3: NLB SKLADI ASSET MANAGEMENT LTD $275m 4: KBM INFOND INVESTMENT FUND
$254m
5: ALTA FUNDS DZU DD $106m South Africa Total AUM 76 4,556 7,658 15,099 16,282 24,366 29,771 17,818 27,961 36,499 30,796 1: ALLAN GRAY UNIT TRUST MANAGEMENT LTD $5,949m (ZA) Number 3 24 21 23 24 44 48 61 69 68 70 2: INVESTEC ASSET MANAGEMENT PTY LTD $5,333m 3: SANLAM INVESTMENT MANAGEMENT PTY LTD $3,993m 4: CORONATION ASSET MANAGEMENT PTY LTD $3,066m 5: STANLIB ASSET MANAGEMENT LTD $2,526m Taiwan Total AUM - - - 1,416 103 93 61 668 21,816 20,423 14,341 1: JPMORGAN ASSET MANAGEMENT TAIWAN LTD $1,806m (TW) Number 0 0 0 2 1 1 1 3 37 36 36 2: ALLIANZ GLOBAL INVESTORS TAIWAN LTD $1,431m 3: YUANTA SECURITIES INVESTMENT TRUST CO
$1,339m
4: CAPITAL INVESTMENT TRUST CORP $984m 5: CATHAY SECURITIES INVESTMENT TRUST CO
$920m
Thailand Total AUM 9 13 995 946 727 204 3,395 2,908 3,392 4,360 40 1: SCB ASSET MANAGEMENT CO LTD $35m (TH) Number 1 1 9 8 6 6 20 20 19 19 2 2: SENHOUSE ASIA LTD $5m Turkey Total AUM - 25 139 143 277 137 190 56 106 271 237 1: HSBC PORTFOY YONETIMI AS $121m (TR) Number 0 2 2 2 4 5 5 6 6 5 6 2: AK ASSET MANAGEMENT AS $44m 3: IS ASSET MANAGEMENT $42m 4: FINANS PORTFOY YONETIMI AS $11m 5: TICARET SECURITIES $11m Ukraine Total AUM - - - - - - - - - - - (UA) Number 0 0 0 0 0 0 0 0 0 0 0 United Arab
Total AUM - - - 12 51 39 107 629 372 355 210 1: ABU DHABI COMMERCIAL BANK /INVT MGMT $84m
(AE) Number 0 0 0 1 1 1 2 6 8 8 6 2: EFG HERMES UAE LTD $38m 3: INVEST AD ASSET MANAGEMENT PJSC $37m 4: ING INVESTMENT MANAGEMENT MIDDLE EAST
$32m
5: MASHREQ ASSET MANAGEMENT $14m Venezuela Total AUM - - - - - - - - - - - (VE) Number 0 0 0 0 0 0 0 0 0 0 0 Vietnam Total AUM - - - - - - 83 347 463 506 481 1: DRAGON CAPITAL MANAGEMENT CO LTD $481m (VN) Number 0 0 0 0 0 0 1 1 1 3 1

Panel B. Developed Markets.
Country 2001 2002 2003 2004 2005 2006 2007 2008 2009 2010 2011 Top Five Institutions (2011) Australia Total AUM 3,448 2,606 4,306 12,315 17,442 31,322 46,095 41,169 50,695 63,018 77,129 1: COLONIAL FIRST STATE GLOBAL ASSET
$11,082m
(AU) Number 9 14 16 35 42 57 75 74 79 74 73 2: BT INVESTMENT MANAGEMENT LTD
$7,241m 3: AMP CAPITAL INVESTORS LTD $6,449m 4: PLATINUM ASSET MANAGEMENT LTD /INVT
$5,771m
5: MACQUARIE INVESTMENT MANAGEMENT LTD $5,527m Austria Total AUM 3,436 3,643 5,303 6,745 9,060 12,240 15,290 7,769 9,883 12,231 10,263 1: RAIFFEISEN KAPITALANLAGE GMBH $2,648m (AT) Number 29 33 39 38 39 40 46 51 55 62 57 2: ERSTE SPARINVEST
$2,054m
3: PIONEER INVESTMENTS AUSTRIA GMBH $1,544m 4: MACQUARIE INVESTMENT MANAGEMENT
$471m
5: VOLKSBANK INVEST
$388m Belgium Total AUM 22,356 19,414 30,390 36,423 42,120 53,802 58,218 27,638 38,573 39,357 28,179 1: KBC ASSET MANAGEMENT NV $8,006m (BE) Number 17 22 26 29 28 27 28 27 24 24 27 2: BELFIUS BANK & INSURANCE SA $5,784m 3: BNP PARIBAS INVESTMENT PARTNERS
$3,804m
4: PETERCAM SA/NV /INVT MGMT $2,692m 5: CAPFI DELEN ASSET MANAGEMENT SA $2,611m Canada Total AUM 213,249 232,479 351,570 437,488 569,311 678,269 841,931 508,398 693,001 891,505 823,049 1: RBC GLOBAL ASSET MANAGEMENT INC $64,090m (CA) Number 158 164 173 180 170 179 187 196 189 204 207 2: TDAM USA INC $52,187m 3: CAISSE DE DEPOT ET PLACEMENT DU QUEBEC $48,022m 4: BC INVESTMENT MANAGEMENT CORP $37,513m 5: CANADA PENSION PLAN INVESTMENT BOARD $36,276m Denmark Total AUM 9,333 21,150 38,715 48,593 70,517 99,629 115,013 47,679 73,029 72,422 57,695 1: NORDEA INVESTMENT MANAGEMENT AB
$16,683m
(DK) Number 10 17 19 24 26 28 31 28 29 27 26 2: DANSKE BANK AS /INVT MGMT $8,323m 3: PENSIONDANMARK AS $3,971m 4: ID SPARINVEST AS $3,570m 5: LAEGERNES PENSIONSKASSE $3,502m Finland Total AUM 4,097 9,663 21,762 28,834 27,885 34,160 44,555 23,287 36,958 46,901 31,247 1: ILMARINEN KESKINAINEN
$7,218m
(FI) Number 12 21 31 30 32 34 33 33 36 32 28 2: VARMA MUTUAL PENSION INSURANCE CO $6,133m 3: KEVA $3,332m 4: POHJOLA ASSET MANAGEMENT LTD $2,644m 5: VALTION ELAKERAHASTO - THE STATE
$2,124m
France Total AUM 43,436 99,731 208,680 240,006 275,845 380,005 482,915 300,586 370,003 315,420 284,654 1: AMUNDI SA /INVT MGMT $38,099m (FR) Number 47 91 126 143 146 149 163 170 142 127 114 2: LYXOR INTERNATIONAL ASSET MANAGEMENT
$32,213m
3: CARMIGNAC GESTION SA $26,166m 4: NATIXIS ASSET MANAGEMENT SA $24,653m 5: BNP PARIBAS ASSET MANAGEMENT SAS $19,129m Germany Total AUM 165,275 214,307 232,760 284,782 331,864 390,105 398,136 181,073 177,821 165,251 149,620 1: BLACKROCK ASSET MANAGEMENT
$26,730m
(DE) Number 101 120 129 141 141 151 167 198 234 251 219 2: UNION INVESTMENT PRIVATFONDS GMBH $25,128m 3: ALLIANZ GLOBAL INVESTORS EUROPE GMBH $21,879m 4: DEKA INVESTMENT GMBH $21,504m 5: COMMERZBANK AG /BROKER $10,667m Greece Total AUM 328 1,063 2,193 129 1,960 2,119 893 1,085 822 554 1: EUROBANK EFG ASSET MANAGEMENT MFMC
$241m
(GR) Number 0 16 18 21 3 17 17 17 12 14 11 2: ALPHA ASSET MANAGEMENT AEDAK $152m 3: NBG ASSET MANAGEMENT MFMC $111m 4: ATE MUTUAL FUND MANAGEMENT CO $12m 5: MILLENNIUM MUTUAL FUND MANAGEMENT
$11m
Hong Kong Total AUM 16,140 18,090 35,183 49,393 76,304 124,623 208,219 91,901 168,290 210,975 169,325 1: TEMPLETON ASSET MANAGEMENT LTD /HONG
$34,533m
(HK) Number 38 39 42 41 47 49 52 57 68 75 81 2: FIL INVESTMENT MANAGEMENT HONG KONG
$20,254m 3: JF ASSET MANAGEMENT LTD $13,391m 4: FIRST STATE INVESTMENTS HONG KONG LTD $9,112m 5: HSBC GLOBAL ASSET MANAGEMENT HONG
$8,622m

Country 2001 2002 2003 2004 2005 2006 2007 2008 2009 2010 2011 Top Five Institutions (2011) Ireland Total AUM 37,313 36,888 51,447 69,686 75,822 85,717 96,427 56,999 65,829 62,792 43,778 1: MEDIOLANUM ASSET MANAGEMENT LTD $9,251m (IE) Number 11 12 16 18 16 14 15 18 17 17 14 2: PIONEER INVESTMENT MANAGEMENT LTD $8,018m 3: IRISH LIFE INVESTMENT MANAGERS LTD $5,984m 4: FIDEURAM ASSET MANAGEMENT IRELAND LTD $4,381m 5: MERCER GLOBAL INVESTMENTS EUROPE LTD $3,640m Italy Total AUM 5,160 11,883 24,760 47,376 37,428 19,412 29,360 32,827 34,352 33,603 18,008 1: ANIMA SGR SPA $7,017m (IT) Number 15 35 37 36 41 37 37 56 50 58 49 2: AZIMUT CAPITAL MANAGEMENT SGR SPA $1,986m 3: FIDEURAM INVESTIMENTI SGR SPA $1,399m 4: ALETTI GESTIELLE SGR SPA $1,163m 5: PIONEER INVESTMENT MANAGEMENT SGR PA $1,068m Japan Total AUM 35,825 37,659 49,299 73,667 91,168 103,857 83,491 45,855 153,144 203,748 248,695 1: NIKKO ASSET MANAGEMENT CO LTD $53,384m (JP) Number 37 43 44 51 52 55 54 56 58 63 61 2: MITSUBISHI UFJ TRUST & BANKING CORP /INVT
$32,430m
3: NOMURA ASSET MANAGEMENT CO LTD $25,549m 4: BLACKROCK JAPAN CO LTD $24,558m 5: MIZUHO TRUST & BANKING CO LTD /INVT
$22,166m
Netherlands Total AUM 47,888 60,832 87,574 110,091 118,040 211,417 287,606 173,285 250,770 252,409 226,935 1: APG ASSET MANAGEMENT $100,153m (NL) Number 14 27 32 35 33 34 36 32 34 33 32 2: PGGM VERMOGENSBEHEER BV $45,731m 3: ING INVESTMENT MANAGEMENT ADVISORS BV $29,166m 4: ROBECO INSTITUTIONAL ASSET MANAGEMENT
$17,987m
5: BNP PARIBAS INVESTMENT PARTNERS
$8,594m New Zealand Total AUM - 24 38 177 3,692 3,800 5,561 5,550 4,188 4,930 6,592 1: GUARDIANS OF NEW ZEALAND
$5,296m
(NZ) Number 0 1 1 2 4 4 1 3 6 7 6 2: AMP CAPITAL INVESTORS NEW ZEALAND LTD $544m 3: SMARTSHARES LTD $267m 4: FISHER FUNDS MANAGEMENT LTD $183m 5: GARETH MORGAN INVESTMENTS LIMITED
$181m
Norway Total AUM 33,636 42,469 74,808 93,677 123,521 162,517 248,388 185,720 337,209 401,354 390,647 1: NORGES BANK INVESTMENT MANAGEMENT $330,745m (NO) Number 15 20 22 23 22 23 23 20 24 24 25 2: FOLKETRYGDFONDET $13,126m 3: STOREBRAND KAPITALFORVALTNING AS $13,029m 4: SKAGEN AS $11,090m 5: DNB ASSET MANAGEMENT AS $7,157m Singapore Total AUM 7,509 10,073 17,554 26,114 31,952 45,875 82,280 37,683 59,213 76,253 62,390 1: ABERDEEN ASSET MANAGEMENT ASIA LTD $21,611m (SG) Number 34 37 37 41 40 39 42 42 47 48 49 2: EASTSPRING INVESTMENTS SINGAPORE LTD $5,916m 3: JPMORGAN ASSET MANAGEMENT SINGAPORE
$4,765m
4: FIL INVESTMENT MANAGEMENT SINGAPORE
$4,656m 5: SCHRODER INVESTMENT MANAGEMENT
$4,231m
South Korea Total AUM 176 244 306 326 545 585 1,453 2,265 4,829 7,679 7,838 1: KOREA INVESTMENT CORP /INVT MGMT $5,899m (KR) Number 2 3 4 4 5 3 4 5 4 5 5 2: MIRAE ASSET GLOBAL INVESTMENTS CO LTD $1,015m 3: FIL ASSET MANAGEMENT KOREA LTD $729m 4: SHINHAN BNP PARIBAS ASSET MANAGEMENT
$103m
5: NHCA ASSET MANAGEMENT CO LTD $92m Spain Total AUM 20,100 20,108 31,398 38,729 41,902 54,280 54,389 20,063 26,493 24,413 19,720 1: BESTINVER GESTION SGIIC SA $2,858m ES Number 93 107 107 109 107 108 110 113 111 106 103 2: SANTANDER ASSET MANAGEMENT SA SGIIC $2,558m 3: BBVA ASSET MANAGEMENT SA SGIIC $1,410m 4: BBVA PATRIMONIOS GESTORA SGIIC SA $873m 5: INVERCAIXA GESTION SA SGIIC $850m Sweden Total AUM 50,906 61,979 107,935 153,629 186,924 254,834 248,612 131,417 198,538 260,519 232,001 1: SWEDBANK ROBUR FONDER AB $39,959m (SE) Number 23 33 49 52 61 71 74 74 74 75 78 2: ALECTA PENSION INSURANCE MUTUAL $24,648m 3: AMF PENSIONSFORSAKRING AB $14,950m 4: SEB INVESTMENT MANAGEMENT AB $14,748m 5: HANDELSBANKEN FONDER AB $14,400m

Country 2001 2002 2003 2004 2005 2006 2007 2008 2009 2010 2011 Top Five Institutions (2011) Switzerland Total AUM 57,726 56,792 75,780 91,772 125,857 182,064 213,495 123,447 152,744 192,158 182,066 1: UBS AG /INVT MGMT $43,440m (CH) Number 58 94 125 150 156 167 179 206 234 248 249 2: CREDIT SUISSE AG $40,863m 3: PICTET ASSET MANAGEMENT SA $33,641m 4: SWISSCANTO ASSET MANAGEMENT AG $12,134m 5: SWISS & GLOBAL ASSET MANAGEMENT AG $5,253m United Kingdom Total AUM 375,115 370,850 539,904 713,087 904,773 1,260,969 1,529,091 858,358 1,208,834 1,499,830 1,371,590 1: BLACKROCK ADVISORS UK LTD $109,088m (GB) Number 177 223 248 272 283 309 325 329 324 351 366 2: BLACKROCK INVESTMENT MANAGEMENT UK
$99,725m
3: ABERDEEN ASSET MANAGERS LTD $65,772m 4: JPMORGAN ASSET MANAGEMENT UK LTD $65,592m 5: SCHRODER INVESTMENT MANAGEMENT GROUP $63,291m United States Total AUM 8,748,444 7,008,373 9,662,638 11,532,524 12,620,247 14,664,556 14,934,200 8,473,832 11,040,347 12,712,908 12,149,378 1: VANGUARD GROUP INC $778,590m (US) Number 2073 2050 2186 2383 2540 2748 2941 2871 2782 2944 3051 2: BLACKROCK FUND ADVISORS $694,624m
3: SSGA FUNDS MANAGEMENT INC $576,990m 4: FIDELITY MANAGEMENT & RESEARCH CO $513,068m 5: CAPITAL RESEARCH & MANAGEMENT CO
$415,511m

INTERNET APPENDIX
To accompany
What Determines Portfolio Allocation Decisions of Emerging Market Investors?
by
G. Andrew Karolyi, David T. Ng, and Eswar S. Prasad

Table A1. External equity investment positions, by emerging & developed market investors, during the global financial crisis (2008-2009).
Like Table 1, this shows the top investment destinations for external portfolio equity investments from emerging market (EM, left panel) and developed market (DM, right panel) economies, but only for 2008-2009. Each destination country is classified as an EM or DM economy, and the regions of the destination countries are broadly classified as North America (NA), Asia Pacific (AP), Eastern Europe, Middle East & Africa (EEMEA), and Latin America (LA). For each destination market, we compute average total equity investments across the years 2000-2011 in US dollar millions from emerging markets Panel A and from developed markets in Panel B. Destination markets are ranked by average total equity investment across years and the top twenty destination countries are displayed. The average investment ratio is calculated as follows. In each year, we calculate the investment ratio from a particular source country to a destination country as the ratio of total investment from the source country to that destination country, divided by the total investment from the source country to all destination countries. For each destination country, we take the equal-weighted average of the investment ratio across all source countries from each group (EMs in the left panel, DMs in the right panel) to compute the average investment ratio. In the left panel, the average benchmark for a destination country is calculated as follows. For each destination country in each year, we first compute the ratio of its market capitalization relative to world market capitalization minus a particular EM source country’s market capitalization. This calculation is repeated for each EM source country relevant to that destination country in that same year. For each destination country, we then take the equal-weighted average of the investment ratios across all EM source countries. Then we take the average of the benchmark ratios over the years 2000 to 2011. The difference between the average investment ratio and average benchmark gives the average excess allocation (or under allocation) for each destination country. In the right panel, we repeat the same calculations using DM source countries. In both panels, we use CPIS data to compute country-pair investment data.
Panel A. Emerging Markets (2008-2009 only) Panel B. Developed Markets (2008-2009 only)
Destination Market
Average Investment
(US $ mills.)
Class Region Average
Investment Ratio
Average Benchmark
Ratio
Average Excess
Allocation
Destination Market
Average Investment
(US $ million)
Class Region Average
Investment Ratio
Average Benchmar
k Ratio
Average Excess
Allocation
United States 51,845 DM NA 0.2983 0.3346 -0.0363 United States 1,637,966 DM NA 0.2494 0.3391 -0.0897 United Kingdom 49,714 DM Europe 0.1336 0.0573 0.0762 Luxembourg 1,223,770 DM Europe 0.1978 0.0022 0.1956 Luxembourg 32,043 DM Europe 0.1666 0.0021 0.1645 United Kingdom 1,030,254 DM Europe 0.0971 0.0591 0.0379 Ireland 8,996 DM Europe 0.0369 0.0014 0.0355 Japan 661,902 DM AP 0.0427 0.0862 -0.0436 Bahrain 6,906 EM MEA 0.0467 0.0005 0.0462 France 650,401 DM Europe 0.0605 0.0445 0.0161 Brazil 4,662 EM LA 0.0113 0.0212 -0.0099 Germany 583,441 DM Europe 0.0565 0.0313 0.0252 UAE 3,559 EM MEA 0.0373 0.0019 0.0354 Switzerland 486,163 DM Europe 0.0319 0.0250 0.0069 Austria 3,073 DM Europe 0.0455 0.0016 0.0439 Canada 315,301 DM NA 0.0134 0.0338 -0.0205 Hong Kong 2,789 DM AP 0.0157 0.0294 -0.0137 China 303,632 EM AP 0.0467 0.0980 -0.0513 Singapore 2,670 DM AP 0.0179 0.0060 0.0119 Ireland 280,248 DM Europe 0.0359 0.0014 0.0345 Germany 2,620 DM Europe 0.0325 0.0303 0.0021 Netherlands 245,561 DM Europe 0.0200 0.0119 0.0081 Netherlands 2,548 DM Europe 0.0450 0.0116 0.0335 Spain 223,927 DM Europe 0.0249 0.0288 -0.0039 France 2,493 DM Europe 0.0306 0.0431 -0.0125 Brazil 213,346 EM LA 0.0136 0.0219 -0.0084 Australia 2,359 DM AP 0.0445 0.0235 0.0210 Australia 213,155 DM AP 0.0297 0.0243 0.0055 Belgium 2,083 DM Europe 0.0166 0.0053 0.0113 Italy 198,650 DM Europe 0.0170 0.0114 0.0056 Russia 1,964 EM AP 0.0175 0.0151 0.0024 Hong Kong 185,810 DM AP 0.0180 0.0304 -0.0124 Spain 1,374 DM Europe 0.0086 0.0279 -0.0193 Korea 149,386 DM AP 0.0113 0.0168 -0.0056 India 1,328 EM AP 0.0559 0.0222 0.0337 Taiwan 115,463 EM AP 0.0077 0.0127 -0.0050 Turkey 1,233 EM MEA 0.0106 0.0042 0.0065 India 109,970 EM AP 0.0110 0.0229 -0.0119 Korea 1,156 DM Europe 0.0061 0.0163 -0.0102 Sweden 106,669 DM Europe 0.0151 0.0086 0.0065 Top 20 Markets 185,416 0.0539 0.0328 0.0211 Top 20 Markets 8,935,014 0.0500 0.0455 0.0045 Total
200,721 Total
9,868,517 Total

Appendix Table A2. Summary statistics for restricted sample
Panel A of this table shows the summary statistics for the CPIS dataset when we restrict the sample to the observations for which we have data on all the variables used as controls in the composite regression (Table 3, panel A, column 6). We show summary statistics only for emerging market source countries. Panel B shows the summary statistics based on the LionShares dataset using similar restrictions. For each variable, we report the number of observations (N), equal-weighted mean (mean), standard deviation (“Std. Dev.”), 25th percentile, median, and 75th percentiles. The variables’ definitions are listed in Appendix C.
Panel A. CPIS sample Variable N Mean Std.Dev 25th Median 75th Excess allocation (Benchmark 1, world) 4,439 0.002 0.095 -0.015 -0.004 -0.001 Excess allocation (Benchmark 2, regional) 4,439 0.004 0.098 -0.016 -0.004 -0.000 Excess allocation (Benchmark 3, matched) 4,423 0.019 0.123 -0.002 0.000 0.006 Trade 4,439 0.031 0.069 0.003 0.008 0.028 FDI 4,295 0.046 0.284 0.000 0.000 0.002 Distance 4,439 8.188 0.880 7.666 8.538 8.820 Border 4,439 0.036 0.186 0.000 0.000 0.000 Common Colonizer 4,439 0.015 0.120 0.000 0.000 0.000 Colony Relationship 4,439 0.009 0.093 0.000 0.000 0.000 Common Language 4,439 0.131 0.337 0.000 0.000 0.000 GDP per capita 4,439 9.716 1.217 8.818 10.323 10.574 Number of firms 4,439 2.612 1.248 1.569 2.695 3.526 Market capitalization/GDP 4,439 0.974 0.925 0.422 0.723 1.147 Market turnover 4,439 91.915 62.767 45.700 82.300 127.100 Transaction Fees 4,439 2.971 0.444 2.699 2.941 3.247 Difference in returns 4,439 -0.036 0.426 -0.259 -0.032 0.180 Variance ratio 4,439 0.965 0.506 0.621 0.862 1.186 Correlation 4,439 0.449 0.319 0.240 0.502 0.701 Registration Rules 4,439 1.777 1.138 1.000 2.000 3.000 Ownership Rules 4,439 0.877 0.891 0.000 1.000 1.000 FX Convertibility Limits 4,439 0.174 0.414 0.000 0.000 0.000 Govt Effectiveness 4,439 1.134 0.779 0.430 1.390 1.790 Regulatory Burden 4,439 1.043 0.705 0.460 1.240 1.620 Rule of Law 4,439 0.971 0.859 0.160 1.330 1.710 Panel B. LionShares sample Excess allocation (Benchmark 1, world) 18,606 -0.004 0.082 -0.015 -0.005 -0.001 Excess allocation (Benchmark 2, regional) 18,606 -0.003 0.075 -0.016 -0.006 -0.001 Excess allocation (Benchmark 3, matched) 18,606 0.015 0.077 0.000 0.000 0.000 Parent country 18,606 0.007 0.085 0.000 0.000 0.000 Peer country 18,606 0.008 0.091 0.000 0.000 0.000

Appendix Table A3. How important are fixed effects in our baseline regressions?
In this table, we evaluate the explanatory power of the fixed effects relative to other controls that are used in the composite specifications in Table 3. Panel A is based on country-level CPIS regressions and Panel B is based on LionShares institution-level regressions. The first five columns of Panel A are regressions for the CPIS sample of emerging market source countries. Columns 1-5 show the R2 contributions of the control variables (excluding the fixed effects); the year fixed effects; the source country fixed effects; destination country fixed effects; and, finally, all of these right hand side variables (control variables and all three sets of fixed effects). The fifth column is the same composite specification as Column 6 in Table 3 Panel A. The next five columns in Panel A repeat this exercise using regressions for the CPIS sample of developed market source countries. The tenth column is the same composite specification as Column 12 in Table 3 Panel A. Panel B conducts a similar exercise using LionShares data. The fifth column is the same composite specification as Column 6 in Table 3 Panel B. The tenth column is the same composite specification as Column 12 in Table 3 Panel B.
Panel A. CPIS Sample.
Dependent variable: Excess allocation (Benchmark 1, world) Emerging Developed (1) (2) (3) (4) (5) (6) (7) (8) (9) (10) Controls Yes No No No Yes Yes No No No Yes Year FE? No Yes No No Yes No Yes No No Yes Source Country FE?
No No Yes No Yes No No Yes No Yes
Destination Country FE?
No No No Yes Yes No No No Yes Yes
N 9717 9717 9717 9717 4439 14706 14706 14706 14706 6907 Adj-R2 0.134 -0.001 0.073 0.133 0.300 0.241 -0.001 -0.000 0.360 0.433
Panel B. FactSet Lionshares Sample.
Dependent variable: Excess allocation (Benchmark 1, world) Emerging Developed (1) (2) (3) (4) (5) (6) (7) (8) (9) (10) Controls Yes No No No Yes Yes No No No Yes Year FE? No Yes No No Yes No Yes No No Yes Source Country FE?
No No Yes No Yes No No Yes No Yes
Destination Country FE?
No No No Yes Yes No No No Yes Yes
N 44480
44480 44480 44480 18606 1841478
1841478
1841478
1841478
836248
Adj-R2 0.213 -0.000 -0.000 0.258 0.402 0.083 -0.000 -0.000 0.181 0.238

Appendix Table A4: Effects of information endowments on external investment allocations: Pre- and post-global financial crisis periods
This table replicates the results of the basic regressions using information endowment proxies that are reported in Tables 4 and 5. Panel A contains the equivalent of the regressions reported in columns 1 and 2 of Table 4, with the CPIS sample of emerging market source countries split into the pre-crisis (2001-07) and post-crisis (2009-11) periods. Panel B contains the equivalent of the regressions reported in columns 1 and 2 of Table 5, with the LionShares sample of emerging market institutions split into the pre-crisis (2001-07) and post-crisis (2009-11) periods. T-statistics are shown in parentheses below the coefficient estimates. The superscripts *, **, and *** indicate that a coefficient is statistically significant at the 10 percent, 5 percent, and 1 percent level, respectively.
Excess allocation (Benchmark 1, world) (1) (2) (3) (4) Pre-crisis Post-crisis Trade 0.555*** 0.331*** (6.47) (3.40) FDI 0.049* 0.018* (1.72) (1.87) Year FE? Yes Yes Yes Yes Source Country FE? Yes Yes Yes Yes Destination Country FE? Yes Yes Yes Yes N 2963 2882 1476 1413 Adj-R2 0.362 0.312 0.345 0.323 Excess allocation (Benchmark 1, world) (1) (2) (3) (4) Pre-crisis Post-crisis Trade 0.030 0.037 (1.57) (1.36) FDI 0.045* 0.063** (1.87) (1.98) Year FE? Yes Yes Yes Yes Source Country FE? Yes Yes Yes Yes Destination Country FE? Yes Yes Yes Yes N 10432 10432 8174 8174 Adj-R2 0.419 0.420 0.391 0.395