the coma/a1367 supercluster and its environs
TRANSCRIPT

University of Nebraska - Lincoln University of Nebraska - Lincoln
DigitalCommons@University of Nebraska - Lincoln DigitalCommons@University of Nebraska - Lincoln
Faculty Publications, Department of Physics and Astronomy Research Papers in Physics and Astronomy
1978
The COMA/A1367 Supercluster and Its Environs The COMA/A1367 Supercluster and Its Environs
Stephen A. Gregory Bowling Green State University
Laird A. Thompson University of Nebraska-Lincoln
Follow this and additional works at: https://digitalcommons.unl.edu/physicsfacpub
Part of the Physics Commons
Gregory, Stephen A. and Thompson, Laird A., "The COMA/A1367 Supercluster and Its Environs" (1978). Faculty Publications, Department of Physics and Astronomy. 87. https://digitalcommons.unl.edu/physicsfacpub/87
This Article is brought to you for free and open access by the Research Papers in Physics and Astronomy at DigitalCommons@University of Nebraska - Lincoln. It has been accepted for inclusion in Faculty Publications, Department of Physics and Astronomy by an authorized administrator of DigitalCommons@University of Nebraska - Lincoln.

THE ASTROPHYSICAL JOURNAL, 222: 784-799, 1978 June 15 Q 1978. The American Astronomical Society. All rights reserved. Printed in U.S.A.
THE COMA/A1367 SUPERCLUSTER AND ITS ENVIRONS
Department of Earth Sciences, State University of New York College at Oswego; and Physics Department, Bowling Green State University
AND
LAIRD A. THOMPSON Kitt Peak National Observatory;? and Department of Physics and Astronomy, University of Nebraska
Received 1977 September 7; accepted 1977 December 21
ABSTRACT The three-dimensional galaxy distribution in the region of space surrounding the two rich
clusters Coma and A1367 is analyzed by using a nearly complete redshift sample of 238 galaxies with m, < 15.0 in a 260 degree2 region of the sky; 44 of these redshifts are reported here for the first time. We find that the two clusters are enveloped in a common supercluster which also con- tains four groups and a population of isolated galaxies. The least dense portions of the ComalA1367 supercluster have a density which is approximately 6 times that of the Local Supercluster in the regions of our own Galaxy. In front of the Coma/A1367 supercluster we find eight distinct groups or clouds but no evidence for a significant number of isolated "field" galaxies. In addition, there are large regions of space with radii r > 20 h-l Mpc where there appear to be no galaxies what- ever. Since tidal disruption is probably responsible for the isolated component of supercluster galaxies, the observations suggest that all galaxies are (or once were) members of groups or clusters. A number of related topics with more general significance are also discussed. (1) The size-to-separation ratio for foreground groups indicates that the redshift of group formation is z 8 9. (2) There is a general correlation between the volume mass density of a galaxy system and the morphologies of the component galaxies. (3) Finally, we speculate that all clusters of richness class z 2 2 are located in superclusters. Subject headings: galaxies : clusters of - galaxies: redshifts
I. INTRODUCTION
Galaxies appear to be organized on the largest scale in extensive, second-order clusters called superclusters. The early controversy over this matter (see Abell1975) has been settled by Peebles and his collaborators (see Peebles 1974), who have studied the projected distribu- tion of galaxies on the sky. More detailed information on superclustering is available if a third spatial dimen- sion can be added directly. For example, Rood (1976) studied the three-dimensional distribution of nearby clusters by assuming that the average redshift of the observed members of a cluster is an accurate indicator of the cluster's distance, and his findings are consistent with earlier results. Our purpose in this paper is to use a redshift-based technique for studying the three- dimensional distribution of a large number of galaxies in the region of the sky defined by 11h5 8 a 8 13h3, 19" 8 6 8 32". Within this surveyed region lie the two rich clusters Coma and A1 367, and the results presented below will show that they are embedded in a common,
(1961) thought that there might be a supercluster containing six clusters centered at llh45", +29:5 (1950) which had a diameter of 45 h-l Mpc and would therefore include Coma and A1367. However, this suggestion was made before redshifts were available for any of the clusters except Coma. Two of the members, A1185 and A1213, are now known to have significantly higher redshifts than Coma and A1367 (Noonan 1973). The present study is the first that can actually demonstrate that Coma and A1367 form a unified system. The reason that the Superclusterl was not recognized long ago is that the two major cluster centers are widely separated. Hauser and Peebles (1973) found that rich cluster pairs are correlated if their separation is less than -20 h-I Mpc, where h = H,/100 km s-I Mpc- l. For the case of Coma and A1367 the separation is 21 h-I Mpc. This wide physical separation coupled with the Supercluster's proximity to our own Galaxy (the distance to the Supercluster is -70 h-I Mpc) make the angular
very large supercluster. Hereafter we will use the proper noun "Supercluster" The existence of the supercluster per when referring to the Coma/Al367 supercluster if no co6Fusion
se was suggested (Tifft and results. Following current usage, the general term super- 1976; Chincarini and Rood 1976). We note that Abell cluster" will be used when referring to groups of galaxy
clusters. At times in the past (cf. Shane 1975), these groups of * Visiting Astronomer at Kitt Peak National Observatory. clusters have been called "clouds," a term which is now t Operated by AURA, Inc., under NSF contract AST reserved for loose aggregates of galaxies such as the Coma I
74-04129. cloud.
784
O American Astronomical Society Provided by the NASA Astrophysics Data System
COMAIA1367 SUPERCLUSTER 785
separation ~ 2 0 " ~ which is too large to be visually impressive at, say, the scale of the Sky Survey.
The very large sizes of superclusters offer com- pelling reason for studying them in detail. Internal mixing cannot be well advanced, so the present distri- butions of galaxy luminosity and morphology must reflect to some extent the properties of the primordial supercluster material. We will show in the following analysis that there are three observationally distinct populations of galaxies within the Supercluster. These are (1) galaxies located in the two rich cluster cores, (2) galaxies located in intermediate- or low-mass clusters, and (3) a nearly homogeneously distributed population of isolated galaxies.
An important additional benefit of our magnitude- limited survey is that it samples foreground galaxies in addition to those in the more distant Supercluster. This adds a fourth distinct population to the three found in the Supercluster. The foreground galaxies are found in low-mass clusters; they are not distributed in a homogeneous "field." The addition of these fore- ground systems to our sample of clusters enables us to examine intrinsic properties of clusters over a range of N lo2 in mass.
11. THE REDSHIFT SURVEY
The purpose of our new redshift program is to provide a sample of galaxies complete to a limiting magnitude of m, < 15.0 in the area of the sky encom- passing the two rich clusters Coma (A1656) and A1367. Previous redshift observations are summarized by Tifft and Gregory (1976) for galaxies with m, < 15.0 and r < 6" from the Coma cluster center, by Chincarini and Rood (1976) for galaxies with m, I 15.0 in a region directly west of Coma, and by both Tifft and Tarenghi (1975) and Dickens and Moss (1976) for galaxies near the center of A1367.
Although the above mentioned surveys cover a sub- stantial region of the sky, they left a large gap along a line connecting Coma and A1367 in which very few galaxies have been studied. For our new observations we tried to observe each apparently isolated galaxy in this gap for which no previous redshift determination existed. However, because of observing time limitations and two aborted attempts on very low-surface-bright- ness objects, five of the galaxies lying within r 6 3" of the line joining the two clusters still do not have measured redshifts. In addition to the apparently isolated galaxies, there were five obvious groups for which no distance information existed. We tried to be as complete as possible in obtaining redshifts in the two groups nearest to A1367 so that their relationship to the rich cluster might be clarified. For the remaining groups we assumed that the redshifts of the one or two brightest galaxies were representative of the whole.
We obtained the new spectra during the nights 1976 April 27-28 to April 30-May 1 with the Kitt Peak 2.1 m telescope equipped with the white CIT spectro- graph and a HeNeAr comparison source. The 300 line mm-I grating gave a dispersion of 240 A mm-l in the blue, and the spectra were recorded on baked
IIIa-J spectroscopic plates. The spectrograms were measured with either a Mann comparator or a Grant measuring engine with scanning display. No significant difference was found between the results obtained for selected spectrograms measured on both instruments. The [ 0 I] h = 5577.35 night-sky line was measured and used to correct for systematic spectrograph or measuring errors; the average correction was + 6 + 28 km s-l. We used the effective wavelengths given by Sandage (1975), and we corrected for 300 km s-I galactic rotation.
In Table 1 we list the new redshifts along with other pertinent data. Column (1) contains the identification number from Zwicky and Herzog (1963, hereafter CGCG). The first three digits give the CGCG field number, and the last three digits give the sequential galaxy number. Columns (2), (3), (4), and (5) give the NGC or IC numbers, the 1950 epoch right ascension and declination, and the photographic magnitude m,. In column (6) we list the new redshift determinations. Typical uncertainties for redshifts of galaxies with 13 I m, I 15 at this dispersion are f 100 km s-l ; parentheses in column (6) denote one particularly uncertain redshift and one which was estimated. Column (7) lists those spectral lines which were measured with nonzero weight. The lines h = 3727 and h = 5007 were, of course, always in emission. Hydrogen Balmer lines were found in absorption unless denoted by (em). Because of possible blending with HE, the Ca I H-line was not used if any Balmer lines of shorter wavelength than H/? were visible.
When the 44 new redshifts are combined with those in the literature, we have a total sample of 238 galaxies with m, < 15.0 in the surveyed area.
111. RESULTS
a) Overview of the Supercluster Area Although we are most interested in studying the
galaxies located between and in the immediate vicinity of the Coma and A1367 clusters, it is of importance to investigate the total possible extent of the Supercluster. Consequently, we show in Figure 1 an isophotal diagram for the region of the sky which contains the Supercluster; the surface area of this diagram is - 10 times that of our redshift survey. The contours represent the luminosity distribution of galaxies at surface-brightness intervals of 0.5 mag. The diagram was constructed by averaging at 1" centers the total luminosity of those galaxies which fall within a radial distance of 1" from each averaging center. All galaxy magnitudes and positions were taken from a magnetic tape version of CGCG, and the averaging process was carried out by computer at the Kitt Peak National Observatory. Because the surface-brightness contours are by definition luminosity-weighted, background contamination is insignificant. Foreground contamina- tion can be substantial, and two techniques were used to reduce this problem. First, no galaxy was included in the luminosity average if it had an apparent magni- tude brighter than the first brightest galaxy in either A1367 or Coma (NGC 4889 has m, = 13.0). Second,
O American Astronomical Society Provided by the NASA Astrophysics Data System

GREGORY AND THOMPSON
TABLE 1 NEW REDSHIFTS
Zwicky No. Name a(1950) 6 (1950) mp "0 Spectral Lines Used Notes
K,H,H6,4226,G,5175 3727,K,H,4384,HB (em) K.H.5175 K,H, 5269 H, G
NOTES: 1. Redshift is more uncertain than usual, s ince only one l i n e had non-zero weight i n the determination.
2. Northern component i s fa in te r : both appear imbedded i n the same halo.
3. m e s ide of t h e comparison spectrum was ruined: V, i s an est imate.
4. Poor q u a l i t y spectrum: however, A3727 was e a s i l y measured. Accuracy of Vo i s not a s poor a s i f only one absorption l i n e had been measured.
two separate contour diagrams were produced, the first for m, 2 13.0 and the other for m, < 13.0. The second version shows mainly local galaxies, so it was possible to identify on the first version those regions that are strongly contaminated by faint galaxies in nearby groups and clusters. Figure 1 shows only the first version (i.e., m, 2 13.0), but those features in Figure 1 that have corresponding contours in the second version are shown in dashed lines. For in- stance, the faint galaxies in the extensive Virgo cluster complex dominate the region centered at 12h30m, +13", but since the contours are shown as dashed lines they are easy to ignore.
Some interesting features are obvious. First, the Coma cluster has an elliptical shape with ellipticity approximately equal to 0.5; estimates of the ellipticity have been published elsewhere (Rood et al. 1972; Thompson and Gregory 1978; Schipper and King 1978). There also seems to be a difference between the regions just exterior to the two rich clusters. A1367 is surrounded by a tenuous group of galaxy clouds, whereas the region around Coma is nearly devoid of structure. Only one concentration is seen near Coma. This is the NGC 5056 group, which may not be part of the Supercluster. The contour diagram is somewhat deceptive because the faintest illustrated isophote is
O American Astronomical Society Provided by the NASA Astrophysics Data System

No. 3, 1978 COMAlA1367 SUPERCLUSTER
FIG. 1.-Luminosity contour diagram of the Coma/A1367 Supercluster and its surroundings for galaxies in the Zwicky catalog with m, z 13.0. The contours are spaced at 0.5 mag intervals. The brightest contour level is 29.5 mag a r c ~ e c - ~ , and the faintest is 31.5 mag a r c ~ e c - ~ . Dashed lines, regions that are probhbly in the foreground. The NGC 5416 cluster (a % 14h, 6 x 10") has a luminosity similar to that of the Coma (a x 13h, 6 x 28") and A1367 (a x llh40m, 6 x 20') clusters.
not at the limiting luminosity of CGCG but at the level beyond which the background becomes quite noisy. We will show in the following section, using the complete redshift sample to eliminate foreground and background confusion, that the region around the Coma cluster is not entirely empty but contains a widely dispersed but significant population of Super- cluster galaxies.
An additional feature of Figure 1 which has potential importance is the concentration of galaxies at a = 14h, 6 = + 10". Although this concentration is nearly as prominent as A1367, it has escaped notice (for example, it has no Abell number). We will refer to this system as the NGC 5416 cluster. No redshifts are available for any of the member galaxies, but a com- parison of apparent luminosity functions shows that the NGC 5416 cluster may well lie at the same distance as Coma and A1367 and may therefore indicate that the Supercluster is larger than the boundaries of our redshift survey. The NGC 5416 cluster is surrounded by an extensive system of galaxy clouds and hence is very similar to A1367.
b) ComalAl367 Supercluster: The Interconnection
There is no widely accepted definition of the term "supercluster." At present, observational studies of superclusters use largely subjective criteria which are based on the distance and angular proximity of cluster centers. In the case of two clusters which are as widely separated as Coma and A1367, we believe that, in order to show that they are members of the same supercluster, it is both necessary and sufficient to demonstrate the presence of a population of galaxies
linking the two clusters which is itself a region of significantly enhanced density. For ease of discussion, the area between Coma and A1367 will be called the intercluster region (ICR), and the galaxies in this region will be referred to as ICR galaxies. We present a list of these galaxies in § IIIe; here we will show only that the density of the ICR is indeed significantly large.
The intercluster region is easily recognized in Figure 2a. The diagram shows the projected three- dimensional distribution of our sample galaxies. Since Coma and A1367 are separated primarily in the east- west direction, we have plotted the positions in the coordinate system right ascension versus redshift. By making the width of the R.A. axis a linear function of redshift, we have removed the major distance-depen- dent distortion. If the R.A. axis were of uniform width over the entire redshift range, a hypothetically spherical nearby group would appear to be unrealisti- cally elongated in right ascension. According to the Hubble relation, redshift is proportional to distance for galaxies at rest with respect to their local comoving coordinates. However, in the relaxed cores of massive clusters galaxies have large kinetic energies, and the extreme redshifts are not indicative of distance effects. These clusters appear as very elongated structures which point toward the origin of the wedge diagram.
Two features of Figure 2a are significant. First, the clumpiness of the foreground distribution is clear. There are several groups of galaxies, and it is impor- tant to note there are large regions which are devoid of galaxies. (In fact, we note that no galaxies with m, < 15.0 are found within 20 Mpc of the near side of the intercluster region.) The second point is that
O American Astronomical Society Provided by the NASA Astrophysics Data System

RIGHT ASCENSION (1950) RIGHT ASCENSION (1950)
ComoI Cloud
FIG. 2.-(a) (left panel) Wedge diagram for all galaxies in our sample. The Supercluster is clearly seen at an average redshift of approximately 7000 km s-l. The distribution of foreground galaxies is very clumpy. Those galaxies with Vo < 5000 km s-l that are represented by crosses are too faint to be surveyed if they were at the distance of the Supercluster. The distance scale assumes Ho = 75 km s-l Mpc-l, and the angular size of the survey has been magnified by approximately 2 times. (b) (right panel) An inter- pretive form of the wedge diagram.

COMAlA1367 SUPERCLUSTER 789
Figure 2a gives a misleading visual impression of the density of the foreground. Since our survey is limited by a fixed apparent magnitude, nearby groups are studied to intrinsically fainter limits than the Super- cluster. We correct for this effect by using two symbols for those galaxies with Vo < 5000 km s-l. Galaxies represented by large filled circles have absolute magnitudes Mp which satisfy the condition Mp I M,, where M, is the limiting absolute magnitude of galaxies studied in the Supercluster. With Ho = 75 km s-l Mpc-l (assumed throughout unless explicitly stated otherwise) and a limiting apparent magnitude of m, = 14.9, we find MI = -19.9. Those foreground galaxies that are represented by crosses have Mp > M, and would be too faint to be included in our survey if they were members of the Supercluster. Figure 2b is an interpretive form of Figure 2a. Borders for all the galaxy systems have been added, and they will be discussed below.
We will now use two comparisons to show that the ICR has a significantly enhanced density. First, we calculate the density contrast pICR/pf between the intercluster region and the foreground (f) because p, is characteristic of the mean density of the universe outside of rich clusters. We take the ICR to be 6.4 h-l Mpc thick (see SIIIe). The 69 ICR galaxies are distributed over 167 degrees2 of the sky, so they occupy a volume of 1.6 x lo3 h-3 Mpc3, giving a number density nIc, = 4.4 x h3 M ~ c - ~ . In the foreground there are 13 galaxies with Mp I MI, and they occupy the volume of space out to a redshift of - 5000 km s-l, corresponding to 3.3 x lo3 he3 Mpc3. The number density of foreground galaxies is then nf = 3.9 x h3 M ~ c - ~ . By assuming that the MIL ratios and luminosity functions of the two popu- lations are identical, we find pIcR/pf = 11.
For the second test we will compare the density of the ICR to that of the Local Supercluster (LSC) in our own vicinity. We are located at a distance from the center of the Local Supercluster that corresponds to the midpoint between the two rich clusters in the Coma/A1367 Supercluster. Jones (1976) finds that the local density of galaxies with MB < -18 is no z 9 x M ~ c - ~ . We convert this density to the limiting magnitude of our survey by using the lumi- nosity function given by Abell (1975); this gives nLsc z 3 x M ~ c - ~ . Once again we assume constant MIL ratios and find PICR/~LSC = 15 h3. In his calculations, Jones used a value of h = 1, appropriate to the local vicinity of space (see van den Bergh 1970). For comparison with p,,, we use both h = 1 and h = 0.75 and find a density contrast 6 6 ~IOR/PLSC < 15.
Now that we have calculated the density of the ICR, we ask if such a large density could result from random fluctuations of a homogeneous "field." The method used to test this hypothesis is given by Chincarini and Rood (1976); we compare the observed redshift distribution of galaxies to that expected from a smooth field. A X2 test of the observed redshift distribution of foreground galaxies plus those in the ICR when compared to the theoretical distribution of field
objects (scaled to our larger data sample) shows that there is less than a probability that the observed distribution arises by chance fluctuations. Although the quoted probability refers to the entire redshift distribution from the foreground out to the Super- cluster, it is clear that the ICR dominates the redshift distribution and could not be a chance fluctuation.
c) Properties of the Foreground Galaxies
For the purposes of our analysis we will assume that the foreground consists of those galaxies with Vo < 5000 km s-l. An exception is made for galaxies near the Coma and A1367 centers; for those galaxies with r < lo, a foreground galaxy must have Vo < 4500 km s-l. This variation in the redshift criterion is necessitated by large kinetic energies of the galaxies projected near the centers of massive, relaxed clusters.
Given these criteria, we find eight distinguishable groups in the foreground, and only four out of 90 galaxies do not lie in these eight groups. For seven of these groups, detailed maps and lists of member galaxies are given in the Appendix. In addition to previously published data and new redshifts from Table 1, the lists in the Appendix give new estimates of the morphological types of the component galaxies. These new morphologies were determined by examina- tion of the Kitt Peak National Observatory glass copies of the Sky Survey. In the present section we summarize the general properties of the foreground systems.
In order to compare the intrinsic characteristics of one cluster with those of another, we have extrapolated the mass and luminosity estimates to a fixed absolute limit. We choose Mp = - 15.0 as the limit because this is just fainter than the faintest galaxy luminosity in the closest group in our survey. Our extrapolation uses the luminosity function introduced by Abell (1975). Ideally, the luminosity function should be derived for each group independently. However, the small number of objects in the individual groups precludes such analysis. Fortunately, the shape of the luminosity function for galaxies in nearby groups seems to be similar to that in rich clusters (see Shapiro 1971).
We define n(M,,,)/n(-15) to be the fractional number of cluster members that are bright enough to be included in our survey; MI,, is the limiting absolute luminosity corresponding to the mp = 14.9 at the distance of each cluster. The total estimated popula- tion of the cluster, Ncalc, is then obtained from the relation
= N~,[n(Mii,)ln(-15)1-1
where Nebs is the number of cluster members with mp < 15.0.
A similar method is used to estimate each cluster's total luminous mass. We define l,(Ml,,)/1(- 15) to be the fractional luminosity of galaxies with Mp < M,,. The mass estimate is obtained from
O American Astronomical Society Provided by the NASA Astrophysics Data System

GREGORY AND THOMPSON
TABLE 2 FOREGROUND SYSTEMS
Name log ~6:::) v i r i a l Rh l o g P
( 0 . 3 ~ ) (1 ) ( a ) - Morphology
Type Nobe Nca lc ' 0 'v (% S p i r a l ) log '2:') 4 ( 6 ) M/L (degrees) ("oMpc-S)
cana I NGC 4793 NGC 3801 NGC 3798
cloud 22 46 933 224 59 11.15 13.25 12.32 (10') 2.72 11.63 cloud 8 35 2513 186 100 10.73 12.77 11.62 1253* 2.74 10.95 group 14 90 3262 - 65 10.91 13.10 12.12 - 0.58 12.96 group 3 22 3512 - (50) 10.42 12.64 11.69 - 0.79 12.00
NGC 3995 NGC 4169 NGC 4005 NGC 4615
group 6 41 3390 131 67 10.85 13.05 12.10 185 0.65 12.71 group 10 81 3955 140 61 11.10 13.33 12.38 31 0.64 12.81 group 10 95 4420 - 55 10.95 13.11 12.02 - 0.32 13.35 cloud 8 73 4623 193 88 11.02 13.17 12.18 247 2.52 10.66
NOTES: (1) rap< 15.0
( a ) ca lcu la ted f o r M s -15.0 P
(a) s o l a r u n i t s
( 4 ) M/L = 200 for E and SO ga lax ies ; M/L = 100 f o r s p i r a l s
( 6 ) M/L = 50 for E ga lax ies , 30 for SOs, and 7 for s p i r a l s
( 6 ) assuming H = 75 lun s-I ~ p c - ' *This value is probably high because of the inc lus ion of nonmembers; s e e d i scuss ion i n t e x t .
where the summation is taken over morphological types grouped into E, SO, and S classes, N, is the observed number of member galaxies in each class, and (MIL), is an assumed mass-to-luminosity ratio for each morphological type. For each foreground system N,,,, and ZBCac are given in Table 2, and a discussion of the results will be given in 4 IV. Further discussion of how these results relate to the spectrum of galaxy clustering will be given in a subsequent paper (Gregory and Thompson 1978).
Much of the discussion in 4 IV will refer to the volume mass densities of the observed clusters. The volume occupied by each cluster is taken to be V = 4/3?rRh3, where R, is the projected mean harmonic radius of the cluster and is found from
(r is the separation between the members of a galaxy pair; for those pairs with r < 0 9 , l/r is not included in the average because large values of I/r force R, toward unrealistically small values).
For four foreground groups enough data exist to warrant calculation of the virial MIL ratio required to bind the system. For the virial calculation, we use the method described by Materne (1974), except that we assume there is a 100 km s-l uncertainty for the red- shift of each galaxy and that redshift differences among group members represent only line-of-sight motion.
In Table 2 we present the observed and calculated data for the foreground systems. The adopted system name and type (group or cloud) are found in columns (1) and (2), respectively. In columns (3) and (4) we list N,,, and N,,,, while columns (5) and (6) give the mean redshift and dispersion. Column (7) presents the relative number of galaxies with morphological type later than SO (i.e., Oj,S).= The total observed luminosity
a Hereafter, O/,S indicates percent of spirals.
is given in column (8). Columns (9) and (10) contain the mass estimates for two cases. MIL ratios of 200, 200, and 100 were used for E, SO, and S galaxies, respectively, to obtain the values in column (9); MIL ratios of 50, 30, and 7 were used for column (10). Virial MIL ratios are presented in column (1 1) for the four systems with sufficient data. R, and the logarithm of the volume mass density (M, M ~ c - ~ ) are listed in columns (12) and (13).
Galaxies were assigned membership in groups and clouds on the basis of their projected spatial proximity and their redshift similarities. If clusters merged slowly into a smooth field of galaxies, our subjective method would be unreliable. However, the absence of an observed field makes cluster definition simple and natural when enough redshifts are available. We find that the scale length contrast-i.e., the ratio of the average nearest-neighbor separation of groups and clouds, I,, to the average mean harmonic radius-is lcl/Rh = 7.
In general, the calculated virial MIL ratios are typical for galaxy systems, ranging between 31 1 MIL 1 247. An exception, however, is the value of MIL = 1253 for the NGC 4793 cloud. Such a large value suggests that we may have included nonmembers. However, even after excluding the three most likely nonmembers (NGC 4275, NGC 5089, and IC 777), we find that the ratio is still large, MIL = 381. Since the only galaxies in the foreground that might be considered isolated are in the vicinity of this cloud, and since it requires an unusually high mass-to-light ratio to be bound, it seems likely that the NGC 4793 cloud is dispersing.
Considering the general properties given in Table 2 and the details and maps given in the Appendix, we can summarize the foreground region as follows: No evidence is found for a significant population of isolated galaxies. Nearly all galaxies lie in low-mass clusters of the types called "groups" or "clouds"
O American Astronomical Society Provided by the NASA Astrophysics Data System

No. 3,1978 COMAlA1367 SUPERCLUSTER 79 1
(distinguished by their densities). These groups and clouds have radii which are small compared with their separations. They have low masses, %Ic,,, < 2 x 10¹³ M,, and are sparsely populated, N,,, < 100. These systems have small velocity dispersions of u < 200 km s-l. Of all their component galaxies, 79% are of late morphological type. Finally, these groups have little tendency toward central concentration.
d) Background Galaxies
Because our redshift survey is limited by a fixed apparent magnitude which corresponds to a rather bright intrinsic luminosity (M, = -19.9) at the distance of the Supercluster, the sample of galaxies lying behind the Supercluster is quite small. Conse- quently, we can draw only limited conclusions about their distribution. The only background galaxies that were recognized in earlier surveys are too faint to be included in our sample. These galaxies were discussed by Tifft and Gregory (1976), who suggest that they are probably members of groups similar to those in the foreground.
We find evidence for an additional population of background galaxies with m, < 15.0 which lie within 20 Mpc of the Supercluster, having 7900 < Vo < 9500 km s-l. These galaxies are easily identified in Figure 3, which is a redshift histogram of those ICR galaxies that do not lie in grwps. There are 50 galaxies plotted in the figure with 6000 < Vo < 9500 km s-l. An obvious peak is found at the redshift of the Super- cluster (6900 km s-l), and a sharp cutoff is found for Vo < 6400 km s-l. We include the NGC 4615 group in Figure 3 to illustrate the large gap of -25 Mpc between the ICR and the highest-redshift group lying in front of the ICR. The redshift distribution of the ICR galaxies is skewed toward higher redshifts. The moment of skewness for all galaxies with Vo > 6000 km s-l is y = 1.33 [y = m3/(m2)3'2, where m2 and m3 are the second and third moments about the mean, respectively]. Since no significant skewness is seen in the Coma cluster itself (Gregory and Tifft 1976b), we suggest that the high-redshift tail is caused by the
TABLE 3 BACKGROUND GALAXIES
Zwicky No. Name Type mp v0 sourcet
- - . - . - - 127076NW N 3926 E 14.7 8514 GT 158024 N 4104 SO 13.7 8473 CR 158072 N 4272 SO- 14.2 8460 CR 158076 I C 3165 Sc 14.9 8428 CR
158100 N 4375 Sab 13.9 9034 CR 159011 N 4514 Sb 14.2 8011 CR 159022W N 4556 E 14.4 7980 CR 159052 Sc 14.9 93773 TG 159082 Sb 14.8 81743 TG
*included because of association with 127076NW
tCR = Chincarini and Rood (1976 + references therein) GT = present study TG = Tifft and Gregory (1976 and references therein)
inclusion of - 10 background galaxies. However, we cannot rule out the possibility that the ICR has an asymmetric distribution. The curve superposed on the histogram in Figure 3 is a normal distribution fitted to the remaining 40 ICR galaxies.
Before listing the possible background galaxies, we note two instances of CGCG apparent doubles which have one member with Vo < 7900 km s-I (the apparent division between the Supercluster and the background) and one with Vo > 7900 km s-l. Zw 159022~ has Vo = 7980 km s-l, and Zw 159022e has Vo = 7395 km s-l. Since these two galaxies show no evidence of physical interaction, we consider them to be a chance optical pair. Zw 127076s has Vo = 7464 km s-l and Zw 127076n has Vo = 8514 km s-l. These two galaxies do seem to share a common envelope, and we place them both_ in the suggested background, since their mean is Vo = 7989 km s-l. In Table 3 we list the 10 galaxies that we consider to be located behind the Supercluster. In columns (1) and (2) the CGCG and NGC/IC identification numbers are given. In column (3) we give the new morpho- logical classifications. Columns (4), (5), and (6) present m,, the redshift, and the redshift source, respectively.
V. t 1 6 ' ~ r n Y'
FIG. 3.-The redshift distribution of the isolated ICR galaxies plus the NGC 4615 group and the probable background. There is a very large gap in redshift between the ICR and the highest-redshift galaxies located directly in front of the ICR. The curve is a normal distribution which was fitted to the redshift distribution of the isolated ICR galaxies.
O American Astronomical Society Provided by the NASA Astrophysics Data System
GREGORY AND THOMPSON
Gier ] I
l3W IF 30" IPOOm RIGHT ASCENSION 0930)
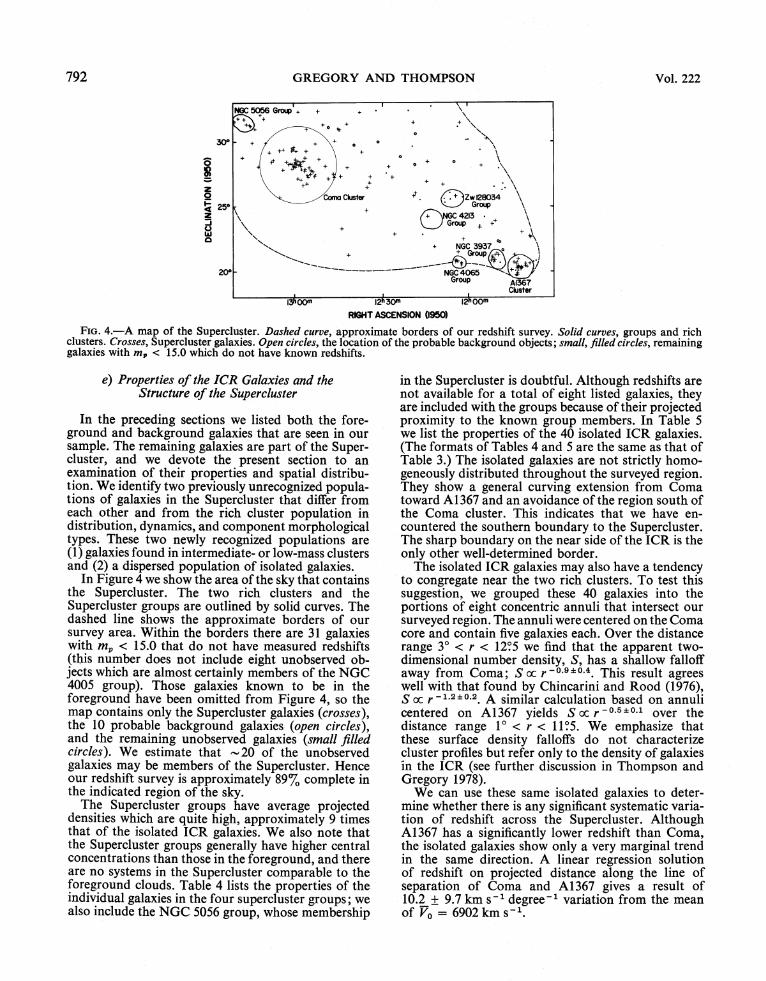
Re. 4.-A map of the Supercluster. Dashed curve, approximate borders of our redshift survey. Solid curves, groups and rich clusters. Crosses, Supercluster galaxies. Open circles, the location of the probable background objects; small, filled circles, remaining galaxies with m, < 15.0 which do not have known redshifts.
e) Properties of the ICR Galaxies and the Structure of the Supercluster
In the preceding sections we listed both the fore- ground and background galaxies that are seen in our sample. The remaining galaxies are part of the Super- cluster, and we devote the present section to an examination of their properties and spatial distribu- tion. We identify two previously unrecognized popula- tions of galaxies in the Supercluster that differ from each other and from the rich cluster population in distribution, dynamics, and component morphological types. These two newly recognized populations are (1) galaxies found in intermediate- or low-mass clusters and (2) a dispersed population of isolated galaxies.
In Figure 4 we show the area of the sky that contains the Supercluster. The two rich clusters and the Supercluster groups are outlined by solid curves. The dashed line shows the approximate borders of our survey area. Within the borders there are 31 galaxies with m, < 15.0 that do not have measured redshifts (this number does not include eight unobserved ob- jects which are almost certainly members of the NGC 4005 group). Those galaxies known to be in the foreground have been omitted from Figure 4, so the map contains only the Supercluster galaxies (crosses), the 10 probable background galaxies (open circles), and the remaining unobserved galaxies (small jilled circles). We estimate that -20 of the unobserved galaxies may be members of the Supercluster. Hence our redshift survey is approximately 89% complete in the indicated region of the sky.
The Supercluster groups have average projected densities which are quite high, approximately 9 times that of the isolated ICR galaxies. We also note that the Supercluster groups generally have higher central concentrations than those in the foreground, and there are no systems in the Supercluster comparable to the foreground clouds. Table 4 lists the properties of the individual galaxies in the four supercluster groups; we also include the NGC 5056 group, whose membership
in the Supercluster is doubtful. Although redshifts are not available for a total of eight listed galaxies, they are included with the groups because of their projected proximity to the known group members. In Table 5 we list the properties of the 40 isolated ICR galaxies. (The formats of Tables 4 and 5 are the same as that of Table 3.) The isolated galaxies are not strictly homo- geneously distributed throughout the surveyed region. They show a general curving extension from Coma toward A1367 and an avoidance of the region south of the Coma cluster. This indicates that we have en- countered the southern boundary to the Supercluster. The sharp boundary on the near side of the ICR is the only other well-determined border.
The isolated ICR galaxies may also have a tendency to congregate near the two rich clusters. To test this suggestion, we grouped these 40 galaxies into the portions of eight concentric annuli that intersect our surveyed region. The annuli were centered on the Coma core and contain five galaxies each. Over the distance range 3" < r < 1 2 3 we find that the apparent two- dimensional number density, S, has a shallow falloff away from Coma; Scc r-0.0*0.4. This result agrees well with that found by Chincarini and Rood (1976), S cc r 0.2. A similar calculation based on annuli centered on A1367 yields S cc r -0.5i0.1 over the distance range l o c r < 115. We emphasize that these surface density falloffs do not characterize cluster profiles but refer only to the density of galaxies in the ICR (see further discussion in Thompson and Gregory 1978).
We can use these same isolated galaxies to deter- mine whether there is any significant systematic varia- tion of redshift across the Supercluster. Although A1367 has a significantly lower redshift than Coma, the isolated galaxies show only a very marginal trend in the same direction. A linear regression solution of redshift on projected distance along the line of separation of Coma and A1367 gives a result of 10.2 f 9.7 km s-I degree-l variation from the mean of Vo = 6902 km s-l.
O American Astronomical Society Provided by the NASA Astrophysics Data System

No. 3, 1978 COMAlA1367 SUPERCLUSTER
TABLE 4 GALAXIES IN SUPERCLUSTER GROUPS
zwlcky NO. Name ~ y p a mp -1 Swicky No. Name Type mp VO Sourcet
( a ) NGC 3937 Group
127063 N 3910 SO 14.4 127080 N 3929 E/SO 14.5 127082 Sd 14.7 127088 N 3937 SO- 14.0 127089 N 3940 SO- 14.3
127090 N 3943 SBO 14.7 127095 N 3947 SC 14.2 127098 N 3954 E 14.4 127100 S 14.9 127072 Sbc 14.6
*membership uncer ta in
(b ) NGC 4065 Group
128005 N 4061 E 14.4 128007 N 4065 SO- 14.0 128008 N4066 SO 14.4 128009 N 4070 SO- 14.3 128012 N 4076 SO/a 14.3
128023 N 4092 Sbc 14.4 128025 N4095 SO 14.6 128026 N 4098 E 14.5 098032 N 4053 sE+ 14.6
098034 Pec 14.8
(c) ZW 128034 Group
*bad comparison spectrum
(d) NGC 4213 Group
128065 N 4213 E+ 14.3 6986
( e ) ITGC 5056 Group
160173 N 5056 Sb 13.6 5481 160176 N 5057 SO 14.6 5856 160181 N 5065 Sbc 14.3 5732 160183 N 5074 Pec 14.7 5720 160202 - 14.9 5183
tDM = Dickens and Moss (1976) GT = presen t s tudy TG = T i f f t and Gregory (1976 and re fe rences t h e r e i n )
To find the line-of-sight depth of the Supercluster, we will assume that the redshift dispersion is caused by differential Hubble expansion. This estimated thickness will be only an upper limit because we can apriori predict that there will be two other components contributing to the dispersion. One component, a,,,, would be large if these galaxies were ever in virially relaxed groups. Another component, a,, represents the primordial random kinetic energy of the galaxies themselves. We assume a,,, << a, and a, << o,, where o, is the dispersion caused by differential Hubble flow. For an operational definition of the characteristic depth, we use the difference in distances determined by a 2 a spread from the mean. The observed a = 318 km s-l then yields a thickness of 6.4 h-l Mpc. Since this is only 30% of the apparent separation between Coma and 81367, the Supercluster is seen to be highly asymmetric. However, if the 10 background galaxies indicate an extension on the far side of the Supercluster, then its depth would be 13 h-l Mpc.
Table 6 summarizes the general properties of the Supercluster systems; the format is the same as that of Table 2. Four of the eight systems (Coma, two groups, and the isolated ICR galaxies) have mean redshifts in the narrow range 6900 < ro < 7000 km s-l. A1367 and the Zw_ 128034 group have considerably lower values of Vo = 6450 and 6395 km s-l, respectively, and the NGC 3937 group has redshifts intermediate &tween the two extremes. The NGC 5056 group has V, = 5510 km s-l, which is -900 km s-I lower than
any system which is definitely part of the Supercluster. The line-of-sight velocity dispersions vary from o z 300 to o z 1,000 km s-l.
The morphological data show significant differences among the populations. Of the foreground galaxies with M, I M,, 69y0 are spiral or related late types, while only 39y0 of all the Supercluster galaxies are spiral. Yet, within the Supercluster, we find that 59y0 of the isolated ICR galaxies are spiral, while spirals account for only 33% and 36% of the galaxies in rich clusters and groups, respectively. Since we are com- paring morphologies for galaxies having a wide range in distances and hence diameters, we have compared morphologies judged from the Sky Survey (the source of most of our data) with independent morphologies determined from excellent 4 m prime focus plates of Coma and A1367. We find that the rough statistic of spiral percentage is relatively independent of the plate material and hence also of distance.
For those Supercluster groups where enough data exist, we have calculated the virial MIL ratios; they are found to range 200 < MIL < 400. N,,,, and were obtained as in 5 IIIc and show that the Coma cluster, having an estimated 1269 galaxies with M, < - 15.0, contributes 43% of the total number of Supercluster galaxies and 37% of the total luminosity. We estimate the total mass of the Supercluster to be 8.4 x lo1* M, (assuming MIL ratios of 200,200, and 100 for E, SO, and S galaxies); fully 50% of this mass is located in the Coma cluster itself.
O American Astronomical Society Provided by the NASA Astrophysics Data System

794 GREGORY AP THOMPSON Vol. 222
TABLE 5 ' ISOLATED SUPERCLUSTER GALAXIES
Zwicky No. Name Type mp Vo Source*
127025 N 3808 Sd 14 .1 7050 DM 1270258 N 3808 S/SO -- 7230 DM 127038 SC 14.0 6906 DM 127050 Sa 14.8 6736 GT 127086 E 14.8 6793 GT
127099 N 3951 S 14.5 6430 GT 127115 N 4003 S/SO 14.8 6438 GT 128003 14.6 6476 GT 128017 N 4084 Edp 14.9 6621 GT 128054 SO- 14.6 7220 GT
128077 IC 780 E/SO 14.5 6779 GT 128078 IC 3171 E 14.8 6935 GT 128089 IC 791 Sab 14.2 6735 GT 129011 IC 3582 ? 14.3 7113 CR 129012 IC 3581 Scd 14.9 6972 GT
158033 E 14.4 6753 CR 158036 N 4146 Sbc 13.8 6461 CR 158053 14.4 6752
4211 Eop 14.6 7689 CR
158054 CR 158081 P ~ C 14.5 6697 CR
158112 IC 3376 Sd 14 .4 7078 CR 159005 IC 3407 SC 14.7 7062 CR 159021 N 4555 E+ 13.5 6685 CR 1590223 N 4556 E+ 14.4 7395 CR 159037 N 4585 Sp 14.6 7411E TG
159038 EOp it:; ;:EE
CR 159059 TG 159061 ~ g d 14.8 7113E TG 159070 N 4673 E 13.7 6990 BGC 1590728 N 4676 Sp 14.1 6585 TG,BGC
1590728 N 4676 -- 6598 TG,BGC 159076 IC 821 %d 14.5 6726 TG,K 159095 I C 8 2 6 Sbc 14.9 7153 TG 159103 SO 14.8 68943 TG 160000 Sb 14.7 68443 TG
*BGC = de Vaucouleurs and de Vaucouleurs (1964) CR = Chincarini and Rood (1976 + references therein) DM = Dickens and MOSS (1976) GT = present study
K = Kintner (1971) TG = T i f f t and Gregory (1976 + references therein)
IV. DISCUSSION
In the preceding portions of this paper, we have presented observations dealing with four distinct populations of galaxies that differ from one another in distribution, dynamics, and component morpho- logical types. In the following discussion we will examine the implications which these observations have on the evolution of galaxy systems in general and on the Coma/A1367 Supercluster in particular.
Two of the four galaxy populations have been studied previously.
1. The properties of galaxies in the two rich clusters are known in detail. In addition to the references given in 5 11, analyses of the properties of these galaxies can be found in Rood et al. (1972), Gregory (1975), and Gregory and Tifft (1976a, b). Here our major objective is to examine the environment in which these clusters are located. We note that the present-day separation between Coma and A1367 is 24 h - I Mpc. Hence
their relative separation (i.e., Hubble flow) velocity is 2400 km s-' (joint gravitational attraction causes negligible deceleration). The dominant component of this velocity must be in the plane of the sky, since the line-of-sight velocity difference is only 500 km s-l. This indicates that the separation vector between Coma and A1367 lies at an angle of - 12" from the plane of the sky. We find no reason at present to speculate on possible orbital motion of the two clusters about a mutual center of mass.
2. Galaxies in sparse groups, such as those found in the foreground of the Supercluster, have also been studied before, but our findings show some new and unexpected results. Groups are found to have separa- tions much larger than their radii, and the intergroup space is nearly devoid of galaxies. (Chincarini and Martins 1975 have suggested that the redshift distribu- tion in the direction of the Hercules supercluster is also clumpy.) There are large regions of space with radii >20 h - I Mpc which contain no detectable galaxies, groups, or clusters, giving an upper limit to the detected mass density in these regions of p < 4 x
g ~ m - ~ . A redshift survey now being done by Gregory, Thompson, and Tifft (1 978) which examines the supercluster surrounding A426 (Perseus), A347, and A262 shows that there exist even larger voids than any found in the present study.
It is an important challenge for any cosmological model to explain the origin of these vast, apparently empty regions of space. There are two possibilities: (1) the regions are truly empty, or (2) the mass in these regions is in some form other than bright galaxies. In the first case, severe constraints will be placed on theories of galaxy formation because it requires a careful (and perhaps impossible) choice of both Q (present mass densitylclosure density) and the spec- trum of initial irregularities in order to grow such large density irregularities. If the second case is correct, then matter might be present in the form of faint galaxies, and an explanation would have to be sought for the peculiar nature of the luminosity function. Alternatively, the material might still be in its primordial gaseous form (either hot or cold neutral hydrogen), and the physical state of this matter may be similar to that discussed in a number of speculative papers (see Rees and Ostriker 1977). A search for radio radiation should be made in the direction of the voids.
a) The Supercluster Groups
Our census of groups within the ICR is probably complete for (1) groups with at least one galaxy having m, < 15.0, and (2) groups with easily recognizable central concentrations. As an example, because the charts in CGCG extend 0.8 mag fainter than our survey, we were able to discern the presence of the NGC 4213 group even though NGC 4213 itself is the only bright galaxy. It will be important to eventually push the redshift survey in the Supercluster to m, = 15.7, the limit of the Zwicky catalog. Undetected groups that do not meet the criteria given above may exist within the Supercluster.
O American Astronomical Society Provided by the NASA Astrophysics Data System

No. 3, 1978 COMA/A1367 SUPERCLUSTER
TABLE 6 SUPERCLUSTER SYSTEMS
(I*) log 'dZ':) v i r i a l 'h log p (a,3,4,e )
(1) ( 0 ) - Morphology Name Type Nobe Ncalc "0 'v (% Spiral) log Lobs ( 4 ) (s) M/L (degrees) (Mo
coma* r i c h c lus ter 66 1269 6947 -1000 2 7 12.17 14.63 13.87 2x10a 0.96 12.85 comat c lus ter core 33 635 6870 944 15 11.89 14.39 13.68 0.43 13.67 A1367t r i c h c lus ter 24 400 6373 715 46 11.73 13.93 13.11 2x10' 0.45 13.25 NGC 3937 group 9 196 6680 306 44 11.35 13.80 12.97 293 0.44 13.08 NGC 4065 group 11 212 6963 354 15 11.39 13.87 13.08 205 0.35 13.40
Zw 128034 group 6 100 6395 - 33 10.99 1 3 . 4 1 1 2 . 5 5 - 0.62 12.30 NGC 4213 group 1 22 6986 - 0 10.41 1 2 . 9 9 1 2 . 3 9 - - - NGC 5056 group 6 71 5510 316 67 10.94 13.14 12.09 384 0.43 12.70 Isolated ICR - 40 785 6902 318 59 11.97 1 4 . 1 2 1 3 . 2 9 - - -
NOTES: (1 ) m < 15.0 P
( a ) calculated for Me 5 -15.0
( a ) solar uni t s
( 4 ) M/L = 200 for E and SO galaxies; M/L = 100 for sp ira ls
(s) M/L = 50 for E galaxies, 30 for SO., and 7 for sp ira ls
( 6 ) assuming H = 75 km s -I Mpc-I
*out t o radiue = 3'
tout to radius = lo
Our estimates of the masses and richnesses of clusters are limited by the accuracy of the assumed luminosity function. For faint galaxies in groups there is some evidence that the slope of the integrated luminosity function might be flatter than the Abell luminosity function used in $111~ (Gregory and Thompson 1977; Felten 1977). Therefore we might have systematically overestimated No,, and 9tCa1, for Supercluster groups as compared with the fore- ground groups, since corrections to observed quanti- ties are larger for the more distant systems.
Two independent lines of argument confirm that, even if we have overestimated No,,, and 9tc,, for the Supercluster systems, the Supercluster groups would still be found more massive than the foreground groups. One argument is that the NGC 4065 and NGC 3937 groups each contains at least eight galaxies with M, s - 19.9, while no foreground system has more than four galaxies that satisfy the same inequality (see Fig. 2). Any reasonable luminosity function would indicate that groups containing many bright galaxies are richer and more massive than systems with few bright galaxies. The second argument is that the line-of-sight velocity dispersions of the NGC 4065 and NGC 3937 groups are higher than any found in the foreground systems. If all of these groups are gravitationally bound, the higher dispersions of the Supercluster groups imply higher masses.
One of the other two Supercluster groups, Zw 128034, also has a mass larger than any of the fore- ground systems. Unfortunately, five of the brighter galaxies (m, < 15.0) in this system have not had their redshifts determined. It would be useful to see whether its velocity dispersion is also larger than those of the foreground groups. The fourth system, the NGC 4213 group, clearly has a very low mass, but N,,,, and 9tc,,, are uncertain because only one galaxy is bright enough to be in our survey.
b) The Isolated ZCR Galaxies
The only galaxies in our sample that are not located in distinct groups, clouds, or clusters are those we find dispersed within the Supercluster. It is of some importance to determine whether these isolated ICR galaxies are truly primordial "field" galaxies or, alternatively, if they are the remnants of tidally dis- rupted groups or clouds. If it can be shown that the isolated galaxies are remnants of disrupted groups, then it follows that all galaxies were located within discrete clusters (or groups or clouds) at an early stage of their development. This idea is an alternative to the view that groups, clouds, and clusters grow from small irregularities in the initially smooth galaxy dis- tribution (cf. Press and Schechter 1974; Peebles 1974).
If we hypothesize that the primordial galaxy systems within the ICR were similar to those systems now seen in the foreground sample, the following observations support the idea that dynamic interactions could produce the present-day ICR configuration:
i) The two least-dense foreground systems, the NGC 4615 and NGC 4793 clouds, would be disrupted by Tidal interactions if they were located within 10 h - l Mpc of the Coma cluster or 2.5 h- l Mpc of A1367.
ii) Spirals dominate the least-dense foreground clouds, and we find that the isolated ICR galaxies have the highest spiral incidence among the Supercluster systems.
iii) The isolated galaxies have a weak tendency to congregate near the two rich clusters (see 3 IIIe). This effect could have two origins. One is that the develop- ing clouds nearest to Coma and A1367 would be the most effectively disrupted. The other is that the two rich clusters attract more than half the galaxies dis- persing from a cloud even if the velocity vectors of the galaxies were initially isotropic. (A galaxy located
O American Astronomical Society Provided by the NASA Astrophysics Data System

796 GREGORY AND THOMPSON Vol. 222
10 Mpc from the Coma cluster could be completely decelerated from an initial 100 km s-I separation velocity in ~5 x lo9 yr.) This process is reminiscent of the cosmological infall discussed by Gunn and Gott (1972), except the infalling material comes not from a homogeneously distributed "field" but from the highly asymmetric distribution of Supercluster clouds and groups. It is likely that intergalactic gas, if present, would possess a distribution similar to that of the visible galaxies and would therefore also be infalling asymmetrically.
iv) The existing ICR groups are found to lie closer to A1367 than to Coma; this is expected because the more massive cluster should be more effective at disrupting small systems.
Although the present data are not conclusive, it seems likely that the evolution of the structure of the ICR was dominated by tidal interactions with Coma and A1367. We look forward to dynamical simulations of this picture.
c) Epoch of Cluster Formation If we adopt the conventional viewpoint that groups
and clusters were formed by dissipationless collapse, we can use the observations in the present survey to calculate the epoch of cluster formation. Observa- tionally the problem is simple. We determine Vj, the fraction of the total volume which clusters or groups occupy at the present epoch, and then use the relation (2, + 1) = Vf-lI3 to find the redshift of formation Z, which is identified with the epoch when the borders of all groups and clusters were in direct contact with one another. Since our total survey volume was selected to include two rich clusters, we will consider only the foreground sample of groups and clouds out to the redshift limit of 5500 km s-l. The small portion of this volume occupied by the groups themselves is
where the sum is taken over all groups, R, is the harmonic mean radius of each group (7712 times the projected harmonic mean radius listed in Table 2), and the factor of 2 in parentheses corrects for the reduction in radius which occurs when a group becomes virialized. If we define Vf = V,/ Vt, then
where 260 degree2 is the area in the sky over which the survey was made. Using the cluster radii from Table 2 in equation (I), we find
This implies that 1 + Zf z 10. If the cluster-forma- tion process included dissipation, then a tightly bound cluster which appears to have formed at high redshift could have formed more recently. We conclude that the redshift of formation for the foreground groups is Z r O 9.
d) The Morphologies of Galaxies The various galaxy systems that are found in our
sample show a wide range in the simple morphology index, O/,S, the fractional number of component galaxies that are spiral or related late type. Figure 5 shows a plot of this morphological index versus mass density of the system (using MIL = 200, 200, 100). Two of the galaxy systems that we have identified are not represented in Figure 5 because of the small number of observed galaxies in each. These are the NGC 3798 group and the NGC 4213 group. The isolated ICR galaxies are also not shown in Figure 5 because of difficulty in defining a meaningful mass density. The remaining systems given in Tables 2 and 6 are represented in the following manner: open circles indicate clouds; filled circles indicate foreground
LOG p
FIG. 5.-A plot of the morphology index versus the logarithm of the volume mass density (in units of Ma M ~ c - ~ ) . The Super- cluster systems are represented by solid triangles and are found to have the highest densities and lowest spiral incidence. The fore- ground clouds (open circles) have the lowest densities and highest incidence of spirals. The foreground groups (small, filled circles) and the NGC 5056 group (open triangle) lie between the extremes of p and %S.
O American Astronomical Society Provided by the NASA Astrophysics Data System

No. 3, 1978 COMAIA1367 SUPERCLUSTER 797
groups; filled triangles represent Supercluster systems; the NGC 5056 group is shown as an open triangle.
The data plotted in Figure 5 show a moderate correlation (r = -0.74), but the statistical significance of the distribution comes from points with extreme values of p and yoS. Those systems with intermediate values of p show a wide range in %S. It is also signifi- cant that the points are segregated according to population. The systems which are called clouds because of their low densities have the highest inci- dence of spirals. The Supercluster systems have the lowest spiral incidence. It is also interesting that the NGC 5056 group, which lies near the Supercluster but has differing dynamical properties, lies near the fore- ground groups in this diagram.
e) General Speculations Our purpose has been to study one supercluster in
detail. However, when the Coma11367 Supercluster is considered along with the other nearby superclusters, at least two features are of note.
Coma and A1367 have a very wide separation, forming a supercluster which is morphologically different from the others. Since important physical processes may manifest themselves by morphological properties, it will eventually be necessary to have a classification scheme for superclusters. A formal scheme should await detailed studies of more exam-
ples, but we can suggest the following three classes on the basis of the nearby examples:
I. Single corelhalo superc1usters.-The prototype is the Local Supercluster, which is centered on Virgo and contains many outlying groups.
11. Binary superclusters.-The prototypes are ComalA1367 (widely separated) and A2197121 99 (nearly in contact).
111. Extended linear superc1usters.-The prototype for this class is the extensive chain of clusters extending from A426 (Perseus) through A347, A262, and onto NGC 507 and NGC 383 groups.
The final speculation is based on the fact that Coma and A1367 complete an important set of clusters. In Abell's (1958) catalog there are only five clusters with distance class d I 2 and richness class r 2 2. Super- clusters containing Hercules, Perseus, and A2199 were previously recognized (e.g., Rood 1976). Coma and A1367 now complete the set. Every nearby very rich cluster is located in a supercluster. We suggest that all r 2 2 clusters will eventually be found to lie in super- clusters. Perhaps such very massive objects can form only in close association with other clusters.
We acknowledge the hospitality of Kitt Peak National Observatory during the observing run and during our subsequent summer visits. S. A. G. received partial support from NSF grant AST 74-22597.
APPENDIX
DEFINITION OF GROUP MEMBERSHIP
The lowest-redshift group is the Coma I cloud. Since Gregory and Thompson (1977) gave a map and a list of member galaxies, we list only its general properties in Table 2. The remaining seven foreground systems are mapped in Figure 6, and we list their member galaxies in Tables 7a-7g; the columns of these tables give the same informa- tion as those of Table 3.
The next lowest redshift system after the Coma I cloud has redshifts in the range 2190 c V, < 2860 km s-l. We refer to this system as the NGC 4793 cloud, and it was also recognized by Tifft and Gregory (1976). In Figure 6, the NGC 4793 cloud lies near the eastern boundary of the survey, and Tifft and Gregory list two probable
m4005 Group NGC 3798
Group
RIGHT ASCENSION (1-
FIG. 6.-A map of seven of the eight foreground systems. (A map of the Coma I cloud is given in Gregory and Thompson 1977.) Two galaxies with redshifts similar to those in the NGC 4793 cloud are seen as open circles projected against the NGC 4169 group. Two other galaxies, lying at the center of the Coma cluster, are shown by star-shaped symbols. These have redshifts similar .to those in the NGC 4615 cloud. Small, filled circles within the borders of the NGC 4005 group represent probable members with unknown redshifts.
O American Astronomical Society Provided by the NASA Astrophysics Data System

GREGORY AND THOMPSON
TABLE 7
Zwicky NO. Name Type mp vo Source* I Zwicky NO. Name Type m V" Source*
(a) NGC 4793 Groue
130016 N 5012 Sb 13.6 2566 TG 130019 N 5016 Sa 14.3 2769 TG 130020 Im 14.8 2592 TG 158064 I 777 S 14.5 2607 CR 158073 N 4275 ? 13.4 2292 CR
159116 N 4793 Sb 12.3 2504 BGC 160134 N 4961 Sb 13.5 2582 TG,BGC 160194 N 5089 SpP 14.4 2190 TG
(b) NGC 3801 Association
097025 N 3764 Pec 14.9 097030 N 3768 S/SO 13.7 3288 GT 097031 N3767 SBO 14.5 097032 Sd 14.8 097040 S 14.8
097043 N 3790 S/SO 14.5 097045 . S: 14.6 097048 14.3 097050 :PO 14.6 097051 N 3801 SO, 13.3 3356 GT
(d) NGC 3995 Group
157060 SO 157065 N 4004 157066 N 4008 %P 157068 Sm 157069 N 4016 Sd
DM
GT GT GT
CR CR CR CR CR
BGC
(e) NGC 4169 Group
158029 N 4131 S/SO 14.1 3697 CR 158030 N 4132 S/SO 14.6 4056 CR 158031 N 4134 Sbc 13.8 3845 CR 158041 N 4169 SO 12.9 3829 CR 158042 ? 14.8 4034 CR
(f) NGC 4005 Group
127101 SO- 14.9 127106 1 746 S 14.5 127110 N 3987 Sbc 14.4 4508 GT 127112 N 3993 SO/a 14.8
127125 N 4022 SBO 14.4 127127 N 4023 E/SO 14.6
(9) NGC 4615 Group
129015 N 4614 Sd 14.2 4848 TG.CR
159019 Scd 14.9 4702 CR
159039 : 4375 CR 159050 1 3651 4777 TG 159092 N4738 Sbc 14.9 4726 TG,K
*BGC = de Vaucouleurs and de Vaucouleurs (1964) CR = Chincarini and Rood (1976 and references therein) DM = Dickens and Moss (1976) GT = present study K = Kintner (1971) TG = Tifft and Gregory (1976 and references therein)
members beyond our borders. Two other galaxies, NGC 4275 and IC 777, are shown in the figure as open circles, the same symbol used for the galaxies whose membership in the cloud is certain. However, these two galaxies lie more than 5" from the rest of the cloud, near the NGC 4169 group. A discussion of the possibility that this system is dispersing can be found in the main body of the paper. Table 7a summarizes the data for the galaxies associated - -
with ihis cl&ud. Between 3000 and 4000 km s-l, the galaxies have a complicated distribution. Chincarini and Rood (1976)
grouped all of these galaxies together, but the present evidence shows several different mass concentrations. We first mention the three galaxies shown near the lower right portion of Figure 6. These appear to be part of a loose grouping which we name after NGC 3801. The three members with known redshift have 3143 < Vo < 3356. More members of this group may lie to the south of A1367 where no redshifts are available.
About 6" north of the NGC 3801 group are three galaxies with only slightly higher redshifts, 3459 < Vo < 3547 km s-l. These are part of a very sparse group that we name after NGC 3798. Five degrees farther north and east we find a line of galaxies extending northward. These six galaxies have redshifts in the range 3194 < Vo < 3578 km s-l and will be referred to as the NGC 3995 group, although we note that NGC 3995 is the northernmost member and its physical association with the other five galaxies is not certain.
O American Astronomical Society Provided by the NASA Astrophysics Data System

No. 3, 1978 COMAlA1367 SUPERCLUSTER 799
These last three groups are scattered over 14" (- 10 Mpc), but the total range of known redshifts is only 435 krn s-l, so they may form a tenuously related association of sparse clusters. The properties of their constituent galaxies are given in Tables 7b, 7c, and 7d.
At somewhat higher redshift we find a much more tightly concentrated cluster whichyill be referred to as the NGC 4169 group. The redshift range is 3697 < V, < 4150 km s-I with a mean of Vo = 3955 km s-l and a dispersion of o = 133 krn s-I. This is the group that was named after NGC 4131 by Tifft and Gregory (1976), and Chincarini and Rood (1976) referred to it as we do but included galaxies from the NGC 3995 group.
Five degrees southwest of the NGC 4169 group is a concentrated group with only two known redshifts. Since NGC 4005 is the brightest with m, = 14.1, we name the cluster after it. Eight additional galaxies with unknown redshifts are probably associated with this group and are shown as small filled circles in Figure 6.
The highest redshift system that is clearly in the foreground is the NGC 4615 cloud. (The NGC 5056 group is probably not associated with the Supercluster, but we cannot be certain.) Redshifts in this group lie in the range 4361 < Vo < 4848 km s-l. Since the lowest redshifts in the center of the Coma cluster itself fall in the upper part of this range, there may be confusion about the membership of individual galaxies. However, the general distribu- tion of low-redshift objects in Coma is very tightly concentrated near the center of the cluster (see Tifft and Gregory 1976, where fainter galaxies show the effect clearly), and the distribution of objects in the NGC 4615 cloud is very loose. Therefore, in general, Coma cluster galaxies can easily be distinguished. Two low-redshift Coma galaxies are shown in Figure 6 with star-shaped symbols. Finally, we point out that the NGC 4615 cloud may be an important object for study, since it is the least-dense cluster, group, or cloud that we have found in this survey.
REFERENCES Abell, G. 0 . 1958, Ap. J. Suppl., 3,211. . 1961, A.J.,66, 607.
. 1975, in Galaxies and the Universe, ed. A. Sandage, M. Sandaae, and J. Kristian (Chicaao: University of Chi- cago ~ r e s g , 'p. 601.
- Chincarini, G., and Martins, D. 1975, Ap. J., 196, 335. Chincarini, G., and Rood, H. J. 1976, Ap. J., 206, 30. de Vaucouleurs, G., and de Vaucouleurs, A. 1964, Reference
Catalogue of Bright Galaxies (Austin: University of Texas - - Press).-
Dickens, R. J., and Moss, C. 1976, M.N.R.A.S., 174,47. Felten, J. 1977, A.J., 82, 861. Gregory, S. A. 1975, Ap. J., 199, 1. Gregory, S. A., and Thompson, L. A. 1977, Ap. J., 213, 345. . 1978, in preparation. Gregory, S. A., Thompson, L. A., and Tifft, W. G. 1978, in
preparation. Gregory, S. A., and Tifft, W. G. 1976a, Ap. J., 205, 716.
. 19766, Ap. J., 206, 934. Gunn, J. E., and Gott, J. R. 1972, Ap. J., 176, 1. Hauser, M. G., and Peebles, P. J. E. 1973, Ap. J., 185, 757. Jones, B. J. T. 1976, M.N.R.A.S., 174,429. Kintner, E. C. 1971, A.J., 76, 409.
Materne, J. 1974, Astr. Ap., 33, 451. Noonan, T. W. 1973, A.J., 78, 26. Peebles, P. J. E. 1974, Astr. Ap., 32, 197. Press, W. H., and Schechter, P. 1974, Ap. J., 187, 425. Rees. M. J.. and Ostriker. J. P. 1977. M.N.R.A.S.. 179. 541. , . ~ o o d , H. J.' 1976, Ap. J., 207, 16.
'
Rood, H. J., Page, T. L., Kintner, E. C., and King, I. R. 1972, Ap. J., 175, 627.
Sandage, A. R. 1975, in Galaxies and the .Universe, ed. A. Sandage, M. Sandage, and J. Kristian (Chicago: University of Chicago Press), p. 761.
Schipper, L., and Klng, I. R. 1978, Ap. J., 220, 798. Shane, C. D. 1975, in Galaxies and the Universe, ed. A..San-
dage, M. Sandage, and J. Kristian (Chicago: University of Chicago Press), p. 647.
Shapiro, S. L. 1971, A.J., 76,291. Thompson, L. A., and Gregory, S. A. 1978, Ap. J., 220, 809. Tifft, W. G., and Gregory, S. A. 1976, Ap. J., 205, 696. Tifft, W. G., and Tarenghi, M. 1975, Ap. J. (Letters), 198, L7. van den Bergh, S. 1970, Nature, 225, 503. Zwicky, F., and Herzog, E. 1963, Catalogue of Galaxies and of
Clusters o f Galaxies (Pasadena: California Institute of ~echnolog~), Vol. 2 (CGCG).
Note added in proof.-The redshifts reported by Dickens and Moss (1976) are not referred to a galactocentric reference frame as are all other redshifts used in this paper. However, since the galactic rotation corrections are typically only about - 60 km s-l for the DM galaxies, our general results are not significantly affected.
STEPHEN A. GREGORY: Department of Physics, Bowling Green State University, Bowling Green, OH 43403
LAIRD A. THOMPSON: Department of Physics and Astronomy, Behlen Laboratory of Physics, University of Nebraska, Lincoln, NE 68508
O American Astronomical Society Provided by the NASA Astrophysics Data System