the coffee sector in sub-saharan africa march 2014... · the coffee sector in sub-saharan africa....
TRANSCRIPT

The coffee sector in Sub-Saharan Africa
Dr Edward George Head of Soft Commodities Research, Ecobank
4 March 2014, London
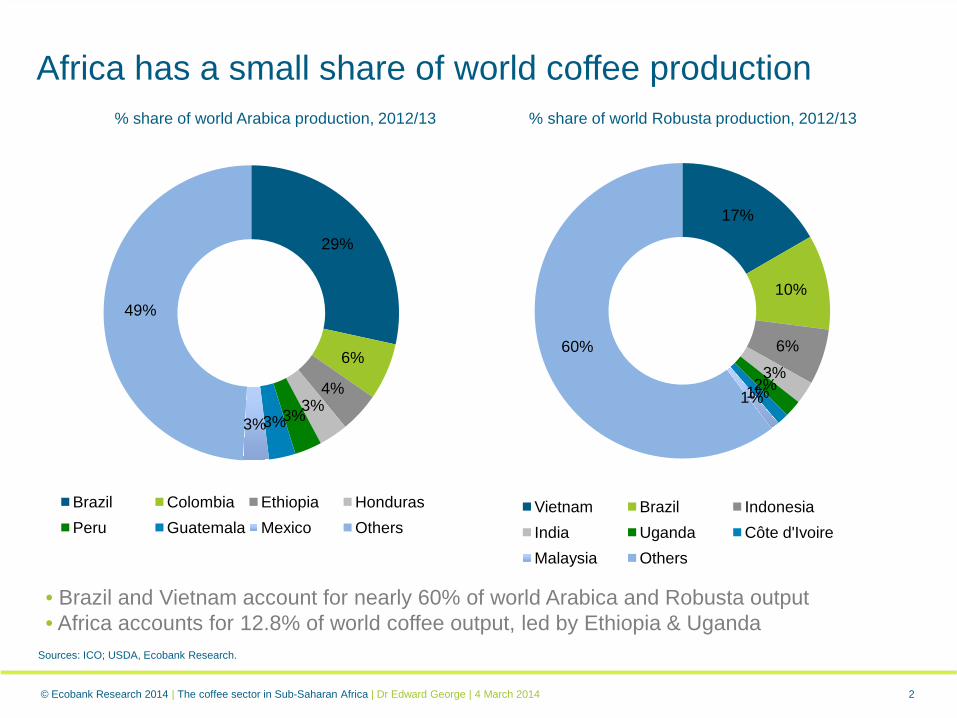
17%
10%
6%
3%2%1%1%
60%
Vietnam Brazil IndonesiaIndia Uganda Côte d'IvoireMalaysia Others
2
Africa has a small share of world coffee production% share of world Arabica production, 2012/13 % share of world Robusta production, 2012/13
Sources: ICO; USDA, Ecobank Research.
• Brazil and Vietnam account for nearly 60% of world Arabica and Robusta output• Africa accounts for 12.8% of world coffee output, led by Ethiopia & Uganda
© Ecobank Research 2014 | The coffee sector in Sub-Saharan Africa | Dr Edward George | 4 March 2014
29%
6%
4%3%3%3%3%
49%
Brazil Colombia Ethiopia HondurasPeru Guatemala Mexico Others

3
Coffee production, 2012/13(each bar = 2 million 60-kg bags)
Sources: Intracen, Ecobank Research.
Arabica
Africa’s coffee production
Madagascar
Côte d'Ivoire
DRC
Cameroon Uganda
Burundi
EthiopiaGuinea
Robusta
Kenya
Tanzania
Rwanda
© Ecobank Research 2014 | The coffee sector in Sub-Saharan Africa | Dr Edward George | 4 March 2014

4
Ethiopia & Algeria dominate coffee consumptionAfrican coffee consumption, 000s 60-kg bags, 2012/13 % share of African total, 2012/13
Sources: ICO; USDA, Ecobank Research.
• Ethiopia & Algeria account for ¾ of Africa’s coffee consumption.• Most producers view coffee exclusively as a cash crop for export.
40%
27%
9%
6%
5%4%
9%
Ethiopia Algeria MoroccoSouth Africa Madagascar Côte d'IvoireOther
© Ecobank Research 2014 | The coffee sector in Sub-Saharan Africa | Dr Edward George | 4 March 2014
0
500
1,000
1,500
2,000
2,500
3,000
3,500
Ethiopia Algeria Morocco South AfricaMadagascar Côte d'Ivoire DRC
5
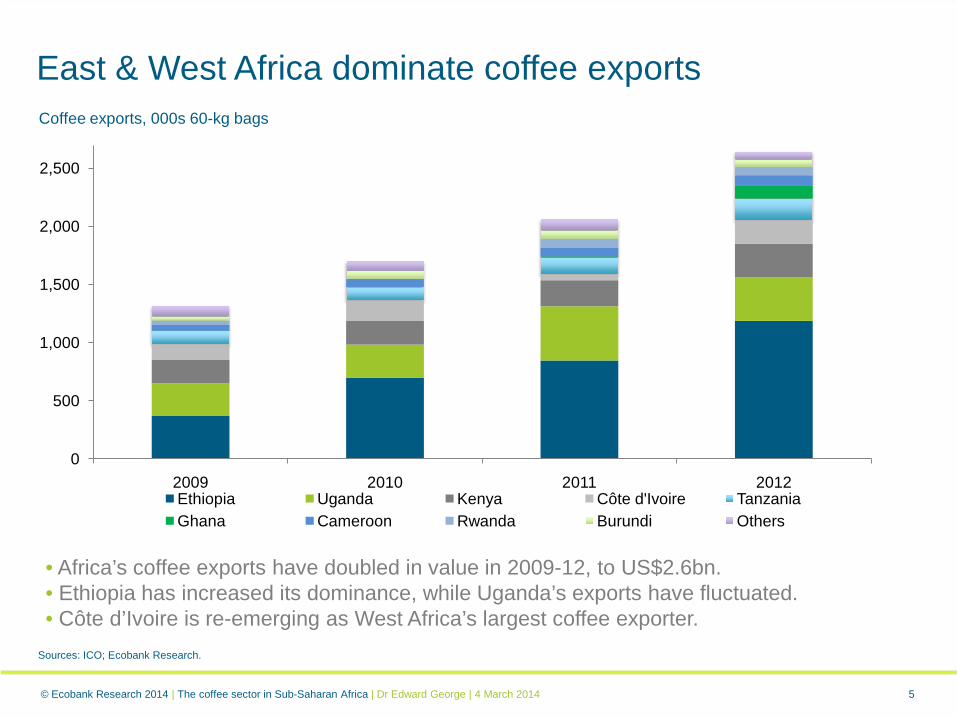
East & West Africa dominate coffee exportsCoffee exports, 000s 60-kg bags
Sources: ICO; Ecobank Research.
• Africa’s coffee exports have doubled in value in 2009-12, to US$2.6bn.• Ethiopia has increased its dominance, while Uganda’s exports have fluctuated.• Côte d’Ivoire is re-emerging as West Africa’s largest coffee exporter.
© Ecobank Research 2014 | The coffee sector in Sub-Saharan Africa | Dr Edward George | 4 March 2014
0
500
1,000
1,500
2,000
2,500
2009 2010 2011 2012Ethiopia Uganda Kenya Côte d'Ivoire TanzaniaGhana Cameroon Rwanda Burundi Others
6
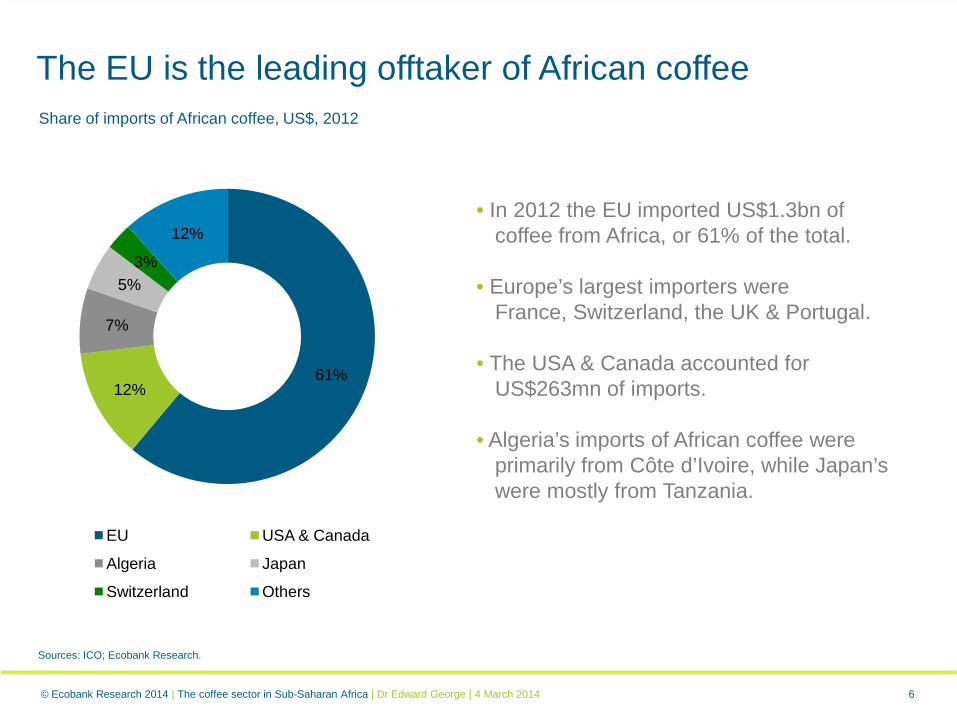
The EU is the leading offtaker of African coffeeShare of imports of African coffee, US$, 2012
Sources: ICO; Ecobank Research.
• In 2012 the EU imported US$1.3bn of coffee from Africa, or 61% of the total.
• Europe’s largest importers were France, Switzerland, the UK & Portugal.
• The USA & Canada accounted for US$263mn of imports.
• Algeria’s imports of African coffee were primarily from Côte d’Ivoire, while Japan’s were mostly from Tanzania.
61%12%
7%
5%3%
12%
EU USA & Canada
Algeria Japan
Switzerland Others
© Ecobank Research 2014 | The coffee sector in Sub-Saharan Africa | Dr Edward George | 4 March 2014
7
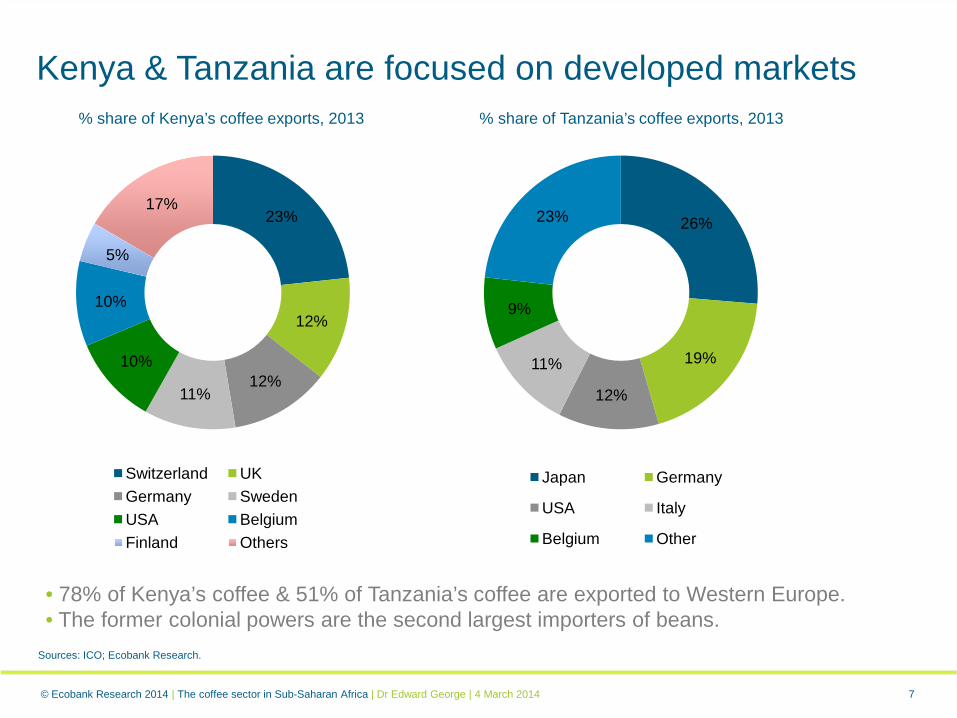
Kenya & Tanzania are focused on developed markets% share of Kenya’s coffee exports, 2013 % share of Tanzania’s coffee exports, 2013
Sources: ICO; Ecobank Research.
23%
12%
12%11%
10%
10%
5%
17%
Switzerland UKGermany SwedenUSA BelgiumFinland Others
26%
19%
12%
11%
9%
23%
Japan Germany
USA Italy
Belgium Other
• 78% of Kenya’s coffee & 51% of Tanzania’s coffee are exported to Western Europe. • The former colonial powers are the second largest importers of beans.
© Ecobank Research 2014 | The coffee sector in Sub-Saharan Africa | Dr Edward George | 4 March 2014
8
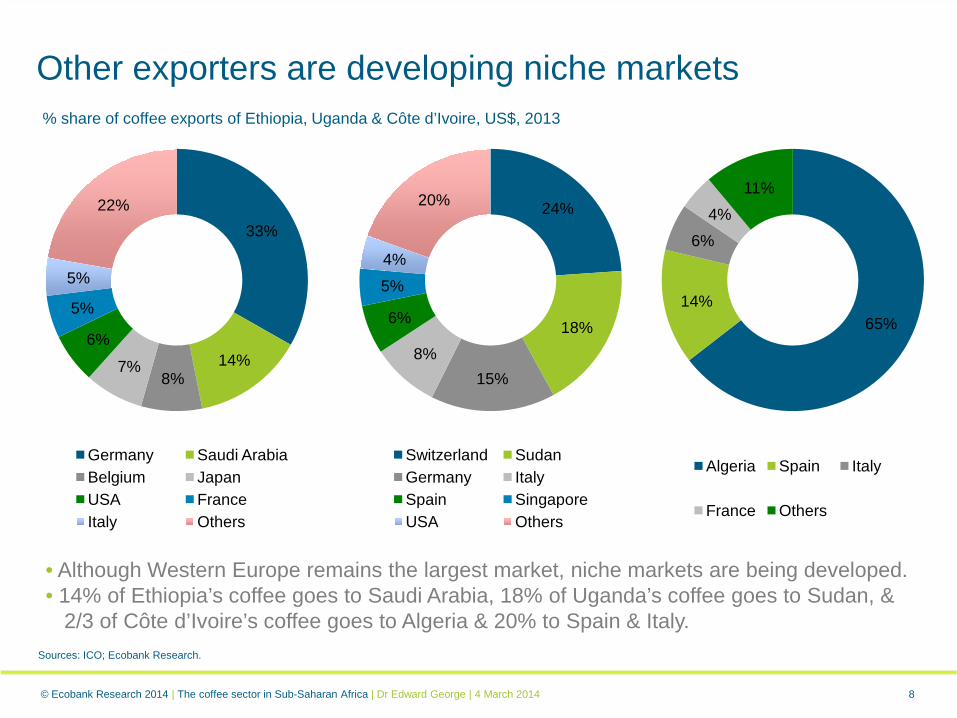
Other exporters are developing niche markets
Sources: ICO; Ecobank Research.
33%
14%8%
7%
6%
5%
5%
22%
Germany Saudi ArabiaBelgium JapanUSA FranceItaly Others
24%
18%
15%8%
6%
5%
4%
20%
Switzerland SudanGermany ItalySpain SingaporeUSA Others
65%14%
6%4%
11%
Algeria Spain Italy
France Others
• Although Western Europe remains the largest market, niche markets are being developed. • 14% of Ethiopia’s coffee goes to Saudi Arabia, 18% of Uganda’s coffee goes to Sudan, &
2/3 of Côte d’Ivoire’s coffee goes to Algeria & 20% to Spain & Italy.
% share of coffee exports of Ethiopia, Uganda & Côte d’Ivoire, US$, 2013
© Ecobank Research 2014 | The coffee sector in Sub-Saharan Africa | Dr Edward George | 4 March 2014
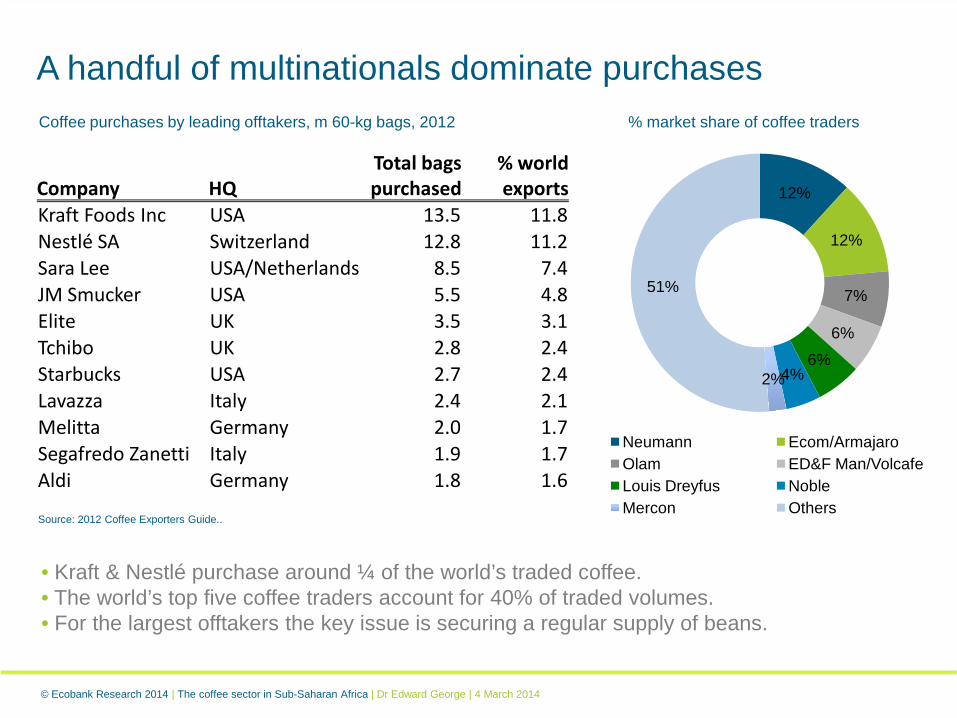
12%
12%
7%
6%
6%4%2%
51%
Neumann Ecom/ArmajaroOlam ED&F Man/VolcafeLouis Dreyfus NobleMercon Others
A handful of multinationals dominate purchases
Company HQTotal bags purchased
% world exports
Kraft Foods Inc USA 13.5 11.8Nestlé SA Switzerland 12.8 11.2Sara Lee USA/Netherlands 8.5 7.4JM Smucker USA 5.5 4.8Elite UK 3.5 3.1Tchibo UK 2.8 2.4Starbucks USA 2.7 2.4Lavazza Italy 2.4 2.1Melitta Germany 2.0 1.7Segafredo Zanetti Italy 1.9 1.7Aldi Germany 1.8 1.6
Coffee purchases by leading offtakers, m 60-kg bags, 2012 % market share of coffee traders
Source: 2012 Coffee Exporters Guide..
• Kraft & Nestlé purchase around ¼ of the world’s traded coffee.• The world’s top five coffee traders account for 40% of traded volumes.• For the largest offtakers the key issue is securing a regular supply of beans.
© Ecobank Research 2014 | The coffee sector in Sub-Saharan Africa | Dr Edward George | 4 March 2014
10
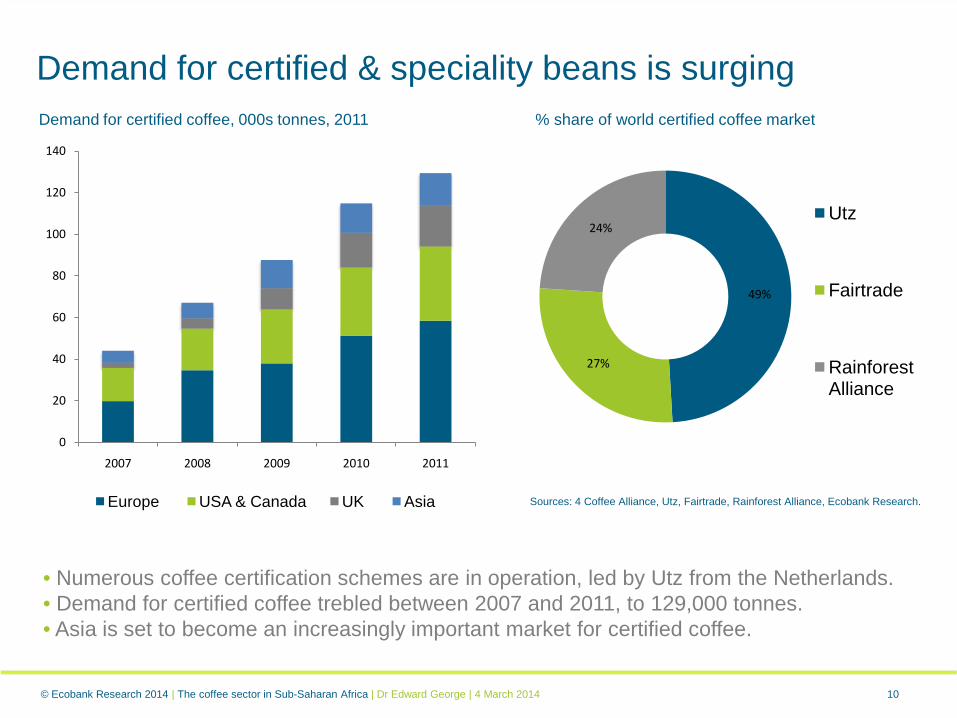
Demand for certified & speciality beans is surgingDemand for certified coffee, 000s tonnes, 2011 % share of world certified coffee market
49%
27%
24%Utz
Fairtrade
Rainforest Alliance
0
20
40
60
80
100
120
140
2007 2008 2009 2010 2011
Europe USA & Canada UK Asia
• Numerous coffee certification schemes are in operation, led by Utz from the Netherlands.• Demand for certified coffee trebled between 2007 and 2011, to 129,000 tonnes.• Asia is set to become an increasingly important market for certified coffee.
Sources: 4 Coffee Alliance, Utz, Fairtrade, Rainforest Alliance, Ecobank Research.
© Ecobank Research 2014 | The coffee sector in Sub-Saharan Africa | Dr Edward George | 4 March 2014
11
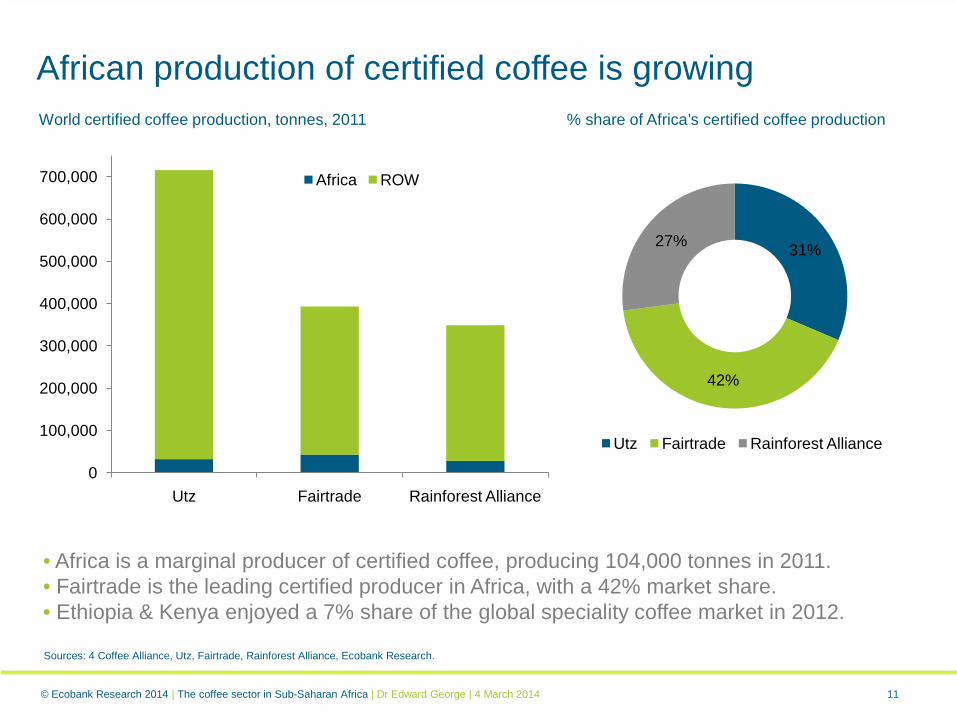
African production of certified coffee is growingWorld certified coffee production, tonnes, 2011 % share of Africa’s certified coffee production
• Africa is a marginal producer of certified coffee, producing 104,000 tonnes in 2011.• Fairtrade is the leading certified producer in Africa, with a 42% market share.• Ethiopia & Kenya enjoyed a 7% share of the global speciality coffee market in 2012.
Sources: 4 Coffee Alliance, Utz, Fairtrade, Rainforest Alliance, Ecobank Research.
© Ecobank Research 2014 | The coffee sector in Sub-Saharan Africa | Dr Edward George | 4 March 2014
0
100,000
200,000
300,000
400,000
500,000
600,000
700,000
Utz Fairtrade Rainforest Alliance
Africa ROW
31%
42%
27%
Utz Fairtrade Rainforest Alliance

12
But there are problems with certificationMass balancing versus controlled blending in the cocoa chain
• Mass balancing, controlled blending and segregation have not been properly explained to consumers.
• There is a risk of serious damage to the reputation and branding of certification schemes if this issue is taken up by consumer groups.
• The system for paying premiums is problematic, focusing farmers on money rather than on improving farming practices.
• The erosion of premiums in recent years, plus uneven demand for certified beans, is further undermining support for certification.
• In the long run a premium must be paid by the offtaker and/or the consumer to justify the farmer’s time and cost to certify his beans.
Source: Rainforest Alliance.
© Ecobank Research 2014 | The coffee sector in Sub-Saharan Africa | Dr Edward George | 4 March 2014
13
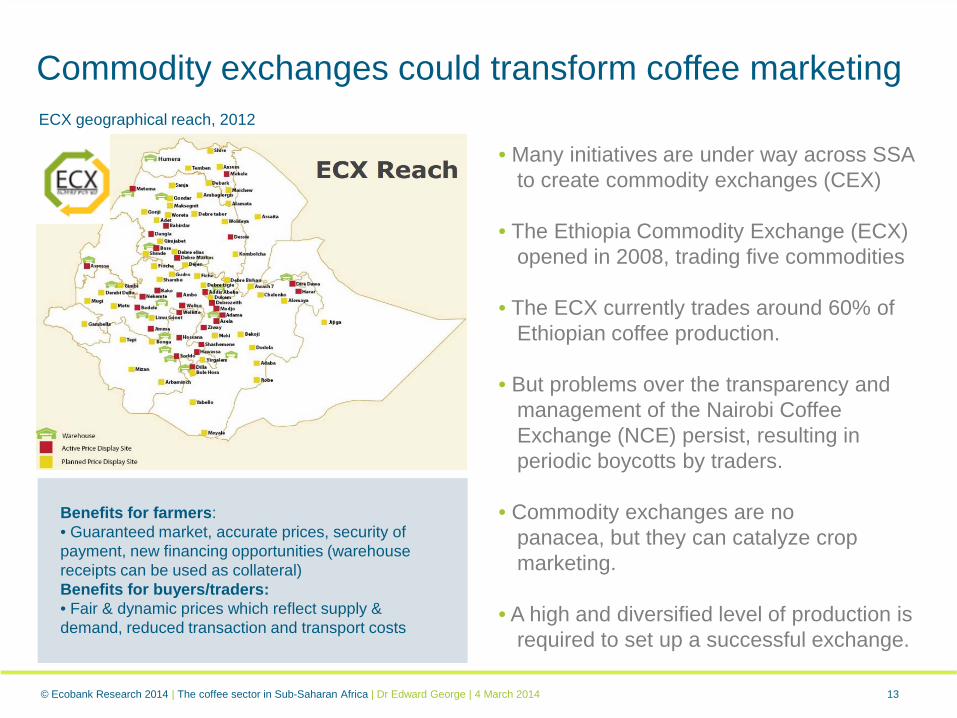
• Many initiatives are under way across SSA to create commodity exchanges (CEX)
• The Ethiopia Commodity Exchange (ECX) opened in 2008, trading five commodities
• The ECX currently trades around 60% of Ethiopian coffee production.
• But problems over the transparency and management of the Nairobi Coffee Exchange (NCE) persist, resulting in periodic boycotts by traders.
• Commodity exchanges are no panacea, but they can catalyze crop marketing.
• A high and diversified level of production is required to set up a successful exchange.
Commodity exchanges could transform coffee marketing
Benefits for farmers:• Guaranteed market, accurate prices, security of payment, new financing opportunities (warehouse receipts can be used as collateral)Benefits for buyers/traders:• Fair & dynamic prices which reflect supply & demand, reduced transaction and transport costs
ECX geographical reach, 2012
© Ecobank Research 2014 | The coffee sector in Sub-Saharan Africa | Dr Edward George | 4 March 2014
14
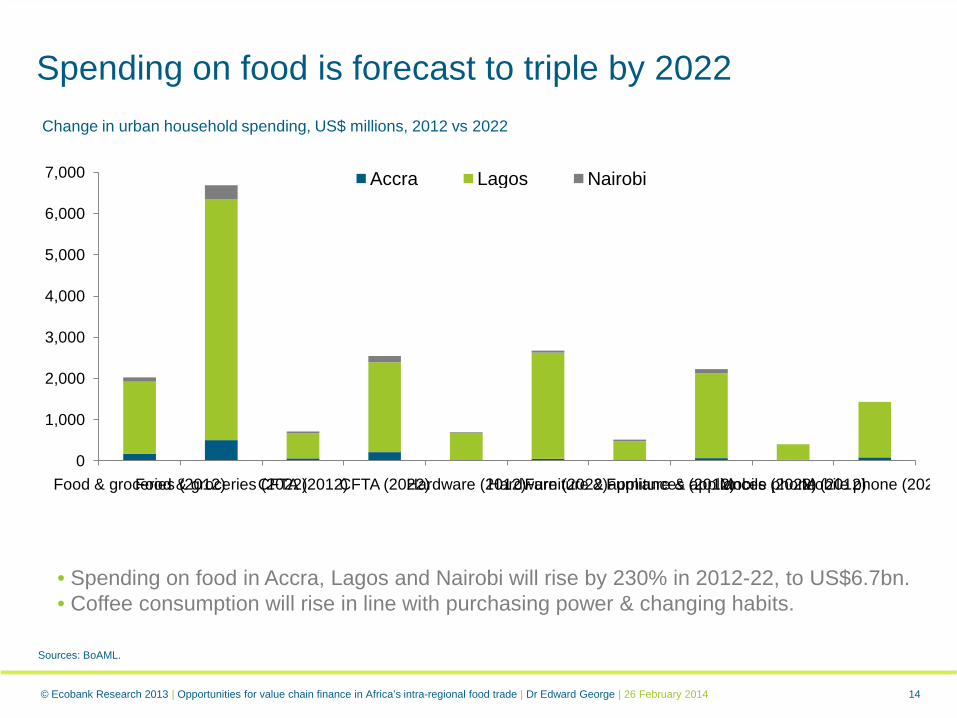
Spending on food is forecast to triple by 2022
• Spending on food in Accra, Lagos and Nairobi will rise by 230% in 2012-22, to US$6.7bn.• Coffee consumption will rise in line with purchasing power & changing habits.
Change in urban household spending, US$ millions, 2012 vs 2022
Sources: BoAML.
© Ecobank Research 2013 | Opportunities for value chain finance in Africa’s intra-regional food trade | Dr Edward George | 26 February 2014
0
1,000
2,000
3,000
4,000
5,000
6,000
7,000
Food & groceries (2012)Food & groceries (2022)CFTA (2012)CFTA (2022)Hardware (2012)Hardware (2022)Furniture & appliances (2012)Furniture & appliances (2022)Mobile phone (2012)Mobile phone (202
Accra Lagos Nairobi

Thank you