the clinical effectiveness of tests to detect the presence
TRANSCRIPT

Page 1 of 76 EAR025 May 2020
The clinical effectiveness of tests to detect the presence of SARS-CoV-2 virus, and antibodies to SARS-CoV-2, to inform COVID-19 diagnosis This report has been produced to assist the Welsh Government and Health and Social Care in Wales respond to the Coronavirus disease 2019 (COVID-19) pandemic. It is based on the most recent available evidence at the time of publication (date of publication 14 May 2020, to include all evidence published up to 4 May 2020) but will be updated frequently. Information newly added or updated in the most recent version is highlighted.
Executive summary
Tests for the presence of SARS CoV-2 virus
• Health Technology Wales (HTW) Researchers searched for, appraised and summarised all published evidence on the diagnostic performance, effectiveness or economic impact of tests used to detect the severe acute respiratory syndrome coronavirus 2 (SARS-CoV-2) virus to inform COVID-19 diagnosis.
• We identified 39 individual studies and one pooled analysis reporting outcomes including diagnostic accuracy, detection rates and the time taken to obtain test results. We carried out quality assessment of the studies and judged the majority to be at risk of bias in one or more aspect of their design or conduct, which means their results may not be reliable.
• The majority of studies tested hospitalised, symptomatic patients with a strong clinical suspicion of COVID-19. Studies in people with milder symptoms or in other settings are comparatively limited in number: we identified three such studies in the general population, plus two that tested UK healthcare workers.
• The majority of tests studied used laboratory-based polymerase chain reaction (PCR) protocols. Additionally, five studies used loop-mediated isothermal amplification assays to test for the presence of SARS-CoV-2 (and compared this to PCR). These assays have the potential to be used for point-of-care or near-patient testing, but this aspect of their use was not studied specifically.
• The lack of a generally accepted reference standard to compare reverse transcription PCR (RT-PCR) results against makes it challenging to assess the true diagnostic accuracy of these tests as method of diagnosing COVID-19. Some studies did not include methods of confirmatory/differential diagnosis to validate the test results obtained (e.g. the proportion of likely false positive and negative results). A pooled analysis estimated the sensitivity of an initial RT-PCR test result to be 89%, using results of repeated RT-PCR as the reference standard.
• We identified 18 studies that compared RT-PCR of SARS-CoV-2 with samples from different parts of the body. Tentatively, it appears the type of sample obtained, the part of the body sampled, and the timing of test relative to symptom onset could be influential on test results and accuracy, but we did not identify evidence with enough certainty to guide how these factors could be used to optimise testing. Where reported, sample collection was carried out by healthcare professionals in all but one study, and no studies were identified that

Page 2 of 76 EAR025 May 2020
investigated the reliability of sample collection by the tested subject compared with sample collection by a healthcare professional.
• There are important gaps in the available evidence on the effectiveness of tests for the presence of SARS-CoV-2. Studies of virus testing in asymptomatic patients, or in specific populations such as healthcare workers are limited in number and there is no evidence on the validated diagnostic performance of the tests beyond their use in the hospital setting. We did not identify any evidence on the economic impact of any test, or how any test influences subsequent patient management. We also did not find any evidence on the effectiveness of self-administered virus tests.

Page 3 of 76 EAR025 May 2020
Tests for the presence of SARS CoV-2 antibodies
• Health Technology Wales Researchers searched for, appraised and summarised all published evidence on the diagnostic performance, effectiveness or economic impact of tests used to detect antibodies to the SARS-CoV-2 virus to inform COVID-19 diagnosis.
• We identified 25 studies reporting diagnostic accuracy or detection rates of SARS-CoV-2 antibody tests. These used a range of different assay methods to detect a range of different antibody targets. Sixteen of these studied assays that could potentially be used as a point-of-care test, but the majority did not evaluate the assay in this setting.
• The majority of studies tested people who were hospitalised and symptomatic patients, with either confirmed (RT-PCR positive) or probable (clinical diagnosis) COVID-19 (or in a few cases, healthy volunteers). One study was conducted in a community setting.
• Ten studies reported estimates of test sensitivity and 12 studies reported specificity. Sensitivity reported in the studies ranged from 18.4% to 96.1%. Specificity was more consistent across studies and ranged from 88.9% to 100%. Test results were, in most cases, validated by comparing them to the results of RT-PCR tests: as noted on page 1, a true assessment of the accuracy of RT-PCR test results is very challenging, and using these RT-PCR for validation mean the same issues apply to the results of antibody tests studied in this way.
• Ten studies reported on antibody detection over different timepoints after the symptom onset, which could potentially be used to guide appropriate timing of antibody testing. The time intervals varied across studies, but six studies reported against weekly time intervals: seropositivity ranged from 3.7% to 92.7% at ≤ 7 days, 7.7% to 94.7% between days 8 and 14, and 42.9% to 100.0% after 15 days.
• At present, key gaps exist in the available evidence on antibody tests as a method of informing COVID-19 diagnosis. There is still a limited number of studies on antibody testing outside of the hospital setting, such as those with milder symptoms or in other settings such as community or home-based testing. We also did not identify any evidence on use of the tests in specific populations, such as healthcare workers. Finally, we did not identify any evidence on the economic impact of any test, or how any test influences subsequent patient management.

Page 4 of 76 EAR025 May 2020
1. Purpose of the evidence appraisal report
This report aims to identify and summarise evidence that addresses the following questions:
1. What is the clinical effectiveness and/or economic impact of tests that detect the presence of the SARS-CoV-2 virus to inform COVID-19 diagnosis?
2. What is the clinical effectiveness and/or economic impact of tests that detect the presence of antibodies to the SARS-CoV-2 virus to inform diagnosis of COVID-19?
HTW Evidence Appraisal Reports are based on rapid systematic literature searches, with the aim of identifying the best published clinical and economic evidence on health technologies. Researchers critically appraise and summarise this evidence. The methods used to identify, assess and summarise evidence are described in Section 5.
Updated literature searches for this report will be performed regularly and any new evidence materially influencing findings will be included in an updated report. Please see Appendix 1 for the revision history of the document.
2. Introduction/Background
In December 2019, a novel coronavirus was discovered in Wuhan, China and has since spread rapidly across the world. This novel coronavirus was named SARS-CoV-2 and causes a disease called COVID-19.
Tests for COVID-19 fall into two broad groups:
1. Tests that detect the presence of the SARS-CoV-2 virus, specifically by detecting SARS-CoV-2 viral nucleic acid. In this report, we will refer to these as ‘virus tests’. Virus tests are usually performed in a specialised laboratory setting and using respiratory samples, such as a nasopharyngeal swab sample. The most common test used to detect SARS-CoV-2 viral nucleic acid is reverse-transcriptase polymerase chain reaction (RT-PCR), which amplifies viral RNA for detection. Virus tests can be used to diagnose people with who are currently infected with SARS-CoV-2.
2. Tests that detect the presence of antibodies to SARS-CoV-2; in this report, we will refer to these as ‘antibody tests’, but you may also see them called serology tests elsewhere. Antibodies are produced after SARS-CoV-2 infection as part of the body’s immune response. These tests are can be performed in as laboratory, but some tests can also be done in the clinic. They use samples of blood or serum. Examples include the enzyme-linked immunosorbent (ELISA) assay or point-of-care lateral flow immunoassay (LFIA). Antibody tests can be used to identify whether someone has been infected with SARS-CoV-2 in the past. These tests also have the potential to identify whether someone is currently infected with SARS-CoV-2, although this may be limited in early infection before the body has had time to produce antibodies.
There are various virus tests and antibody tests that can be carried out in a laboratory or at point of care in a range of settings. How long the test takes depends greatly on which test is being used and where it is performed; a test at a specialised laboratory can take up to three days, whereas point of care tests or tests performed in-clinic can take between 15 minutes to a few hours.
The purpose of this review is to identify, appraise and summarise evidence on the diagnostic performance and effectiveness of these tests. This initially involved reviewing all evidence published since the beginning of the COVID-19 outbreak. HTW are now carrying out routine

Page 5 of 76 EAR025 May 2020
surveillance for new evidence and produce frequent updates to this report as new evidence emerges.
3. Virus tests
We identified one systematic review that studied the diagnostic performance of RT-PCR in COVID-19 diagnosis (Kim et al. 2020). This review also included studies on the diagnostic performance of chest CT, but we have only included evidence on RT-PCR here. The reviewers included evidence published up to 3 April 2020; we also searched for and included relevant studies reporting diagnostic performance of RT-PCR that were published more recently (we also included some evidence from studies included in the systematic review, on outcomes that were not reported by the review authors). We identified one other systematic review that searched for evidence on potential rapid diagnostics, vaccines or therapeutics for SARS-CoV-2 published between 1 December 2019 and 6 February 2020 (Pang et al. 2020). Characteristics are outlined in Appendix 5, Table 1. Only one study was identified, which explored development of RT-PCR assays (Corman et al. 2020). However, this study reported no outcomes of interest so was excluded from this review. The review also included studies on the related previous SARS coronavirus and Middle East respiratory syndrome (MERS) coronavirus, but these studies were excluded based on our selection criteria.
We identified a further 39 sources reporting primary data on the evaluation of tests for SARS-CoV-2 virus detection. The design and characteristics of each study is summarised in Appendix 5, Table 1. Key outcomes are summarised in Table 1.
We assessed the reliability and applicability of each study’s conduct and reporting using the QUADAS-2 tool. A majority of studies were judged to be at high or unclear risk of bias regarding patient selection, either because patients were selected for the study in a way that could have introduced bias (11% of studies), or because how they were selected was not clear (56% of studies). We also judged how the index test was conducted or interpreted to be at high (14% of studies) or unclear (46% of studies) risk of bias in a majority of cases, either because aspects of how the tests were conducted were not clear, or because tests were not conducted in a uniform way in all cases. For the 13 studies that include a reference standard, we judged 46% and 8% to be at unclear or high risk of bias, respectively; again this was because not all tests in a study were compared against a uniform reference standard, or some details of the reference standard were unclear. There were few or no applicability concerns with the included studies.
All of the virus tests we identified were molecular, i.e. based on detection of amplified viral SARS-CoV-2 nucleic acid sequences. We did not identify any evidence on the effectiveness of tests that use immunological assays to directly detect SARS-CoV-2, i.e. the detection of the presence of viral antigens. The majority of tests were laboratory-based RT-PCR tests, conducted using standard in-house or commercially available PCR reagents and equipment (in some cases assay details were not reported). The RT-PCR primer used (i.e. which part of the viral RNA is targeted and amplified) varied between studies, although in some cases primer details were not reported. The method and type of sampling also varied; this is explored in more detail in section
In addition to RT-PCR, we identified five studies reporting the diagnostic performance of isothermal amplification assay (LAMP) to detect viral nucleic acids (Baek et al. 2020, Harrington et al. 2020, Lu et al. 2020, Yan et al. 2020, Zhen et al. 2020). These have the potential to be used at point-of-care or near-patient, but in the studies concerned the test were not carried out in this way: one test was laboratory-based and other studies were done retrospectively on previously collected samples.
Page 6 of 76 EAR025 May 2020
The lack of a generally accepted reference standard to compare RT-PCR results against makes it challenging to assess the true diagnostic accuracy of these tests as a method of diagnosing COVID-19. Several studies reported detection rate (proportion of test results that were positive) without reporting any validation of the results. In other studies, including those pooled by (Kim et al. 2020) the initial result of tests for virus was compared to the eventual confirmed molecular diagnosis (any patient that eventually returned a positive PCR result was treated as positive) or PCR was compared to clinical diagnosis such as chest imaging. Some studies also compared different PCR methods, or different methods of sampling. Key results are described in the following sections and in Table 1; studies are described in more detail in Table 1 of Appendix 5.
3.1. Clinical effectiveness of virus tests
3.1.1. Diagnostic accuracy
Pooled analysis of 19 studies (1,502 patients) estimated the sensitivity of an initial RT-PCR test result to be 89% (95% CI 81% to 94%), using results of repeated RT-PCR as the reference standard.
Five studies (972 patients or samples in total) reported the diagnostic accuracy of isothermal amplification assays in the diagnosis of 130 patients with suspected COVID-19, using equivalent test results from RT-PCR as a reference standard (Baek et al. 2020, Harrington et al. 2020, Lu et al. 2020, Yan et al. 2020, Zhen et al. 2020). As noted above, use of a single RT-PCR test as a reference standard may not be representative of true disease outcomes. Nevertheless, these results allow comparison of performance from different testing methods. Reported sensitivity and specificity estimates ranged from 74.7% to 100% and 87.7% to 100%. See table 1 for a detailed breakdown of results.
3.1.2. Time to diagnosis
We identified a small number of studies directly measuring the time taken to conduct a test or reach a diagnosis; these are described below. Additionally, we identified an analysis (Esbin et al. 2020) that estimated the time required to complete a wide range of different virus tests, based on published protocols and/or instructions for their use. For RT-PCR, estimates of time to complete the test ranged from 13 to 220 minutes (22 different test protocols considered). For isothermal amplification assays, time required ranged from 25 to 90 minutes.
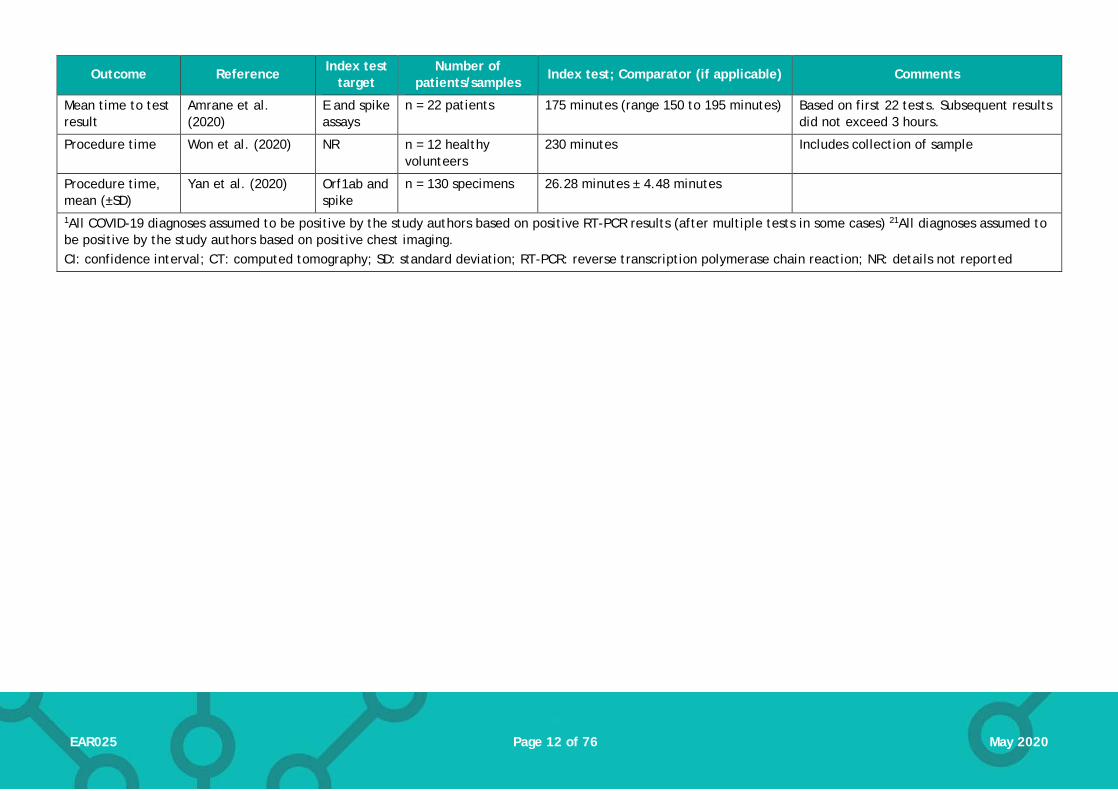
Two studies of laboratory-based RT-PCR tests for SARS-CoV-2 reported the time taken to obtain a diagnosis. One study (Amrane et al. 2020) reported a mean time to result from the time a sample arrived at the laboratory of 175 minutes (range 150 to 195 minutes). This was based solely on the first 22 tests but the authors noted that the time to obtain subsequent results did not exceed 3 hours. A second study (Won et al. 2020) reported an estimated whole procedure time (including collection of sample) of 230 minutes. In a study that used LAMP to diagnose SARS-CoV-2, mean procedure time was 26.3 minutes (Yan et al. 2020).
Comparisons to other methods of diagnosis
Three studies compared laboratory diagnosis of COVID-19 using RT-PCR to clinical diagnosis based on chest CT scan. Two of the studies included confirmed positive cases: in the study by Fang et al (2020a) the disease detection rates using RT-PCR and CT scan were 36/51 (71%) and 50/51 (98%) respectively; in the study by Long et al (2020) the disease detection rates using RT-PCR and CT scan were 30/36 (84.6%) and 35/36 (97.2%) respectively. A third study (Ai et al. 2020) included 1,014 patients with suspected COVID-19 but did not report a confirmed final diagnosis. Disease detection rates using RT-PCR and CT scan were 601/1014 (59%) and 888/1014 (88%) respectively
Comparisons of sampling sites and methods
Page 7 of 76 EAR025 May 2020
We identified 18 studies that compared RT-PCR of SARS-CoV-2 with samples from different parts of the body. We have collated these in Table 2 and Table 3. Most samples were taken by swab of the upper respiratory tract (a breakdown by individual sites in the upper respiratory tract, where reported, is given in Table 3). Other commonly studied samples were saliva, sputum and stool/rectal swab. The detection rates varied for these, and the nature of the studies makes it difficult to compare them. Detection rates were consistently low when sampling urine or tears/conjunctiva. Results from blood samples were mixed, with some studies reporting very low detection rates, whilst others reported rates that were comparable to other samples from the same population. Chan et al. (2020) also reported detection rates from different sample sites for two assays: RT-PCR RdRp/Hel assay (their developed assay and RdRp-P2 assay (standard assay used in many laboratories). RdRp/Hel had a higher rate of detection in respiratory tract samples than non-respiratory samples, with 102/120 (85%) respiratory specimens and 17/153 (11.1%) of non-respiratory specimens. This was significantly higher than the detection rate of the RdRp-P2 assay (73/120 [60.8%], p<0.001 and 4/153 [2.6%], p = 0.005, respectively).
Where reported, sample collection was carried out by healthcare professionals with the exception of one study (Keeley et al. 2020) in which healthcare workers self-swabbed the nasopharynx and oropharynx. This study only reported detection rates and no other outcomes (see Table 1 and Section 3.4 for outcomes).
Outcomes in non-hospitalised patients
The majority of evidence on tests for the presence of SARS-CoV-2 (all of the studies above) studied people with relatively severe disease and high suspicion of COVID-19 infection. This section summarises the evidence on their use in other populations. Full characteristics of each study can be found in Appendix 5, Table 1.
We identified two studies that used RT-PCR to test UK healthcare workers (a mixture of patient-facing and other roles in both studies) who had symptoms of possible COVID-19. These were conducted in March 2020, towards the beginning of the UK peak of the COVID-19 outbreak. These reported detection rates of 14% in 1,654 patients (Hunter et al. 2020) and 18% in 1,533 patients (Keeley et al. 2020). Neither included any information on validation of test results, other than information on a small percentage of retested patients (described in Table 1).
We identified three studies (Kong et al. 2020, Spellberg et al. 2020, Shen et al. 2020b) that used RT-PCR to detect SARS-CoV-2 in people with milder, influenza-like symptoms. These reported SARS-CoV-2 detection rates of 1.4% (640 patients in Wuhan, China), 5.3% (131 patients in California) and 34.7% (5,630 patients in Wuhan, China).
One study reports results from pregnant women who were routinely tested for SARS-CoV-2 on admission to hospital for delivery. Using RT-PCR, 33/215 (15.3%) tested positive; of these, 4 cases had symptoms suggestive of COVID-19 but 29 were asymptomatic at the time of testing (Sutton et al. 2020).
Other comparisons
One study (Chan et al. 2020) reported SARS-CoV-2 detection rates for RT-PCR assays using two different sets of primers. The detection rate for RT-PCR using the RdRp/Hel primer was 119/273 (43.6%). The corresponding detection rate with the RdRp-P2 primer was 77/273 (28.2%).
Page 8 of 76 EAR025 May 2020
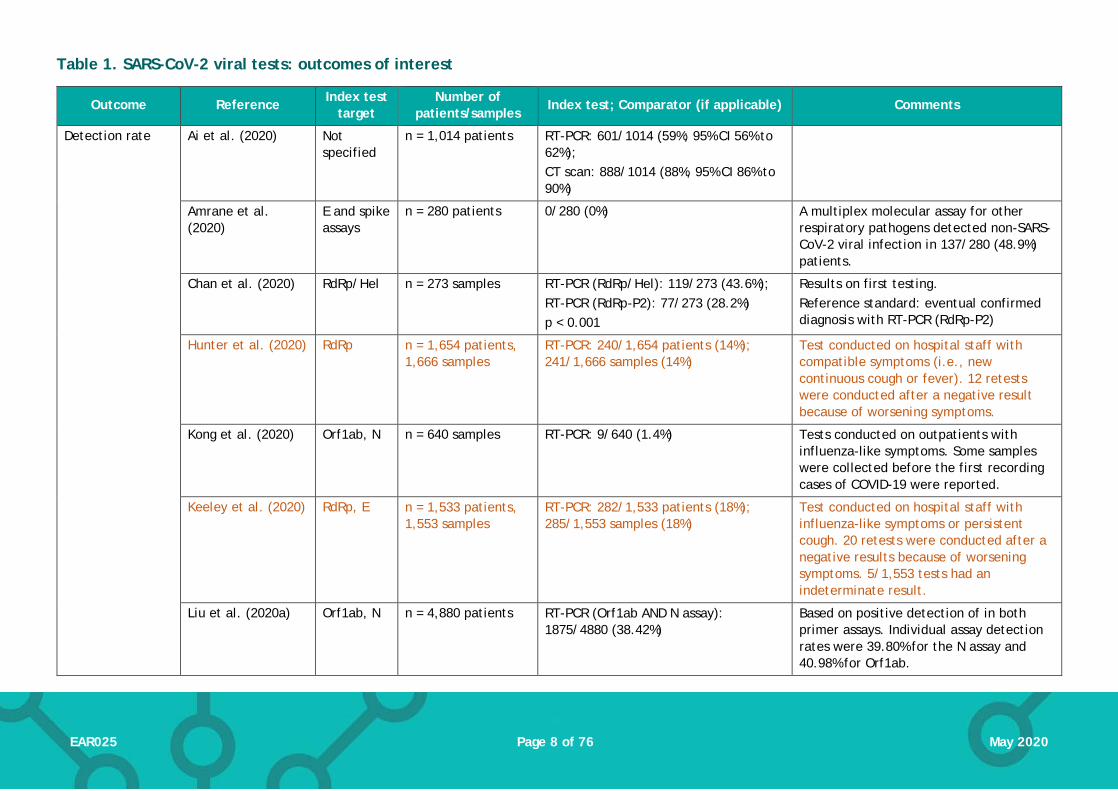
Table 1. SARS-CoV-2 viral tests: outcomes of interest
Outcome Reference Index test target
Number of patients/samples
Index test; Comparator (if applicable) Comments
Detection rate
Ai et al. (2020) Not specified
n = 1,014 patients RT-PCR: 601/1014 (59%; 95% CI 56% to 62%); CT scan: 888/1014 (88%, 95% CI 86% to 90%)
Amrane et al. (2020)
E and spike assays
n = 280 patients 0/280 (0%) A multiplex molecular assay for other respiratory pathogens detected non-SARS-CoV-2 viral infection in 137/280 (48.9%) patients.
Chan et al. (2020) RdRp/Hel n = 273 samples RT-PCR (RdRp/Hel): 119/273 (43.6%); RT-PCR (RdRp-P2): 77/273 (28.2%) p < 0.001
Results on first testing. Reference standard: eventual confirmed diagnosis with RT-PCR (RdRp-P2)
Hunter et al. (2020) RdRp n = 1,654 patients, 1,666 samples
RT-PCR: 240/1,654 patients (14%); 241/1,666 samples (14%)
Test conducted on hospital staff with compatible symptoms (i.e., new continuous cough or fever). 12 retests were conducted after a negative result because of worsening symptoms.
Kong et al. (2020) Orf1ab, N n = 640 samples RT-PCR: 9/640 (1.4%) Tests conducted on outpatients with influenza-like symptoms. Some samples were collected before the first recording cases of COVID-19 were reported.
Keeley et al. (2020) RdRp, E n = 1,533 patients, 1,553 samples
RT-PCR: 282/1,533 patients (18%); 285/1,553 samples (18%)
Test conducted on hospital staff with influenza-like symptoms or persistent cough. 20 retests were conducted after a negative results because of worsening symptoms. 5/1,553 tests had an indeterminate result.
Liu et al. (2020a) Orf1ab, N n = 4,880 patients RT-PCR (Orf1ab AND N assay): 1875/4880 (38.42%)
Based on positive detection of in both primer assays. Individual assay detection rates were 39.80% for the N assay and 40.98% for Orf1ab.

Page 9 of 76 EAR025 May 2020
Outcome Reference Index test target
Number of patients/samples
Index test; Comparator (if applicable) Comments
Spellberg et al. (2020)
NR n = 131 samples RT-PCR: 7/131 (5.3%) Tests conducted on patients presenting with mild influenza-like symptoms; no suspicion of COVID-19.
Shen et al. (2020b) Orf1ab, N n = 5,630 patients RT-PCR: 1,952/5,630 (34.7%) Tests conducted on patients suspected of COVID-19.
Sutton et al. (2020) NR n = 215 patients RT-PCR: 33/215 (15.3%) Symptomatic cases: 4/4 (100%) Asymptomatic cases: 29/211 (13.7%)
Tests conducted on all pregnant women admitted at the beginning of labour.
Wang et al. (2020a) NR n = 1,070 samples 273/1070 (25.5%) Includes samples obtained from various sites.
Ye et al. (2020) NR n = 91 patients 47/91 (51.6%)
Detection rate/Sensitivity
Fang et al. (2020a)1 NR n = 51 patients RT-PCR: 36/51 (71%, 95% CI 56% to 83%); CT scan: 50/51 (98%, 95% CI 90% to 100%) p < 0.001
Based on first RT-PCR testing. (12/51 received a positive second test; 2/51 received a positive third test; 1/51 received a positive fourth test.) Eventual positive from RT-PCR was the reference standard.
Fang et al. (2020b)1 NR n = 32 patients RT-PCR: 29/32 (90.6%) Based on first RT-PCR testing result. Eventual positive from RT-PCR was the reference standard.
Lee et al. (2020a) N, Orf1ab n= 70 patients RT-PCR: 62/70 (88.6%) Based on first RT-PCR testing result. A further 5 patients tested positive after a second test. Eventual positive from RT-PCR was the reference standard.
Long et al. (2020a)1 NR n = 36 patients RT-PCR: 30/36 (84.6%); CT scan: 35/36 (97.2%)
Based on initial RT-PCR testing. 3/36 had a positive result at second testing and the remaining 3/36 had a positive third test. (Reference standard: eventual confirmed positive RT-PCR)
He et al. (2020) NR n = 82 patients RT-PCR: 27/34 (79.4%) Based on first RT-PCR testing result.

Page 10 of 76 EAR025 May 2020
Outcome Reference Index test target
Number of patients/samples
Index test; Comparator (if applicable) Comments
Eventual positive from RT-PCR was the reference standard.
Shen et al. (2020b) Orf1ab, N n = 1,952 patients RT-PCR: 1,721/1,952 (88.2%) Based on first RT-PCR testing result. Eventual positive from RT-PCR was the reference standard.
Zhang et al. (2020c)1
Orf1ab, N n = 290 RT-PCR: 249/290 (85.9%) Based on first RT-PCR testing result. Patients testing negative were re-tested and only those who eventually tested positive were included in the results. Cumulative proportion of patients tested positive after each round of testing: 2nd test: 270/290 (93.1%) 3rd test: 283/290 (97.6%) 4th test: 287/290 (99.0%) 5th test: 289/290 (99.7%) 6th test: 290/290 (100%) Eventual positive from RT-PCR was the reference standard.
Sensitivity (pooled)
Kim et al. (2020), systematic review and meta-analysis
N/R n = 1,502; 19 studies
RT-PCR: 89% (95% CI 81%, 94%); Authors report substantial heterogeneity across the pooled studies. Reference standard was repeated RT-PCR.
Sensitivity Baek et al. (2020) N n = 154 samples RT-LAMP: 100% RT-PCR (primer NR) was the reference standard.
Harrington et al. (2020)
RdRp N = 524 patients Isothermal amplification (Abbott ID-NOW assay): 74.7% (95% CI 67.8% to 80.8%)
Reference standard was RT-PCR [Abbott RealTime SARS-CoV-2 assay performed on the Abbott m2000 system] (primer NR)
Lu et al. (2020) N N = 56 patients RT-LAMP: 94.4% (95% CI 81.3 to 99.3%) Reference standard was RT-PCR (primer NR)
Yan et al. (2020) Orf1ab and spike
n = 130 samples RT-LAMP: 100% (95% CI 92.3% to 100%) RT-PCR (primer NR) was the reference standard.
Page 11 of 76 EAR025 May 2020
Outcome Reference Index test target
Number of patients/samples
Index test; Comparator (if applicable) Comments
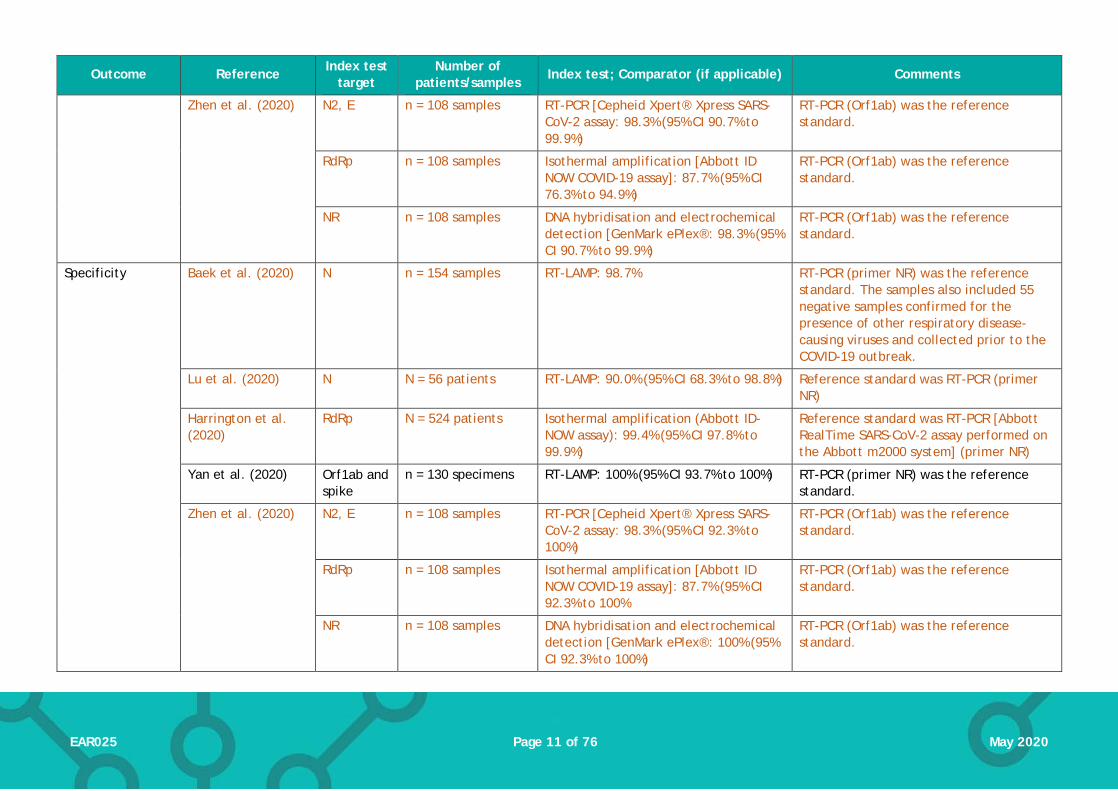
Zhen et al. (2020)
N2, E n = 108 samples RT-PCR [Cepheid Xpert® Xpress SARS-CoV-2 assay: 98.3% (95% CI 90.7% to 99.9%)
RT-PCR (Orf1ab) was the reference standard.
RdRp n = 108 samples Isothermal amplification [Abbott ID NOW COVID-19 assay]: 87.7% (95% CI 76.3% to 94.9%)
RT-PCR (Orf1ab) was the reference standard.
NR n = 108 samples DNA hybridisation and electrochemical detection [GenMark ePlex®: 98.3% (95% CI 90.7% to 99.9%)
RT-PCR (Orf1ab) was the reference standard.
Specificity Baek et al. (2020) N n = 154 samples RT-LAMP: 98.7% RT-PCR (primer NR) was the reference standard. The samples also included 55 negative samples confirmed for the presence of other respiratory disease-causing viruses and collected prior to the COVID-19 outbreak.
Lu et al. (2020) N N = 56 patients RT-LAMP: 90.0% (95% CI 68.3% to 98.8%) Reference standard was RT-PCR (primer NR)
Harrington et al. (2020)
RdRp N = 524 patients Isothermal amplification (Abbott ID-NOW assay): 99.4% (95% CI 97.8% to 99.9%)
Reference standard was RT-PCR [Abbott RealTime SARS-CoV-2 assay performed on the Abbott m2000 system] (primer NR)
Yan et al. (2020) Orf1ab and spike
n = 130 specimens RT-LAMP: 100% (95% CI 93.7% to 100%) RT-PCR (primer NR) was the reference standard.
Zhen et al. (2020) N2, E n = 108 samples RT-PCR [Cepheid Xpert® Xpress SARS-CoV-2 assay: 98.3% (95% CI 92.3% to 100%)
RT-PCR (Orf1ab) was the reference standard.
RdRp n = 108 samples Isothermal amplification [Abbott ID NOW COVID-19 assay]: 87.7% (95% CI 92.3% to 100%
RT-PCR (Orf1ab) was the reference standard.
NR n = 108 samples DNA hybridisation and electrochemical detection [GenMark ePlex®: 100% (95% CI 92.3% to 100%)
RT-PCR (Orf1ab) was the reference standard.
Page 12 of 76 EAR025 May 2020
Outcome Reference Index test target
Number of patients/samples
Index test; Comparator (if applicable) Comments
Mean time to test result
Amrane et al. (2020)
E and spike assays
n = 22 patients 175 minutes (range 150 to 195 minutes) Based on first 22 tests. Subsequent results did not exceed 3 hours.
Procedure time Won et al. (2020) NR n = 12 healthy volunteers
230 minutes Includes collection of sample
Procedure time, mean (±SD)
Yan et al. (2020) Orf1ab and spike
n = 130 specimens 26.28 minutes ± 4.48 minutes
1All COVID-19 diagnoses assumed to be positive by the study authors based on positive RT-PCR results (after multiple tests in some cases) 21All diagnoses assumed to be positive by the study authors based on positive chest imaging. CI: confidence interval; CT: computed tomography; SD: standard deviation; RT-PCR: reverse transcription polymerase chain reaction; NR: details not reported

Page 13 of 76 EAR025 May 2020
Table 2. SARS-CoV-2 virus tests: detection rates from different sample sites
Study BLF Pharyngeal1 Throat wash Lingual Saliva Sputum Plasma/blood
Urine Faeces and/or rectal swabs
Tears/ Conjunctival swab
Fibrobronchoscope brush biopsy
Azzi et al. (2020) n/a 25/25 (100%) n/a n/a 25/25 (100%) n/a n/a n/a n/a n/a n/a
Chan et al. (2020), RdRp/Hel
n/a 30/34 (88.2%) n/a n/a 59/72 (81.9%) 13/14 (92.9%) 10/87 (11.5%)
0/33 (0.0%) 7/33 (21.2%) n/a n/a
Chan et al. (2020), RdRp-P2
n/a 22/34 (64.7%) n/a n/a 38/72 (52.8%) 13/14 (92.9%) 0/87 (0.0%) 0/33 (0.0%) 4/33 (12.1%) n/a n/a
Chen et al. (2020b) n/a 42/42 (100%) n/a n/a n/a n/a n/a 0/10 (0%) 28/42 (66.7%) n/a n/a
Guo et al. (2020b) n/a 1/24 (4.2%) 7/24 (29.2%) n/a n/a n/a n/a n/a n/a n/a n/a
Fang et al. (2020b) n/a 32/32 (100%) n/a n/a 25/32 (78%)
n/a 23/32 (72%) 0/32 (0.0%) NR 5/32 (16%) n/a
Huang et al. (2020) n/a 10/16 n/a n/a n/a 16/16 (100%) 1/16 1/16 11/16 1/15 n/a
Lin et al. (2020) n/a 23/52 (44.2&) n/a n/a n/a 40/52 (76.9%) n/a n/a n/a n/a n/a
Liu et al. (2020a) 4/5 (80%) 1843/4818 (38.25%)
n/a n/a n/a 28/57 (49.12%) n/a n/a n/a n/a n/a
Wang et al. (2020a) 14/15 (93%) 131/406 (32%) n/a n/a n/a 75/104 (72%) 3/307 (1%) 0/72 (0%) 44/153 (29%) n/a 6/13 (46%)
Williams et al. (2020) n/a 39/622 (6.3%) n/a n/a 33/522 (6.3%) n/a n/a n/a n/a n/a n/a
Wu et al. (2020b) n/a n/a n/a n/a n/a n/a n/a n/a 41/74 (55%) n/a n/a
Xia et al. (2020) n/a n/a n/a n/a n/a n/a n/a n/a n/a 1/30 (3.3%) n/a
Xie et al. (2020) n/a 9/19 n/a n/a n/a n/a 0/19 0/19 8/19 n/a n/a
Ye et al. (2020) n/a 40/91 (44.0%) n/a 33/91 (36.3%) n/a n/a n/a n/a n/a n/a n/a
Zhang et al. (2020b) n/a n/a n/a n/a n/a n/a n/a n/a 5/14 (35.7%) n/a n/a
Zheng et al. (2020) n/a n/a n/a n/a 96/96 (100%)2 39/95 (41%) 1/67 (1%) 55/93 (59%) n/a n/a
RT-PCR; reverse transcriptase polymerase chain reaction; BLF: Bronchoalveolar lavage fluid; n/a: not included in study; NR: sampling included in study but outcome not reported; 1Includes nasopharyngeal swabs, nasopharyngeal aspirate, nose and throat swabs. 2Sputum samples were collected from the respiratory tract of patients with sputum, and saliva after deep cough was collected from patients without sputum
Page 14 of 76 EAR025 May 2020
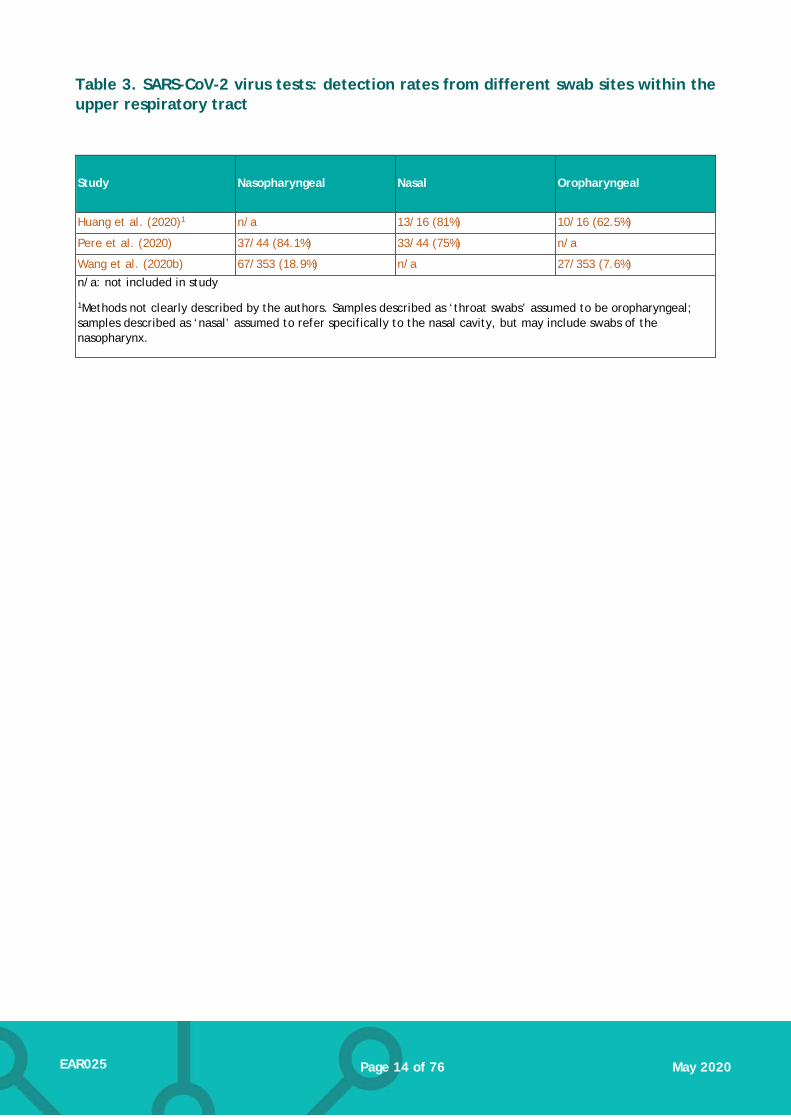
Table 3. SARS-CoV-2 virus tests: detection rates from different swab sites within the upper respiratory tract
Study Nasopharyngeal Nasal Oropharyngeal
Huang et al. (2020)1 n/a 13/16 (81%) 10/16 (62.5%)
Pere et al. (2020) 37/44 (84.1%) 33/44 (75%) n/a
Wang et al. (2020b) 67/353 (18.9%) n/a 27/353 (7.6%) n/a: not included in study
1Methods not clearly described by the authors. Samples described as ‘throat swabs’ assumed to be oropharyngeal; samples described as ‘nasal’ assumed to refer specifically to the nasal cavity, but may include swabs of the nasopharynx.
Page 15 of 76 EAR025 May 2020
4. Antibody tests
Clinical effectiveness
We identified 25 primary studies evaluating the detection of antibodies against SARS-CoV-2. Two of these were published in Chinese with English-language abstracts but have been included based on information reported in the abstracts.
We assessed the reliability and applicability of each study’s conduct and reporting using the QUADAS-2 tool. A majority of studies (87%) were judged to be at unclear risk of bias regarding patient selection, because how patients were selected for the study was not clear (56% of studies); one additional study was judged to be at high risk of bias as a result of how patients were selected. We also judged how the index test was conducted or interpreted to be at unclear risk of bias in 48% of studies, because aspects of how the tests were conducted were not clear. For the 20 studies that included a reference standard, we judged 70% and 12% to be at unclear or high risk of bias, respectively. All the studies used RT-PCR as a reference standard, and as discussed elsewhere, this may not offer a definitive diagnosis in all cases; furthermore, in some studies not all tests were compared against a uniform reference standard. There were few or no applicability concerns with the included studies.
Details of each study’s design and characteristics are summarised in Appendix 5, Table 2. The tests studied used a range of different assay methods to detect one or more antibody type (different immunoglobulin classes and/or antibody targeting). In six of the studies, tests were laboratory-based (enzyme-linked immunosorbent assay [ELISA]) and used standard reagents and equipment used to conduct antibody testing. We identified 17 studies using assays that could be suitable for point-of-care use (lateral-flow immunoassay [LFIA], chemiluminescent immunoassay [CLIA]; colloidal gold immunochromatographic assay [GICA]), but the test was not used at point-of-care, or not clearly reported to be used at point-of-care, in 14 of these studies. Of the remaining 3 studies, two (Cassanati 2020, Li 2020c) assessed lateral flow immunoassays targeting IgM/IgG (VivaChek, Jiangsu Medomics) and one study assessed an IgM/IgG test but did not specify the assay used (Dohla et al. 2020). A further two studies did not provide enough detail on the assays used to establish whether they were laboratory or point-of-care tests (Zhang et al. 2020a) Xu et al. (2020).
As with the studies on virus tests, the availability of a ‘gold standard’ reference test was limited. Where a reference standard was included, this was RT-PCR (initial and repeats until positive confirmation), except for one study that used either RT-PCR or clinical diagnosis to determine final disease status. As noted in Section 3, using RT-PCR to diagnose COVID-19 also results in a proportion of tests that are falsely negative or positive, and this should be considered when interpreting the diagnostic accuracy figures reported for antibody tests. Study outcomes are summarised in Table 3 and the following section.
4.1.1. Diagnostic accuracy
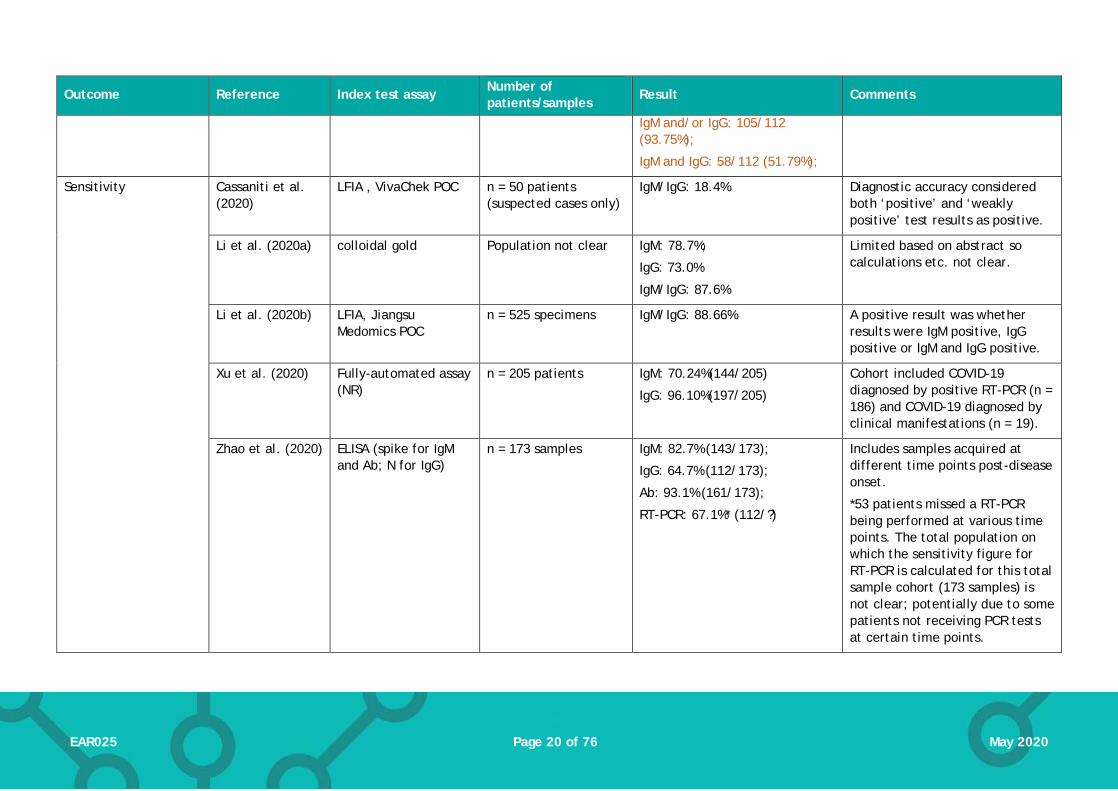
Ten studies (757 participants included; number not clear for two studies) reported sensitivity and specificity (Cassaniti et al. 2020, Dohla et al. 2020, Jin et al. 2020, Li et al. 2020a, Li et al. 2020b, Shen et al. 2020a, Spicuzza et al. 2020, Xiang et al. 2020, Xu et al. 2020, Zhao et al. 2020), or sufficient information to allow these to be calculated. As noted above, the range of different antibody types and targets used means that pooling data across studies would not be appropriate. Sensitivity reported in the studies ranged from 18.4% to 96.1%. Notably, the lowest reported sensitivity was for a point-of-care test (Cassaniti et al. 2020), although sensitivity figures below 50% were also reported for one laboratory test (Jin et al. 2020). Specificity was reported in 12

Page 16 of 76 EAR025 May 2020
studies (682 participants included; number not clear for two studies) and ranged from 88.9% to 100%.
4.1.2. Seroprevalence over time
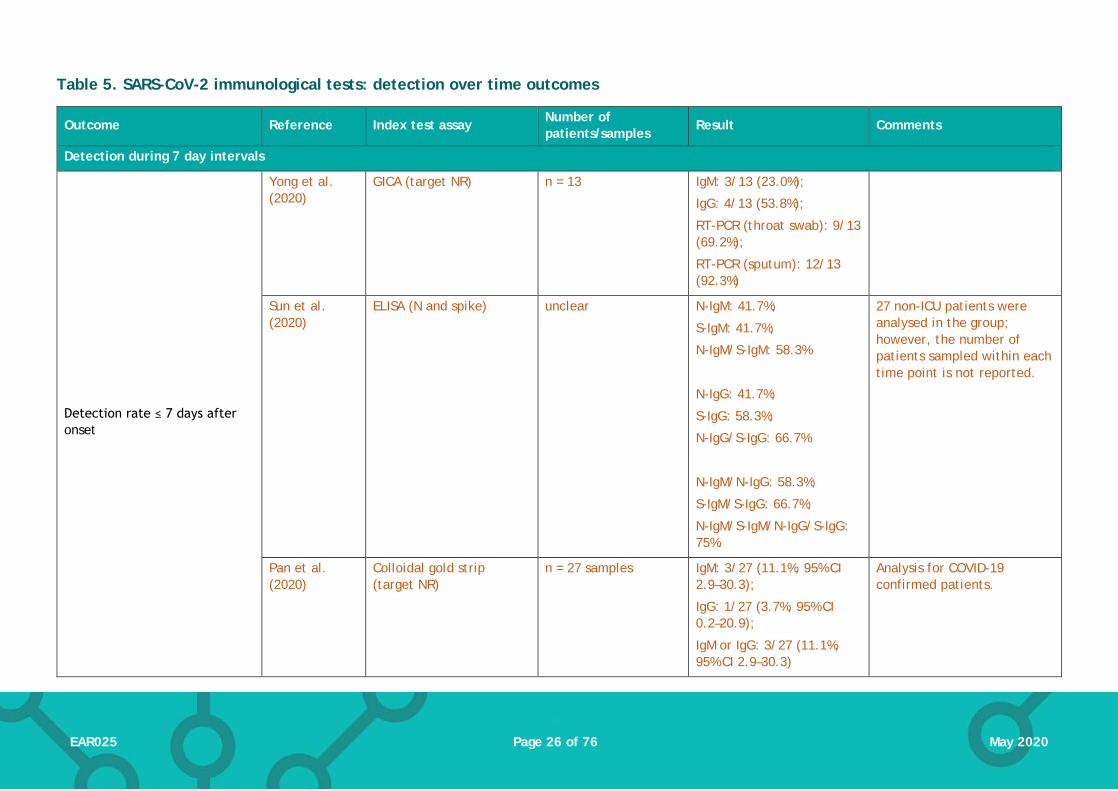
Ten studies provided data on antibody detection (seroprevalence) over time after onset of disease (Table 5). Six studies grouped tests into weekly periods (e.g. ≤ 7 days, 7 to 14 days, etc.). Within the first seven days, detection of SARS-CoV-2 antibodies ranged between 3.7% and 92.7%. Between 8-14 days, seropositivity ranged between 7.7% and 94.7%, and at 15 days or more seropositivity was between 42.9% and 100.0%. The wide ranges in detection rates may be in part due to the varied reporting of single antibody/target results (e.g. IgG positivity) or a combined result (e.g. IgM and/or IgG positivity); combined positivity results often resulted in higher detection rates. The timepoint intervals used in the other four studies varied: one study used 10 day intervals; two studies grouped the data in 5-day periods; and one study reported detection in periods of 3 days.
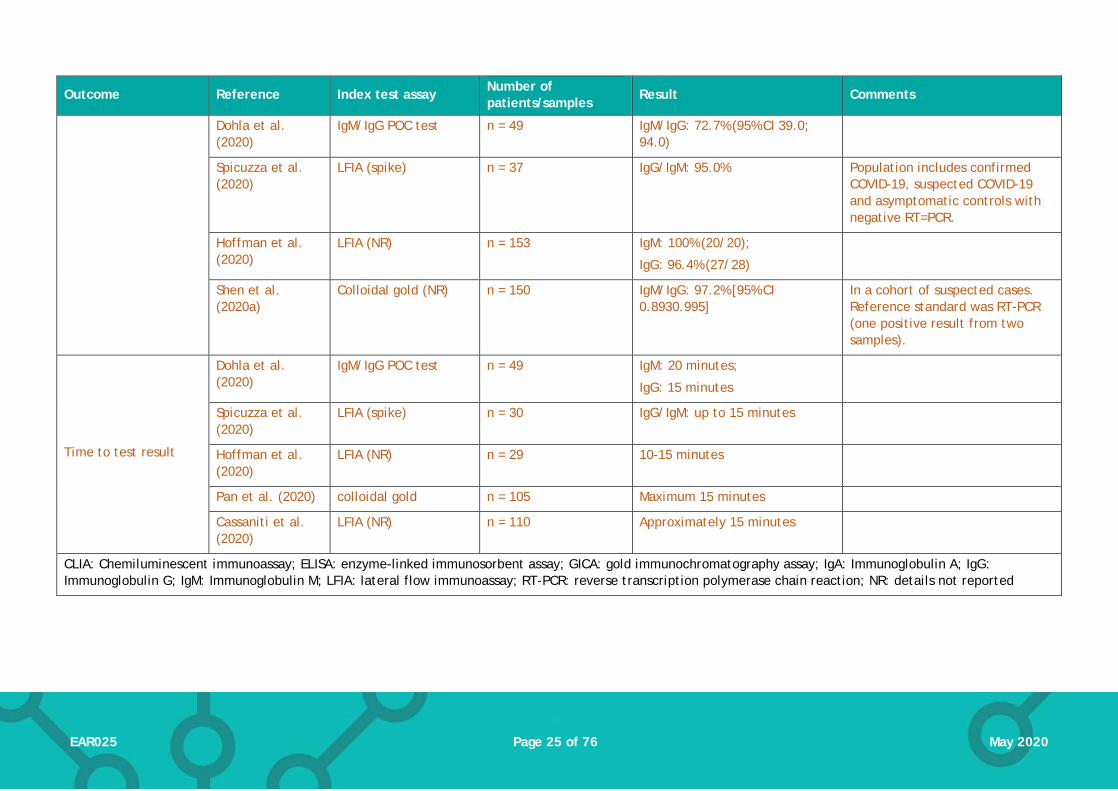
Other outcomes relating to seroprevalence over time are also reported in Table 5. Three studies reported median time to seroconversion, which ranged from 5 to 14 days. In addition, one study (Long et al. 2020b) reported the ‘peak’ detection of 94.1% for IgM antibodies at 20-22 days after disease onset, and 100% detection of IgG 17-19 days after onset.
4.1.3. Other comparisons
One study (Liu et al. 2020b) tested two different immunoassays in the same population (n = 214): one targeting antibodies for the SARS-CoV-2 N protein and one targeting the spike protein. This study only reported detection rates and did not verify test results against a reference standard. Detection rates were comparable for assays against the two targets (detection of Immunoglobulin M (IgM) and/or Immunoglobulin G (IgG): 172/214 (80.4%) for N protein assay and 176/214 (82.2%) for spike protein assay; see Table 3 for results for individual immunoglobulins).
(Li et al. 2020b) measured sensitivity and specificity in 525 samples using inactivated venous blood. However, they also compared results with fingerstick blood, venous blood and plasma in a smaller sample (seven COVID-19 patients and three healthy volunteers were recruited). Test results were consistent across the different blood samples: 3 of the 7 COVID-19 patients were IgM-only positive and 4 patients were both IgM and IgG positive; all healthy volunteers tested negative.

Page 17 of 76 EAR025 May 2020
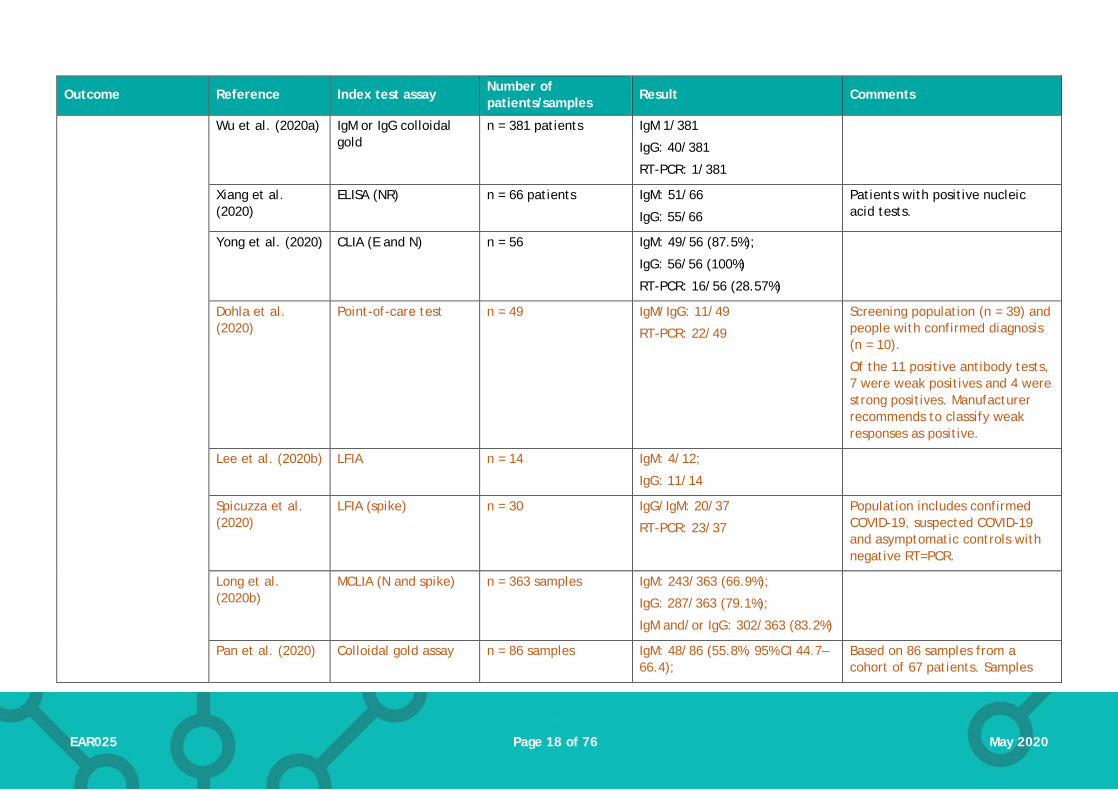
Table 4. SARS-CoV-2 immunological tests: outcomes of interest
Outcome Reference Index test assay Number of patients/samples
Result Comments
Detection rate
Cassaniti et al. (2020)
LFIA , VivaChek POC n = 110 patients Healthy volunteers 0/30 (0%);
COVID-19 patients 19/30 (63.3%);
Suspected cases 0/50 (0%)
Based on being fully positive for IgM and IgG together (weakly positive not included).
Authors considered sensitivity of the rapid LFIA to be sub-optimal based on the results with known COVID-19 patients (data not reported). Suggested reasons were low antibody titres or delayed immune response.
Gao et al. (2020) CLIA/GICA/ELISA n = 37 samples IgM CLIA: 14/37; IgM ELISA: 11/37; IgM GICA: 19/37
IgG CLIA: 19/37; IgG ELISA: 24/37 IgG GICA: 19/27
37 samples were obtained from 22 patients.
Guo et al. (2020a)
IgM, IgG or IgA ELISA n = 208 specimens IgM: 188/208 (90.4%);
IgA: 194/208 (93.3%);
IgG: 162/208 (77.9%)
Samples were obtained from acute, middle or late stages of infection.
This includes confirmed and probable cases of COVID-19.
Li et al. (2020a) IgM or IgG colloidal gold
n = 189 IgM: 113/189 (59.8%);
IgG: 100/189 (52.9%);
IgM/IgG: 125/189 (66.1%)
Population was probably cases of COVID-19 (PCR negative test but clinical manifestations).
Jin et al. (2020) CLIA (N and spike proteins)
n = 34 IgM: 19/34 (55.9%)
IgG: 32/34 (94.1%)
Detection rate of antibody tests after 2 negative PCR tests (in a 24 hour interval).
Page 18 of 76 EAR025 May 2020
Outcome Reference Index test assay Number of patients/samples
Result Comments
Wu et al. (2020a) IgM or IgG colloidal gold
n = 381 patients IgM 1/381
IgG: 40/381
RT-PCR: 1/381
Xiang et al. (2020)
ELISA (NR) n = 66 patients IgM: 51/66
IgG: 55/66
Patients with positive nucleic acid tests.
Yong et al. (2020) CLIA (E and N) n = 56 IgM: 49/56 (87.5%);
IgG: 56/56 (100%)
RT-PCR: 16/56 (28.57%)
Dohla et al. (2020)
Point-of-care test n = 49 IgM/IgG: 11/49
RT-PCR: 22/49
Screening population (n = 39) and people with confirmed diagnosis (n = 10).
Of the 11 positive antibody tests, 7 were weak positives and 4 were strong positives. Manufacturer recommends to classify weak responses as positive.
Lee et al. (2020b) LFIA n = 14 IgM: 4/12;
IgG: 11/14
Spicuzza et al. (2020)
LFIA (spike) n = 30 IgG/IgM: 20/37
RT-PCR: 23/37
Population includes confirmed COVID-19, suspected COVID-19 and asymptomatic controls with negative RT=PCR.
Long et al. (2020b)
MCLIA (N and spike) n = 363 samples IgM: 243/363 (66.9%);
IgG: 287/363 (79.1%);
IgM and/or IgG: 302/363 (83.2%)
Pan et al. (2020) Colloidal gold assay n = 86 samples IgM: 48/86 (55.8%, 95% CI 44.7–66.4);
Based on 86 samples from a cohort of 67 patients. Samples

Page 19 of 76 EAR025 May 2020
Outcome Reference Index test assay Number of patients/samples
Result Comments
IgG: 47/86 (54.7%, 95% CI 43.6–65.3);
IgM or IgG: 59/86 (68.6, 57.6–77.9)
were taken in either early (1-7 days), middle (8-14 days) and late stages (≥15 days).
Zeng et al. (2020) ELISA (target NR) n = 27 IgM/IgG: 100% All patients produced SARS-CoV-2 specific IgM and IgG during the collection period.
Detection rate/Sensitivity
Liu et al. (2020b) ELISA (target: N-protein)
n = 214 patients IgM: 146/214 (68.2);
IgG: 150/214 (70.1%);
IgM and/or IgG: 172/214 (80.4%)
Samples were acquired at different times post disease onset (median 15 days, range 0 to 55).
Liu et al. (2020b) ELISA (target: spike protein)
n = 214 patients IgM: 165/214 (77.1%);
IgG: 159/214 (74.3%)
IgM and/or IgG: 176/214 (82.2%)
Samples were acquired at different times post disease onset (median 15 days, range 0 to 55).
Yong et al. (2020) GICA (target NR) n = 38 patients IgM: 19/38 (50.0%);
IgG: 35/38 (92.1%).
Yongchen et al. (2020)
GICA (spike and N) n = 21 patients IgM/IgG: 17/21 (80.95%) The authors report detection of the IgM/IgG as one result – they do not define whether a positive result is positive for either IgM or IgG, or whether it means positive for both IgM and IgG.
Hoffman et al. (2020)
LFIA (NR) n = 29 IgM: 20/29 (69%);
IgG: 27/29 (93.1%)
Long et al. (2020b)
MCLIA (N and spike) n = 63 IgM/IgG: 61/63 (96.8%)
Zhang et al. (2020a)
assay NR (E and N) n = 112 IgM: 59/112 (52.7%);
IgG: 104/112 (92.9%);
Page 20 of 76 EAR025 May 2020
Outcome Reference Index test assay Number of patients/samples
Result Comments
IgM and/or IgG: 105/112 (93.75%);
IgM and IgG: 58/112 (51.79%);
Sensitivity Cassaniti et al. (2020)
LFIA , VivaChek POC n = 50 patients (suspected cases only)
IgM/IgG: 18.4% Diagnostic accuracy considered both ‘positive’ and ‘weakly positive’ test results as positive.
Li et al. (2020a) colloidal gold Population not clear IgM: 78.7%;
IgG: 73.0%
IgM/IgG: 87.6%
Limited based on abstract so calculations etc. not clear.
Li et al. (2020b) LFIA, Jiangsu Medomics POC
n = 525 specimens IgM/IgG: 88.66% A positive result was whether results were IgM positive, IgG positive or IgM and IgG positive.
Xu et al. (2020) Fully-automated assay (NR)
n = 205 patients IgM: 70.24%(144/205)
IgG: 96.10%(197/205)
Cohort included COVID-19 diagnosed by positive RT-PCR (n = 186) and COVID-19 diagnosed by clinical manifestations (n = 19).
Zhao et al. (2020) ELISA (spike for IgM and Ab; N for IgG)
n = 173 samples IgM: 82.7% (143/173);
IgG: 64.7% (112/173);
Ab: 93.1% (161/173);
RT-PCR: 67.1%* (112/?)
Includes samples acquired at different time points post-disease onset.
*53 patients missed a RT-PCR being performed at various time points. The total population on which the sensitivity figure for RT-PCR is calculated for this total sample cohort (173 samples) is not clear; potentially due to some patients not receiving PCR tests at certain time points.

Page 21 of 76 EAR025 May 2020
Outcome Reference Index test assay Number of patients/samples
Result Comments
Jin et al. (2020) CLIA (N and spike proteins)
n = 27 IgM: 48.1% (13/27)
IgG: 88.9% (24/27)
Sensitivity was calculated using a subgroup of the full COVID-19 cohort (n = 43); patient who had a serological test prior to getting a negative RT-PCR (reference standard).
Xiang et al. (2020)
ELISA (NR) n = 66 IgM: 77.3% (51/66)
IgG: 83.3% (55/66)
Dohla et al. (2020)
IgM/IgG POC test n = 49 IgM/IgG: 36.4% (95%CI 17.2; 59.3)
Spicuzza et al. (2020)
LFIA (spike) n = 37 IgG/IgM: 82.6% Population includes confirmed COVID-19, suspected COVID-19 and asymptomatic controls with negative RT=PCR.
Shen et al. (2020a)
Colloidal gold (NR) n = 150 IgM/IgG: 71.1% [95% CI 0.609-0.797]
In a cohort of suspected cases. Reference standard was RT-PCR (one positive result from two samples).
Specificity
Cassaniti et al. (2020)
LFIA , VivaChek POC n = 50 (suspected cases only)
IgM/IgG: 91.7% Diagnostic accuracy included both positive and weakly positive results as positive.
Li et al. (2020a) colloidal gold Population not clear IgM: 98.2%;
IgG: 99.3%;
IgM/IgG: 98.2%
Limited based on abstract so calculations etc. not clear.
Li et al. (2020b) LFIA, Jiangsu Medomics POC
n = 525 specimens IgM/IgG: 90.63%. A positive result was whether results were IgM positive, IgG positive or IgM and IgG positive.

Page 22 of 76 EAR025 May 2020
Outcome Reference Index test assay Number of patients/samples
Result Comments
Liu et al. (2020b) ELISA (spike) n = 100 healthy controls
IgM: 100% (0/100);
IgG: 100% (0/100)
IgM and/or IgG: 100% (0/100)
Xu et al. (2020) Fully-automated assay (NR)
n = 79 patients IgM: 96.20% (76/79)
IgG: 92.41%(73/79)
Based on ‘control’ cohort with other diseases (but negative for COVID-19)
Zhao et al. (2020) ELISA (spike for IgM and Ab; N for IgG)
Not clear Total Ab: 99.1% (211/213);
IgM: 98.6% (210/213);
IgA: 99.0% (195/197)
Specificity was based on a cohort of healthy individuals who were tested with the assays prior to the SARS-CoV-2 outbreak.
Jin et al. (2020) CLIA (N and spike proteins)
n = 33 IgM: 100% (33/33)
IgG: 90.9% (30/33)
Based on a ‘control’ cohort of patients with suspected COVID-19, but were discharged from hospital based on 2 negative PCR tests in a 24 hour period.
Xiang et al. (2020)
ELISA (NR) n = 60 IgM: 100% (60/60);
IgG: 95.0% (57/60)
Based on a cohort of healthy controls & patients hospitalised with other diseases.
Dohla et al. (2020)
IgM/IgG POC test n = 49 IgM/IgG: 88.9% (95% CI 70.8; 97.7)
Spicuzza et al. (2020)
LFIA (spike) n = 37 IgG/IgM 92.9% Population includes confirmed COVID-19, suspected COVID-19 and asymptomatic controls with negative RT=PCR.
Hoffman et al. (2020)
LFIA (NR) n = 124 (controls) IgM: 100% (0/124);
IgG: 99.2% (1/124)
Shen et al. (2020a)
Colloidal gold (NR) n = 150 IgM/IgG: 96.2% [95% CI 0.859-0.993]
In a cohort of suspected cases. Reference standard was RT-PCR

Page 23 of 76 EAR025 May 2020
Outcome Reference Index test assay Number of patients/samples
Result Comments
(one positive result from two samples).
NPV
Cassaniti et al. (2020)
LFIA , VivaChek POC n = 50 (suspected cases only)
IgM/IgG: 26.2%, Diagnostic accuracy included both positive and weakly positive results as positive.
Xu et al. (2020) Fully-automated assay (NR)
n = 79 IgM/IgG: 91.03% (71/78);
RT-PCR: 80.61% (79/98)
Based on ‘control’ cohort with other diseases (but negative for COVID-19).
It is not clear how the IgM/IgG calculation was derived, in terms of whether it used double positive results only (IgM and IgG) or included patients that were positive for one antibody test (IgM and/or IgG).
Jin et al. (2020) CLIA (N and spike proteins)
n = 60 IgM: 100% (13/13)
IgG: 88.9% (24/27)
Based on a control group (n = 33) and a subgroup of the COVID-19 cohort where patients had received an antibody test before testing negative on RT-PCR (n = 27).
Dohla et al. (2020)
IgM/IgG POC test n = 49 IgM/IgG: 63.2% (95% CI 46.0; 78.2)
Xiang et al. (2020)
ELISA (NR) n = 126 IgM: 80%
IgG: 83.8%
Spicuzza et al. (2020)
LFIA (spike) n = 37 IgG/IgM: 76.5% Population includes confirmed COVID-19, suspected COVID-19 and asymptomatic controls with negative RT=PCR.
Page 24 of 76 EAR025 May 2020
Outcome Reference Index test assay Number of patients/samples
Result Comments
Hoffman et al. (2020)
LFIA (NR) n = 153 IgM: 93.2% (124/133);
IgG: 98.4% (123/125)
Shen et al. (2020a)
Colloidal gold (NR) n = 150 IgM/IgG: 64.6% [95% CI 0.529-0.748
In a cohort of suspected cases. Reference standard was RT-PCR (one positive result from two samples).
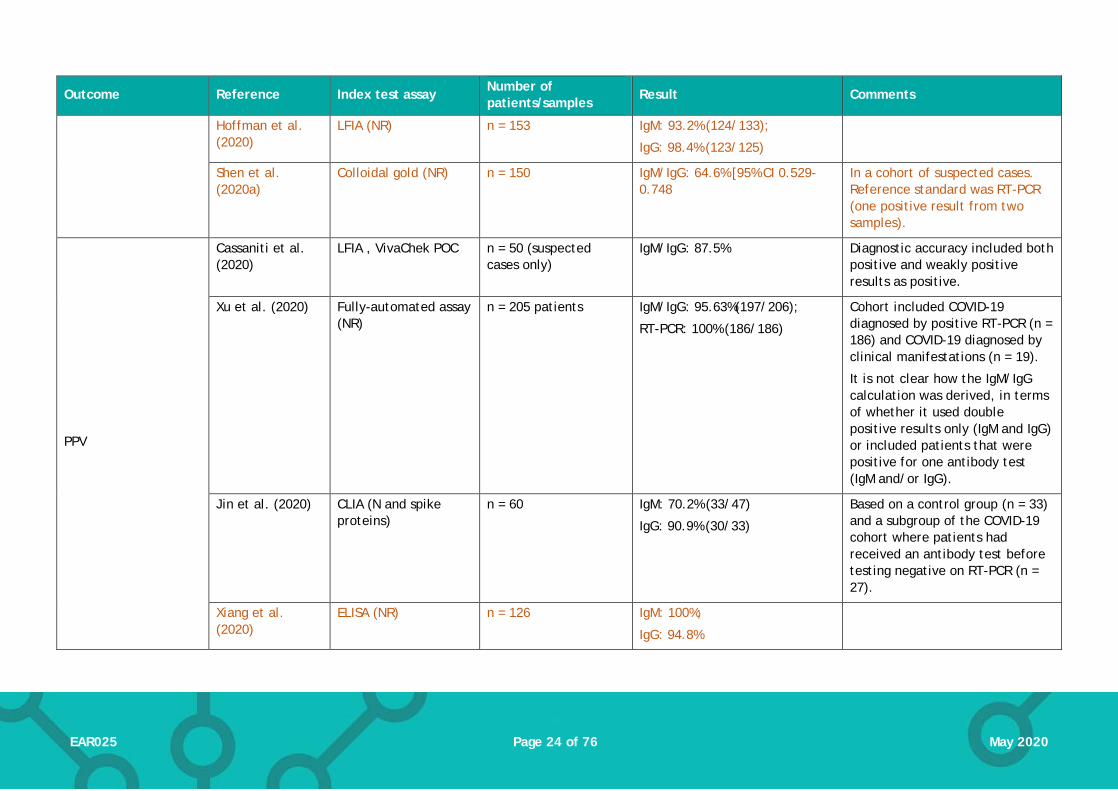
PPV
Cassaniti et al. (2020)
LFIA , VivaChek POC n = 50 (suspected cases only)
IgM/IgG: 87.5% Diagnostic accuracy included both positive and weakly positive results as positive.
Xu et al. (2020) Fully-automated assay (NR)
n = 205 patients IgM/IgG: 95.63%(197/206);
RT-PCR: 100% (186/186)
Cohort included COVID-19 diagnosed by positive RT-PCR (n = 186) and COVID-19 diagnosed by clinical manifestations (n = 19).
It is not clear how the IgM/IgG calculation was derived, in terms of whether it used double positive results only (IgM and IgG) or included patients that were positive for one antibody test (IgM and/or IgG).
Jin et al. (2020) CLIA (N and spike proteins)
n = 60 IgM: 70.2% (33/47)
IgG: 90.9% (30/33)
Based on a control group (n = 33) and a subgroup of the COVID-19 cohort where patients had received an antibody test before testing negative on RT-PCR (n = 27).
Xiang et al. (2020)
ELISA (NR) n = 126 IgM: 100%;
IgG: 94.8%
Page 25 of 76 EAR025 May 2020
Outcome Reference Index test assay Number of patients/samples
Result Comments
Dohla et al. (2020)
IgM/IgG POC test n = 49 IgM/IgG: 72.7% (95% CI 39.0; 94.0)
Spicuzza et al. (2020)
LFIA (spike) n = 37 IgG/IgM: 95.0% Population includes confirmed COVID-19, suspected COVID-19 and asymptomatic controls with negative RT=PCR.
Hoffman et al. (2020)
LFIA (NR) n = 153 IgM: 100% (20/20);
IgG: 96.4% (27/28)
Shen et al. (2020a)
Colloidal gold (NR) n = 150 IgM/IgG: 97.2% [95% CI 0.8930.995]
In a cohort of suspected cases. Reference standard was RT-PCR (one positive result from two samples).
Time to test result
Dohla et al. (2020)
IgM/IgG POC test n = 49 IgM: 20 minutes;
IgG: 15 minutes
Spicuzza et al. (2020)
LFIA (spike) n = 30 IgG/IgM: up to 15 minutes
Hoffman et al. (2020)
LFIA (NR) n = 29 10-15 minutes
Pan et al. (2020) colloidal gold n = 105 Maximum 15 minutes
Cassaniti et al. (2020)
LFIA (NR) n = 110 Approximately 15 minutes
CLIA: Chemiluminescent immunoassay; ELISA: enzyme-linked immunosorbent assay; GICA: gold immunochromatography assay; IgA: Immunoglobulin A; IgG: Immunoglobulin G; IgM: Immunoglobulin M; LFIA: lateral flow immunoassay; RT-PCR: reverse transcription polymerase chain reaction; NR: details not reported
Page 26 of 76 EAR025 May 2020
Table 5. SARS-CoV-2 immunological tests: detection over time outcomes
Outcome Reference Index test assay Number of patients/samples
Result Comments
Detection during 7 day intervals
Detection rate ≤ 7 days after onset
Yong et al. (2020)
GICA (target NR) n = 13 IgM: 3/13 (23.0%);
IgG: 4/13 (53.8%);
RT-PCR (throat swab): 9/13 (69.2%);
RT-PCR (sputum): 12/13 (92.3%)
Sun et al. (2020)
ELISA (N and spike) unclear N-IgM: 41.7%;
S-IgM: 41.7%;
N-IgM/S-IgM: 58.3%
N-IgG: 41.7%;
S-IgG: 58.3%;
N-IgG/S-IgG: 66.7%
N-IgM/N-IgG: 58.3%;
S-IgM/S-IgG: 66.7%;
N-IgM/S-IgM/N-IgG/S-IgG: 75%.
27 non-ICU patients were analysed in the group; however, the number of patients sampled within each time point is not reported.
Pan et al. (2020)
Colloidal gold strip (target NR)
n = 27 samples IgM: 3/27 (11.1%, 95% CI 2.9–30.3);
IgG: 1/27 (3.7%, 95% CI 0.2–20.9);
IgM or IgG: 3/27 (11.1%, 95% CI 2.9–30.3)
Analysis for COVID-19 confirmed patients.
Page 27 of 76 EAR025 May 2020
Outcome Reference Index test assay Number of patients/samples
Result Comments
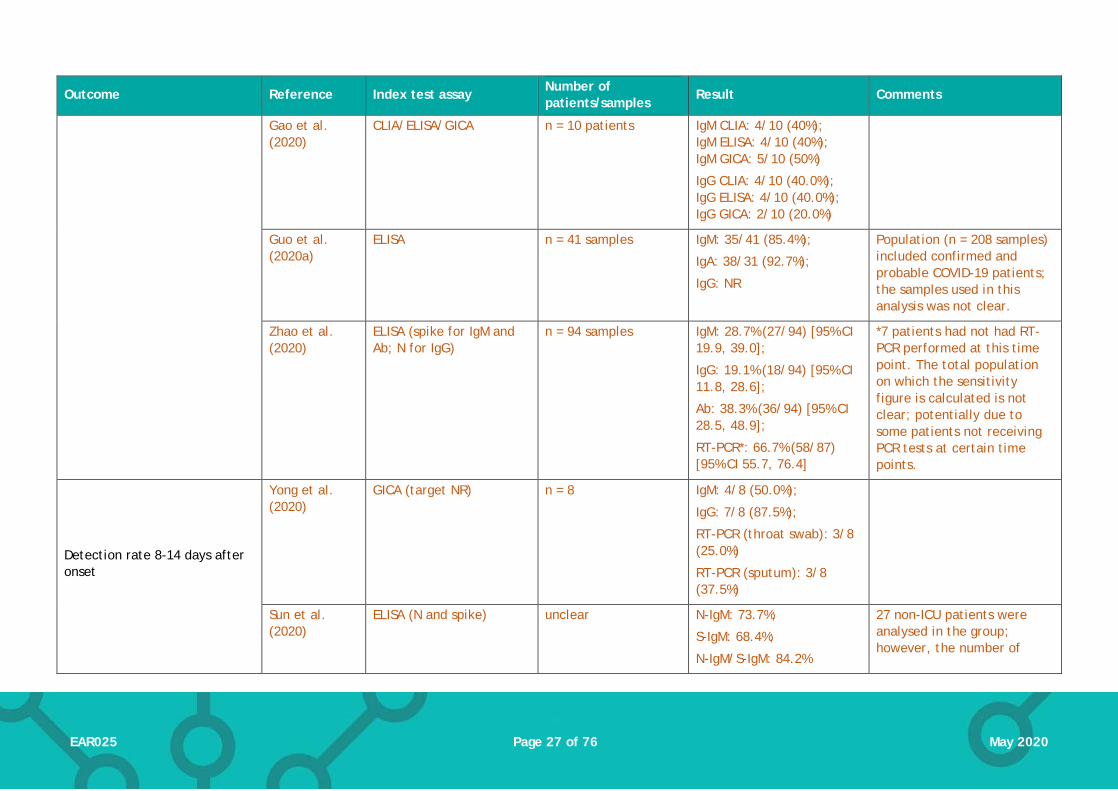
Gao et al. (2020)
CLIA/ELISA/GICA n = 10 patients IgM CLIA: 4/10 (40%); IgM ELISA: 4/10 (40%); IgM GICA: 5/10 (50%)
IgG CLIA: 4/10 (40.0%); IgG ELISA: 4/10 (40.0%); IgG GICA: 2/10 (20.0%)
Guo et al. (2020a)
ELISA n = 41 samples IgM: 35/41 (85.4%);
IgA: 38/31 (92.7%);
IgG: NR
Population (n = 208 samples) included confirmed and probable COVID-19 patients; the samples used in this analysis was not clear.
Zhao et al. (2020)
ELISA (spike for IgM and Ab; N for IgG)
n = 94 samples IgM: 28.7% (27/94) [95% CI 19.9, 39.0];
IgG: 19.1% (18/94) [95% CI 11.8, 28.6];
Ab: 38.3% (36/94) [95% CI 28.5, 48.9];
RT-PCR*: 66.7% (58/87) [95% CI 55.7, 76.4]
*7 patients had not had RT-PCR performed at this time point. The total population on which the sensitivity figure is calculated is not clear; potentially due to some patients not receiving PCR tests at certain time points.
Detection rate 8-14 days after onset
Yong et al. (2020)
GICA (target NR) n = 8 IgM: 4/8 (50.0%);
IgG: 7/8 (87.5%);
RT-PCR (throat swab): 3/8 (25.0%)
RT-PCR (sputum): 3/8 (37.5%)
Sun et al. (2020)
ELISA (N and spike) unclear N-IgM: 73.7%;
S-IgM: 68.4%;
N-IgM/S-IgM: 84.2%
27 non-ICU patients were analysed in the group; however, the number of

Page 28 of 76 EAR025 May 2020
Outcome Reference Index test assay Number of patients/samples
Result Comments
N-IgG: 84.2%;
S-IgG: 78.9%;
N-IgG/S-IgG: 94.7%
N-IgM/N-IgG: 94.7%;
S-IgM/S-IgG: 89.5%;
N-IgM/S-IgM/N-IgG/S-IgG: 94.7%.
patients sampled within each time point is not reported.
Pan et al. (2020)
Colloidal gold strip (target NR)
n = 28 samples IgM: 22/28 (78.6%, 95% CI 58.5–91.0);
IgG: 16/28 (57.1%, 95% CI 37.4–75.0)
IgM or IgG: 26/28 (92.9%, 95% CI 75.0–98.8)
Population was not clearly defined (hospitalised patients).
Gao et al. (2020)
CLIA/ELISA/GICA n = 13 patients IgM CLIA: 4/13 (30.8%); IgM ELISA: 1/13 (7.7%); IgM GICA: 5/13 (38.5%)
IgG CLIA: 6/13 (46.2%); IgG ELISA: 8/13 (61.5%); IgG GICA: 6/13 (46.2%)
Zhao et al. (2020)
ELISA (spike for IgM and Ab; N for IgG)
n = 135 samples IgM: 73.3% (99/135) [95% CI 65.0, 80.6];
IgG: 54.1% (73/135) [95% CI 45.3, 62.7]
Ab: 89.6% (121/135) [95% CI 83.2, 94.2];
*11 patients had not had RT-PCR performed at this time point.

Page 29 of 76 EAR025 May 2020
Outcome Reference Index test assay Number of patients/samples
Result Comments
RT-PCR*: 54.0% (67/124) [95% CI 44.8, 63.0]
Detection rate ≥15 days after onset
Yong et al. (2020)
GICA (target NR) n = 23 IgM: 12/23 (52.2%);
IgG: 21/23 (91.3%);
RT-PCR (throat swab): 3/23 (13.0%);
RT-PCR (sputum): 14/23 (60.8%)
Sun et al. (2020)
ELISA (N and spike) unclear N-IgM: 73.7%;
S-IgM: 73.7;
N-IgM/S-IgM: 89.5%
N-IgG: 100.0%;
S-IgG: 100.0%;
N-IgG/S-IgG: 100.0%
N-IgM/N-IgG: 100.0%;
S-IgM/S-IgG: 100.0%;
N-IgM/S-IgM/N-IgG/S-IgG: 100.0%.
27 non-ICU patients were analysed in the group; however, the number of patients sampled within each time point is not reported.
Pan et al. (2020)
Colloidal gold strip (target NR)
n = 31 samples IgM: 23/31 (74.2%, 95% CI 55.1–87.5)
IgG: 23/31 (74.2%, 95% CI 55.1–87.5)
IgM or IgG: 30/31 (96.8%, 95% CI 81.5–99.8)
Population was not clearly defined (hospitalised patients).
Page 30 of 76 EAR025 May 2020
Outcome Reference Index test assay Number of patients/samples
Result Comments
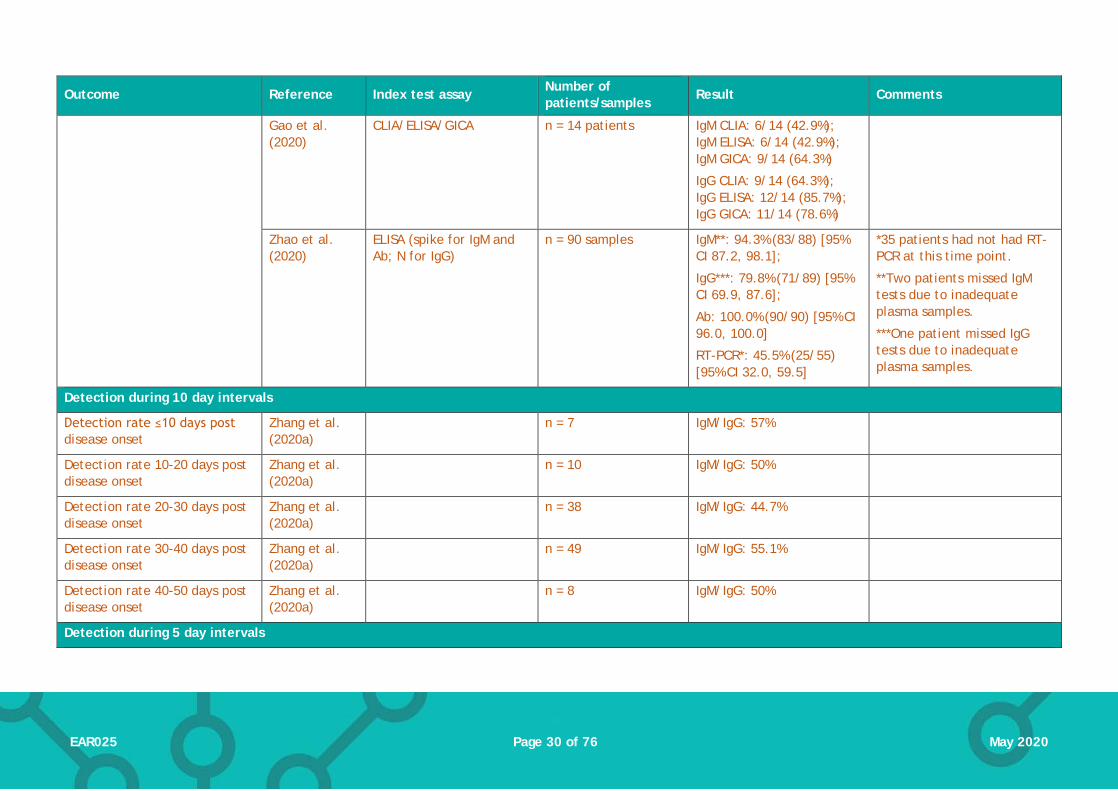
Gao et al. (2020)
CLIA/ELISA/GICA n = 14 patients IgM CLIA: 6/14 (42.9%); IgM ELISA: 6/14 (42.9%); IgM GICA: 9/14 (64.3%)
IgG CLIA: 9/14 (64.3%); IgG ELISA: 12/14 (85.7%); IgG GICA: 11/14 (78.6%)
Zhao et al. (2020)
ELISA (spike for IgM and Ab; N for IgG)
n = 90 samples IgM**: 94.3% (83/88) [95% CI 87.2, 98.1];
IgG***: 79.8% (71/89) [95% CI 69.9, 87.6];
Ab: 100.0% (90/90) [95% CI 96.0, 100.0]
RT-PCR*: 45.5% (25/55) [95% CI 32.0, 59.5]
*35 patients had not had RT-PCR at this time point.
**Two patients missed IgM tests due to inadequate plasma samples.
***One patient missed IgG tests due to inadequate plasma samples.
Detection during 10 day intervals
Detection rate ≤10 days post disease onset
Zhang et al. (2020a)
n = 7 IgM/IgG: 57%
Detection rate 10-20 days post disease onset
Zhang et al. (2020a)
n = 10 IgM/IgG: 50%
Detection rate 20-30 days post disease onset
Zhang et al. (2020a)
n = 38 IgM/IgG: 44.7%
Detection rate 30-40 days post disease onset
Zhang et al. (2020a)
n = 49 IgM/IgG: 55.1%
Detection rate 40-50 days post disease onset
Zhang et al. (2020a)
n = 8 IgM/IgG: 50%
Detection during 5 day intervals

Page 31 of 76 EAR025 May 2020
Outcome Reference Index test assay Number of patients/samples
Result Comments
Detection rate ≤5 days post disease onset
Lippi et al. (2020)
CLIA (N and spike);
Eurimmuno ELISA (NR)
n = 30 CLIA: IgM: 1/30 (3.3%); IgG: 3/30 (10%) ELISA: IgA: 1/30 (3.3%); IgG: 0/30 (0%)
Rates in 48 patient subgroup in whom the date of symptom onset was available.
Liu et al. (2020b)
ELISA (N and spike [S]) n = 22 samples N-IgM: 7 (31.8%) S-IgM: 8(36.4)
N-IgG: 7(31.8) S-IgG: 9(40.9)
N-IgM/N-IgG: 9(40.9); S-IgM/S-IgG: 10(45.5)
Detection rate 6-10 days post disease onset
Lippi et al. (2020)
MAGLUMI (N and spike);
Eurimmuno ELISA (NR)
n = 13 CLIA: IgM: 2/13 (15.4%); IgG: 7/13 (53.8%) ELISA: IgA: 4/13 (30.8%); IgG: 2/13 (15.4%)
Rates in 48 patient subgroup in whom the date of symptom onset was available.
Liu et al. (2020b)
ELISA (N and spike [S]) n = 38 samples N-IgM: 20(52.6) S-IgM: 19(50.0)
N-IgG: 15(39.5) S-IgG: 19(50.0)
N-IgM/N-IgG: 20(52.6) S-IgM/S-IgG: 23(60.5)
Detection 11-21 days post disease onset
Lippi et al. (2020)
MAGLUMI (N and spike);
Eurimmuno ELISA (NR)
n = 5 CLIA: IgM: 3/5 (60%); IgG: 5/5 (100%)
Rates in 48 patient subgroup in whom the date of symptom onset was available.

Page 32 of 76 EAR025 May 2020
Outcome Reference Index test assay Number of patients/samples
Result Comments
ELISA: IgA: 5/5 (100%); IgG: 5/5 (100%)
Detection 11-15 days post disease onset
Liu et al. (2020b)
ELISA (N and spike [S]) n = 54 samples N-IgM: 39(72.2) S-IgM: 45(83.3)
N-IgG: 39(72.2) S-IgG: 41(75.9)
N-IgM/N-IgG: 48(88.9) S-IgM/S-IgG: 49(90.7)
Detection 16-20 days post disease onset
Liu et al. (2020b)
ELISA (N and spike [S]) n = 55 samples N-IgM: 45(81.8) S-IgM: 53(96.4)
N-IgG: 48(87.3); S-IgG: 51(92.7)
N-IgM/N-IgG: 52(94.5); S-IgM/S-IgG: 53(96.4)
Detection 21-30 days post disease onset
Liu et al. (2020b)
ELISA (N and spike [S]) n = 32 samples N-IgM: 26(81.3); S-IgM: 28(87.5)
N-IgG: 28(87.5); S-IgG: 27(84.4)
N-IgM/N-IgG: 30(93.8); S-IgM/S-IgG: 28(87.5)
Authors do not explain why this interval is 10 days (compared to the rest of the intervals at 5 days)
Detection 31-35 days post disease onset
Liu et al. (2020b)
ELISA (N and spike [S]) n = 6 samples N-IgM: 5(83.3) S-IgM: 6(100.0)
N-IgG: 6(100.0); S-IgG: 5(83.3)
N-IgM/N-IgG: 6(100.0); S-IgM/S-IgG: 6(100.0)

Page 33 of 76 EAR025 May 2020
Outcome Reference Index test assay Number of patients/samples
Result Comments
Detection >35 days post disease onset
Liu et al. (2020b)
ELISA (N and spike [S]) n = 7 samples N-IgM: 4(57.1) S-IgM: 6(85.7)
N-IgG: 7(100.0); S-IgG: 7(100.0)
N-IgM/N-IgG: 7(100.0); S-IgM/S-IgG: 7(100.0)
Detection during 3 day intervals
Detection 2-4 days post disease onset
Long et al. (2020b)
MCLIA (N and spike) n = 22 IgM: 3/22;
IgG: 7/22;
IgM/IgG: 7/22
Detection 5-7 days post disease onset
Long et al. (2020b)
MCLIA (N and spike) n = 45 IgM: 18/45;
IgG: 25/45;
IgM/IgG: 47/45
Detection 8-10 days post disease onset
Long et al. (2020b)
MCLIA (N and spike) n = 70 IgM: 37/70;
IgG: 48/70;
IgM/IgG: 53/70
Detection 11-13 days post disease onset
Long et al. (2020b)
MCLIA (N and spike) n = 79 IgM: 60/79;
IgG: 67/79;
IgM/IgG: 71/79
Detection 14-16 days post disease onset
Long et al. (2020b)
MCLIA (N and spike) n = 70 IgM: 55/70;
IgG: 63/70;
IgM/IgG: 67/70
Detection 17-19 days post disease onset
Long et al. (2020b)
MCLIA (N and spike) n = 47 IgM: 42/47;
IgG: 47/47;
IgM/IgG: 47/47

Page 34 of 76 EAR025 May 2020
Outcome Reference Index test assay Number of patients/samples
Result Comments
Detection 20-22 days post disease onset
Long et al. (2020b)
MCLIA (N and spike) n = 17 IgM: 16/17;
IgG: 17/17;
IgM/IgG: 17/17
Detection 11-13 days post disease onset
Long et al. (2020b)
MCLIA (N and spike) n = 13 IgM: 12/13;
IgG: 13/13;
IgM/IgG: 13/13
Other outcomes
Median time to seroconversion (post symptom onset)
Long et al. (2020b)
MCLIA (N and spike) n = 26 IgM and IgG: 13 days Outcome was reported for a small subgroup of patients who were initially seronegative and had sequential serological tests.
Shen et al. (2020a)
Colloidal gold (NR) n = 97 IgM/IgG: 9 days (IQR 5-14.5 days)
Based on the patients with diagnosed COVID-19 (positive PCR test)
Guo et al. (2020a)
ELISA n = 208 IgM: 5 days (IQR 3 to 6 days)
IgA: 5 days (IQR 3 to 6 days)
IgG: 14 days (IQR 10 to 18 days)
Peak detection of antibodies Long et al. (2020b)
MCLIA (N and spike) n = 363 samples IgM: 94.1% at 20-22 days after onset;
IgG: 100% detection at 17-19 days after onset

Page 35 of 76 EAR025 May 2020
5. Conclusions
This is the second version of a living evidence review on the effectiveness of tests to inform COVID-19 diagnosis. We intend to carry out ongoing surveillance of the evidence, and this report will be updated frequently as new evidence emerges.
We searched for and appraised all available evidence on the effectiveness of tests for the presence of the SARS-CoV-2 virus, or antibodies to the virus, up to 4 May 2020. As of this date, we identified 42 published studies reporting on the effectiveness of tests for the presence of virus, and 25 studies testing for presence of antibodies. Where applicable, we assessed the quality of these studies using the QUADAS-2 framework and identified risks of bias with the majority, most commonly due to unclear methods of patient selection/test conduct, or use of a reference standard that may not definitively diagnose COVID-19. In some cases, evidence was reported as correspondence or short communications (exemplifying the rapid pace of research on COVID-19) which limited the reporting of detail on how some tests were conducted. Two studies were also available only in Chinese, with an English abstract: these included sufficient outcome data to be included here, but again this limits the details available about these studies.
The majority of evidence is from China, although more published evidence from Europe and the USA is also emerging as the outbreak spreads. This version of the report includes data from the UK healthcare setting for the first time. The majority of studies report on virus or antibody test use in the hospital setting, in symptomatic patients with confirmed or suspected COVID-19 infection. Data on testing in other settings is comparatively limited: three studies (Kong et al. 2020, Spellberg et al. 2020, Shen et al. 2020b) used RT-PCR to detect SARS-CoV-2 in the general population in cases with milder, influenza-like symptoms, and a further two (Hunter et al. 2020, Keeley et al. 2020) tested UK healthcare workers. However, all these studies only reported SARS-CoV-2 detection rates and not any other outcomes. Only one study (Dohla et al. 2020) was found that used antibody tests outside of a hospital setting.
Some of the evidence on virus tests studies attempted to validate detection rates, (i.e. assess the proportion of positive tests that could be considered true positive, and the proportion that were false negative). However, the lack of a generally accepted reference standard to compare reverse transcription PCR (RT-PCR) results against makes it challenging to assess the true diagnostic accuracy of these tests as method of diagnosing COVID-19. False negative results can be attributed to a range of causes, including laboratory error, sampling error, or lack of/negligible presence of virus in the tissue sampled at the time of sampling. False positive results are less likely but also possible, due to, for example detection of viral genome in cases that do not result in infection. Pooled analysis of 19 studies (1,502 patients) estimated the sensitivity of an initial RT-PCR test result to be 89% (95% CI 81% to 94%), using results of repeated RT-PCR as the reference standard (Kim et al. 2020). Use of this reference standard, which only validates the presence of disease and not its absence, means specificity cannot be determined. Furthermore, the evidence included in this pooled analysis and other individual studies we identified used a range of target primers, methods and type of sampling. Evidence we have identified here indicates that the type of sample obtained, the part of the body sampled, and the timing of test relative to symptom onset could influence test results and accuracy.
Of the 25 studies assessing antibody tests, 10 reported diagnostic accuracy in terms of both sensitivity and specificity (Cassaniti et al. 2020, Jin et al. 2020, Dohla et al. 2020, Li et al. 2020a, Li et al. 2020b, Shen et al. 2020a, Spicuzza et al. 2020, Xiang et al. 2020, Xu et al. 2020, Zhao et al. 2020). Where a reference standard was included, this was RT-PCR (initial and repeat tests), except for one study that used either RT-PCR or clinical diagnosis to determine final disease status. As noted above, using RT-PCR to diagnose COVID-19 results in a proportion of tests that are falsely negative or positive. Although this limitation is somewhat justifiable due to the emergent

Page 36 of 76 EAR025 May 2020
circumstances of the SARS-CoV-2 pandemic, it should still be taken into account when interpreting the diagnostic accuracy figures reported for antibody tests. With this caveat, sensitivity reported in the studies ranged from 18.4% to 96.1%. Specificity was more consistent across studies and ranged from 88.9% to 100%.
To conclude, more data is required on the effectiveness of tests to detect the presence of SARS-CoV-2 virus, and antibodies to SARS-CoV-2, to inform their use in COVID-19 diagnosis and management. For both types of tests, there is a particular lack of evidence on point-of-care tests (and how these compare to laboratory tests), and the use of tests outside of hospital settings and/or in mild/asymptomatic cases: we have identified some data on many of these themes for the first time in this version of the report, but more is needed to draw any definitive conclusions about how tests perform in different settings and populations. Some of the evidence identified suggests that for virus tests, the type of sample obtained, and the part of the body sampled could influence test accuracy, whilst for both virus and antibody tests, the timing of test relative to symptom onset is likely to be influential.

Page 37 of 76 EAR025 May 2020
6. Evidence search methods
We searched for evidence that could be used to answer the following review questions:
1. What is the clinical effectiveness and/or economic impact of tests that detect the presenceof the SARS-CoV-2 virus to inform COVID-19 diagnosis?
2. What is the clinical effectiveness and/or economic impact of tests that detect the presenceof antibodies to the SARS-CoV-2 virus to inform COVID-19 diagnosis?
Searching and screening for both questions was undertaken based on one search strategy, but the results for each question were reported separately. Initial scoping-level evidence searches were conducted using the following databases, set up to aggregate COVID-19-specific evidence:
• WHO Global research on coronavirus disease (COVID-19) database• COVID-19: a living systematic map of the evidence, produced by The NIHR Policy Research
Programme Reviews Facility • LitCovid, Diagnostic set
Based on the results of these, we developed a specific search strategy to capture published evidence on SARS-CoV-2 diagnostics. A copy of this search strategy is available on request. We also hand-searched the sources included in the HTW COVID-19 Evidence Digest for relevant evidence, and contacted key stakeholders in Wales for any published or unpublished data of relevance to this review.
The criteria used to select evidence for the appraisal are outlined in Appendix 2. We followed the recommendations made in the Interim Guidance from the Cochrane Rapid Reviews Methods Group with regards to study selection, data extraction and evidence synthesis. Appendix 3 summarises the selection of articles for inclusion in the review. We used the QUADAS-2 tool to assess risk of bias and applicability of each included article (a copy of QUADAS-2 assessments for each study is available on request).
7. Contributors
This topic was proposed by Welsh Government to assist with their response to the COVID-19 outbreak.
The HTW staff involved in writing this report were:
• D Jarrom: preparation of scope, screening of evidence, quality assessment of studies,author of virus testing sections, data verification
• L Elston: screening of evidence, extraction of data from relevant studies, qualityassessment of studies, author of antibody testing sections
• J Washington: preparation and running of search strategies• K Cann: internal quality assurance• M Prettyjohns: preparation of scope, identification of external reviewers, health
economics oversight• P Groves: review of draft report, identification of external reviewers• S McAllister: project management of report production, coordination of external review• S Myles: project oversight, review of draft report, identification of external reviewers
This report was prepared with input invited from a range of Welsh stakeholders including representatives from Welsh Government and Public Health Wales. Specific experts who reviewed and commented on drafts of this report were:

Page 38 of 76 EAR025 May 2020
• A Freedman, Reader and Honorary Consultant in Infectious Diseases, Cardiff University School of Medicine/Cardiff and Vale University Health Board
• C Fegan, R&D Director, Cardiff and Vale University Health Board• K Macpherson, Scottish Health Technologies Group• E Campbell, Scottish Health Technologies Group• I Weeks, Dean of Clinical Innovation, Cardiff and Vale University Health Board• M Kroese, Consultant in Public Health Medicine; Director, PHG Foundation, University of
Cambridge; Chair, NICE Diagnostics Advisory Committee• S Jolles, Consultant Clinical Immunologist, Cardiff and Vale University Health Board
Page 39 of 76 EAR025 May 2020
8. References
Ai T, Yang Z, Hou H, et al. (2020). Correlation of chest CT and RT-PCR testing in coronavirus disease 2019 (COVID-19) in China: a report of 1014 cases. Radiology. doi: https://doi.org/10.1148/radiol.2020200642
Amrane S, Tissot-Dupont H, Doudier B, et al. (2020). Rapid viral diagnosis and ambulatory management of suspected COVID-19 cases presenting at the infectious diseases referral hospital in Marseille, France, - January 31st to March 1st, 2020: A respiratory virus snapshot. Travel Med Infect Dis. [Article in Press]. doi: https://doi.org/10.1016/j.tmaid.2020.101632
Azzi L, Carcano G, Gianfagna F, et al. (2020). Saliva is a reliable tool to detect SARS-CoV-2. Journal of Infection. [Article in Press]. doi: https://dx.doi.org/10.1016/j.jinf.2020.04.005
Baek YH, Um J, Antigua KJC, et al. (2020). Development of a reverse transcription-loop-mediated isothermal amplification as a rapid early-detection method for novel SARS-CoV-2. Emerging microbes & infections. 1-31. doi: https://dx.doi.org/10.1080/22221751.2020.1756698
Cassaniti I, Novazzi F, Giardina F, et al. (2020). Performance of VivaDiagTM COVID-19 IgM/IgG Rapid Test is inadequate for diagnosis of COVID-19 in acute patients referring to emergency room department. Journal of Medical Virology. 1-4. doi: https://doi.org/10.1002/jmv.25800
Chan JF-W, Yip CC-Y, To KK-W, et al. (2020). Improved molecular diagnosis of COVID-19 by the novel, highly sensitive and specific COVID-19-RdRp/Hel real-time reverse transcription-polymerase chain reaction assay validated <em>in vitro</em> and with clinical specimens. Journal of Clinical Microbiology. 8(5): e00310-20. doi: https://doi.org/10.1128/jcm.00310-20
Chen C, Gao G, Xu Y, et al. (2020a). SARS-CoV-2-Positive sputum and feces after conversion of pharyngeal samples in patients with COVID-19. Ann Intern Med. doi: https://doi.org/10.7326/M20-0991
Chen Y, Chen L, Deng Q, et al. (2020b). The presence of SARS-CoV-2 RNA in feces of COVID-19 patients. Journal of Medical Virology. doi: https://dx.doi.org/10.1002/jmv.25825
Corman VM, Landt O, Kaiser M, et al. (2020). Detection of 2019 novel coronavirus (2019-nCoV) by real-time RT-PCR. Euro Surveill. 25(3). doi: https://dx.doi.org/10.2807/1560-7917.ES.2020.25.3.2000045
Dohla M, Boesecke C, Schulte B, et al. (2020). Rapid point-of-care testing for SARS-CoV-2 in a community screening setting shows low sensitivity. Public Health. 182: 170-2. doi: http://dx.doi.org/10.1016/j.puhe.2020.04.009
Esbin MN, Whitney ON, Chong S, et al. (2020). Overcoming the bottleneck to widespread testing: a rapid review of nucleic acid testing approaches for COVID-19 detection. RNA. doi: https://dx.doi.org/10.1261/rna.076232.120
Fang Y, Zhang H, Xie J, et al. (2020a). Sensitivity of chest CT for COVID-19: comparison to RT-PCR. Radiology. doi: https://doi.org/10.1148/radiol.2020200432
Fang Z, Zhang Y, Hang C, et al. (2020b). Comparisons of nucleic acid conversion time of SARS-CoV-2 of different samples in ICU and non-ICU patients. Journal of Infection. [Article in Press]. doi: https://doi.org/10.1016/j.jinf.2020.03.013
Gao H-X, Li Y-N, Xu Z-G, et al. (2020). Detection of serum immunoglobulin M and immunoglobulin G antibodies in 2019-novel coronavirus infected cases from different stages. Chinese medical journal. [Article in Press]. doi: https://doi.org/10.1097/CM9.0000000000000820
Page 40 of 76 EAR025 May 2020
Guo L, Ren L, Yang S, et al. (2020a). Profiling early humoral response to diagnose novel Coronavirus Disease (COVID-19). Clin Infect Dis. [Article in Press]. doi: https://doi.org/10.1093/cid/ciaa310
Guo W-L, Jiang Q, Ye F, et al. (2020b). Effect of throat washings on detection of 2019 novel coronavirus. Clin Infect Dis. [Article in Press]. doi: https://doi.org/10.1093/cid/ciaa416
Harrington A, Cox B, Snowdon J, et al. (2020). Comparison of Abbott ID Now and Abbott m2000 methods for the detection of SARS-CoV-2 from nasopharyngeal and nasal swabs from symptomatic patients. Journal of Clinical Microbiology. [Article in Press]. doi: https://dx.doi.org/10.1128/JCM.00798-20
He J-L, Luo L, Luo Z-D, et al. (2020). Diagnostic performance between CT and initial real-time RT-PCR for clinically suspected 2019 coronavirus disease (COVID-19) patients outside Wuhan, China. Respiratory Medicine. 168. doi: https://doi.org/10.1016/j.rmed.2020.105980
Hoffman T, Nissen K, Krambrich J, et al. (2020). Evaluation of a COVID-19 IgM and IgG rapid test; an efficient tool for assessment of past exposure to SARS-CoV-2. Infection Ecology and Epidemiology. 10: 1754538. doi: http://dx.doi.org/10.1080/20008686.2020.1754538
Huang Y, Chen S, Yang Z, et al. (2020). SARS-CoV-2 viral load in clinical samples of critically ill patients. Am J Respir Crit Care Med. [Article in Press]. doi: https://doi.org/10.1164/rccm.202003-0572LE
Hunter E, Price DA, Murphy E, et al. (2020). First experience of COVID-19 screening of health-care workers in England. The Lancet. 395: e77-8. doi: https://doi.org/10.1016/S0140-6736(20)30970-3
Jin Y, Wang M, Zuo Z, et al. (2020). Diagnostic value and dynamic variance of serum antibody in coronavirus disease 2019. International Journal of Infectious Diseases. 94: 49-52. doi: https://dx.doi.org/10.1016/j.ijid.2020.03.065
Keeley AJ, Evans C, Colton H, et al. (2020). Roll-out of SARS-CoV-2 testing for healthcare workers at a large NHS Foundation Trust in the United Kingdom, March 2020. Eurosurveillance. 25(14): 2000433. doi: https://doi.org/10.2807/1560-7917.ES.2020.25.14.2000433
Kim H, Hong H, Yoon SH. (2020). Diagnostic performance of CT and reverse transcriptase-polymerase chain reaction for Coronavirus Disease 2019: a meta-analysis. Radiology. [Article in Press]: 201343. doi: https://doi.org/10.1148/radiol.2020201343
Kong W-H, Li Y, Peng M-W, et al. (2020). SARS-CoV-2 detection in patients with influenza-like illness. Nat Microbiol. doi: https://doi.org/10.1038/s41564-020-0713-1
Lee TH, Lin RJ, Lin RTP, et al. (2020a). Testing for SARS-CoV-2: can we stop at two? Clin Infect Dis. [Article in Press]: ciaa459. doi: https://doi.org/10.1093/cid/ciaa459
Lee Y-L, Liao C-H, Liu P-Y, et al. (2020b). Dynamics of anti-SARS-Cov-2 IgM and IgG antibodies among COVID-19 patients. J Infect. [Article in Press]. doi: https://doi.org/10.1016/j.jinf.2020.04.019
Li H, Li Y, Zhang Z, et al. (2020a). Establishment and clinical performance evaluation of 2019 novel coronavirus antibody colloidal gold detection method. Chinese Journal of Infectious Diseases. 38: E017-E.

Page 41 of 76 EAR025 May 2020
Li Z, Yi Y, Luo X, et al. (2020b). Development and clinical application of a rapid IgM-IgG combined antibody test for SARS-CoV-2 infection diagnosis. Journal of Medical Virology. doi: https://doi.org/10.1002/jmv.25727
Lin C, Xiang J, Yan M, et al. (2020). Comparison of throat swabs and sputum specimens for viral nucleic acid detection in 52 cases of novel coronavirus (SARS-Cov-2)-infected pneumonia (COVID-19). Clin Chem Lab Med. [Article in Press]. doi: https://doi.org/10.1515/cclm-2020-0187
Lippi G, Salvagno GL, Pegoraro M, et al. (2020). Assessment of immune response to SARS-CoV-2 with fully automated MAGLUMI 2019-nCoV IgG and IgM chemiluminescence immunoassays. Clin Chem Lab Med. [Article in Press]. doi: https://doi.org/10.1515/cclm-2020-0473
Liu R, Han H, Liu F, et al. (2020a). Positive rate of RT-PCR detection of SARS-CoV-2 infection in 4880 cases from one hospital in Wuhan, China, from Jan to Feb 2020. Clinica Chimica Acta. 505: 172-5. doi: https://doi.org/10.1016/j.cca.2020.03.009
Liu W, Liu L, Kou G, et al. (2020b). Evaluation of Nucleocapsid and Spike Protein-based ELISAs for detecting antibodies against SARS-CoV-2. Journal of Clinical Microbiology. [Article in Press]. doi: https://doi.org/10.1128/jcm.00461-20
Long C, Xu H, Shen Q, et al. (2020a). Diagnosis of the Coronavirus disease (COVID-19): rRT-PCR or CT? European Journal of Radiology. 126: 108961. doi: https://doi.org/10.1016/j.ejrad.2020.108961
Long Q-X, Liu B-Z, Deng H-J, et al. (2020b). Antibody responses to SARS-CoV-2 in patients with COVID-19. Nat Med. doi: https://doi.org/10.1038/s41591-020-0897-1
Lu R, Wu X, Wan Z, et al. (2020). A Novel Reverse Transcription Loop-Mediated Isothermal Amplification Method for Rapid Detection of SARS-CoV-2. International Journal of Molecular Sciences. 21(8): 2826. doi: https://dx.doi.org/10.3390/ijms21082826
Pan Y, Li X, Yang G, et al. (2020). Serological immunochromatographic approach in diagnosis with SARS-CoV-2 infected COVID-19 patients. J Infect. [Article in Press]. doi: https://doi.org/10.1016/j.jinf.2020.03.051
Pang J, Wang MX, Ang IYH, et al. (2020). Potential rapid diagnostics, vaccine and therapeutics for 2019 novel Coronavirus (2019-nCoV): a systematic review. J Clin Med. 9(3): 623. doi: https://doi.org/10.3390/jcm9030623
Pere H, Podglajen I, Wack M, et al. (2020). Nasal swab sampling for SARS-CoV-2: a convenient alternative in time of nasopharyngeal swab shortage. J Clin Microbiol. [Article in Press]. doi: https://doi.org/10.1128/JCM.00721-20
Shen B, Zheng Y, Zhang X, et al. (2020a). Clinical evaluation of a rapid colloidal gold immunochromatography assay for SARS-Cov-2 IgM/IgG. American Journal Of Translational Research. 12(4): 1348-54.
Shen N, Zhu Y, Wang X, et al. (2020b). Characteristics and diagnosis rate of 5,630 subjects receiving SARS-CoV-2 nucleic acid tests from Wuhan, China. JCI Insight. [Article in Press]. doi: https://doi.org/10.1172/jci.insight.137662
Spellberg B, Haddix M, Lee R, et al. (2020). Community prevalence of SARS-CoV-2 among patients with influenzalike illnesses presenting to a Los Angeles Medical Center in March 2020. JAMA. doi: https://doi.org/10.1001/jama.2020.4958
Page 42 of 76 EAR025 May 2020
Spicuzza L, Montineri A, Manuele R, et al. (2020). Reliability and usefulness of a rapid IgM-IgG antibody test for the diagnosis of SARS-CoV-2 infection: a preliminary report. J Infect. [Article in Press]. doi: https://doi.org/10.1016/j.jinf.2020.04.022
Sun B, Feng Y, Mo X, et al. (2020). Kinetics of SARS-CoV-2 specific IgM and IgG responses in COVID-19 patients. Emerg Microbes Infect. 9(1): 940-8. doi: https://doi.org/10.1080/22221751.2020.1762515
Sutton D, Fuchs K, D’Alton M, et al. (2020). Universal screening for SARS-CoV-2 in women admitted for delivery. New England Journal of Medicine. doi: https://doi.org/10.1056/NEJMc2009316
Wang W, Xu Y, Gao R, et al. (2020a). Detection of SARS-CoV-2 in different types of clinical specimens. JAMA. 323(18): 1843-44. doi: https://doi.org/10.1001/jama.2020.3786
Wang X, Tan L, Wang X, et al. (2020b). Comparison of nasopharyngeal and oropharyngeal swabs for SARS-CoV-2 detection in 353 patients received tests with both specimens simultaneously. International Journal of Infectious Diseases. 94: 107-9. doi: https://dx.doi.org/10.1016/j.ijid.2020.04.023
Williams E, Bond K, Zhang B, et al. (2020). Saliva as a non-invasive specimen for detection of SARS-CoV-2. J Clin Microbiol. [Article in Press]. doi: https://doi.org/10.1128/JCM.00776-20
Won J, Lee S, Park M, et al. (2020). Development of a laboratory-safe and low-cost detection protocol for SARS-CoV-2 of the Coronavirus Disease 2019 (COVID-19). Experimental Neurobiology. 29(2): 107-19. doi: https://doi.org/10.5607/en20009
Wu X, Fu B, Chen L, et al. (2020a). Serological tests facilitate identification of asymptomatic SARS-CoV-2 infection in Wuhan, China. Journal of Medical Virology. [Article in Press]. doi: https://dx.doi.org/10.1002/jmv.25904
Wu Y, Guo C, Tang L, et al. (2020b). Prolonged presence of SARS-CoV-2 viral RNA in faecal samples. The Lancet Gastroenterology & Hepatology. doi: https://doi.org/10.1016/S2468-1253(20)30083-2
Xia J, Tong J, Liu M, et al. (2020). Evaluation of coronavirus in tears and conjunctival secretions of patients with SARS-CoV-2 infection. J Med Virol. doi: https://doi.org/10.1002/jmv.25725
Xiang F, Wang X, He X, et al. (2020). Antibody Detection and Dynamic Characteristics in Patients with COVID-19. Clin Infect Dis. doi: 10.1093/cid/ciaa461
Xie C, Jiang L, Huang G, et al. (2020). Comparison of different samples for 2019 novel coronavirus detection by nucleic acid amplification tests. Int J Infect Dis. doi: https://doi.org/10.1016/j.ijid.2020.02.050
Xu W, Li J, He X, et al. (2020). The diagnostic value of joint detection of serum IgM and IgG antibodies to 2019-nCoV in 2019-nCoV infection. Chinese Journal of Laboratory Medicine. 43(0): E012-E.
Yan C, Cui J, Huang L, et al. (2020). Rapid and visual detection of 2019 novel coronavirus (SARS-CoV-2) by a reverse transcription loop-mediated isothermal amplification assay. Clinical Microbiology & Infection. [Article in Press]. doi: https://dx.doi.org/10.1016/j.cmi.2020.04.001
Ye G, Li Y, Lu M, et al. (2020). Experience of different upper respiratory tract sampling strategies for detection of COVID-19. Journal of Hospital Infection. 105: 1-2. doi: https://doi.org/10.1016/j.jhin.2020.03.012

Page 43 of 76 EAR025 May 2020
Yong G, Yi Y, Tuantuan L, et al. (2020). Evaluation of the auxiliary diagnostic value of antibody assays for the detection of novel coronavirus (SARS-CoV-2). Journal of Medical Virology. [Article in Press]. doi: https://dx.doi.org/10.1002/jmv.25919
Yongchen Z, Shen H, Wang X, et al. (2020). Different longitudinal patterns of nucleic acid and serology testing results based on disease severity of COVID-19 patients. Emerging microbes & infections. 9(1): 833-6. doi: https://dx.doi.org/10.1080/22221751.2020.1756699
Zeng Z, Chen L, Pan Y, et al. (2020). Re: Profile of Specific Antibodies to SARS-CoV-2: The First Report. J Infect. [Article in Press]. doi: https://doi.org/10.1016/j.jinf.2020.03.052
Zhang G, Nie S, Zhang Z, et al. (2020a). Longitudinal change of SARS-Cov2 antibodies in patients with COVID-19. J Infect Dis. [Article in Press]: jiaa229. doi: https://doi.org/10.1093/infdis/jiaa229
Zhang J, Wang S, Xue Y. (2020b). Fecal specimen diagnosis 2019 novel coronavirus–infected pneumonia. Journal of Medical Virology. 92: 680-82. doi: https://doi.org/10.1002/jmv.25742
Zhang JJ, Cao YY, Dong X, et al. (2020c). Distinct characteristics of COVID-19 patients with initial rRT-PCR positive and negative results for SARS-CoV-2. Allergy. doi: https://dx.doi.org/10.1111/all.14316
Zhao J, Yuan Q, Wang H, et al. (2020). Antibody responses to SARS-CoV-2 in patients of novel coronavirus disease 2019. Clin Infect Dis. ciaa344. doi: https://doi.org/10.1093/cid/ciaa344
Zhen W, Smith E, Manji R, et al. (2020). Clinical evaluation of three sample-to-answer platforms for the detection of SARS-CoV-2. J Clin Microbiol. [Article in Press]. doi: https://doi.org/10.1128/JCM.00783-20
Zheng S, Fan J, Yu F, et al. (2020). Viral load dynamics and disease severity in patients infected with SARS-CoV-2 in Zhejiang province, China, January-March 2020: retrospective cohort study. BMJ. 369: m1443. doi: https://dx.doi.org/10.1136/bmj.m1443

Page 44 of 76 EAR025 May 2020
Appendix 1. Document revision history
Date of revision Reasons for changes
23 April 2020 Original version, incorporating all evidence up to 14 April 2020
14 May 2020 All evidence up to 4 May 2020 incorporated. Formal quality assessment of studies carried out and summarised. More detailed analysis of influence of sample timing and sampling method on test results conducted. Minor protocol amendment made to explicitly exclude case reports/small case series.

Page 45 of 76 EAR025 May 2020
Appendix 2. List of abbreviations
Abbreviation Definition
CLIA Chemiluminescent immunoassay
COVID-19 Coronavirus disease 2019
CT Computed tomography
ELISA Enzyme-linked immunosorbent assay
GICA Gold immunochromatography assay
HTW Health Technology Wales
ICU Intensive care unit
IgA Immunoglobulin A
IgG Immunoglobulin G
IgM Immunoglobulin M
IQR Inter-quartile range
LAMP Loop-mediated isothermal amplification assay
LFIA Lateral flow immunoassay
MERS Middle East respiratory syndrome
NPV Negative predictive value
NR Not reported
PCR Polymerase chain reaction
PPV Positive predictive value
RNA Ribonucleic acid
RT-PCR Reverse transcription polymerase chain reaction
SARS Severe acute respiratory syndrome
SARS-CoV-2 Severe acute respiratory syndrome coronavirus 2
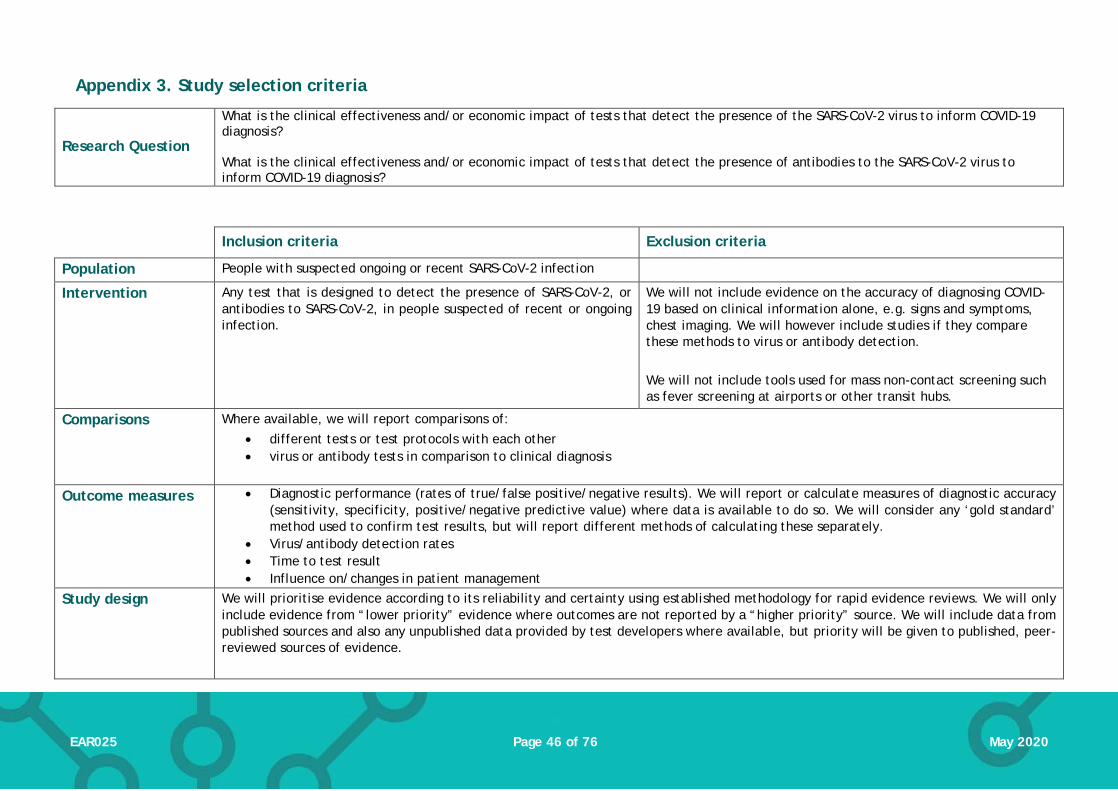
Page 46 of 76 EAR025 May 2020
Appendix 3. Study selection criteria
Research Question
What is the clinical effectiveness and/or economic impact of tests that detect the presence of the SARS-CoV-2 virus to inform COVID-19 diagnosis? What is the clinical effectiveness and/or economic impact of tests that detect the presence of antibodies to the SARS-CoV-2 virus to inform COVID-19 diagnosis?
Inclusion criteria Exclusion criteria
Population People with suspected ongoing or recent SARS-CoV-2 infection
Intervention Any test that is designed to detect the presence of SARS-CoV-2, or antibodies to SARS-CoV-2, in people suspected of recent or ongoing infection.
We will not include evidence on the accuracy of diagnosing COVID-19 based on clinical information alone, e.g. signs and symptoms, chest imaging. We will however include studies if they compare these methods to virus or antibody detection. We will not include tools used for mass non-contact screening such as fever screening at airports or other transit hubs.
Comparisons Where available, we will report comparisons of: • different tests or test protocols with each other • virus or antibody tests in comparison to clinical diagnosis
Outcome measures • Diagnostic performance (rates of true/false positive/negative results). We will report or calculate measures of diagnostic accuracy (sensitivity, specificity, positive/negative predictive value) where data is available to do so. We will consider any ‘gold standard’ method used to confirm test results, but will report different methods of calculating these separately.
• Virus/antibody detection rates • Time to test result • Influence on/changes in patient management
Study design We will prioritise evidence according to its reliability and certainty using established methodology for rapid evidence reviews. We will only include evidence from “lower priority” evidence where outcomes are not reported by a “higher priority” source. We will include data from published sources and also any unpublished data provided by test developers where available, but priority will be given to published, peer-reviewed sources of evidence.
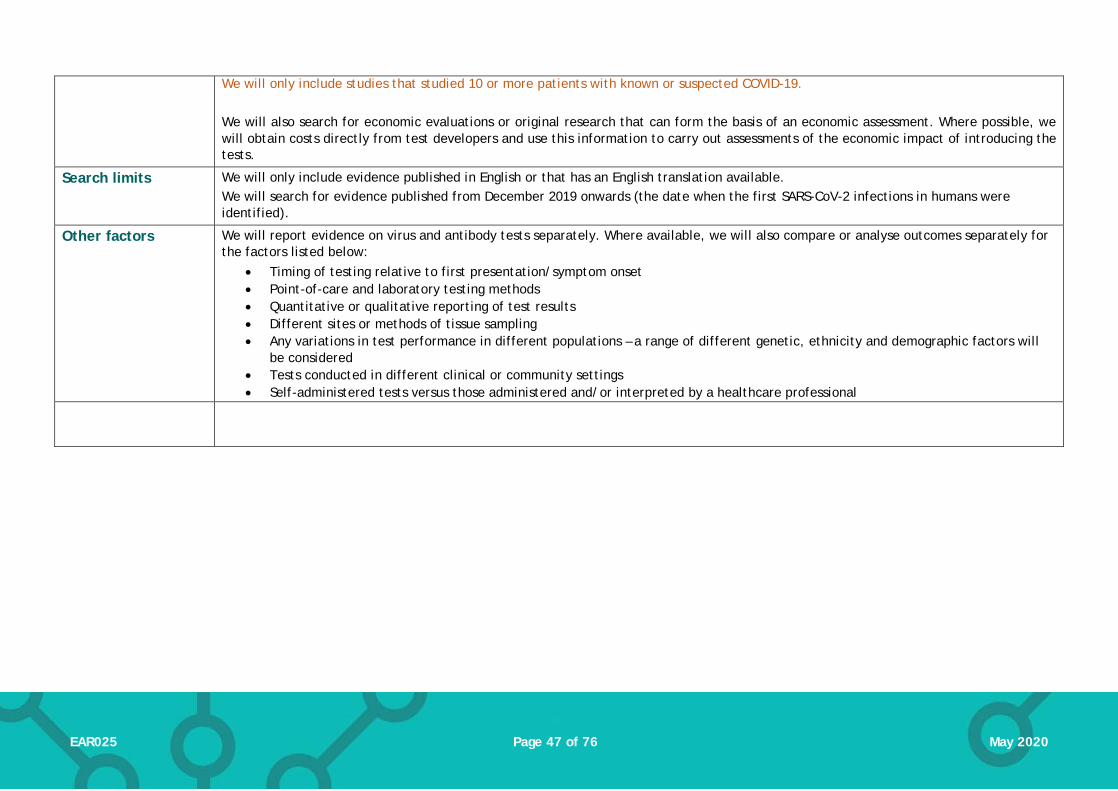
Page 47 of 76 EAR025 May 2020
We will only include studies that studied 10 or more patients with known or suspected COVID-19. We will also search for economic evaluations or original research that can form the basis of an economic assessment. Where possible, we will obtain costs directly from test developers and use this information to carry out assessments of the economic impact of introducing the tests.
Search limits We will only include evidence published in English or that has an English translation available. We will search for evidence published from December 2019 onwards (the date when the first SARS-CoV-2 infections in humans were identified).
Other factors We will report evidence on virus and antibody tests separately. Where available, we will also compare or analyse outcomes separately for the factors listed below:
• Timing of testing relative to first presentation/symptom onset • Point-of-care and laboratory testing methods • Quantitative or qualitative reporting of test results • Different sites or methods of tissue sampling • Any variations in test performance in different populations – a range of different genetic, ethnicity and demographic factors will
be considered • Tests conducted in different clinical or community settings • Self-administered tests versus those administered and/or interpreted by a healthcare professional

Page 48 of 76 EAR025 May 2020
Appendix 4. PRISMA flow diagram outlining selection of evidence (4 May update)
Records identified through database searching
(n = 20,891)
Scre
enin
gIn
clud
ed
Elig
ibili
ty
Iden
tifi
cati
on
Additional records identified through other sources
(n = 5)
Records after duplicates removed (n = 13,677)
Records screened (n = 13,677)
Records excluded (n = 13,298)
Full-text articles assessed for eligibility
(n = 379)
Papers included in Evidence Appraisal Report (n= 66)
• Systematic reviews (n = 2) • Primary studies (n = 64)
Full-text articles excluded, (n = 313)
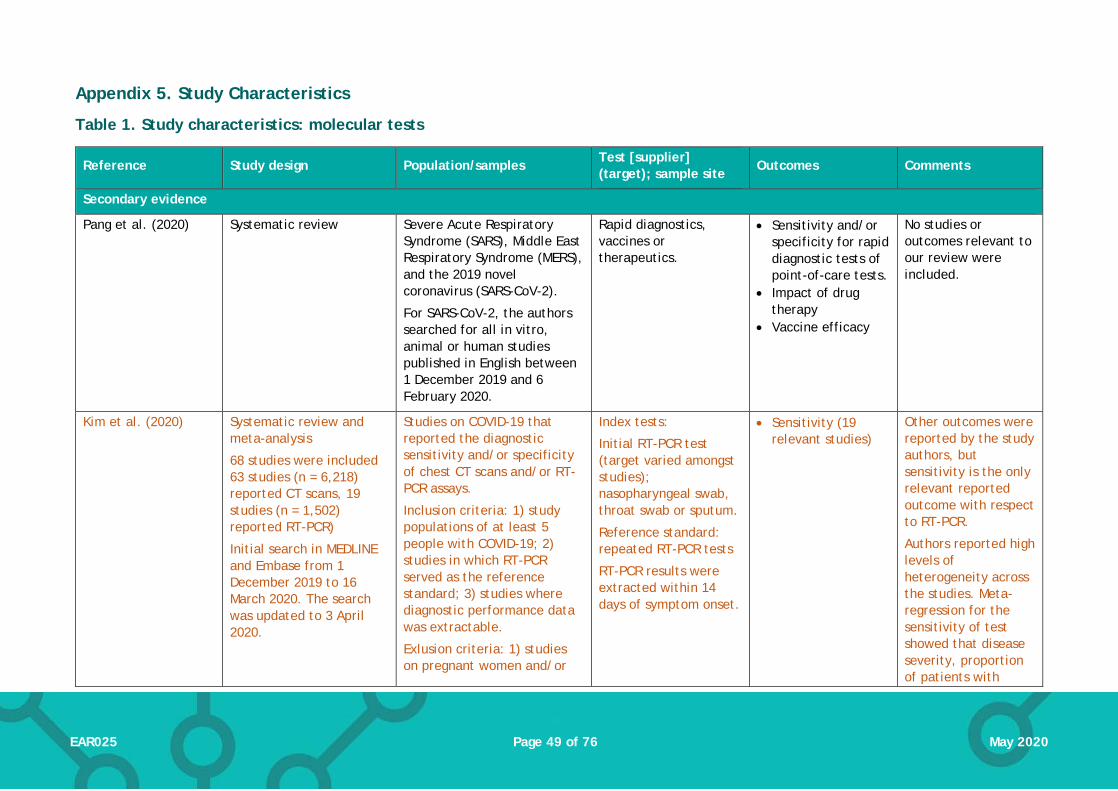
Page 49 of 76 EAR025 May 2020
Appendix 5. Study Characteristics
Table 1. Study characteristics: molecular tests
Reference Study design Population/samples Test [supplier] (target); sample site
Outcomes Comments
Secondary evidence
Pang et al. (2020) Systematic review
Severe Acute Respiratory Syndrome (SARS), Middle East Respiratory Syndrome (MERS), and the 2019 novel coronavirus (SARS-CoV-2).
For SARS-CoV-2, the authors searched for all in vitro, animal or human studies published in English between 1 December 2019 and 6 February 2020.
Rapid diagnostics, vaccines or therapeutics.
• Sensitivity and/or specificity for rapid diagnostic tests of point-of-care tests.
• Impact of drug therapy
• Vaccine efficacy
No studies or outcomes relevant to our review were included.
Kim et al. (2020) Systematic review and meta-analysis
68 studies were included 63 studies (n = 6,218) reported CT scans, 19 studies (n = 1,502) reported RT-PCR)
Initial search in MEDLINE and Embase from 1 December 2019 to 16 March 2020. The search was updated to 3 April 2020.
Studies on COVID-19 that reported the diagnostic sensitivity and/or specificity of chest CT scans and/or RT-PCR assays.
Inclusion criteria: 1) study populations of at least 5 people with COVID-19; 2) studies in which RT-PCR served as the reference standard; 3) studies where diagnostic performance data was extractable.
Exlusion criteria: 1) studies on pregnant women and/or
Index tests:
Initial RT-PCR test (target varied amongst studies); nasopharyngeal swab, throat swab or sputum.
Reference standard: repeated RT-PCR tests
RT-PCR results were extracted within 14 days of symptom onset.
• Sensitivity (19 relevant studies)
Other outcomes were reported by the study authors, but sensitivity is the only relevant reported outcome with respect to RT-PCR.
Authors reported high levels of heterogeneity across the studies. Meta-regression for the sensitivity of test showed that disease severity, proportion of patients with

Page 50 of 76 EAR025 May 2020
Reference Study design Population/samples Test [supplier] (target); sample site
Outcomes Comments
neonates; 2) case reports or series with less than five people; 3) lack of extractable data for two-by-two tables; 4) studies that only reported specificity of RT-PCR; 5) non-accessible full texts; 6) A study population that overlaps with other studies; 7) lack of a description for repeated RT-PCR assays as the reference standard; 8) studies on RT-PCR with per-sample basis analysis, where the results of the initial RT-PCR were not separated
comorbidities and the proportion of asymptomatic patients significantly affected the heterogeneity.
Quality of studies was assessed using the QUADAS-2 tool. Authors reported relatively low risk of bias in patient selection and flow/timing. There was an unclear risk of bias regarding blinding in 49% of studies, and unclear risk of bias for the RT-PCR procedures due to lack of clear reporting in 41% of studies.
Primary evidence
Ai et al. (2020) Retrospective case series
Single centre (China)
6 January 2020 to 6 February 2020
RT-PCR results were extracted from the
Patients with suspected novel coronavirus who underwent both chest CT imaging and RT-PCR.
n = 1,014
Mean age 51 (±15 years)
46% male
Index test: initial real-time RT-PCR using TaqMan One-Step RT-PCR kits [Shanghai Huirui Biotechnology Co., Ltd or Shanghai BioGerm Medical Biotechnology Co., Ltd]
• Detection rate (number of postitive tests)
• ‘Missed’ cases from negative RT-PCR (probable/highly likely)
Written informed consent waived.
Comparative tests were not necessarily performed at the same time. The CT scan performed closest to the RT-PCR

Page 51 of 76 EAR025 May 2020
Reference Study design Population/samples Test [supplier] (target); sample site
Outcomes Comments
patient’s electronic medical record
(primer target not specified); throat swab
Comparator index test: CT scan
Reference test: confirmation of diagnosis with RT-PCR up to and including 3 days after first RT-PCR test
• Test conversion (changes from negative to positive, or positive to negative).
was used (≤7 days; 35 patients excluded due to longer time interval).
Amrane et al. (2020) Prospective case series
Single centre (France)
31 January 2020 to 1 March 2020
Patients with suspected COVID-19
n = 280
Mean age 21 years (ranging from 1 to 84 years)
Male:Female ratio 1:1.2
Index test: RT-PCR [NR] (E and Spike primers); nasopharyngeal samples
A concurrent point-of-care molecular assay was performed to detect other respiratory pathogens.
• Detection rate (number of postitive tests)
• Time to result • Differential
diagnoses
Definition of ‘possible COVID-19’ changed throughout the course of the study.
Azzi et al. (2020) Case series, assumed to be retrospective
Single centre (Italy)
Patients hospitalised with COVID-19 (severe or very disease; clinical criteria not stated)
n = 25
Mean age 61 years (range 39 to 85 years). 17 males
RT-PCR [Abi Prism 7000 sequence detection system (Applied Biosystems)]; (primer NR); nasopharyngeal swabs, saliva
• Detection rate at each sample site
Baek et al. (2020) Design/Validation study (samples used collected retrospectively)
COVID-19 patients
n =14
No demographic details reported
RT-LAMP assay [developed in-house]; (N primer); nasal swabs
• Sensitivity • Specificity
All COVID-19 positvie samples (n = 14) collected from a single centre, origin

Page 52 of 76 EAR025 May 2020
Reference Study design Population/samples Test [supplier] (target); sample site
Outcomes Comments
Korea, number of centres not clear
of negative samples not clear
Chan et al. (2020) Design/Validation study (retrospective)
Single centre (China)
Patients with laboratory confirmed COVID-19 (from RT-PCR RdRp-P2 assay).
n = 15 (n = 273 specimens)
Median age 63 years (range 37 to 75 years)
8 males, 7 females
Index tests: RT-PCR using QuantiNova Probe RT-PCR Kit [Qiagen] (RdRp/Hel, Spike and N primers); respiratory samples (nasopharyngeal aspirates/swabs, throat swabs, saliva, and sputum) and non-respiratory samples (plasma, urine, and feces / rectal swabs)
Comparator: RT-PCR (RdRP-P2) [current standard]
• Analytic sensitivity (limit of detection [LOD], copies per reaction)
• Detection rate (number of positive tests)
Permission from patients not clear.
Collection period of samples not specified.
Chen et al. (2020a) Retrospective case series
Single centre (China)
20 January 2020 to 27 February 2020
Patients with a diagnosis of COVID-19 and paired RT-qPCR testing of pharyngeal swabs with either sputum or feces samples.
A diagnosis of COVID-19 required at least 2 RT-qPCR–positive pharyngeal swabs.
n = 22 (545 specimens)
18/22 patients were aged 15 to 65 years old; 4/22 were children.
14/22 (64%) male.
RT-qPCR [NR] (Orf1ab and N primers); pharyngeal, sputum and faecal samples.
• Detection in faecal & sputum samples after conversion of pharyngeal samples.
Letter format, so limited detail.
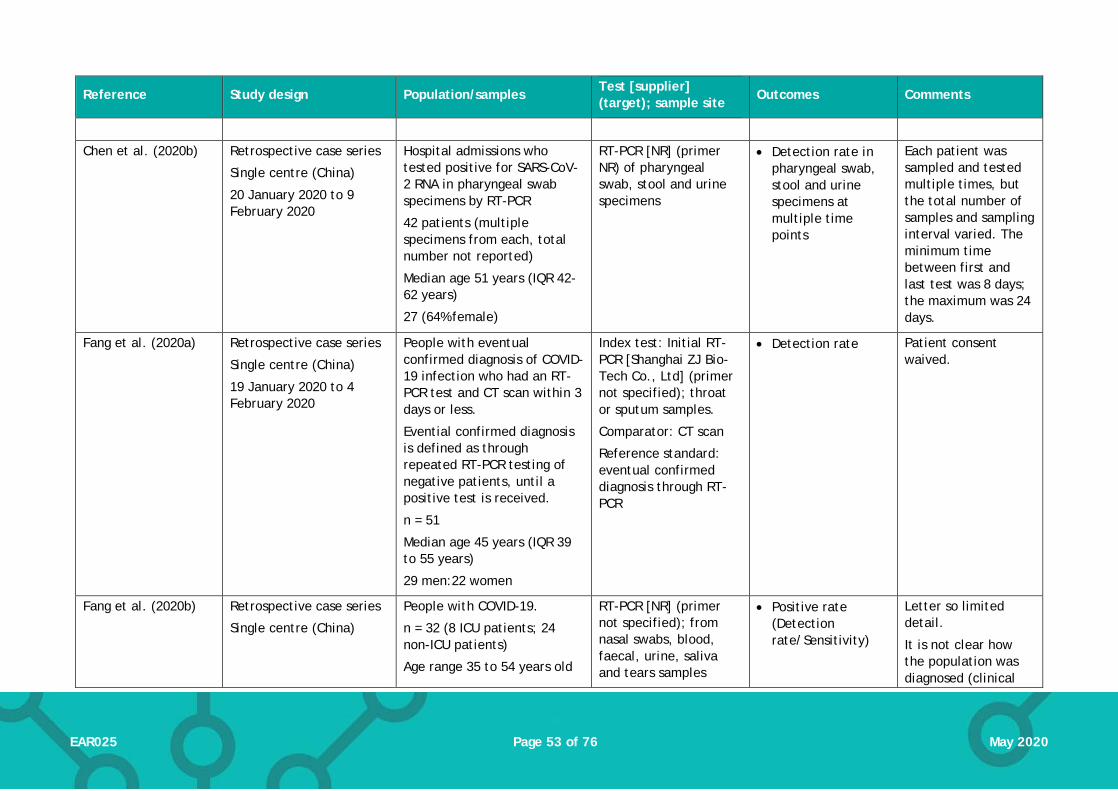
Page 53 of 76 EAR025 May 2020
Reference Study design Population/samples Test [supplier] (target); sample site
Outcomes Comments
Chen et al. (2020b) Retrospective case series
Single centre (China)
20 January 2020 to 9 February 2020
Hospital admissions who tested positive for SARS-CoV-2 RNA in pharyngeal swab specimens by RT-PCR
42 patients (multiple specimens from each, total number not reported)
Median age 51 years (IQR 42-62 years)
27 (64% female)
RT-PCR [NR] (primer NR) of pharyngeal swab, stool and urine specimens
• Detection rate in pharyngeal swab, stool and urine specimens at multiple time points
Each patient was sampled and tested multiple times, but the total number of samples and sampling interval varied. The minimum time between first and last test was 8 days; the maximum was 24 days.
Fang et al. (2020a) Retrospective case series
Single centre (China)
19 January 2020 to 4 February 2020
People with eventual confirmed diagnosis of COVID-19 infection who had an RT-PCR test and CT scan within 3 days or less.
Evential confirmed diagnosis is defined as through repeated RT-PCR testing of negative patients, until a positive test is received.
n = 51
Median age 45 years (IQR 39 to 55 years)
29 men:22 women
Index test: Initial RT-PCR [Shanghai ZJ Bio-Tech Co., Ltd] (primer not specified); throat or sputum samples.
Comparator: CT scan
Reference standard: eventual confirmed diagnosis through RT-PCR
• Detection rate Patient consent waived.
Fang et al. (2020b) Retrospective case series
Single centre (China)
People with COVID-19.
n = 32 (8 ICU patients; 24 non-ICU patients)
Age range 35 to 54 years old
RT-PCR [NR] (primer not specified); from nasal swabs, blood, faecal, urine, saliva and tears samples
• Positive rate (Detection rate/Sensitivity)
Letter so limited detail.
It is not clear how the population was diagnosed (clinical

Page 54 of 76 EAR025 May 2020
Reference Study design Population/samples Test [supplier] (target); sample site
Outcomes Comments
January 2020 to February 2020 (specific dates not specified)
Sex not reported
• Conversion time (positive test to negative test)
diagnosis or laboratory confirmed)
Reporting/language not always clear.
Patient selection not clear (ie. not clear if serial selection, convenience selection)
Guo et al. (2020b) Retrospective case series
Single centre (China)
People who were hospitalised, and diagnosed with COVID-19 according to the Chinese Management Criteria for COVID-19.
11 patients, 24 samples
9/11 male. Age range 26 to 83 years
RT-PCR [NR] (N, Orflab); pharyngeal swabs and throat washings. Samples were taken simultaneously on 24 occasions.
• Detection rate from different sampling methods
Patient selection not clear (ie. not clear if serial selection, convenience selection)
Harrington et al. (2020)
Prospective case series
Five centres (USA)
Symptomatic patients meeting current criteria for diagnosis of COVID-19
n = 524
Demographic details not reported
Isothermal amplification [ID NOW COVID-19 assay (Abbott)] (RdRp); nasal swabs
Reference standard was RT-PCR [Abbott RealTime SARS-CoV-2 assay performed on the Abbott m2000 system]
• Sensitivity • Specificity
Results reported on a per-patient basis; two samples with initial disagreement between tests were re-tested but only the final result is reported.
He et al. (2020) Retrospective case series
Single centre (China)
Hospitalised patients with suspected COVID-19 who underwent high resolution
RT-PCR [BGI Genomics]; (primer NR); nasopharyngeal
• Sensitivity
82 patients included, but results are reported here only
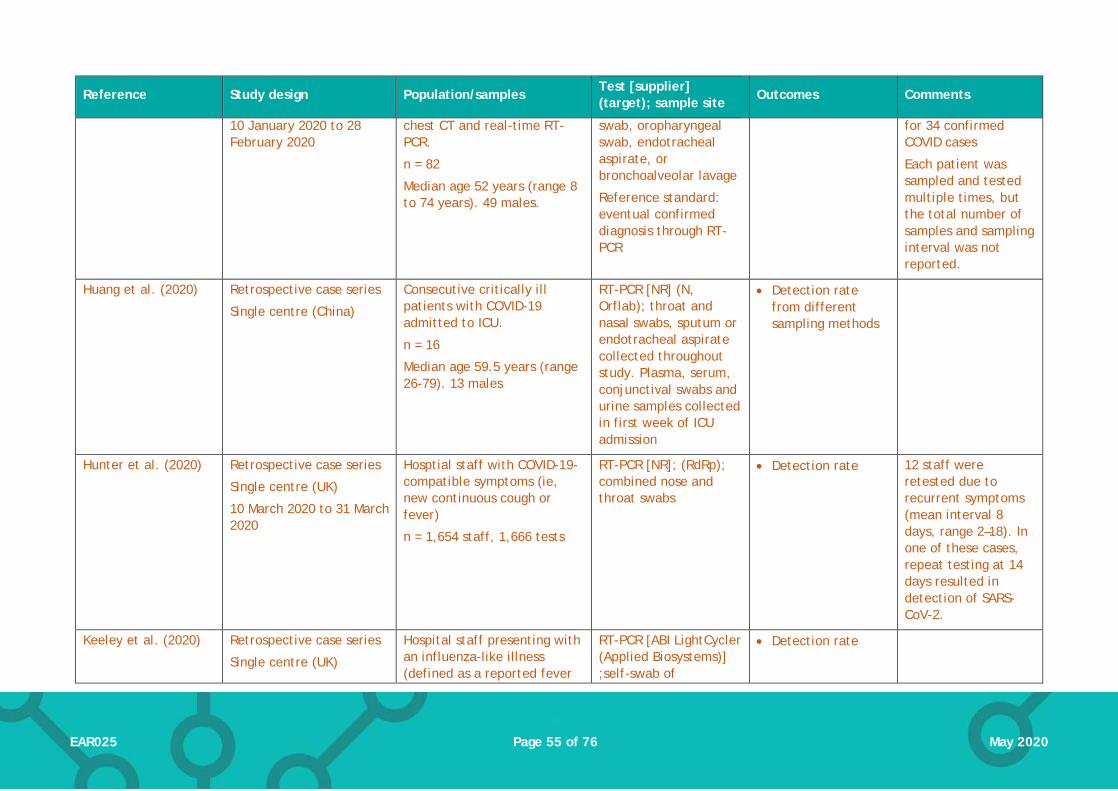
Page 55 of 76 EAR025 May 2020
Reference Study design Population/samples Test [supplier] (target); sample site
Outcomes Comments
10 January 2020 to 28 February 2020
chest CT and real-time RT-PCR.
n = 82
Median age 52 years (range 8 to 74 years). 49 males.
swab, oropharyngeal swab, endotracheal aspirate, or bronchoalveolar lavage
Reference standard: eventual confirmed diagnosis through RT-PCR
for 34 confirmed COVID cases
Each patient was sampled and tested multiple times, but the total number of samples and sampling interval was not reported.
Huang et al. (2020) Retrospective case series
Single centre (China)
Consecutive critically ill patients with COVID-19 admitted to ICU.
n = 16
Median age 59.5 years (range 26-79). 13 males
RT-PCR [NR] (N, Orflab); throat and nasal swabs, sputum or endotracheal aspirate collected throughout study. Plasma, serum, conjunctival swabs and urine samples collected in first week of ICU admission
• Detection rate from different sampling methods
Hunter et al. (2020) Retrospective case series
Single centre (UK)
10 March 2020 to 31 March 2020
Hosptial staff with COVID-19-compatible symptoms (ie, new continuous cough or fever)
n = 1,654 staff, 1,666 tests
RT-PCR [NR]; (RdRp); combined nose and throat swabs
• Detection rate 12 staff were retested due to recurrent symptoms (mean interval 8 days, range 2–18). In one of these cases, repeat testing at 14 days resulted in detection of SARS-CoV-2.
Keeley et al. (2020) Retrospective case series
Single centre (UK)
Hospital staff presenting with an influenza-like illness (defined as a reported fever
RT-PCR [ABI LightCycler (Applied Biosystems)] ;self-swab of
• Detection rate

Page 56 of 76 EAR025 May 2020
Reference Study design Population/samples Test [supplier] (target); sample site
Outcomes Comments
Tests conducted 16-29 March 2020
AND one of: cough, sore throat, runny nose, myalgia, headache) or persistent cough. Tests conducted 16-29 March 2020
oropharynx and nasopharynx
Kong et al. (2020) Retrospective case series
Two centres, China (Wuhan)
6 October 2019 to 21 January 2020
Hospital outpatients with influenza-like illness (sudden onset of fever and cough or sore throat). Samples were collected as part of routine influenza surveillance.
640 patients (all sampled on a single occasion)
Mean/median age: 22.7/8 years (range 9 months to 87 years).
315 males/325 females
Quantitative PCR [Biogerm] (N, Orflab); throat swabs
• Detection rate Data collection began before the start of the COVID-19 outbreak.
Lee et al. (2020a) Retrospective case series
Single centre (Singapore)
Up to 29 February 2020 (start date not reported)
Patients admitted to hospital with suspected COVID-19 infection.
n = 70
Demographics not reported.
RT-PCR [in-house or A*STAR Fortitude Kit (Accelerate Technologies)]; (N, Orf1ab); nasopharyngeal swabs
• Detection rate/sensitivity
Initial PCR result compared to final PCR result after multiple tests as reference standard.
Each patient was sampled and tested multiple times, but the total number of samples and sampling interval varied.
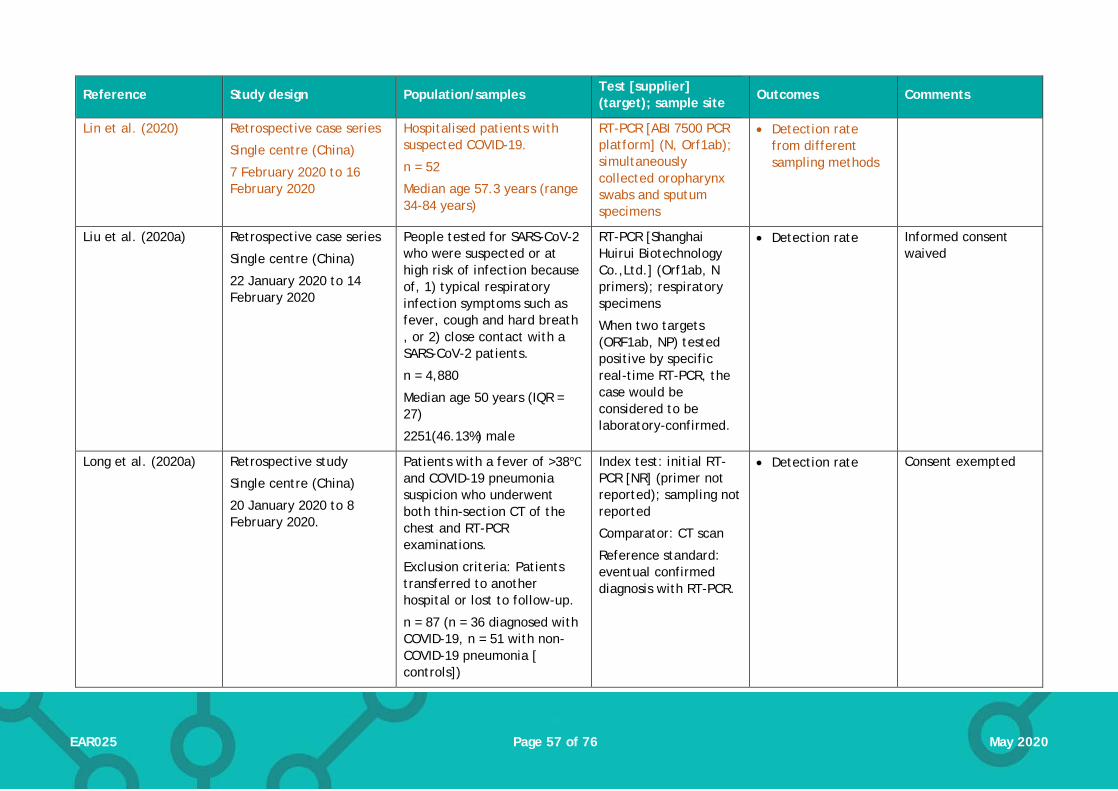
Page 57 of 76 EAR025 May 2020
Reference Study design Population/samples Test [supplier] (target); sample site
Outcomes Comments
Lin et al. (2020) Retrospective case series
Single centre (China)
7 February 2020 to 16 February 2020
Hospitalised patients with suspected COVID-19.
n = 52
Median age 57.3 years (range 34-84 years)
RT-PCR [ABI 7500 PCR platform] (N, Orf1ab); simultaneously collected oropharynx swabs and sputum specimens
• Detection rate from different sampling methods
Liu et al. (2020a) Retrospective case series
Single centre (China)
22 January 2020 to 14 February 2020
People tested for SARS-CoV-2 who were suspected or at high risk of infection because of, 1) typical respiratory infection symptoms such as fever, cough and hard breath , or 2) close contact with a SARS-CoV-2 patients.
n = 4,880
Median age 50 years (IQR = 27)
2251(46.13%) male
RT-PCR [Shanghai Huirui Biotechnology Co.,Ltd.] (Orf1ab, N primers); respiratory specimens
When two targets (ORF1ab, NP) tested positive by specific real-time RT-PCR, the case would be considered to be laboratory-confirmed.
• Detection rate Informed consent waived
Long et al. (2020a) Retrospective study
Single centre (China)
20 January 2020 to 8 February 2020.
Patients with a fever of >38℃ and COVID-19 pneumonia suspicion who underwent both thin-section CT of the chest and RT-PCR examinations.
Exclusion criteria: Patients transferred to another hospital or lost to follow-up.
n = 87 (n = 36 diagnosed with COVID-19, n = 51 with non-COVID-19 pneumonia [ controls])
Index test: initial RT-PCR [NR] (primer not reported); sampling not reported
Comparator: CT scan
Reference standard: eventual confirmed diagnosis with RT-PCR.
• Detection rate Consent exempted

Page 58 of 76 EAR025 May 2020
Reference Study design Population/samples Test [supplier] (target); sample site
Outcomes Comments
The gold standard for a final diagnosis was positivity of first or repeated RT-PCR tests.
No significant different between groups for sex and age.
Lu et al. (2020) Design/validation study
China
Dates of sampling not reported
Suspected COVID-19 patients admitted to hospital and quarantined.
n = 56
Demographics not reported
Index test: RT-LAMP [in-house assay] (N); throat swabs
Reference standard: RT-PCR [LifeRiver Bio].
• Sensitivity • Specificity
Spellberg et al. (2020)
Prospective study
One centre, United States
12 March 2020 to 16 March 2020
Patients presenting to the emergency department or urgent care with mild influenza-like illness. Patients were excluded if they had specific risk factors for SARS-CoV-2 (eg,travel exposure; known contact with a traveller; severe respiratory tract infection)
N = 131 (assumed to be one test per patient, but not clearly reported)
RT-PCR [Quest Diagnostics] (primer NR) using nasopharyngeal swabs
• Detection rate Letter so limited detail.
Convenience sample used (only samples collected during normal laboratory working hourse were tested for SARS-CoV-2
Shen et al. (2020b) Retrospective case series
Single centre (China)
22 January to 18 February 2020
Subjects judged at high risk of SARS-CoV-2 infection according to the following criteria: 1) subjects presented fever and/or typical respiratory symptoms;
RT-PCR [Shanghai Huirui Biotechnology Co.,Ltd]; (Orf1ab, N); throat swabs
• Detection rate • Sensitivity
For sensitivity estimates, the initial test result was the index test and the eventual positive result after
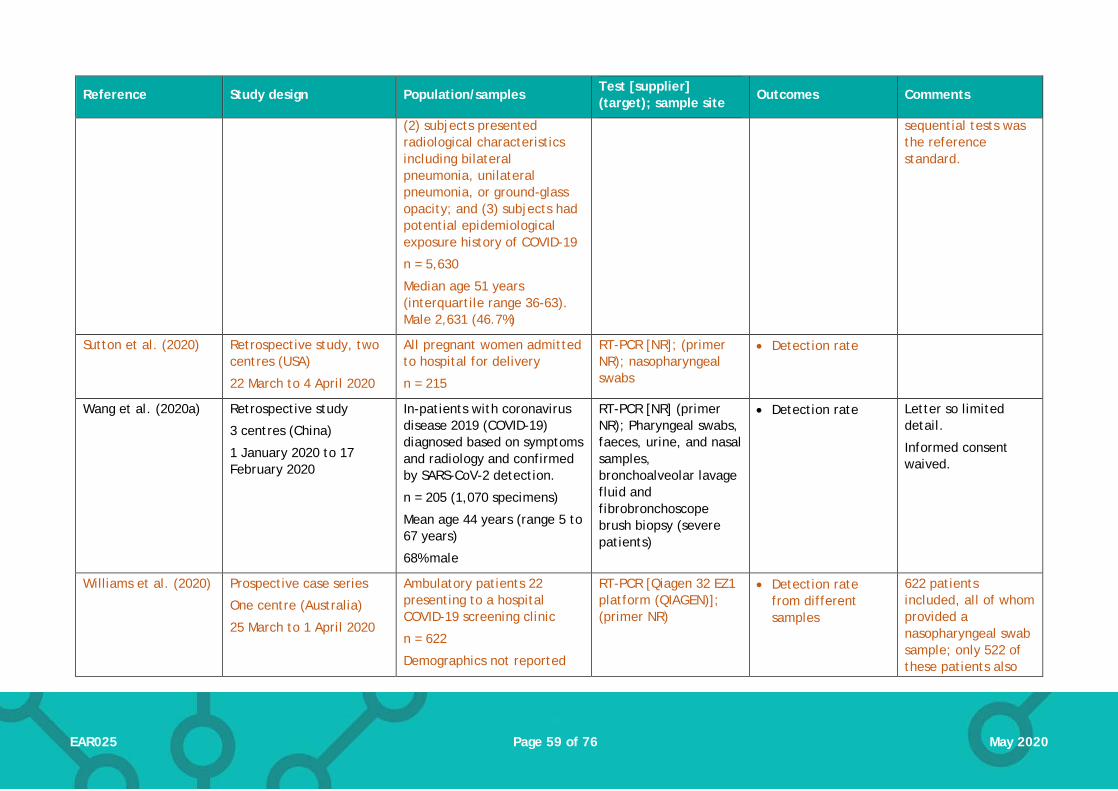
Page 59 of 76 EAR025 May 2020
Reference Study design Population/samples Test [supplier] (target); sample site
Outcomes Comments
(2) subjects presented radiological characteristics including bilateral pneumonia, unilateral pneumonia, or ground-glass opacity; and (3) subjects had potential epidemiological exposure history of COVID-19
n = 5,630
Median age 51 years (interquartile range 36-63). Male 2,631 (46.7%)
sequential tests was the reference standard.
Sutton et al. (2020) Retrospective study, two centres (USA)
22 March to 4 April 2020
All pregnant women admitted to hospital for delivery
n = 215
RT-PCR [NR]; (primer NR); nasopharyngeal swabs
• Detection rate
Wang et al. (2020a) Retrospective study
3 centres (China)
1 January 2020 to 17 February 2020
In-patients with coronavirus disease 2019 (COVID-19) diagnosed based on symptoms and radiology and confirmed by SARS-CoV-2 detection.
n = 205 (1,070 specimens)
Mean age 44 years (range 5 to 67 years)
68% male
RT-PCR [NR] (primer NR); Pharyngeal swabs, faeces, urine, and nasal samples, bronchoalveolar lavage fluid and fibrobronchoscope brush biopsy (severe patients)
• Detection rate Letter so limited detail.
Informed consent waived.
Williams et al. (2020) Prospective case series
One centre (Australia)
25 March to 1 April 2020
Ambulatory patients 22 presenting to a hospital COVID-19 screening clinic
n = 622
Demographics not reported
RT-PCR [Qiagen 32 EZ1 platform (QIAGEN)]; (primer NR)
• Detection rate from different samples
622 patients included, all of whom provided a nasopharyngeal swab sample; only 522 of these patients also
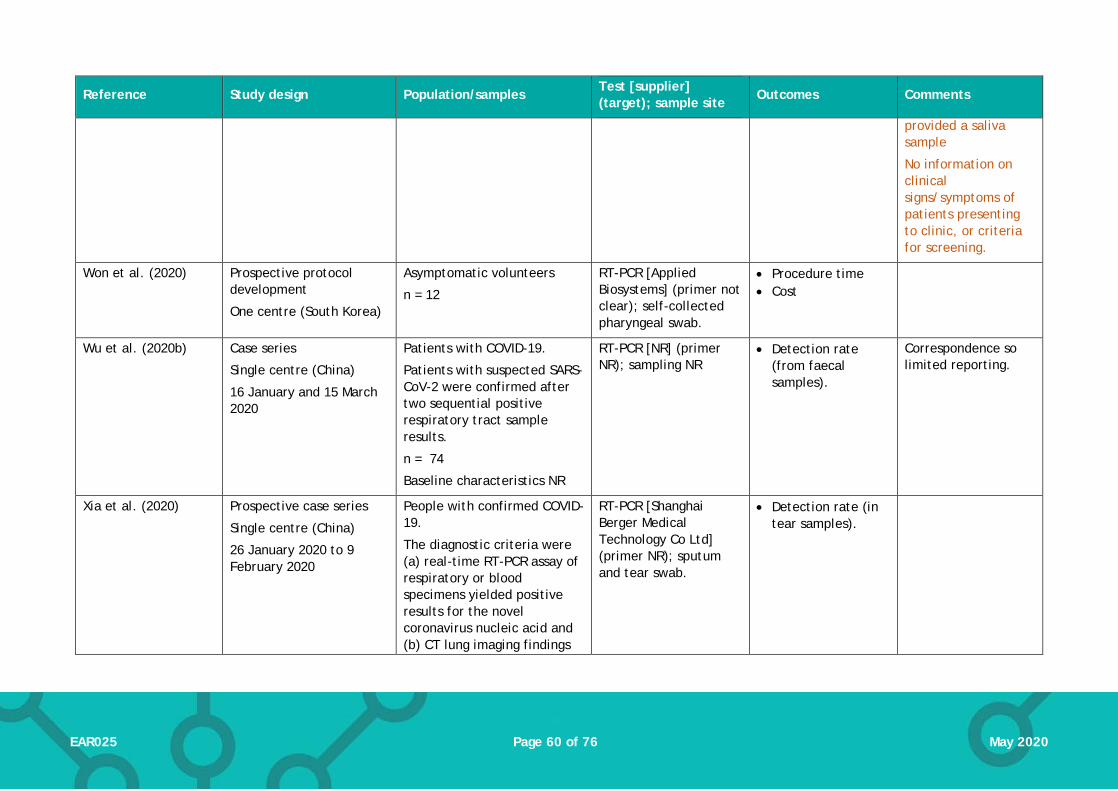
Page 60 of 76 EAR025 May 2020
Reference Study design Population/samples Test [supplier] (target); sample site
Outcomes Comments
provided a saliva sample
No information on clinical signs/symptoms of patients presenting to clinic, or criteria for screening.
Won et al. (2020) Prospective protocol development
One centre (South Korea)
Asymptomatic volunteers
n = 12
RT-PCR [Applied Biosystems] (primer not clear); self-collected pharyngeal swab.
• Procedure time • Cost
Wu et al. (2020b) Case series
Single centre (China)
16 January and 15 March 2020
Patients with COVID-19.
Patients with suspected SARS-CoV-2 were confirmed after two sequential positive respiratory tract sample results.
n = 74
Baseline characteristics NR
RT-PCR [NR] (primer NR); sampling NR
• Detection rate (from faecal samples).
Correspondence so limited reporting.
Xia et al. (2020) Prospective case series
Single centre (China)
26 January 2020 to 9 February 2020
People with confirmed COVID-19.
The diagnostic criteria were (a) real-time RT-PCR assay of respiratory or blood specimens yielded positive results for the novel coronavirus nucleic acid and (b) CT lung imaging findings
RT-PCR [Shanghai Berger Medical Technology Co Ltd] (primer NR); sputum and tear swab.
• Detection rate (in tear samples).
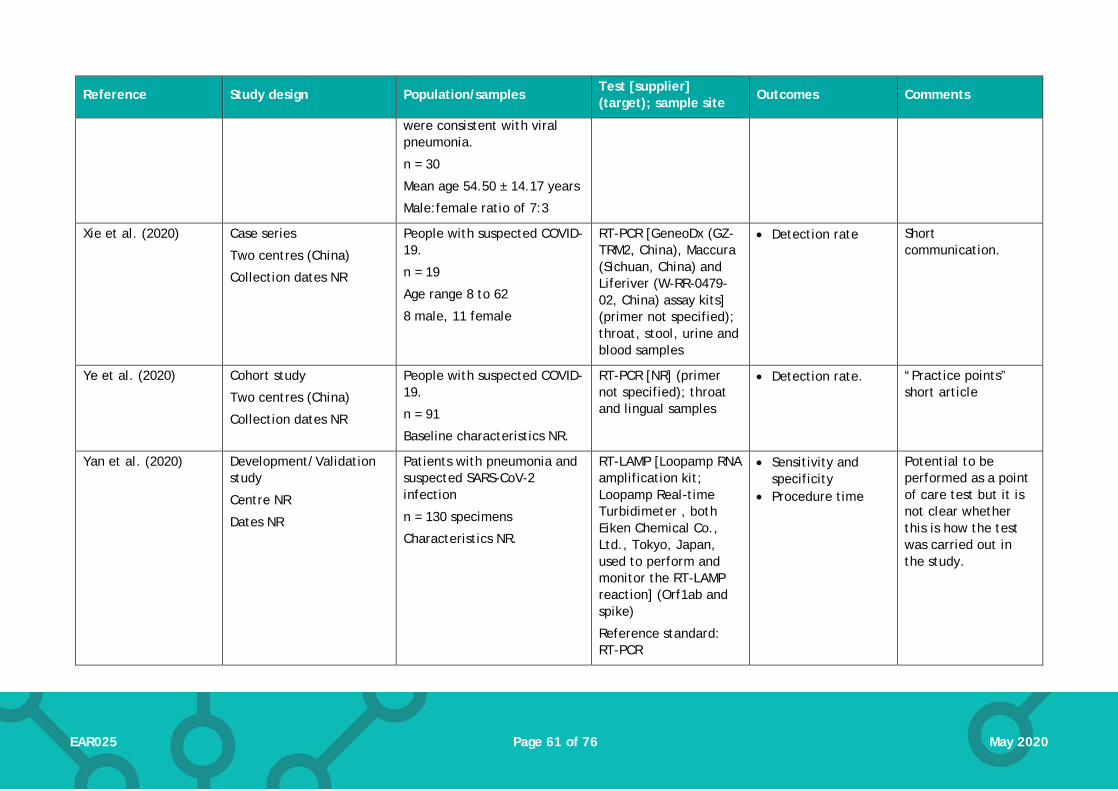
Page 61 of 76 EAR025 May 2020
Reference Study design Population/samples Test [supplier] (target); sample site
Outcomes Comments
were consistent with viral pneumonia.
n = 30
Mean age 54.50 ± 14.17 years
Male:female ratio of 7:3
Xie et al. (2020) Case series
Two centres (China)
Collection dates NR
People with suspected COVID-19.
n = 19
Age range 8 to 62
8 male, 11 female
RT-PCR [GeneoDx (GZ-TRM2, China), Maccura (Sichuan, China) and Liferiver (W-RR-0479-02, China) assay kits] (primer not specified); throat, stool, urine and blood samples
• Detection rate Short communication.
Ye et al. (2020) Cohort study
Two centres (China)
Collection dates NR
People with suspected COVID-19.
n = 91
Baseline characteristics NR.
RT-PCR [NR] (primer not specified); throat and lingual samples
• Detection rate. “Practice points” short article
Yan et al. (2020) Development/Validation study
Centre NR
Dates NR
Patients with pneumonia and suspected SARS-CoV-2 infection
n = 130 specimens
Characteristics NR.
RT-LAMP [Loopamp RNA amplification kit; Loopamp Real-time Turbidimeter , both Eiken Chemical Co., Ltd., Tokyo, Japan, used to perform and monitor the RT-LAMP reaction] (Orf1ab and spike)
Reference standard: RT-PCR
• Sensitivity and specificity
• Procedure time
Potential to be performed as a point of care test but it is not clear whether this is how the test was carried out in the study.

Page 62 of 76 EAR025 May 2020
Reference Study design Population/samples Test [supplier] (target); sample site
Outcomes Comments
Sampling from swabs (not specified) and bronchoaliveolar lavage fluid.
Zhang et al. (2020b) Retrospective case series
Single centre (China)
Collection from 27 January 2020 to 9 February 2020.
People with laboratory confirmed COVID-19 (via RT-PCR)
n = 14
Median age 41 years (18–87 years)
7 (50%) female
RT-PCR [NR] (primer not specified); pharyngeal and faecal samples
• Detection rate (of faecal samples)
Zhang et al. (2020c) Retrospective case series
China, two centres
Collection from 29 December 2019 to 16 February 2020.
People with laboratory confirmed COVID-19 (via RT-PCR)
n = 290
Median age 57 years (22-88 years)
155 (53.4%) male
RT-PCR [Shanghai Bio-germ Medical Technology Co Ltd] (Orf1ab, N primers); pharyngeal swab samples
• Detection rate; number of tests before a positive test result
Zhen et al. (2020) Prospective comparative evaluation
Single centre (USA)
Symptomatic patients suspected of having COVID-19
n = 108 samples (unclear if from unique patients)
Patient characteristics not reported
Three index tests, all ‘sample to answer’ platforms:
RT-PCR [Cepheid Xpert® Xpress SARS-CoV-2 assay, performed on GeneXpert instrument system]; (N2, E)
Isothermal amplification [Abbott
• Sensitivity • Specificity
The GenMark ePlex test was carried out on fresh samples’ all other tests used frozen samples.
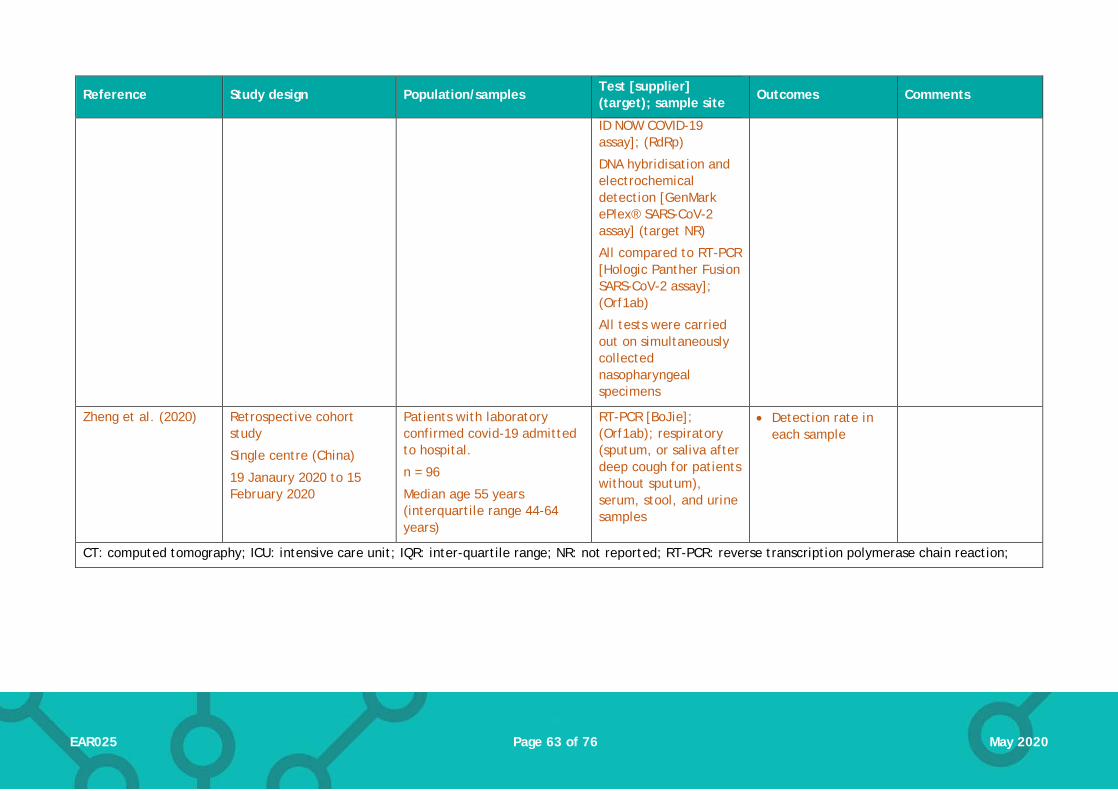
Page 63 of 76 EAR025 May 2020
Reference Study design Population/samples Test [supplier] (target); sample site
Outcomes Comments
ID NOW COVID-19 assay]; (RdRp)
DNA hybridisation and electrochemical detection [GenMark ePlex® SARS-CoV-2 assay] (target NR)
All compared to RT-PCR [Hologic Panther Fusion SARS-CoV-2 assay]; (Orf1ab)
All tests were carried out on simultaneously collected nasopharyngeal specimens
Zheng et al. (2020) Retrospective cohort study
Single centre (China)
19 Janaury 2020 to 15 February 2020
Patients with laboratory confirmed covid-19 admitted to hospital.
n = 96
Median age 55 years (interquartile range 44-64 years)
RT-PCR [BoJie]; (Orf1ab); respiratory (sputum, or saliva after deep cough for patients without sputum), serum, stool, and urine samples
• Detection rate in each sample
CT: computed tomography; ICU: intensive care unit; IQR: inter-quartile range; NR: not reported; RT-PCR: reverse transcription polymerase chain reaction;

Page 64 of 76 EAR025 May 2020
Table 2. Study characteristics: immunological tests
Reference Study design Population/samples Test [supplier] (target); sample site
Outcomes Comments
Primary evidence
Wu et al. (2020a) Cohort study
Single centre (China)
3 April 2020 to 15 April 2020
Two populations:
People applying for a permission of resume (n = 1,021)
Hospitalised patients (n = 381)
Nucleic acid test;
CT scan;
Colloidal Gold antibody test [Beijing Innovita Biollogical Technology Co.]
• Detection rate Limited reporting of the nucleic acid test
Only detection rates for the hospitalised cohort was extracted due to unclear/insufficient reporting of test detection in the resuming group.
Xiang et al. (2020)
Single centre (China)
19 January to 2 March 2020
People with suspected (n = 24) or confirmed (n = 85) COVID-19
Diagnosis of laboratory confirmed COVID-19 was defined as positive nucleic acid tests for SARS-CoV-2 by RT-PCR.
Diagnosis of suspected COVID-19 was based on negative RT-PCR, but satisfying 1 of the epidemiological history criteria and 2 of the clinical criteria.
Control: samples from healthy blood donors or from hospitalised
IgM/IgG ELISA [Livzon Inc.] (NR); serum
Serum samples were obtaines at different time periods after symptom onset.
Reference standard: RT-PCR (ORF1ab and N); nasopharyngeal and/or oropharyngeal swabs
• Sensitivity & specificity • PPV & NPV • Consistency rate • Detection over time

Page 65 of 76 EAR025 May 2020
Reference Study design Population/samples Test [supplier] (target); sample site
Outcomes Comments
patients with other diseases. (n = 60)
Yong et al. (2020)
Single centre (China)
15 February and 25 February 2020
People with COVID-19
Diagnosis was according to guidelines from China’s National Health Comission guidelines, including patient’s epidemic history, clinical characteristics, CT scan and laboratory findings
n = 56
Median age 56.5 years (IQR 49.25 to 64.75 years)
57% female; 43% Male
IgM and IgG CLIA [YHLO Biological Technology Co.] (E and N); serum
RT-PCR (ORF1ab and N); nasopharyngeal and throat swabs
Serum samples were tested upon patient admission.Time between symptom onset and testing is unclear (NR for both CLIA or RT-PCR
• Detection rates It is unclear if the reference test was initial/single RT-PCR tests, or repeated RT-PCR testing.
Unclear when sample for RT-PCR was obtained.
Yong et al. (2020)
Single centre (China)
22 January 2020 to 28 February 2020
People with COVID-19.
Diagnosis was based on the New Coronavirus Pneumonia Prevention and Control Program (5th ed.) from National Health Commission of China.
n = 38 patients (n = 76 serum samples)
Median age 40.5 years (IQR 31.0 to 49.5 years)
55.3% male
IgM and IgG colloidal gold GICA [Beijing Innovita Biological Technology Company] (target NR); serum
RT-PCR [Shanghai Biogerm Medical Biotechnology Company] (ORF1ab and N);
Specimens, including throat swabs, sputum and serum, were collected during the period of hospitalisation (0-7 days,
• Detection rate • Detection over time
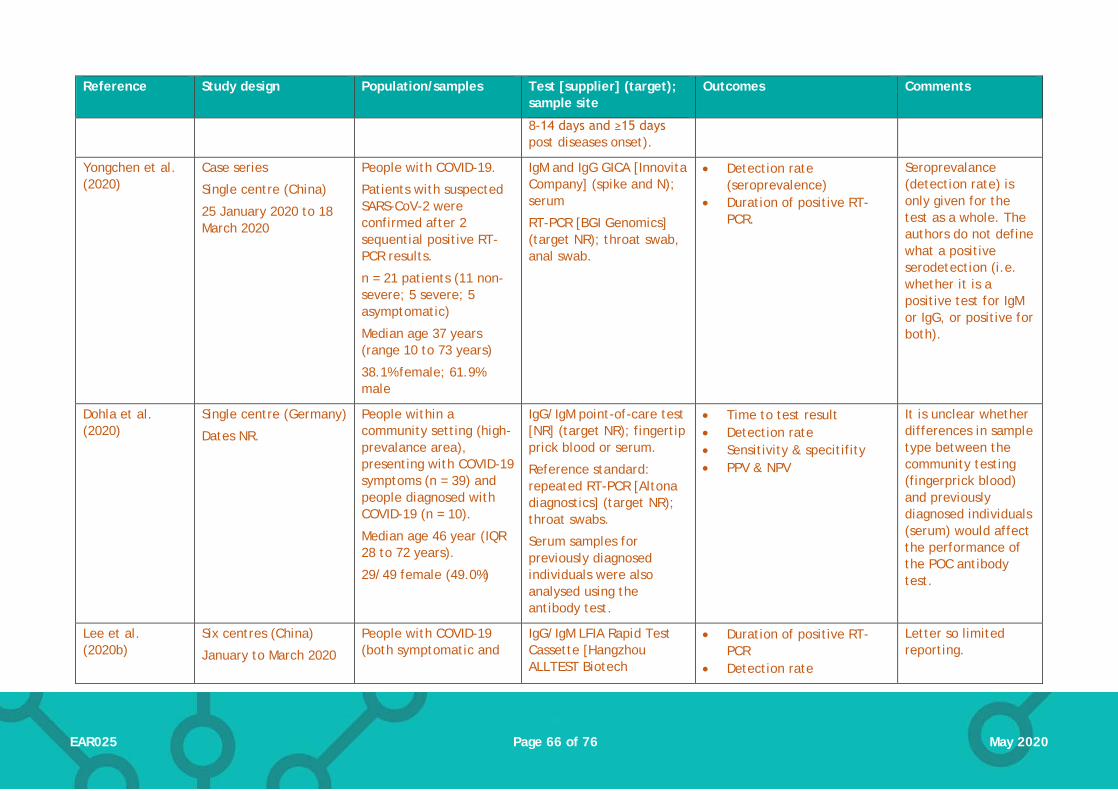
Page 66 of 76 EAR025 May 2020
Reference Study design Population/samples Test [supplier] (target); sample site
Outcomes Comments
8-14 days and ≥15 days post diseases onset).
Yongchen et al. (2020)
Case series
Single centre (China)
25 January 2020 to 18 March 2020
People with COVID-19.
Patients with suspected SARS-CoV-2 were confirmed after 2 sequential positive RT-PCR results.
n = 21 patients (11 non-severe; 5 severe; 5 asymptomatic)
Median age 37 years (range 10 to 73 years)
38.1% female; 61.9% male
IgM and IgG GICA [Innovita Company] (spike and N); serum
RT-PCR [BGI Genomics] (target NR); throat swab, anal swab.
• Detection rate (seroprevalence)
• Duration of positive RT-PCR.
Seroprevalance (detection rate) is only given for the test as a whole. The authors do not define what a positive serodetection (i.e. whether it is a positive test for IgM or IgG, or positive for both).
Dohla et al. (2020)
Single centre (Germany)
Dates NR.
People within a community setting (high-prevalance area), presenting with COVID-19 symptoms (n = 39) and people diagnosed with COVID-19 (n = 10).
Median age 46 year (IQR 28 to 72 years).
29/49 female (49.0%)
IgG/IgM point-of-care test [NR] (target NR); fingertip prick blood or serum.
Reference standard: repeated RT-PCR [Altona diagnostics] (target NR); throat swabs.
Serum samples for previously diagnosed individuals were also analysed using the antibody test.
• Time to test result • Detection rate • Sensitivity & specitifity • PPV & NPV
It is unclear whether differences in sample type between the community testing (fingerprick blood) and previously diagnosed individuals (serum) would affect the performance of the POC antibody test.
Lee et al. (2020b)
Six centres (China)
January to March 2020
People with COVID-19 (both symptomatic and
IgG/IgM LFIA Rapid Test Cassette [Hangzhou ALLTEST Biotech
• Duration of positive RT-PCR
• Detection rate
Letter so limited reporting.
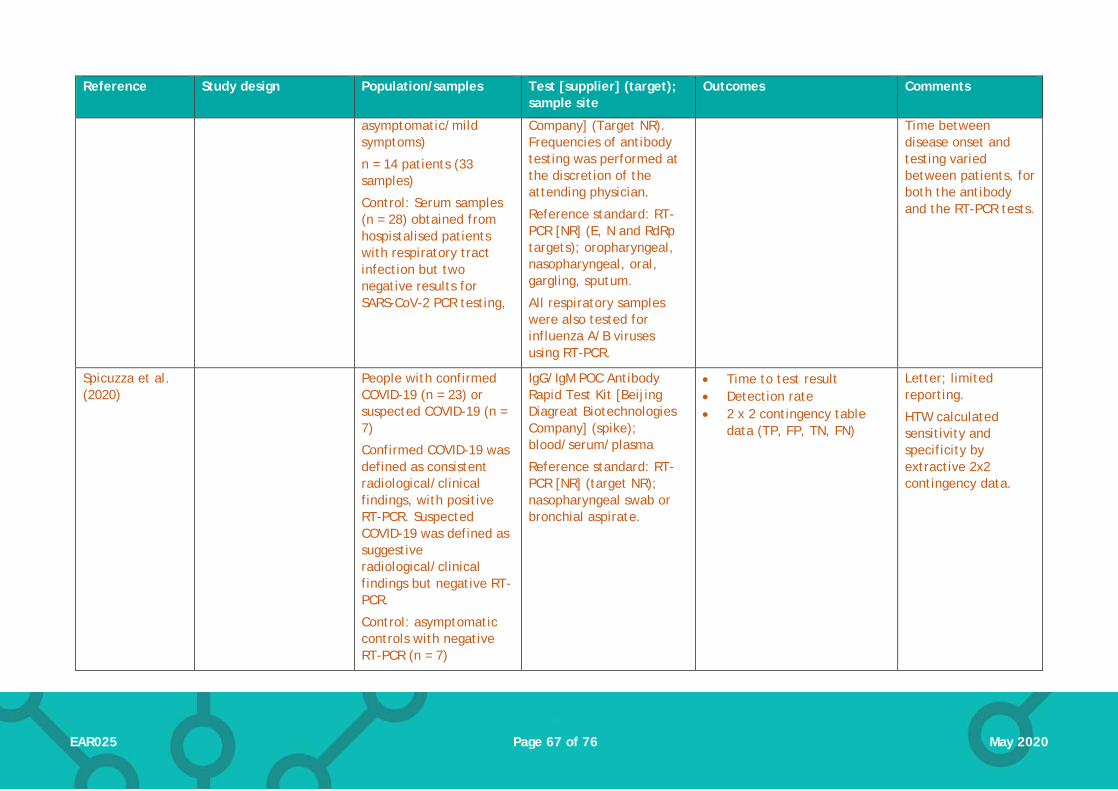
Page 67 of 76 EAR025 May 2020
Reference Study design Population/samples Test [supplier] (target); sample site
Outcomes Comments
asymptomatic/mild symptoms)
n = 14 patients (33 samples)
Control: Serum samples (n = 28) obtained from hospistalised patients with respiratory tract infection but two negative results for SARS-CoV-2 PCR testing,
Company] (Target NR). Frequencies of antibody testing was performed at the discretion of the attending physician.
Reference standard: RT-PCR [NR] (E, N and RdRp targets); oropharyngeal, nasopharyngeal, oral, gargling, sputum.
All respiratory samples were also tested for influenza A/B viruses using RT-PCR.
Time between disease onset and testing varied between patients, for both the antibody and the RT-PCR tests.
Spicuzza et al. (2020)
People with confirmed COVID-19 (n = 23) or suspected COVID-19 (n = 7)
Confirmed COVID-19 was defined as consistent radiological/clinical findings, with positive RT-PCR. Suspected COVID-19 was defined as suggestive radiological/clinical findings but negative RT-PCR.
Control: asymptomatic controls with negative RT-PCR (n = 7)
IgG/IgM POC Antibody Rapid Test Kit [Beijing Diagreat Biotechnologies Company] (spike); blood/serum/plasma
Reference standard: RT-PCR [NR] (target NR); nasopharyngeal swab or bronchial aspirate.
• Time to test result • Detection rate • 2 x 2 contingency table
data (TP, FP, TN, FN)
Letter; limited reporting.
HTW calculated sensitivity and specificity by extractive 2x2 contingency data.

Page 68 of 76 EAR025 May 2020
Reference Study design Population/samples Test [supplier] (target); sample site
Outcomes Comments
n = 37
Mean age:
Confirmed COVID-19 57±17 years
Suspected COVID-19 67±15 years
Controls age NR
Sex characteristics NR.
Hoffman et al. (2020)
Centre NR.
Study dates NR
Patients with confirmed COVID-19 or convalescents (n = 29)
Controls: healthy volunteers without any known history of COVID-19 (n = 24); blood donor sera from health adults (n = 80) and babies (m = 20) collected during 2018
IgG/IgM Rapid Test Cassette [Zhejiang Orient Gene Biotech Company] (target NR); blood/serum samples
Reference standard: RT-PCR
• Time to test result • Detection rate/sensitivity
The authors do not report the time of sample acquisition post disease onset.
Long et al. (2020b)
Validation study
Three centres (China)
Dates NR
People with COVID-19.
COVID-19 was confirmed by RT-PCR.
n = 285
Median age 47 years (IQR 34 to 56 years).
55.4% male
IgM/IgG Magnetic CLIA [Bioscience Company] (N and spike); serum.
Reference standard: RT-PCR; nasal and pharyngeal swabs
For a follow-up cohort, serum samples were taken from 63 patients at 3-day intervals, from 8 February 2020 to hospital discharge.
• Detection over time. • Detection rate
(seroconversion rate) • Median time to
seroconversion
Brief communication.

Page 69 of 76 EAR025 May 2020
Reference Study design Population/samples Test [supplier] (target); sample site
Outcomes Comments
Serological course was also followed in 26 patients who were initially seronegative.
Shen et al. (2020a)
Prospective cohort study.
Single centre (China)
20 January and 2 February 2020
People with suspected COVID-19.
Suspected COVID-19 was defined as a pneumonia that had related epidemiological history and fulfilled two of the following: fever and/or respiratory symptoms; imaging indicative of pneumonia; low/normal white cell count or low lymphocyte count.
n = 150
Median age
PCR positive group 38 years (IQR 46 – 56 years);
PCR negative group 32 years (IQR 20 to 42.5).
Sex
PCR positive group 60.8% male
PCR negative group 56.6% male
Control: healthy donors (n = 26)
IgM/IgG colloidal gold immnochromatography antibody kit [Shanghai Outdo Biotech Company] (target NR); blood.
Reference standard: RT-PCR (target NR); nasopharyngeal and oropharybgeal swabs.
At least 2 different samples were obtained from each patient for RT-PCR. If the result was incolnclusive, repeated sample collection was required. A patient with at least 1 positive RT-PCR was confirmed as positive. Patients with two consecutive negative results were defined as PCR negative, but would only be diagnoses as non-COVID-19 if the symptoms could be explained by another condition or infection resolved following the corresponding treatments.
• Sensitivity & specificity • PPV & NPV • Sensitivity in different
subgroups • Median time to
seroconversion
There is an unclear risk of bias with the reference standard. This study required 2 sample collections for RT-PCR, and one positive result was considered to be a confirmed case of COVID-19. This differs from other studies that employ repeated RT-PCR (until hospital discharge) and where 2 consecutive positive RT-PCR results are required to confirm diagnosis.

Page 70 of 76 EAR025 May 2020
Reference Study design Population/samples Test [supplier] (target); sample site
Outcomes Comments
Any other PCR negative result was treated as inconclusive.
Sun et al. (2020) Two centres (China)
Study dates NR.
People with COVID-19
n = 38 patients
11 ICU and 27 non-ICU patients.
Median age
non-ICU patients 44 years (IQR 32 to 56 years)
ICU 58 years (IQR 49 to 69.5 years)
24 male; 14 female
Controls: serum samples from healthy donors (n = 16)
IgM/IgG ELISA [NR] (N and spike protein); blood.
Blood samples were collected between 3 and 28 days post symptom onset.
• Detection rate at time points: in week 1, week 2 and week 3 after onset.
Authors did not report the definition for COVID-19 diagnosis.
Outcome of interest was provided for the non-ICU subgroup of patients only; number of patients within each time point of sample collected not clearly reported.
Zhang et al. (2020a)
Restrospective case series
Single centre (China)
1 February to 29 February 2020
People diagnosed with COVID-19.
Diagnosis was made based on the New Coronavirus Pneumonia Prevention and Control Program (4th ed.), with positive RT-PCR.
n = 122
Median age 38.625±14.9 years
IgM/IgG antibody detection kit [Yahuilong Biotechnology] (E and N). Serologicial antibody tests were performed at different time points post-disease onset.
Reference standard: RT-PCR [BioGerm] (ORF1ab and N); respiratory tract samples.
• Detection rate/sensitivity • Detection over time of
disease onset
The type of antibody assay used is not described.

Page 71 of 76 EAR025 May 2020
Reference Study design Population/samples Test [supplier] (target); sample site
Outcomes Comments
33 (29.5%) male; 79 (70.5%) female
Lippi et al. (2020)
Case series
Single centre (Italy)
People hospitalised with suspected COVID-19, whose respiratory ramples were collected along with blood samples during hospital stay.
n = 131
56 ± 21 years; 71 women and 60 men
MAGLUMI IgM and IgG CLIAs [Shenzhen New Industries Biomedical Engineering Company] (N and spike); serum/plasma
Comparator: Euroimmun IgA/IgG ELISA [Euroimmun AG] (target NR); serum/plasma
Reference standard: RT-PCR [Seegene AllplexTM2019-nCoV Assay] (E, RdRp and N); nasopharyngeal and oropharyngeal swabs
• Rate of detection over time.
Letter so limited reporting.
Detection rates reported was limited to 48 patients in total, in whom date of symptom onset could be recorded.
Pan et al. (2020) Single centre (China)
Samples collected 6 February-21 February 2020.
People hospitalised (criteria unclear).
n = 86 samples (n = 67 cases) were included in the analysis as confirmed COVID-19.
Median age
48 male; 57 female
Colloidal gold IgM/ IgG assay [Zhuhai Livzon Diagnositic] (target NR); blood/serum,
Reference standard: RT-PCR (target NR); throat swabs.
• Time to test result • Detection rate (samples) • Antibody detection rates
over time.
Analysis was undertaken for samples where time of disease onset was available.
Zeng et al. (2020)
Study design NR
Centres and location NR
Dates NR
People hospitalised with COVID-19
n = 27
Median age 62 years (IQR 46 to 67 years)
IgM and IgG ELISA [Zhuhai Livzon Diagnostics] (target NR).
• Detection rate
Reference standard not reported: The authors do not define whether the study population fulfils the laboratory (RT-PCR)

Page 72 of 76 EAR025 May 2020
Reference Study design Population/samples Test [supplier] (target); sample site
Outcomes Comments
14 male; 13 female. Samples were collected between day 3 and 39 after the onset of disease.
or clinical diagnosis criteria for COVID-19.
Cassaniti et al. (2020)
Cohort study
Single centre (Italy)
Collection date NR.
3 cohorts:
Health volunteers with negative RT-PCR for COVID-19
Hospitalised patients with positive COVID-19 RT-PCR
Patients with suspected COVID-19 at their first access at emergency room.
n = 110 (30 healthy volunteers; 30 COVID-19 patients; 50 patients with suspected COVID-19)
Baseline characteristics reported separately for each cohort.
VivaDiag COVID-19 IgM/IgG Rapid point-of-care lateral flow immunoassay [Vivachek] (target NR); serum or blood samples
Serum samples were obtained at median 7 days (IQR 4 to 11 days) after positive result for hospitalised patients.
Reference/Comparator: RT-PCR (RdRp and E primers); respiratory samples
• Detection rate • Sensitivity and specificity
(suspected cohort only) • NPV and PPV (suspected
cohort only) • Time to test result
Letter so limited reporting.
Gao et al. (2020) Case series
Single centre (China)
21 January 2020 to 24 February 2020
People with confirmed cases of COVID-19 (confirmed by RT-PCR)
n = 22 (37 samples)
Median age 40 years (range 4 to 72 years)
8 females, 14 males
IgM and IgG chemiluminescent immunoassays (CLIA), gold immunochromatographic assays (GICA), and enzyme-linked immunosorbent assays (ELISA) [all Beier Bioengineering Company]
• Detection rate • Antibody detection over
time
Letter so limited reporting.
IgG and IgM tests were separate.
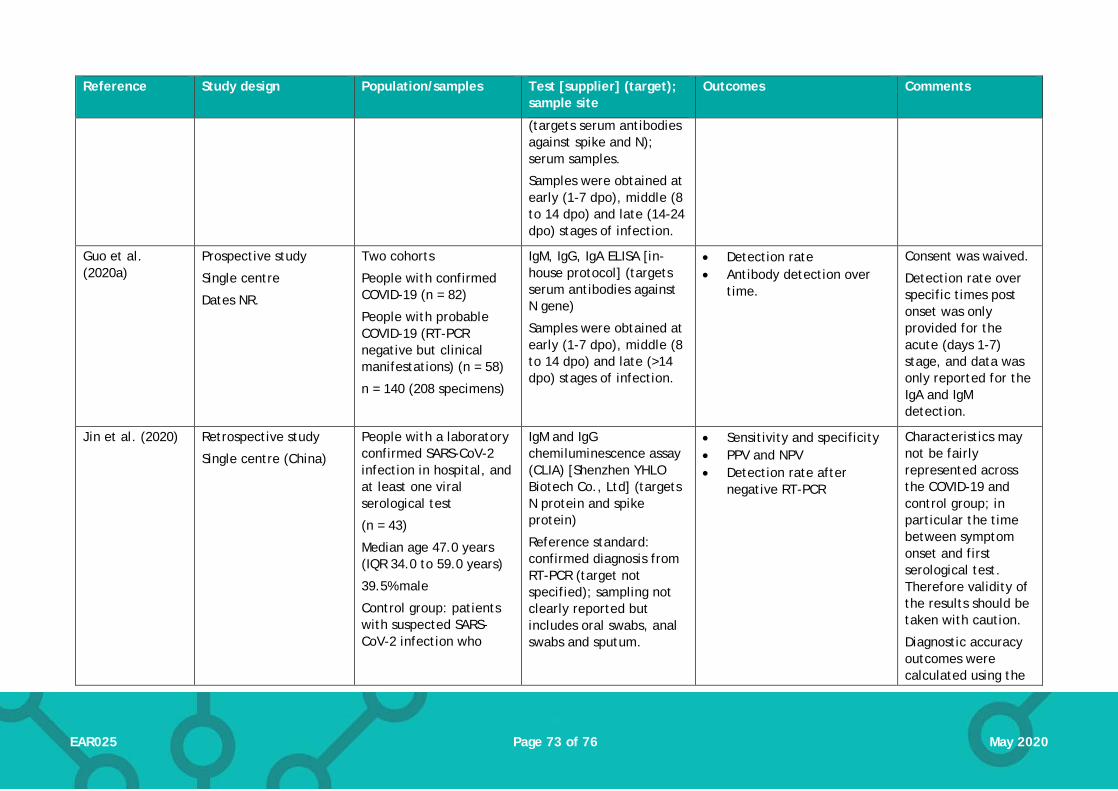
Page 73 of 76 EAR025 May 2020
Reference Study design Population/samples Test [supplier] (target); sample site
Outcomes Comments
(targets serum antibodies against spike and N); serum samples.
Samples were obtained at early (1-7 dpo), middle (8 to 14 dpo) and late (14-24 dpo) stages of infection.
Guo et al. (2020a)
Prospective study
Single centre
Dates NR.
Two cohorts
People with confirmed COVID-19 (n = 82)
People with probable COVID-19 (RT-PCR negative but clinical manifestations) (n = 58)
n = 140 (208 specimens)
IgM, IgG, IgA ELISA [in-house protocol] (targets serum antibodies against N gene)
Samples were obtained at early (1-7 dpo), middle (8 to 14 dpo) and late (>14 dpo) stages of infection.
• Detection rate • Antibody detection over
time.
Consent was waived.
Detection rate over specific times post onset was only provided for the acute (days 1-7) stage, and data was only reported for the IgA and IgM detection.
Jin et al. (2020) Retrospective study
Single centre (China)
People with a laboratory confirmed SARS-CoV-2 infection in hospital, and at least one viral serological test
(n = 43)
Median age 47.0 years (IQR 34.0 to 59.0 years)
39.5% male
Control group: patients with suspected SARS-CoV-2 infection who
IgM and IgG chemiluminescence assay (CLIA) [Shenzhen YHLO Biotech Co., Ltd] (targets N protein and spike protein)
Reference standard: confirmed diagnosis from RT-PCR (target not specified); sampling not clearly reported but includes oral swabs, anal swabs and sputum.
• Sensitivity and specificity • PPV and NPV • Detection rate after
negative RT-PCR
Characteristics may not be fairly represented across the COVID-19 and control group; in particular the time between symptom onset and first serological test. Therefore validity of the results should be taken with caution.
Diagnostic accuracy outcomes were calculated using the

Page 74 of 76 EAR025 May 2020
Reference Study design Population/samples Test [supplier] (target); sample site
Outcomes Comments
were excluded and quarantined at home
(n = 33)
Median age 31.0 years (IQR 25.5 to 37.5 years)
66.7% male
Suspected infected patients were discharged from hospital when they received two negative PCRs, performed in a 24 hour interval.
Duration between first symptoms and serological test (CLIA) was 18 days (IQR 11 to 23 days) in the COVID-19 group, 3.0 days (2.0 to 8.0 days).
control group and a sub group of the COVID-19 cohort where patients had received an antibody test before testing negative on RT-PCR (n = 27). Median duration of symptom onset to serological test in this subgroup was 16 days (IQR 9 to 20 days).
Li et al. (2020a) Prospective development study
Single centre (China)
12 February 2020 to 20 February 2020
People with suspected (RT-PCR negative) or confirmed (RT-PCR positive) COVID-19.
n = 278 (89 confirmed; 189 probable)
n = 273 controls were included.
Baseline characteristics NR.
IgM and IgG colloidal gold assay [NR] (targets serum antibodies against N protein); serum specimens
RT-PCR assumed to be the reference standard (described as a ‘control’ by the authors); primer/target and sampling methods not known.
• Detection rate • Sensitivity and specificity
Abstract only so limited reporting.
Definitions of ‘suspected’ cases is not clear.
Collection time of sample not clear.
Type of immunoassay not clear (colloidal gold technique)
Li et al. (2020b) Prospective development study
8 centres (China)
Dates NR
People with suspected COVID-19.
n = 525 specimens (397 clinical positive; 128 clinical negative)
Characteristics NR
IgM/IgG rapid point-of-care lateral flow immunoassay [Jiangsu Medomics Medical Technologies] (targets antibodies against spike protein); blood (including serum and plasma).
• Detection rate • Sensitivity and specificity
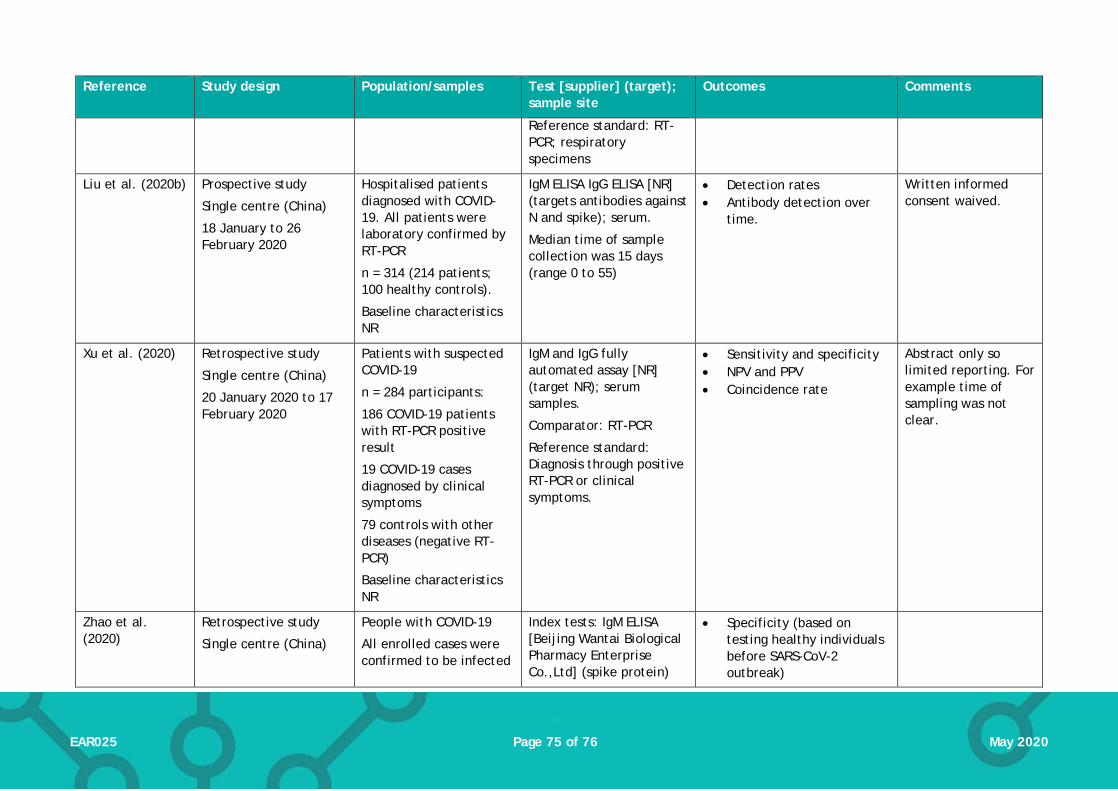
Page 75 of 76 EAR025 May 2020
Reference Study design Population/samples Test [supplier] (target); sample site
Outcomes Comments
Reference standard: RT-PCR; respiratory specimens
Liu et al. (2020b) Prospective study
Single centre (China)
18 January to 26 February 2020
Hospitalised patients diagnosed with COVID-19. All patients were laboratory confirmed by RT-PCR
n = 314 (214 patients; 100 healthy controls).
Baseline characteristics NR
IgM ELISA IgG ELISA [NR] (targets antibodies against N and spike); serum.
Median time of sample collection was 15 days (range 0 to 55)
• Detection rates • Antibody detection over
time.
Written informed consent waived.
Xu et al. (2020) Retrospective study
Single centre (China)
20 January 2020 to 17 February 2020
Patients with suspected COVID-19
n = 284 participants:
186 COVID-19 patients with RT-PCR positive result
19 COVID-19 cases diagnosed by clinical symptoms
79 controls with other diseases (negative RT-PCR)
Baseline characteristics NR
IgM and IgG fully automated assay [NR] (target NR); serum samples.
Comparator: RT-PCR
Reference standard: Diagnosis through positive RT-PCR or clinical symptoms.
• Sensitivity and specificity • NPV and PPV • Coincidence rate
Abstract only so limited reporting. For example time of sampling was not clear.
Zhao et al. (2020)
Retrospective study
Single centre (China)
People with COVID-19
All enrolled cases were confirmed to be infected
Index tests: IgM ELISA [Beijing Wantai Biological Pharmacy Enterprise Co.,Ltd] (spike protein)
• Specificity (based on testing healthy individuals before SARS-CoV-2 outbreak)
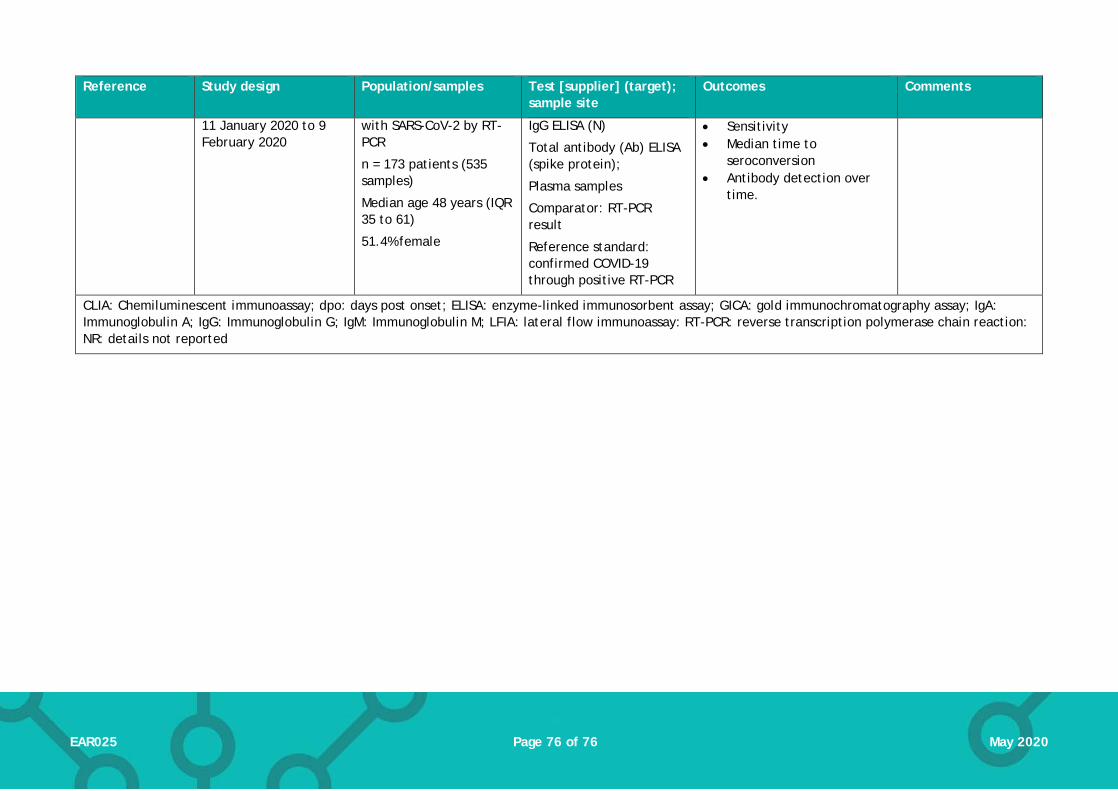
Page 76 of 76 EAR025 May 2020
Reference Study design Population/samples Test [supplier] (target); sample site
Outcomes Comments
11 January 2020 to 9 February 2020
with SARS-CoV-2 by RT-PCR
n = 173 patients (535 samples)
Median age 48 years (IQR 35 to 61)
51.4% female
IgG ELISA (N)
Total antibody (Ab) ELISA (spike protein);
Plasma samples
Comparator: RT-PCR result
Reference standard: confirmed COVID-19 through positive RT-PCR
• Sensitivity • Median time to
seroconversion • Antibody detection over
time.
CLIA: Chemiluminescent immunoassay; dpo: days post onset; ELISA: enzyme-linked immunosorbent assay; GICA: gold immunochromatography assay; IgA: Immunoglobulin A; IgG: Immunoglobulin G; IgM: Immunoglobulin M; LFIA: lateral flow immunoassay: RT-PCR: reverse transcription polymerase chain reaction: NR: details not reported