the cip report · the cip report ... 3 in keeping with the two-person risk-pooling example...
TRANSCRIPT

This month’s The CIP Report focuses on Risk and Risk Management.
First, David A. Cather, professor with Pennsylvania State University’s Smeal College of Business, de-scribes how the portfolio diversification usedin investments can be adapted to assess the risk associated with insurance risk pooling for large-scale loss events. Next, a paper submitted by research-ers from the Centre Risque & Performance at the Polytechnique Montréal (Canada) and the Research Institute for the Science and Management of Risks at the University of Mons (Belgium), presents a methodology for the speedy and systematic identification of transportation of dangerous goods-related vulnerabilities affect-ing equipment integrated into critical infrastructure. Former Senior Counsel on the House Homeland Security Committee and current Pennsylvania State University Harrisburg professor, Denise Rucker Krepp, continues the discussion on the transportation of dangerous goods with an article on the impact of the 9/11 Act on the freight rail transport of Bakken crude oil. Finally, Mark Stew-art, Director of the Centre for Infrastructure Performance and Reliability with the University of Newcastle, and John Mueller, Woody Hayes Senior Research Scientist with Mershon Center for International Security Studies at Ohio State University, present an approach for evaluating the costs and benefits of counter-terrorism spending.
We would like to take this opportunity to thank this month’s contributors. We truly appreciate your valuable insight.
We hope you enjoy this issue of The CIP Report and find it useful and informa-tive. Thank you for your support and feedback.
the cip report
101000101010110101001010101011010100101110101010010111010101010101010110101010101011011010101010100101010101010101010101101010010101010101110101101011001010101010101010101010100101010101010110101010100
September 2014Risk and ManageMent
Limits of Insurance Risk
Pooling. ........................................2
Transportation of Dangerous
Goods............................................5
Bakken Crude Oil and the 9/11
Act ...............................................9
Risk Performance Indicators .......12
Risk Assessment of Counterterror-
ism Efforts ..................................15
Editorial Staff
EditorChristie JonesEmily Drake
Daniel MitkusTehreem Saifey
PublisherMelanie Gutmann
Click here to subscribe. Visit us online for this and other issues at
http://cip.gmu.edu
Follow us on Twitter hereLike us on Facebook here
CENTER for
INFRASTRUCTURE PROTECTIONand
HOMELAND SECURITY
Mick KicklighterDirector, CIP/HS
CENTER FOR INFRASTRUCTURE PROTECTION AND
HOMELAND SECURITY
VOLUME 13 NUMBER 2

The CIP Report September 2014
2
The Limits of Insurance Risk Pooling for Large-Scale Loss Events
Insurance companies rely on risk pooling to spread the cost of insured losses across a wide group of poli-cyholders. This paper describes how the portfolio diversification meth-odology used in investments can be adapted to assess the risk associated with insurance risk pooling. Ad-ditionally, modeling risk pooling in a portfolio context allows us to specifically focus on how risk events that generate positively-correlated losses are unlikely candidates for risk reduction through pooling. Recognizing that large-scale loss events (e.g., terror attacks, floods) are prime examples of positively correlated losses, this conclusion is clearly relevant to many homeland security issues. Simply stated, insur-ance risk pooling is often ineffective for positively correlated catastrophic losses. To illustrate, I examine the insurability of hurricane losses as a brief example.
Risk Diversification: The Intu-ition Behind Risk Pooling
Insurers determine the premiums that they charge by estimating the total losses that will be suffered by their customers, and then dividing this sum across all the policyholders in the pool. The calculation of an insurance premium thus starts with a forecast of the expected value of the mean losses of the members in
a risk pool. Next, recognizing that they cannot forecast losses with complete accuracy, insurers build a margin for error into their premium calculations by adding a risk charge, calculated as a specific multiplier times the standard deviation of the pooled mean loss, to the mean loss.1 Insurers can reduce the standard deviation, and thus the risk charge, that they include in their premiums by increasing the number of cus-tomers in their pricing categories, a process known as risk pooling. Finally, to complete their premium calculations, insurers add a “load-ing” charge into their prices to cover the cost of administrative expenses.
Insurance risk pooling is similar to the portfolio diversification process used by investors. To demonstrate, consider an insurer that pools the insured losses of two policyholders with similar risk characteristics. Based on historical loss data, the insurer can forecast the value of the total losses in the pool as the sum of the losses of each policyholder. The insurer can also measure the total risk in the pool with the standard deviation of the pooled total losses, SDPTL, as:
SDPTL = W12 × SD1
2 + W22 × SD2
2 + W1×W2×SD1×SD2×Corr12
Equation 1
Where Wi is the weight (propor-tion of the pool) attributable to customer i (i equals 1 or 2), SDi is the standard deviation of losses for customer i, and Corr12 is a measure of the correlation between the losses of customers 1 and 2.
The insurer’s ability to diversify risk within a risk pool depends on Corr12, the right-most variable in Equation 1. Ideally, the losses of the two customers are statistically independent of each other, resulting in the correlation equaling zero and thus reducing the risk of the pool. Many commonly insured risks—e.g., auto accidents or building fires—generate independently distributed losses, since the loss of one pool member typically oc-curs randomly, not systematically with other pool members. Note that when we set Corr12 to zero in Equation 1, the term following the right-most plus sign equals zero, leading to a reduction in the pooled standard deviation.
By contrast, consider the case in which the losses of the two pool members exhibit perfect posi-tive correlation equal to 1.0. This indicates that both parties’ losses generally (do not) occur at the same time. Note that when we substitute
by David A. Cather*
(Continued on Page 3)
1 For example, we know that with repeated sampling, estimates of the mean loss for a large number of policyholders in a risk pool will be normally distributed. Given this assumption of normality, the risk charge concept is similar to calculating a confidence interval for a nor-mally distributed random variable, as they both add a margin for error to the estimate of a random variable. The multiplier used to calculate the risk charge is thus comparable to the z value in a normal distribution.

The CIP Report September 2014
3
the value of 1.0 for Corr12 into equation 1, the standard deviation of the pool is much greater than when both policyholders’ losses were independent. In short, risk pooling is ineffective in reducing the standard deviation of the risk pool when correlation equals 1.0, but more effective when the correlation is closer to zero.
Which of these two scenarios is most common in insurance? In fact, the correlation across losses is often greater than or equal to zero for most insurance-related risks. Insur-ers avoid positively correlated risks, however, preferring to insure risks with correlations near zero because they offer greater opportunity for risk reduction.2
Assessing Risk in Insurance Risk Pools
Unlike the above example, insurers do not limit risk pooling to two policyholders. How does increas-ing the size of the risk pool affect insurers? First, increasing pool size will not affect the mean loss paid by each pool member. This holds true because insurers sort customers into homogeneous pricing categories according to similar risk character-istics. If all pool members have the same mean loss, summing all losses
across the pool and dividing by the number of pool members results in a mean loss that stays the same regardless of pool size.
On the other hand, increasing pool size will decrease the standard deviation of the pooled mean loss (SDPML) paid by each pool member, the risk measure used to calculate the risk charge in a premium. Assuming homogeneity within the pool, we can calculate SDPML in a pool of N independent pool mem-bers as:
SDPML = SD / N0.5
Equation 2
and, if losses are not independent, as:
SDPML = {SD2/N + [(N-1)/N] Corr × SD2}0.5
Equation 3
Where N is the number of customers in the pool, SD is the standard de-viation of losses incurred by a policyholder, and Corr is the cor-relation of all the losses generated by policyholders
across the pool.3
Table 1 illustrates how insurance risk pooling is affected by the corre-lation of losses in the pool.4 Assume that an insurer can assemble a risk pool of homogeneous policyholders. Each customer’s mean loss equals $10,000 and its standard devia-tion equals $30,000. If the losses of policyholders are independent, the SDPML decreases dramatically with increased pool sizes, as shown in columns 1 and 2. Risk varies inversely with the square root of the number of pool members, resulting in significant reductions in risk with modest pool sizes. At the limit, the insurer can completely diversify risk away in large risk pools, as shown at the bottom of column 2.
(Continued on Page 4)
(Continued from Page 2)
2 Most people associate Equation 1 with explanations about how portfolio diversification reduces investment risk, not insurance risk. However, our discussion is consistent with both types of risk. In recent years a person who invested only in US equities enjoyed little risk diversification from positively correlated loss events, such as the massive sell-offs in the stock markets following the US banking crisis or the September 11 terror attacks. In more normal investment times, however, diversified investors bear less risk, as the negative events adversely affecting portions of the market do not impact all firms simultaneously.3 In keeping with the two-person risk-pooling example discussed above, we account for the positive correlation among the pool members in Equation 3 by adding the values shown to the right of the plus sign. To simplify calculations, Equation 3 assumes that pool members have equal standard deviations, the correlations of the losses across all pool members are the same, and losses are equally weighted. For more details about Equations 2 and 3, see William F. Sharpe, Investments, 2nd ed. (Prentice Hall, 1981); Neil A. Doherty, Integrated Risk Manage-ment: Techniques and Strategies for Managing Corporate Risk (McGraw-Hill, 2000).4 This discussion is based on the risk-pooling example found in chapter 5 of Mark S. Dorfman & David A. Cather, Introduction to Risk Management and Insurance, 10th ed. (Prentice-Hall, 2012).
Table 1: The Effect of Increasing Pool Size on Risk Diversification

The CIP Report September 2014
4
On the other hand, risk pools consisting of positively correlated losses do not offer similar levels of risk reduction. For example, com-parisons between columns 2 and 3 indicate that as pool size increases, the SDPML will decrease but remain fairly large in pools exhibiting correlation equal to 0.1. Even with unlimited pool sizes, the value of the SDPML never falls below $9,486 for pools with correlated losses, as compared to the SDPML approaching zero in pools of independent policy-holders. Unlike column 2, insurers cannot diversify away the cost of risk if losses are positively corre-lated. Consequently, insurers should include a larger risk charge in their premium calculations if losses are positively correlated.
Correlated Losses and the Insurability of Hurricane Damages
Understanding that positive cor-relation limits diversification in risk pools provides valuable insight about the role that private insurance can play in dealing with large-scale loss events. For example, consider the losses resulting from hurricanes, a potentially catastrophic event that has prompted much confusion about insurance coverage over the years. Two major types of losses oc-cur during a hurricane: wind dam-age and flood damage. Commercial insurers have historically provided coverage for wind damage claims from hurricanes, in part because
(Continued from Page 3)
the number of people needing wind coverage across the country is very large. Although people living in hurricane-prone areas need coverage from wind damage, customers in states with exposure to tornadoes or similar storm risks also need protec-tion, resulting in a huge national market for windstorm coverage. Insurers have thus been able to use risk pooling to offer protection from windstorm events, although the increased severity of recent hurricanes has prompted insurers to reconsider selling coverage in certain geographic areas.
In contrast to windstorm damage, the risk of flood damage is more dif-ficult to diversify in insurance risk pools due to positively correlated losses. The geographic area damaged by flooding in a hurricane is often much larger than the area damaged by wind. Perhaps equally important, however, is the limited size of the potential customer base wishing to buy flood insurance. Compared to windstorm protection, a smaller percentage of the US population feels a need to buy flood insurance, and those people who choose to buy it are often located in areas with high probabilities of suffering a loss, like coastlines or floodplains. As a result, private insurers cannot attract enough buyers of flood insurance to effectively diversify risk across their risk pools at reasonable prices.
Because windstorm risk is more readily diversifiable and flood risk
suffers from positively correlated losses, property insurers cover the windstorm damage from hur-ricanes, but exclude flood damage from coverage. This practice is problematic. It is often difficult to differentiate between flood and windstorm losses if a property is completely destroyed. Additionally, the general public is often unaware that property insurers follow this claim settlement practice until after a loss occurs, with denials of claims resulting in lawsuits and proposals for changes in insurance laws and regulation.5
Implications
Positively correlated losses result not only from hurricanes, but from a variety of other loss events, includ-ing earthquakes, floods, or terrorist attacks. Thus, to the extent that officials have responsibility to plan for such events, they must do so understanding that commercial in-surers often cannot use risk pooling to effectively deal with these risks.v
Dave Cather is a professor with the Penn State University’s Smeal Col-lege of Business. Prior to his current position, Dr. Cather taught at the Wharton School at the University of Pennsylvania. He has also held teach-ing positions at Temple University and Bowling Green State University.
5 For an example of the complexity involved in sorting out insurance claims from hurricanes, see Insurance Information Institute, Hurricane Sandy FAQs: What is Covered Or Not In Your Insurance Policies (Nov. 2, 2012), available at http://www.iii.org/press-release/hurricane-sandy-faqs-what-covered%C2%97or-not%C2%97-your-insurance-policies. For a discussion of the regulatory and legislative responses prompted by severe hurricanes during the mid-2000s, see David J. Rosenberg, et. al., Insurance Industry Woes in the Aftermath of Hurricanes Katrina & Rita, 73 Defense Counsel Journal 141 (2006), available at http://heinonline.org/HOL/Page?handle=hein.journals/defcon73&div=27&g_sent=1&collection=journals#143.

The CIP Report September 2014
5
In North America, the growth in energy needs is resulting in a marked increase in the transporta-tion of dangerous goods (TDG).1 Emily Bentley provides a very clear explanation of this situation and the increased risks resulting therefrom.2
TDG has become an alarming problem, especially for civil security authorities, who must ultimately manage the consequences of any accidents that may happen. Recent events, such as the tragedy in Lac-Mégantic, Quebec in July 20133, the accident in North Dakota in December 20134, and the accident in Plaster Rock, New Brunswick in January 20145, illustrate the disas-trous effects such accidents can have on human beings and the environ-ment, and the scope of the efforts required to manage these situations and restore the affected sites.
TDG also represents a significant risk for critical infrastructures (CIs). Railway tracks often cross regions or municipalities, where they adjoin
many kinds of equipment that may be essential for the functioning of CIs. Moreover, it is not uncommon to see power lines or telecom-munications cables running beside railways so they can benefit from the existing right-of-way. Thus, a rail accident could have harmful consequences not only inside the radius of impact but also outside it because of the potential domino effects that may result.
This paper presents a methodol-ogy for the speedy and system-atic identification of TDG-related vulnerabilities affecting equipment integrated into CIs, in view of the fact that this step is the starting point for risk analysis and manage-ment methods.
Method for identifying CIs’ Vulnerability to TDG
Several studies of TDG-related risks can be found in the literature. Most of them aim to prevent accidents
related to the TDG by presenting best practices, choices of itineraries, or risk analyses based on the conse-quences for the population and the environment.6 These approaches often involve a first phase in which corridors are drawn along railway tracks corresponding to the radius of impact as a function of different accident scenarios. It is then de-termined whether sensitive infra-structures/equipment are located in these corridors. The down side of this approach is that numerous simulations must be carried out before the presence or absence of infrastructures/equipment belong-ing to CIs within these corridors is verified. Moreover, the vulnerability of a given infrastructure to this kind of accident greatly depends on its structural properties, so the mere fact that an infrastructure is located within a railway corridor does not necessarily mean it is in danger.
The approach presented in this
Identifying Critical Infrastructures’ Vulnerability to theTransportation of Dangerous Goods
(Continued on Page 6)
by Benoît Robert, Christian Delvosalle, Joachim Nourry, and Luciano Morabito*
1 Association of American Railroads, AAR Reports Increased Weekly Rail Traffic (March 27, 2014), available at https://www.aar.org/newsande-vents/Freight-Rail-Traffic/Pages/2014-03-27-railtraffic.aspx#.VBhxQlepR6Y; Railway Association of Canada, 2013 Rail Trends (April 17, 2014), available at http://www.railcan.ca/publications/trends. 2 See Emily Bentley, Rail Transport of Crude Oil and the Evolving Nature of Risk, 12(9) THE CIP REPORT, at 9 (March 2014), available at http://cip.gmu.edu/wp-content/uploads/2013/06/March-2014_Emergency-Management3.pdf. 3 TIMELINE : Lac-Mégantic Rail Disaster: Explosion Heavily Damages Quebec Town, CBC NEWS (accessed Sept. 16, 2014), available at http://www.cbc.ca/news2/interactives/timeline-lac-megantic/. 4 Steve Almasy, North Dakota Train Collision Ignites Oil Cars; Fire to Burn Out, CNN U.S. (Dec. 30, 2013), available at http://www.cnn.com/2013/12/30/us/north-dakota-train-fire/. 5 Kate Schwass-Bueckert, Fire Still Burning, Homes Evacuated at New Brunswick Derailment, NEWS CANADA (Jan. 8, 2014), available at http://www.torontosun.com/2014/01/08/nb-train-derailment-investigators-will-search-for-clues-to-what-caused-train-to-derail-catch-fire. 6 B. Fabiano, et. al., A Framework for Risk Assessment and Decision-Making Strategies in Dangerous Good Transportation, 93 JOURNAL OF HAZARDOUS MATERIALS 1 (2002), available at http://www.sciencedirect.com/science/article/pii/S0304389402000341/pdf?md5=d746b64a684f1064bd989110807fd0da&pid=1-s2.0-S0304389402000341-main.pdf; P. Leonelli, et. al., Hazardous Materials Transportation: A Risk-Analysis-Based Routing Methodology, 71 JOURNAL OF HAZARDOUS MATERIALS 283 (2000), available at http://www.science-direct.com/science/article/pii/S0304389499000849/pdf?md5=c83ea0d6b10044d8f1540b878c9d970f&pid=1-s2.0-S0304389499000849-main.pdf; Center for Chemical Process Safety, Guidelines for Chemical Transportation Risk Analysis (Wiley-AIChE, 1995).

The CIP Report September 2014
6
approximate overpressure value to them.
The infrastructures/equipment to be analyzed may be selected based on their criticality or on the conse-quences for the public, economic activity, or other CIs via domino effects. The process may also be systematic—analyzing all of a CI’s equipment on a given territory in order to obtain an overall picture.
Step 2 – Dangerous goods and radii of impact
The second step in the approach involves identifying the danger-ous goods to be considered in the analysis and assessing the radius of impact associated with their explosion. To do this, the Centre Risque & Performance at Polytech-nique Montréal, along with the Research Institute for the Science and Management of Risks at the University of Mons, have developed generic charts that make it possible to quickly associate a dangerous material with its overpressure effects and radius of impact (Figure 1)8. The use of such charts during the vulnerability identification phase is justified since the calculations that are performed focus on the deter-mination of orders of magnitude, which must be refined by subse-quent analyses.
The chart in Figure 1 was created
(Continued on Page 7)
The consequences for an infra-structure from the explosion of a dangerous good vary depending on the intensity of the overpressure and the thermal radiation. In this paper, only the effects of overpressure are considered. However, the same approach could be applied to deal with thermal radiation.
The first step in the approach involves listing the infrastructures/equipment belonging to CIs that are located in the geographic zone being studied and determining their resistance to overpressure. In the vulnerability identification phase, an empirical approach is proposed to determine an infrastructure’s resistance to explosions, based on various works.7 These overpressure values represent an order of magni-tude and have been adapted to the CIs’ specific equipment, but they could be further refined by experts working with CI operators. Table 1 presents examples of the typical kinds of infrastructure/equipment belonging to CIs and assigns an
paper is intended to optimize preliminary studies by strengthen-ing and systematizing the phase in which vulnerabilities are identified. The goal is to make the information resulting from accident simula-tions more accessible to people who are not experts in the field but who are involved in managing the risks related to CIs and protecting public health and safety. The ap-proach promoted here addresses the problem in reverse. Infrastructures/equipment are first identified. Then, a rapid analysis of their structure de-termines their general resistance to overpressure. Finally, a geographic analysis determines whether or not each infrastructure/equipment risks being affected by the explosion of a dangerous good transported by railway.
The steps of the approach are described in the following sections.
Step 1 – CIs’ infrastructures and equipment and their resistance to overpressure
(Continued from Page 5)
7 Sam Mannan, Lee’s Loss Prevention in the Process Industries: Hazard Identification, Assessment and Control, 3rd ed. (Butterworth-Heinemann, 2005); Ernesto Salzano & Valerio Cozzani, A Fuzzy Set Analysis to Estimate Loss Intensity Following a Blast Wave Interaction with Process Equipment, 19 JOURNAL OF LOSS PREVENTION IN THE PROCESS INDUSTRIES 343 (2006), available at http://www.sciencedirect.com/science/article/pii/S0950423005001543/pdf?md5=e0b2b15e2dd415f947c0dc2ef6822062&pid=1-s2.0-S0950423005001543-main.pdf. 8 M. Christian Delvosalle & M. Benoît Robert, Vulnérabilité Des Infrastructures Essentielles aux Risques Technologiques Majeurs, Symposium on Civil Security (Feb. 2014), available at http://www.securitepublique.gouv.qc.ca/securite-civile/securite-civile-quebec/activites-evene-ments/colloque-sci/colloque-2014/13847.html.

The CIP Report September 2014
7
for several materials that are nor-mally carried by train in two seasons (summer and winter). The mean ambient temperatures considered are 25°C in summer and -10°C in winter. Three different overpres-sure values were modeled (80mbar, 100mbar, and 140mbar). The volume of material considered is the amount contained in a DOT-111 type railcar. These are the cars most commonly used to transport these kinds of goods (approximately 80 percent of cars carrying dangerous goods in Canada are of this type; 70 percent in the U.S.).9 The tool used to calculate radii of impact was ALOHA.10
Step 3 – Geographic analysis and identification of vulnerabilities
(Continued from Page 6)
The third step in the approach involves doing a field analysis. Two kinds of analyses may be used: the vulnerability of one infrastructure/equipment to several materials or of many infrastructures/equipment to a single material. These two kinds of analyses will be presented using examples adapted from studies car-ried out in Montreal, but the actual data have been modified to protect confidential information.
1. Vulnerability of one infrastruc-ture/equipment
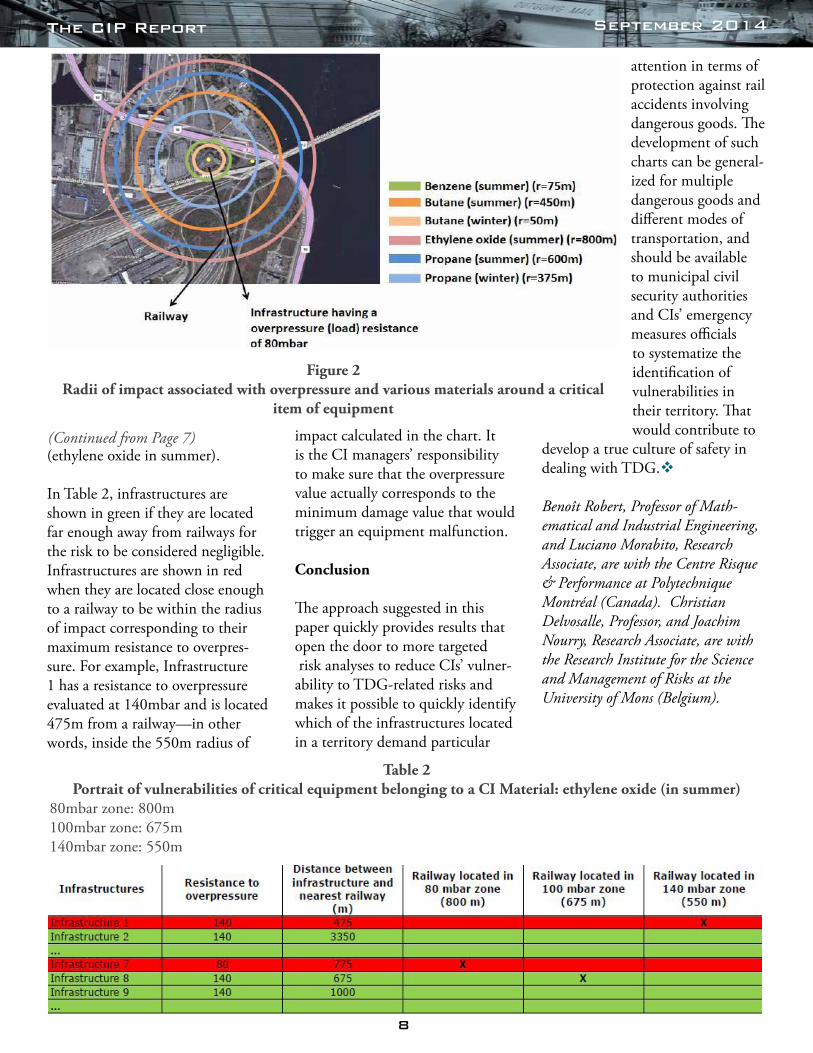
CI managers must identify the infrastructure/equipment to be ana-lyzed and locate it geographically. Radii of impact around the equip-ment are determined by using Table 1 and Figure 1. Figure 2 presents
an example of such an analysis for an electric substation located near a railway track. This equip-ment is able to resist an 80 mbar overpressure. With this informa-tion, we can draw radii of impact associated with different material around the infrastructure.
The cartographic analysis reveals that this infrastructure is vulner-able to three kinds of goods transported in DOT-111 type tank cars: butane (in summer); propane (in summer and winter); and ethylene oxide (in summer). On the other hand, it is not vul-nerable to the transportation of benzene (in summer and winter) or butane (in winter). These vulnerabilities can be identified quickly, making it possible to
focus the subsequent risk analyses on specific materials and better delimit accident scenarios. Aware-ness of which dangerous goods are really transported on these railways will also make it possible to assess the probability of an accident.
2. Vulnerability of several infra-structures/equipment
The analyses for a specific infra-structure/equipment can be general-ized to a set of equipment belong-ing to one or more CIs to obtain an overall portrait of vulnerabilities on a territory. Table 2 presents partial results of the analyses carried out for all the critical equipment belong-ing to a CI regarding one material
(Continued on Page 8)
Figure 1Chart associating dangerous goods, overpressure, and radius of impact for a
DOT-111 type railcar and a region such as Montreal
9 Association of American Railroads, AAR Reports Increased Weekly Rail Traffic (March 27, 2014), available at https://www.aar.org/news-andevents/Freight-Rail-Traffic/Pages/2014-03-27-railtraffic.aspx#.VBhxQlepR6Y; Paul L. Stancil, DOT-111 Tank Car Design, NATIONAL TRANSPORTATION SAFETY BOARD (Feb. 17, 2012), available at http://www.ntsb.gov/news/events/2012/cherry_valley/presentations/Hazardous%20Materials%20Board%20Presentation%20508%20Completed.pdf.10 U.S. Environnemental Protection Agency, CAMEO: Downloading, Installing and Running ALOHA (accessed Sept. 16, 2014), available at http://www2.epa.gov/cameo/cameo-downloading-installing-and-running-aloha.
The CIP Report September 2014
8
(ethylene oxide in summer).
In Table 2, infrastructures are shown in green if they are located far enough away from railways for the risk to be considered negligible. Infrastructures are shown in red when they are located close enough to a railway to be within the radius of impact corresponding to their maximum resistance to overpres-sure. For example, Infrastructure 1 has a resistance to overpressure evaluated at 140mbar and is located 475m from a railway—in other words, inside the 550m radius of
impact calculated in the chart. It is the CI managers’ responsibility to make sure that the overpressure value actually corresponds to the minimum damage value that would trigger an equipment malfunction.
Conclusion
The approach suggested in this paper quickly provides results that open the door to more targeted risk analyses to reduce CIs’ vulner-ability to TDG-related risks and makes it possible to quickly identify which of the infrastructures located in a territory demand particular
attention in terms of protection against rail accidents involving dangerous goods. The development of such charts can be general-ized for multiple dangerous goods and different modes of transportation, and should be available to municipal civil security authorities and CIs’ emergency measures officials to systematize the identification of vulnerabilities in their territory. That would contribute to
develop a true culture of safety in dealing with TDG.v
Benoît Robert, Professor of Math-ematical and Industrial Engineering, and Luciano Morabito, Research Associate, are with the Centre Risque & Performance at Polytechnique Montréal (Canada). Christian Delvosalle, Professor, and Joachim Nourry, Research Associate, are with the Research Institute for the Science and Management of Risks at the University of Mons (Belgium).
Figure 2Radii of impact associated with overpressure and various materials around a critical
item of equipment
Table 2Portrait of vulnerabilities of critical equipment belonging to a CI Material: ethylene oxide (in summer)
80mbar zone: 800m 100mbar zone: 675m 140mbar zone: 550m
(Continued from Page 7)

The CIP Report September 2014
9
The U.S. Department of Transportation (DOT) attracted significant attention this summer when it issued an Emergency Order mandating that railroads report the transport of crude oil extracted from the Bakken formation, a geological feature found underneath portions of Montana, North Dakota, Saskatchewan, and Manitoba.1 This order comes in the wake of high profile derailments of trains carrying Bakken crude in Lac-Mégantic, Quebec in 2013 and in Lynchburg, Virginia earlier this year. DOT determined that the transport of Bakken crude constituted an imminent hazard and rail carriers were required to provide information to State Emergency Response Commissions (SERCs). If the information was not provided, DOT would not allow the rail carriers to operate.
State governors and other elected officials are also exploring state-specific options to address the increased amount of Bakken crude that is being transported through
state areas. Washington State Governor Jay Inslee mandated that his state agencies assess the safety of oil by rail transport and provide an initial report by October 1, 2014.2 California Assemblyman Roger Dickinson drafted legislation that is currently under review by Governor Jerry Brown which will require greater transparency of information.3 If a Lac-Mégantic-type accident occurs again, state and local response assets, rather than federal assets, will be first on scene, and local officials want to make sure that they are properly prepared to respond.
The DOT order and the various state actions overlap with the jurisdiction of the Transportation Security Administration (TSA), the federal agency responsible for rail security, which has been silent about Bakken crude to date. This paper will examine the current federal laws that can be relied on by state and local officials to gain more information from TSA about the transport of Bakken crude.
Aviation and Transportation Security Act
After the September 11, 2001 attacks, Congress created TSA. The agency is best known for its airport screeners. The agency, however, also has jurisdiction over rail security. The law that creates TSA is the Aviation and Transportation Security Act (ATSA).4 By adding the “and,” Congress demonstrated its intent to create an agency that has jurisdiction over all modes of transportation, including freight rail.
Congress specifically stated in ATSA that TSA is responsible for the security of “all” modes of transportation.5 There are no statutory limitations; Congress did not say TSA is responsible for one mode and not another. Instead, Congress used the term “all” when it tasked TSA with coordinating domestic transportation during times of emergency, “including
(Continued on Page 10)
Freight Rail: Bakken Crude and the 9/11 Act
1 U.S. Department of Transportation, Emergency Order: Petroleum Crude Oil Railroad Carriers, Docket No. DOT-OST-2014-0067 (May 7, 2014), available at http://www.dot.gov/briefing-room/emergency-order. 2 State of Washington, Office of the Governor, Directive of the Governor 14-06: Oil Transport (June 11, 2014), available at http://governor.wa.gov/office/directives/2014/dir_14-06.pdf. 3 California Legislative Information, AB-380: Spill Response for Railroads, LEGINFO.LEGISLATURE.CA.GOV, available at http://leginfo.legislature.ca.gov/faces/billNavClient.xhtml?bill_id=201320140AB380&search_keywords=. 4 Aviation and Transportation Security Act, PUB. L. NO. 107-71, 107TH CONG., § 114 (2001), available at https://www.google.com/url?sa=t&rct=j&q=&esrc=s&source=web&cd=2&cad=rja&uact=8&ved=0CCkQFjAB&url=https%3A%2F%2Fwww.tsa.gov%2Fsites%2Fdefault%2Ffiles%2Fpublications%2Fpdf%2Faviation_and_transportation_security_act_atsa_public_law_107_1771.pdf&ei=NP8aVKmqKoP2yQTLgYLQCw&usg=AFQjCNHTBgUWr5g9iyjuLX7BIuD6IMPhDQ&sig2=B_Oi5ImwwCO3K3_LZ0v0MQ&bvm=bv.75097201,d.aWw. 5 Ibid. at § 114(d).6 Ibid. at § 114(g)(1)(A).
by K. Denise Rucker Krepp*

The CIP Report September 2014
10
aviation, rail, and other surface transportation.”6
Implementing Recommendations of the 9/11 Commission Act
The creation of TSA did not stop terrorists from attempting to attack U.S. aviation targets. Richard Reed tried to blow up a plane with a shoe bomb in December 2001.7 In 2006, the British government uncovered a plot to smuggle liquids on planes and then detonate them over the Atlantic Ocean.8 As a result, TSA devoted the majority of its resources to foil these attempts and enact more security measures at airports around the country.
However, aviation attacks were not the only terrorist attacks on transportation systems during the early 2000s. In 2004, terrorists killed 191 people when they bombed commuter trains in Madrid.9 A year later, 52 people died in the London train
bombings.10 Almost 200 people died in the Mumbai train bombings in 2006.11 Terrorists were exploiting gaps in rail networks, and security officials around the world scrambled to address them.
In the United States, Congress passed the Implementing Recommendations of the 9/11 Commission Act of 2007 (9/11 Act)12. According to then-Chairman Jim Oberstar of the House of Representatives’ Transportation and Infrastructure Committee, “(i)nvestments to enhance the security of our nation’s surface transportation systems have not kept pace with the needs. Last year, the Federal Government invested $4.7 billion in aviation security improvements, while spending only $136 million on transit and rail security, even though five times as many people take trains as planes every day. . . Passage of a robust rail and public transportation security bill by the House of Representatives is long overdue.”13
The 9/11 Act established the relationship between the Department of Homeland Security (DHS) and TSA. When TSA was created, it was part of DOT. In March 2003, DHS opened its doors and TSA became part of the new department. Section 1310 of the 9/11 Act states that the DHS Secretary is the “principal Federal official responsible for transportation security.”14 The TSA Administrator reports to the Secretary of Homeland Security.
Second, the 9/11 Act mandated for the first time that rail carriers conduct vulnerability assessments, draft a rail security plan, and then submit this plan to DHS for approval.15 These plans must include “identification of steps taken with State and local law enforcement agencies, emergency responders, and Federal officials to coordinate security measures and plans for response to a terrorist attack.”16 By adding this language
7 Shoe Bomber: Tale of Another Failed Terrorist Attack, CNN (Dec. 25, 2009), available at http://www.cnn.com/2009/CRIME/12/25/richard.reid.shoe.bomber/. 8 U.S. Department of Homeland Security, Transportation Security Administration, UK 2006 Liquid Explosives Plot Trial Overview, available at http://www.tsa.gov/press/releases/2008/09/08/uk-2006-liquid-explosives-plot-trial-overview. 9 Madrid Train Attacks, BBC NEWS, available at http://news.bbc.co.uk/2/shared/spl/hi/guides/457000/457031/html/. 10 7 July London Attacks, THE GUARDIAN, available at http://www.theguardian.com/uk/july7. 11 Saritha Rai & Somini Sengupta, Series of Bombs Explode on 7 Trains in India, Killing Scores, THE NEW YORK TIMES (July 12, 2006), available at http://www.nytimes.com/2006/07/12/world/asia/12india.html?pagewanted=all&_r=0. 12 Implementing Recommendations of the 9/11 Commission Act of 2007, PUB. L. NO. 110-53, 110TH CONG. (2007), available at http://www.gpo.gov/fdsys/pkg/PLAW-110publ53/pdf/PLAW-110publ53.pdf. 13 U.S. House of Representatives, Committee on Homeland Security Press Room, Landmark Rail and mass Transit Bill Passes House (March 26, 2007), available at http://chsdemocrats.house.gov/press/index.asp?ID=194&SubSection=0&Issue=0&DocumentType=0&PublishDate=0. The 9/11 Act incorporates the rail provisions of H.R. 1401, “Rail and Public Transportation Security Act of 2007.” The quote from then Chairman Oberstar was released when the House of Representatives passed H.R. 1401.14 Implementing Recommendations of the 9/11 Commission Act of 2007, PUB. L. NO. 110-53, 110TH CONG., § 1310 (2007), available at http://www.gpo.gov/fdsys/pkg/PLAW-110publ53/pdf/PLAW-110publ53.pdf. Section 1310 of the 9/11 Act references a 2004 Memorandum of Understanding (MOU) between DHS and DOT. A copy of the MOU can be found at http://ntl.bts.gov/lib/48000/48100/48110/Memorandum_Of_Understanding_between_the_Department_of_Homeland_Security_and_the_Department_of_Transportation_on_Roles_and_Responsibilities.pdf. 15 9/11 Act § 1512, available at http://www.gpo.gov/fdsys/pkg/PLAW-110publ53/pdf/PLAW-110publ53.pdf.16 Ibid.
(Continued from Page 9)
(Continued on Page 11)

The CIP Report September 2014
11
Congress created the expectation that DHS will communicate with local officials before approving the rail plans.
Questions about the rail security plan have been raised in the aftermath of Lac-Mégantic. Specifically, local officials want to know if the DHS rail security plans address gaps exposed by the Canadian accident. Washington, D.C., transportation officials testified on September 8, 2014 before the Council of the District of Columbia that they did not review rail carriers’ security plans as TSA did not require them to do so. Councilmembers expressed surprise by this lack of local oversight given the possibility of hazardous material like Bakken crude being transported through the city.17 Councilmembers asked several questions about the role local officials have in reviewing the plans, and similar questions are being asked around the country.
The 9/11 Act established the role of state and local officials in the review of rail security plans. Specifically, Congress stated that DHS “shall consult with railroad carriers, nonprofit employee labor organizations representation railroad employees, and public safety and law enforcement officials.”18 State and local officials may use this authority to request copies of the rail security plans that cover their jurisdictions. They also have
the authority to ask TSA how rail carriers are preparing for a Lac-Mégantic-type event, because although Lac-Mégantic was an accident it also exposed security weaknesses that are supposed to be addressed in rail carriers’ security plans.
Lastly, to ensure state and local officials are integrated into rail-security exercises, the 9/11 Act directs DHS to establish a rail carrier exercise program to assess and improve the capabilities of railroad carriers, emergency response providers, and federal, state, and local agencies.19 DHS is also required to share the best practices learned from the exercises with state and local officials. Under this directive, officials may request that TSA work with the rail carriers to develop security exercises based on Lac-Mégantic and Lynchburg. The information gained can then be used to advise these officials how to prepare for such an incident.
Conclusion
The transport of Bakken crude by rail triggers the jurisdiction of both the Departments of Homeland Security and Transportation. Working together, they have the authority to share with state and local officials more information regarding rail carrier vulnerability assessments, rail security plans, and carrier exercises. The Secretary of Transportation recognized the
need for greater information when he issued the Emergency Order this summer, and the Secretary of Homeland Security, acting upon the Congressional mandates in the 9/11 Act, may do the same. v
K. Denise Rucker Krepp is a professor at Pennsylvania State Harrisburg & Pennsylvania State World Campus. She is the former Senior Counsel on the House Homeland Security Committee and the author of the rail provisions of the Implementing Recommendations of the 9/11 Commission Act.
17 Council of the District of Columbia, Reconvening of Joint Hearing on CSX Virginia Avenue Tunnel Project (Sept. 8, 2014), available at http://www.gpo.gov/fdsys/pkg/PLAW-110publ53/pdf/PLAW-110publ53.pdf. 18 9/11 Act § 1512(m), available at http://www.gpo.gov/fdsys/pkg/PLAW-110publ53/pdf/PLAW-110publ53.pdf.19 Ibid. at § 1516.
(Continued from Page 10)

The CIP Report September 2014
12
Using Decision Analysis to Construct Risk Performance Indicators
by Julia Phillips, Frédéric Petit, and Douglas Bessette*
Introduction
Facilities are growing increasingly interconnected, both with each other and with their environ-ments. To ensure their continued performance and to support the well-being of society as a whole, it is important to understand facility risks in the contexts of business continuity and emergency manage-ment. Each of these requires under-standing risk uncertainty. Charac-terizing the different components of facility risk, by using performance indicators, aids in this understand-ing. This paper reviews an approach used to estimate such indicators on the basis of facility protection and resilience measures and event consequences. The information obtained aids in analyzing exist-ing security measures at facilities and identifying ways to improve resilience and reduce vulnerability and consequences. The indicators allow for comparison of like facili-ties (e.g., commercial buildings vs. other commercial buildings) by providing managers a report on both the strengths and weaknesses of their protective posture and the resilience of their facilities in rela-
tion to similar facilities nationwide. The ultimate objective is to provide insightful information to help decision-makers make better-in-formed risk management decisions (e.g., regarding physical security, business continuity, and emergency management).
Organization & Risk Performance
Risk indicators are critically impor-tant in assisting decision-makers in the evaluation of their organizations’ and facilities’ readiness to handle crises. Although studies examining specific risks, such as economic or financial risk, have been conducted1, studies assessing the risks related to an organization in its entirety are lacking.
Some work has been conducted to assess risk indicators for nuclear power plants, refineries, and chemi-cal plants.2,3 However, these studies only propose specific indicators to assess a particular operational com-ponent, such as safety in offshore operations. Although these indica-tors are useful, it is difficult to use them for other types of facilities or for different operations. In addition,
many of these indicators are often constructed using probabilistic risk assessment4, which is extremely data-intensive and difficult to employ in information-poor envi-ronments.
In addition to these measures and methods, we recommend the devel-opment of indicators that address the performance of an organization in terms of its vulnerability and resilience to, and the consequences of, potential threats and hazards, and also the use of decision analysis, particularly value-focused thinking, to develop them.
Decision Analysis
Decision analysis is a systematic and logical set of procedures for analyz-ing complex, multiple-objective (multi-criteria) decision problems. It utilizes a “divide and conquer” philosophy in which hard to define, high-level objectives are successively divided into lower-level objectives that are more easily understood, defined, and evaluated. Decision analysis develops meaningful and
1 David M. Simpson, Disaster Preparedness Measures: A Test Case Development and Application, 17(5) DISASTER PREVENTION AND MANAGEMENT 645 (2008), available at http://www.emeraldinsight.com/doi/pdfplus/10.1108/09653560810918658. 2 K. Øien, A Framework for the Establishment of Organizational Risk Indicators, 74 RELIABILITY ENGINEERING & SYSTEM SAFETY 147 (2001), available at http://www.sciencedirect.com/science/article/pii/S0951832001000680/pdf?md5=1ad68ebb0adf135d953aff7d1b4a91fc&pid=1-s2.0-S0951832001000680-main.pdf. 3 S. Charkraborty, et. al., Risk-Based Safety Performance Indicators for Nuclear Power Plants, TRANSACTIONS OF THE 17TH INTER-NATIONAL CONFERENCE ON STRUCTURAL MECHANICS IN REACTOR TECHNOLOGY (SMIRT 17) (2003), available at http://www.iaea.org/inis/collection/NCLCollectionStore/_Public/36/071/36071683.pdf. 4 Ibid.
(Continued on Page 13)

The CIP Report September 2014
13
useful measurement scales for objec-tives, examines trade-offs among conflicting objectives, and incorpo-rates uncertainty and risk attitudes as appropriate.
Value-focused thinking follows the axioms of Multi-Attribute Utility Theory, in which a utility function can be constructed for a set of at-tributes representing the preferences of an individual.5 The value-focused technique6 uses this concept to evaluate criteria considered during decision making. An elicitation is conducted with subject-matter experts to determine the relative importance of each criterion to the overall decision.
The decision analytic approach described here consists of six itera-tive phases (see Figure 1). Explicit
in these phases is an introduction to the underlying decision theory, an outline of proposed criteria and potential scales for each criterion, a value structure (or notion of importance to the decision) for each criterion, and an overall indication of value of the programs based on the criteria for inclusion as risk performance indicators.
The Definition of Objectives and Constraints
In order to develop good risk performance indicators, there needs to be an established and agreed-upon set of objectives or goals. It is our recommendation that these objectives include reducing threat, vulnerability, consequences, and increasing resilience. Certainly, additional objectives (e.g., reducing cost and time or increasing informa-
tion sharing) can be considered.
Specification of Measurement Scales
After identifying the objectives, the next step is to develop measures that identify the degree to which each objective can be achieved. A good measure not only spans the plausible range of performance by potential alternatives, but is opera-tional (i.e., it discriminates among alternatives) and understandable.
Decision analytic approaches typically use three types of scales to capture data: natural, constructed, and proxy. Dollars are a direct measurement of cost and are thus a natural scale for any economic cost objective. Constructed scales are often created when no natural scale exists for the specific objective. For example, a five-point scale that rates comfort of care is a constructed scale. Finally, a proxy scale is used in place of a direct measurement scale when the latter is too difficult or costly to capture outright. For example, a risk assessment tool aimed to capture the overall human health impact of air pollution might measure pounds of air emissions rather than the actual effects on hu-man health (i.e., measuring pounds of emissions is used as a proxy for health effects).
As with objectives, it is important to ensure that the scale selected captures the range of values im-portant to the decision-maker, that each level in the scale is distinct such that there is no overlap, and
5 Ralph L. Keeney & Howard Raiffa, Decisions with Multiple Objectives: Preferences and Value Tradeoffs (John Wiley & Sons, 1976).6 Ralph L. Keeney, Value-Focused Thinking: A Path to Creative Decisionmaking (Harvard University Press, 1996).
Figure 1 – Development of Risk Performance Indicators
(Continued from Page 12)
(Continued on Page 14)

The CIP Report September 2014
14
that there is little ambiguity in the scale’s levels (particularly when using constructed scales).
Finally, it is important to deter-mine the value associated with (and distinct from) each level of the scale. Scales are not all linear, and value-focused thinking can be used to determine the shape of the curve that describes the value (to the individual) at each level. For example, it is generally recognized that the value of $2 million to an individual is less than twice the value of $1 million. Furthermore, the (negative) value of losing $1,000 is much greater than the (positive) value of gaining $1,000.7
Characterization of Objective Prefer-ences
After the objectives and associated scales have been agreed upon, it is necessary to determine the relative importance of each objective to the decision-maker via an elicita-tion. Relative importance can be assessed by having decision-makers swing-weight each objective. Swing-weighting asks decision-makers to attribute an importance weight to each objective based on the impor-tance of moving from that objec-tive’s worst performance to its best. These weights can be input into a utility function to help determine a “best-fit” alternative; more detail on this concept is provided below.
Creation of Alternatives
The next step consists of identifying or constructing alternatives. Each desired characteristic is represented by an objective that should be achieved to the greatest feasible extent, subject to factors such as time and cost, among others. The performance of each facility with re-spect to each of the objectives must be determined (i.e., characterized). Once this is accomplished, different combinations of specific protective and resilience measures define a pos-sible alternative.
Given the preferences within and across the objectives assessed in the previous step, it is possible to create good alternative risk perfor-mance indicators that will integrate stakeholders’ objectives and require-ments.
Prioritization of Alternatives
After alternatives are characterized, they must be prioritized, typically using either holistic ranking or the application of a utility function using swing-weights. Although both prioritization processes may appear to yield a final recommendation, often these recommendations differ; thus, they should only be used as information to aid decisions. As al-ways, a review should be conducted to ensure that each recommenda-tion makes sense and that no factors are missing from the analysis.
Sensitivity Analysis
One such review is sensitivity analysis, which enables analysts to
assess the importance of uncertain-ties in the criteria value judgments and scale measures.
Conclusion
Assessing the risk related to facility operations is not easy, and defining specific indicators that character-ize the risk to an organization in terms of protection, vulnerability, resilience, and consequences is a challenge. This paper proposes a methodology, based on traditional decision analytic principles, to create key risk performance indices. Combining these indices provides an improved risk management perspective.
This holistic view of risk, by in-tegrating all components of risk (e.g., threat/hazard, vulnerabil-ity, resilience, and consequence), promotes a proactive approach to risk management and improves facility preparation in the context of business continuity and emergency management. Ultimately, decision-makers themselves have to decide what is acceptable in terms of risk, but these methods and measures should help.
Acknowledgment
The submitted manuscript has been created by UChicago Ar-gonne, LLC, Operator of Argonne National Laboratory (“Argonne”). Argonne, a U.S. Department of Energy Office of Science laboratory,
(Continued from Page 13)
7 Daniel Kahneman & Amos Tversky, Prospect Theory: An Analysis of Decision Under Risk, 47(2) ECONOMETRICA 263 (1979), available at http://www.google.com/url?sa=t&rct=j&q=&esrc=s&source=web&cd=1&cad=rja&uact=8&ved=0CCUQFjAA&url=http%3A%2F%2Fwww.hss.caltech.edu%2F~camerer%2FEc101%2FProspectTheory.pdf&ei=TFAYVKvMKJe1yATMjYC4Bw&usg=AFQjCNGYAWPtWGWdz_B0ty1ufr2OyifaWw&sig2=oOsWg-g-P1SO6_c2oDNq1g&bvm=bv.75097201,d.aWw.
(Continued on Page 15)

The CIP Report September 2014
15
is operated under Contract No. DE-AC02-06CH11357. The U.S. Gov-ernment retains for itself, and others acting on its behalf, a paid-up nonexclusive, irrevocable worldwide license in said article to reproduce, prepare derivative works, distribute copies to the public, and perform publicly and display publicly, by or on behalf of the Government. The development of the tools presented
(Continued from Page 14)
8TH ANNUAL HOMELAND DEFENSE AND SECURITY
EDUCATION SUMMIT
Registration Now Open!
October 9-10, 2014Colorado Springs, Colorado
This year’s theme: Rethinking Infrastructure Protection: Innovative Approaches for Education
and Research
For additional information, visit: https://hsedsummit.com/
in this paper has been funded by the U.S. Department of Homeland Security Protective Security Coordi-nation Division under Contract No HSHXDC-13-X-00223. v
Julia Phillips ,Frederic Petit, and Douglas Bessette are with the In-frastructure Assurance Center in the Decision and Information Sci-ences Division of Argonne National Laboratory. Dr. Phillips is the Deputy
Director for Methodology, Dr. Petit is the Principal Infrastructure Analyst, and Douglas Bessette serves as a Deci-sion and Risk Analyst.

The CIP Report September 2014
16
A recent review of the Department of Homeland Security’s (DHS) spending on counterterrorism found little evidence of risk analysis capabilities, no attempt to describe absolute risks, and a preference to describe only relative risks.1 In general, it seems counterterrorism agencies simply identify a potential source of harm and try to do something about it, rather than systematically evaluating the likely magnitude of harm caused by a successful terrorist attack, the risk of that attack occurring, and the amount of risk reduction that can be expected from counterterrorism efforts. Without considering such factors, it is impossible to evaluate whether security measures reduce risk sufficiently to justify their costs, or whether the existing risk is already at an acceptably low level.
In this article we lay out a simple, back-of-the-envelope approach for evaluating the costs and benefits of counterterrorism spending that uses only four variables: the consequences of a successful attack; the likelihood of a successful attack; the degree to which the security measure reduces risk; and the cost of the security measure.
To illustrate this approach, we apply it to the Federal Bureau of Investigation (FBI) to assess if its counterterrorism effort reduces the terrorism risk enough to justify its cost.
A conventional approach to cost-effectiveness compares the costs of a security measure with its benefits as tallied in lives saved and damages averted. The benefit of a security measure is a multiplicative composite of three considerations: the probability of a successfulattack absent the security measure; the losses sustained in a successful attack (these two, combined, constitute the risk); and the
reduction in risk furnished by the security measure.2
This is consistent with the risk
analysis framework adopted by DHS for many applications.3 A number of steps are basic to a quantitative risk assessment, and this process is shown on the final page in this article in Figure 1.
There may be co-benefits that could be added to the benefit side of the ledger. Thus, the FBI, in the process of going after terrorists, may obtain valuable information about other crimes unrelated to terrorism, and this information may contribute to their disruption. While the FBI may not always be able to prevent attacks, its enhanced ability to apprehend terrorists quickly is a definite benefit. On the other hand, there may be opportunity costs. Increases in resources for counterterrorism may come at the expense of other FBI efforts, such as combating corruption and organized crime. We exclude co-benefits and opportunity costs from our cost-benefit calculations.
These considerations can be taken into account using a procedure known as “break-even analysis.” In this, we seek to determine what the probability of a successful
(Continued on Page 17)
Risk Assessment of the FBI’s Counterterrorism Efforts
by Mark G. Stewart and John Mueller*
1 National Research Council, Review of the Department of Homeland Security’s Approach to Risk Analysis (2010), available at http://www.google.com/url?sa=t&rct=j&q=&esrc=s&source=web&cd=3&cad=rja&uact=8&ved=0CDMQFjAC&url=http%3A%2F%2Fwww.fema.gov%2Fpdf%2Fgovernment%2Fgrant%2F2011%2Ffy11_hsgp_risk.pdf&ei=Ab4RVIeHBI2lyASk_oDgDA&usg=AFQjCNGd-dVvh2-W3jVtzntt6wAZV_qlIA&sig2=zfzmD7BeSeKTBE7AdpDMnw&bvm=bv.74894050,d.aWw. 2 Since there is no particular reason to expend funds to deal with terrorist attempts that are unsuccessful (that is, cause no damage), the equation deals with successful attacks—ones that actually do damage.3 Mark G Stewart & Robert E Melchers, Probabilistic Risk Assessment of Engineering Systems (Springer, 1997).
benefit of a security measure =
probability of a successful attack absent the security measure
×losses sustained in the successful attack ×
reduction in risk furnished by the security measure

The CIP Report September 2014
17
4 U.S. Dep’t of Justice, Federal Bureau of Investigation, Report to the National Commission on Terrorist Attacks upon the United States: The FBI’s Counterterrorism Program Since September 2001 (2004), available at http://www.google.com/url?sa=t&rct=j&q=&esrc=s&source=web&cd=1&cad=rja&uact=8&ved=0CB4QFjAA&url=http%3A%2F%2Fwww.fbi.gov%2Fstats-services%2Fpublications%2Ffbi_ct_911com_0404.pdf&ei=D78RVOyKKsShyASDhYLAAg&usg=AFQjCNFX6iJRjcO9Rd-Z5J-H4DJjiqs7EQ&sig2=Euvj_hC_SrRsjbS-kzb1hQ&bvm=bv.74894050,d.aWw. 5 U.S. Dep’t of Justice, Federal Bureau of Investigation, FY 2015 Authorization and Budget Request to Congress (2014), available at http://www.google.com/url?sa=t&rct=j&q=&esrc=s&source=web&cd=2&cad=rja&uact=8&ved=0CCUQFjAB&url=http%3A%2F%2Fwww.justice.gov%2Fjmd%2F2015justification%2Fpdf%2Ffbi-justification.pdf&ei=YL8RVOnxOMuhyAT_5YLYBA&usg=AFQjCNH0h-VDO4nB34oL4ZpxFntdVG-GeQ&sig2=vhumjWNKyGIMVIH6WyhtKA&bvm=bv.74894050,d.aWw.
terrorist attack would have to be for a security measure to begin to justify its cost. Thus, we set the cost of the security measure equal to its benefit (as defined in the equation above), leading to:
probability of a successful attack absent the security measure =
cost of the security measure/
(losses sustained in the successful attack
×reduction in risk furnished by the
security measure)
Before September 11, 2001, the FBI assigned 1,351 agents to counterterrorism tasks—at a cost of roughly $600 million in 2014.4 In the wake of 9/11, the FBI elevated counterterrorism to its highest priority. The growth in FBI counterterrorism expenditures (i.e., protecting the United States from terrorist attack) was considerable. Annual FBI counterterrorism efforts—separating them out from those devoted to counterintelligence—account for close to $3 billion (36 percent) of FBI expenditures in 2014.5
To evaluate how much the FBI reduces the risk of terrorism, we need to consider their effectiveness in deterring, disrupting, or
protecting against a terrorist attack. Because no one knows with any certainty how many attacks there might have been without the FBI’s efforts (terrorism is characteristically a rare event), it difficult to calibrate is the actual risk. However, whatever the magnitude of the risk of terrorism, the FBI probably has substantially reduced it.
Our analysis will supply a range of risk reduction estimates, but in our discussion we will assume considerable success for the FBI since it is the lead agency for investigating the crime of terrorism. We posit that by its efforts, and the quadrupling of its budget, the Bureau has succeeded in reducing risk—the consequences and/or the probability of an otherwise successful attack—by a full 90 percent. This estimate, while not unreasonable, is likely to err on the generous side. Table 1 shows an array of break-even points: the number of successful attacks in the absence of FBI’s counterterrorism measures that would need to occur each year to justify a counterterrorism budget of $3 billion per year. We display results for attacks at various levels of destruction and for various degrees of risk reduction. Central to our discussion will be the entries that are boxed in Table 1 if we assume the Bureau’s efforts reduce risk—the
consequences and/or the likelihood of such an attack—by an impressive 90 percent. Under that condition, there would have to have been six or seven Boston Marathon attacks (or the equivalent of such attacks) each year—one every two months—to begin to justify the FBI’s $3 billion budget. Alternatively, the FBI’s efforts would need to reduce the effect of one or two London-type bombings by 90 percent every two years. Or again alternatively, the FBI budget would justify itself by reducing by 90 percent a huge attack with direct and indirect damage equivalent to that inflicted by 9/11 once every 60 years.
Table 1, on the final page of this article, also shows the net benefit, or the benefit minus the cost. A high estimate of loss for 99 percent of successful attacks would be $100 million: the cost inflicted in the 2009 Fort Hood shooting in which 13 people lost their lives. The table indicates that, even if the likelihood of such an attack were 100 percent per year, the money spent to prevent or protect against the attack would not be worth the cost. If we posit that a 2005 London-type attack would occur once per year and is not deterred, foiled, disrupted, or prevented by other security measures (such as DHS, secret service, state or local
(Continued from Page 16)
(Continued on Page 18)

The CIP Report September 2014
18
police, and protective measures), a conservative threat likelihood by any measure, the net benefit of FBI counterterrorism expenditures is $1.5 billion for a 90 percent risk reduction. However, a more plausible threat on the scale of the Times Square or Boston Marathon bombings results in a net loss of over $2 billion per year—meaning that spending $1 buys less than 30 cents of benefits.
The assumption about risk reduction in all this is quite significant: if the FBI’s counterterrorism efforts only reduce the total risk of losses in a terrorist attack by 50 percent rather than 90 percent, Table 1 shows that the number of terrorist events that would need to occur nearly doubles.
Even if we assume the Bureau reduces risk by a full 100 percent, it would have to deter, prevent, disrupt, or protect against six half-billion dollar attacks per year, or more than one London-style attack every two years, to begin to justify its counterterrorism budget.6 The question then becomes: is it likely to have done so?
Some 55 terrorism cases have come to light since September
11, 2001 that involve Islamist terrorists who were apparently planning to commit, or actually did commit, violence within the United States.7 However, even in the highly unlikely event that each of the 55 plots, absent the FBI’s efforts, resulted in a terrorist act inflicting half a billion dollars in damage, there would only be a total of about four per year, fewer than the six or seven per year required to deem the FBI’s efforts cost-effective (applying the half-billion dollar loss benchmark). However, a full consideration would add in at least some of the plots that may have been disrupted by the FBI at a lower level—before reaching the point where they could be brought to court on specific terrorism charges. In addition, the efforts of the FBI together with other security measures may have deterred plots by putting some targets—the airlines and military bases, for example—out of sight for many terrorists. However, there still remain a huge number of lucrative targets available, and it is not clear why a motivated terrorist would be deterred from attacking them just because other targets have become difficult.
The risk-analytic approach applied
is designed to represent the issue in a clear, understandable, and systematic manner. It supplies decision-makers with a coherent perspective on the relevant parameters and how they interact, but it does not of itself make the decision.
We recognize that perceptions of risk and risk averseness are commonly cited as reasons to overinvest in homeland security measures. Ultimately, however, we follow guidance from the U.S. Office of Management and Budget that strongly recommend risk-neutral attitudes in decision-making. This entails using mean or average estimates for risk and cost-benefit calculations, and not worst-case or pessimistic estimates.
In the end, whatever is decided about the cost-effectiveness of the FBI’s counterterrorism efforts, they are certainly far closer to being so than many other security measures. The yearly cost for the Transportation Security Administration’s Federal Air Marshal Service is about $1.2 billion, as is the cost of its AIT/body scanner technology when fully deployed. Together, these aviation
(Continued from Page 17)
6 (cost of the security measure) / (losses sustained in the successful attack).7 John Mueller, ed., Terrorism Since 9/11: The American Cases (2014), available at http://politicalscience.osu.edu/faculty/jmueller/since.html.8 John Mueller & Mark G. Stewart, Terror, Security, and Money: Balancing the Risks, Benefits, and Costs of Homeland Security (Oxford Uni-versity Press, New York, 2011); Mark G. Stewart & John Mueller, Cost-Benefit Analysis of Advanced Imaging Technology Full Body Scanners for Airline Passenger Security Screening, 8(1) JOURNAL OF HOMELAND SECURITY AND EMERGENCY MANAGEMENT (2011), available at http://www.google.com/url?sa=t&rct=j&q=&esrc=s&source=web&cd=1&cad=rja&uact=8&ved=0CCAQFjAA&url=http%3A%2F%2Fpolisci.osu.edu%2Ffaculty%2Fjmueller%2Fait2.pdf&ei=JcARVLbeNI_-yQSq6oL4BQ&usg=AFQjCNHQHtNDEGhH8keBkf0Y3Hwxk7cjQA&sig2=GvdDRP96rTbkgylGVuMEfA&bvm=bv.74894050,d.aWw; Mark G. Stewart & John Mueller, Terrorism Risks and Cost-Benefit Analysis of Aviation Security, 33(5) RISK ANALYSIS, at 893 (2013), available at http://www.google.com/url?sa=t&rct=j&q=&esrc=s&source=web&cd=1&cad=rja&uact=8&ved=0CCAQFjAA&url=http%3A%2F%2Fpoliticalscience.osu.edu%2Ffaculty%2Fjmueller%2FFAMSraFIN.pdf&ei=nMARVLXHFtSzyAS5-oCoCA&usg=AFQjCNFXdBNx42dzBn_ZcOMTnNEMjhN23Q&sig2=68zjuf8V1W1tay2UcRJ5pw&bvm=bv.74894050,d.aWw; Mark G. Stewart & John Mueller, Aviation Security, Risk Assessment, and Risk Aversion for Public Decisionmaking, 32(3) JOURNAL OF POLICY ANALYSIS AND MANAGEMENT, at 615 (2013), available at http://onlinelibrary.wiley.com/doi/10.1002/pam.21704/pdf.
(Continued on Page 19)

The CIP Report September 2014
19
security measures are nearly as costly as the FBI’s counterterrorism efforts, but their risk reduction is negligible.8 Moreover, they only deal with specific threats associated with hijacking and body-borne bombs on aircraft. If this is the comparison, enhanced FBI expenditures would seem a preferable option: they deal with all terrorism threats, almost certainly do reduce the terrorism threat, and can be rapidly deployed or re-deployed as threats emerge or evolve. v
For additional and wider-ranging assessments of the issues raised and the approaches used, please contact the authors.
Mark G. Stewart, ARC Australian Professorial Fellow Professor and Director, Centre for Infrastructure Performance and Reliability The University of Newcastle, New South Wales, [email protected]
John Mueller, Adjunct Professor, Department of Political ScienceWoody Hayes Senior Research Scientist, Mershon Center for International Security StudiesOhio State [email protected]
(Continued from Page 18)
The Center for Infrastructure Protection and Homeland Security (CIP/HS) works in conjunction with James Madison University and seeks to fully integrate the disciplines of law, policy, and technology for enhancing the security of cyber-networks, physical systems, and economic processes supporting the Nation’s critical infrastructure. The Center is funded by a grant from the National Institute of Standards and Technology (NIST).
If you would like to be added to the distribution list for The CIP Report, please click on this link: http://listserv.gmu.edu/cgi-bin/wa?SUBED1=cipp-report-l&A=1
Figure 1
Table 1