the changing electricity sector - mile
TRANSCRIPT

The Changing Electricity Sector
CONTENTS
Introduction
Potential for Distributed Generation
Impacts of Distributed Generation
Potential for Residential Roof Top
Solar PV
Payback Period Calculation
Derived for Roof Top PV
Case Study of Bisasar Road
Landfill gas to electricity project
Conclusion
Sanjeeth Sewchurran. Pr Eng (eThekwini Electricity, UKZN)

Under – frequency load shedding, rising electricity tariffs, changing environment regulations and delays in constructing new power stations have plunged South Africa into one of its greatest challenges ever in the electricity sector.
This has lead consumers and producers alike to start
exploring various local renewable energy generation options namely distributed generation.
eThekwini Electricity is however faced with various
concerns with understanding the impact of distributed generation on the existing distribution networks.
Electricity Shortage
Residential electricity tariffs have increased by an average of 14.5% over the past 7 years

Solar Photo Voltaic (PV) (residential, commercial, industrial, solar farms)
Landfill gas to electricity (DSW, private landfills) Hydro Electricity (inlet to water reservoirs, aqueduct
pipelines) Waste Water treatment works (extract bio gas and
use for generation of electricity) Co – generation from existing processes (utilize excess
steam to generate electricity - Tongaat Hullets, NCP Alcohols)
SA is blessed with good climatic conditions

Bi – directional power flow Impact of network power quality Impact on network planning Impact on network losses Impact on network protection Metering Fault Levels Efficiency Reduce emission and pollutant Increase or reduce network congestion Network voltage profiles Power flow and control Impact Municipal revenue

Two Feasibility Scenarios With no payment for exported energy With avoided cost payment for exported energy
Three Usage Scenarios
50% generated electricity usage 75% generated electricity usage 100% generated electricity usage
Payback Period – With/Without Feed in Tariff
Tariff Increase Scenario 50% Usage 75% Usage 100 % Usage
Low (8%) >10 years –
10 years
9 years –
9 years
8 years
unchanged
Medium (11.5%) >10 Years –
9 years
9 years –
8 years
7 years
unchanged
High (14.5%) 10 years –
8 years
8 years –
7 years
7 years
unchanged
Three Electricity Tariff Increase Scenarios Low (8%) (MYPD 3 – Eskom) Medium (11.5%) High (14.5%) (Past 7 Year average)
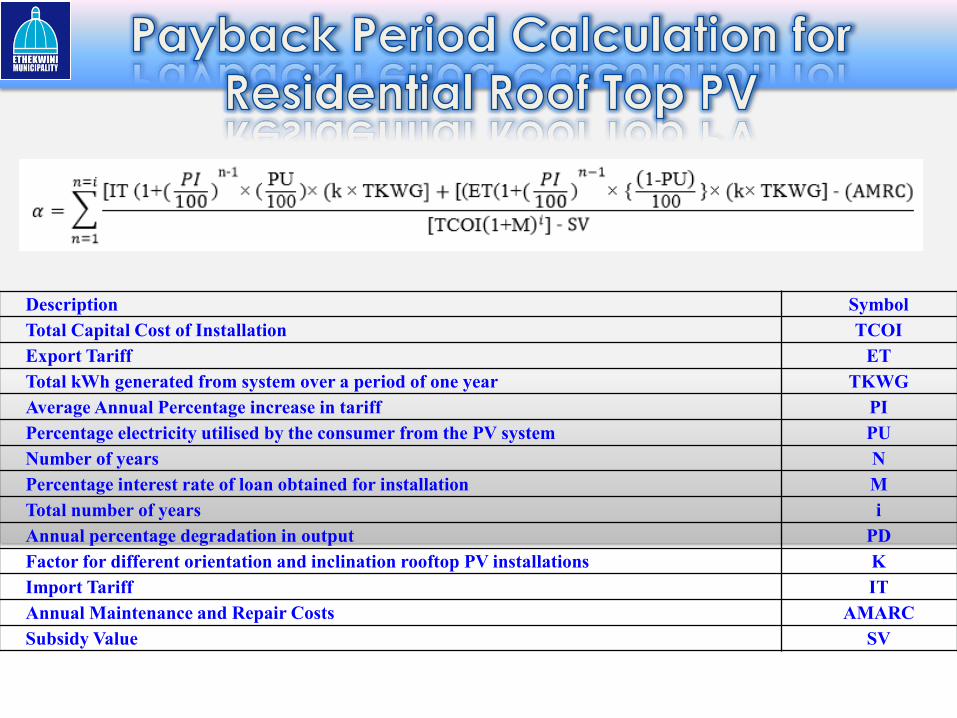
Description Symbol
Total Capital Cost of Installation TCOI
Export Tariff ET
Total kWh generated from system over a period of one year TKWG
Average Annual Percentage increase in tariff PI
Percentage electricity utilised by the consumer from the PV system PU
Number of years N
Percentage interest rate of loan obtained for installation M
Total number of years i
Annual percentage degradation in output PD
Factor for different orientation and inclination rooftop PV installations K
Import Tariff IT
Annual Maintenance and Repair Costs AMARC
Subsidy Value SV

The equation can be easily simplified as follows:
Term B = 0, if the utility does not offer any compensation
scheme for electricity exported to the grid such as a
generation export tariff or REFIT.
Term C can be simplified to C = TCOI, if no loan was
taken for the purchase and installation of the PV system.
Term D = 0, if there is no incentive or subsidy scheme
offered by the utility or country.
Term E = 0, if there is no maintenance costs or costs
incurred to replace damaged panels and inverters.
From (1), it can be seen that there are a number of
factors that can influence the payback period of rooftop
PV.
Savings from electricity
not purchased from the
grid
Revenue from electricity
exported to the grid
Total cost of installation
including interest paid
on loan
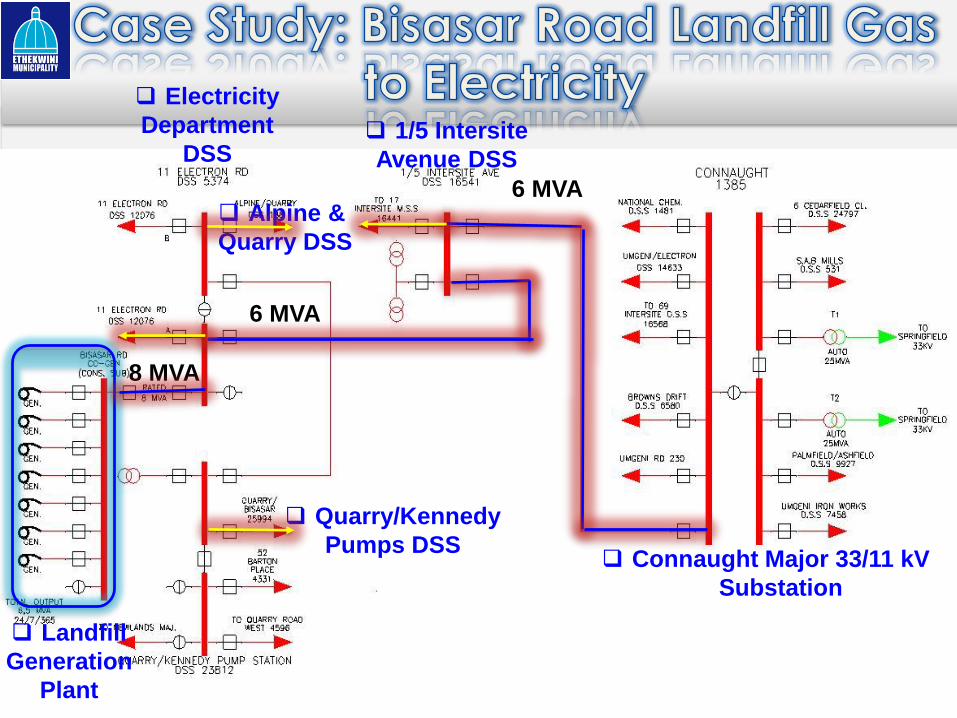
Connaught Major 33/11 kV
Substation
Landfill
Generation
Plant
Quarry/Kennedy
Pumps DSS
Alpine &
Quarry DSS
6 MVA
6 MVA
8 MVA
Electricity
Department
DSS
1/5 Intersite
Avenue DSS

Rise in single and
three phase fault
levels
Impact of
voltage with
varying in
Power Factor
Off Peak Voltage
Rise
Cable loading
exceeding
thermal
capacity of
cable

The electricity sector is changing. There is large potential in eThekwini and South Africa for the
implementation of distributed generation projects. The feasibility of roof top PV is expected to increase drastically
when the payback period reduces to 5 years and below. The current residential electricity tariffs need to be revised to
accommodate a fixed charge for network usage to ensure that Municipal revenue is not lost with the increase in roof top PV uptake.
The case study carried out indicates that there is potential
negative impacts to the local distribution networks if proper studies and not carried out prior to the implementation of these projects.
The End
Thank You
Comments & Questions???