global electricity disruption and the south african … 2017 presentations...global electricity...
TRANSCRIPT
Presented by : Paul Vermeulen
Manager, DSM and SSM
City Power Johannesburg
10 October 2017
Global electricity disruption and the
South African parallels

What’s wrong with the cash cow?
time
(years)
maximum
demand
(MW)
2014 (2034)
Projected demand growth
1
2~ 12.5
TWh
~ 25
TWh
?
By 2014, it was apparent that
electricity’s core business was unable to
generate a surplus without grants and
subsidies.....
Sustained
economic
downturn
from 2008
Spiralling
tariff
increases
Structural
changes
to the
energy
system
Consultants were engaged to
review and change the business
model.
Electricity to Energy company.......2

Global change in Power and Utilities is being
driven by numerous disruptive factors
Generation mix is shifting to cleaner
sources that include gas and
renewables with storage. Sources are
becoming more decentralized.
Customers are being offered choices to
manage their energy use and costs,
through energy efficiency measures,
distributed generation and energy
management solutions.
Smart meters, “big data” and analytics
can be used to optimize energy
delivery, improve energy efficiency
and enhance customer experiences.
Significant investment is
being made to refurbish
and expand grid assets
Federal and State mandates
are driving restructuring,
creating incentives and
imposing new rules
Regulatory compact is under pressure
to accommodate changing customer
demands e.g. trading and wheeling,
block-chain technology
Aging workforce and challenges
of the new digital economy
require effective knowledge
transfer and fresh thinking.
New viable energy mixes, mini and
micro grid options to meet the
energy needs of communities, both
rural and urban
Changing
energy mix
and DG
Empowered
customers
Digitization
Market
and policy
reforms
Regulatory
frameworks
New
Options
Skills and
diversity
Infrastructure
investment
Sector in
transformation
Source: EON Business Model
Review presentation 3

4
Understanding the implications of
technology driven disruption
The Integrated Energy Plan (IEP) and Integrated Resource Plan (IRP) remain based on centralized generation and distribution models. To include distributed options, an IRP at City level is
necessary to arrive at the true least cost option
Rapidly increasing awareness of unsustainability of current business models.
Cross-subsidization issues are taxing the inputs to the Economy instead of the outputs
Decentralization Democratization Digitization
RE Emerging as least cost
option
Decarbonisation
+
+
=
‘DDDD’ concept from ‘Wise Minds’ report:
https://www.forumforthefuture.org/sites/default/files/files/WiseMinds_Report
_FINAL_compressed.pdf
Add an
element
of:
Runaway
prices
Human
dislike of
monopolies
Industry
graft and
corruption
Billing crisis
Unjustified
cut-offs

Infrastructure Investment
As at 2014, the EDI maintenance backlog stood at R 68 billion.
NRS 048 , SAIDI and CAIDI figures continue to deteriorate
• In the years prior to the establishment of the REDs, municipalities did not want to create debt and slowed refurbishment spend
• Spend really resumed only two years after the REDs were abandoned in 2010
• The backlog is still growing
• MFMA procurement needs review–
– At odds with strategic sourcing principles, resulting in a diverse range of equipment in each asset class, complicating maintenance
– ‘Single year’ financing syndrome favours spend on big ticket items (eg. Transformers) that do not fix the problems that require engineering relationships
Contributes to ever
increasing disruption of
service delivery
DOOZY SUB
1
DOOZY SUB
2

Unsustainable SA Electricity Industry Structure
6
Eskom Generation -Large coal fleet, one nuclear, some hydro
Eskom Transmission (Incorporates the System
Operator and Single Buyer Office )
Eskom DistributionRetail Sales
Eskom Residential Customers
Municipal Residential Customer
Municipal C&I Customers
REIPPP –
Green Energy
City of Johannesburg
*8 other Metro s
*City Power Metro (SoC) Distributor
NERSA
Regulates this
part of the
industry using a
municipal
benchmarking
methodology
SALGASouth African Local
Government Association
COGTA
Department of
Cooperative Governance
and Traditional AffairsNERSA
Regulates this
part of the
industry using
Eskom Retail
Tariff and
Structural
Adjustment
Methodology
DoE – Department of Energy has oversight over the whole industry
National
Treasury
PFMA
Compact with
Eskom
DPE
Department of
Public
Enterprises .
Control over
SoEs such as
Eskom
National
Nuclear
Regulator
Eskom C&I Customers
*170 Smaller Munics
*Required to
generate a
surplus for
municipalities
.
Not required to
generate a surplus for
the City

Changing energy mix and distributed generation
7
Eskom Generation -Large coal fleet, one nuclear, some hydro
Eskom Transmission (Incorporates the System
Operator and Single Buyer Office )
Eskom DistributionRetail Sales
Eskom Residential Customers
Municipal Residential Customer
Municipal C&I Customers
REIPPP –
Green Energy
City of Johannesburg
*8 other Metro s
*City Power Metro (SoC) Distributor
SALGA and CITIESRecognize climate change
issues
TREASURY
Provides tax incentives
for EE and RE
Eskom C&I Customers
*170 Smaller Munics
✓
½ ✓
?
✓
✓
✓
NERSAApproved SSEG tariffs for
several municipalities
• SSEG tariffs allow City Power to procure surplus residential PV energy at 42 cents per kWh
• Eskom energy now costs 87 cents per kWh (2018/19 may be R1,14)
• The margin of selling surplus PV energy is 45 c/kWh better than selling Eskom power
• Without storage, 100 000 affluent residential PV customers could contribute 700 MWh of cheap energy towards the 29 000 MWh the city requires each day.
• This would be a fair contribution to the cross-subsidy needed to support the poorer residential sector
• Is this such a bad thing?
✓

Empowered Customers
National grid
Energy
Efficiency
Fuel switching
(gas)
* Solar PV
Energy storage
(UPS)
Changing Habits
Solar Water
Heating
Heat Pumps
Wind
The disruptive effects of load shedding continue today –
Continued increasing tariffs - RCA clawbacks (3 to go)
Switching stresses have reduced network reliability
Load shedding certainly taught customers a thing or two about new options....
* To date City Power has commissioned 8,4 MW

Digitization
IEDs –
Great functionality
but lifespan is
limited, 15 years
tops
Electro-
mechanical
protection-
Single purpose but
had a lifespan of
up to 60 years
First disruption –
How do we get it to work with our existing stuff?
Second disruption-
Requires ongoing upgrade and replacement
Third disruption –
Requires capital budgets to support the continuous
upgrade cycles
Fourth disruption-
Requires systems integration expertise (preferably in-
house) to preserve functionality of whatever it gets
connected to
Fifth disruption –
Moore’s law may have brought the equipment costs
down. It has not brought down the cost of engineering
resources to support continuous replacing and
upgrading
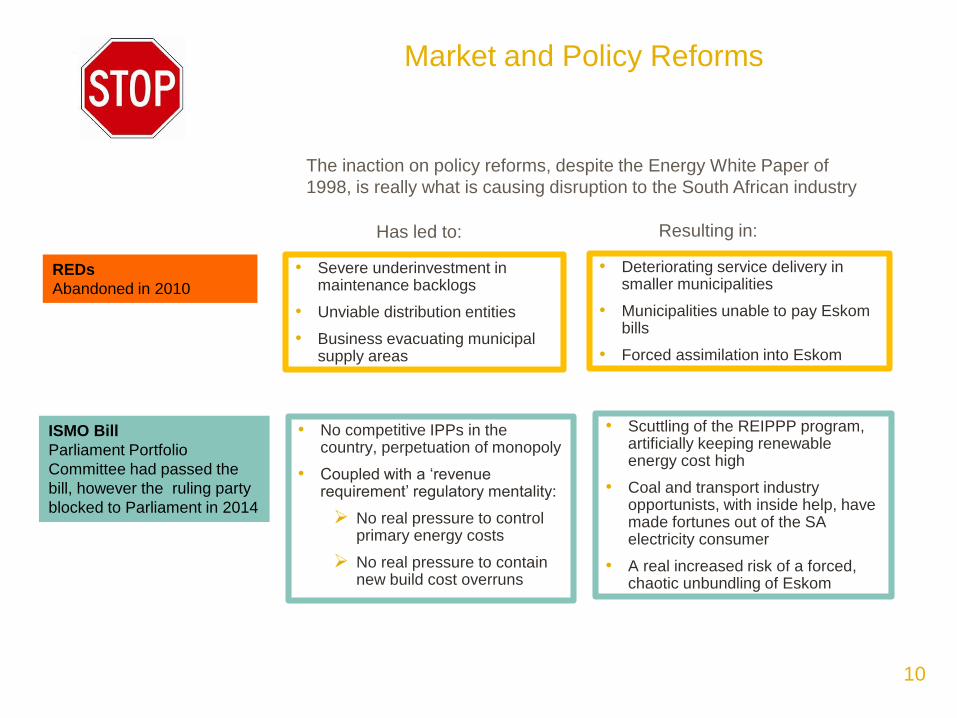
Market and Policy Reforms
10
REDs
Abandoned in 2010
ISMO Bill
Parliament Portfolio
Committee had passed the
bill, however the ruling party
blocked to Parliament in 2014
The inaction on policy reforms, despite the Energy White Paper of
1998, is really what is causing disruption to the South African industry
• Severe underinvestment in maintenance backlogs
• Unviable distribution entities
• Business evacuating municipal supply areas
• No competitive IPPs in the country, perpetuation of monopoly
• Coupled with a ‘revenue requirement’ regulatory mentality:
➢ No real pressure to control primary energy costs
➢ No real pressure to contain new build cost overruns
Has led to:
• Deteriorating service delivery in smaller municipalities
• Municipalities unable to pay Eskom bills
• Forced assimilation into Eskom
Resulting in:
• Scuttling of the REIPPP program, artificially keeping renewable energy cost high
• Coal and transport industry opportunists, with inside help, have made fortunes out of the SA electricity consumer
• A real increased risk of a forced, chaotic unbundling of Eskom

11
• City Power’s preliminary cost of supply
study determined that each residential
service connection costs R893 per
month, or over R10 000 per annum to
maintain.
• (Quick sanity check: Total operating cost
/ number of customers - R3,9 Bn / 420
000 customers = R9 285 per annum per
customer).
• The monthly amount for FBE in the
DORA is R70 per month per household.
• The shortfall is covered by a cross-
subsidy from commercial and industrial
tariffs. Eskom does the same
We are effectively taxing the inputs to the
economy, rather than the outputs to the
economy
Cross Subsidization and wholesale pricing issues
If municipal distributors were truly considered to be
distribution system operators, able to purchase at
wholesale rates, the pricing to them should be the lowest
in the table above……
Analysis of Eskom Customer Information Sheet, Integrated Report 31 March 2017
Customer Category
No of Accounts
Sales GWh
% 0f GWh Sold
Revenue R Billion
% of Revenue
Cost per kWh
Distributors 802 89 718 42,5% 73 009 40,9% 0,81
Residential 5 838 754 11 863 5,6% 14 070 7,9% 1,19
Commercial 50 956 10 339 4,9% 11 279 6,3% 1,09
Industrial 2 706 48 295 22,9% 32 701 18,3% 0,68
Mining 1 012 30 559 14,5% 25 915 14,5% 0,85
Agricultural 81 806 5 405 2,6% 7 659 4,3% 1,42
Rail 510 2 849 1,3% 2 990 1,7% 1,05
International 11 15 093 7,1% 10 682 6,0% 0,71
Total 211 272 Total 178 305 Mean 0,84

Regulatory Frameworks
Regulatory rules on small
scale embedded
generation. First issued
in September 2011
Regulatory Rules on third
party transportation of
energy. First published
2012
Delay in the promulgation of new regulations is causing problems –
• Energy source not properly considered in the IRP
• Uncertainty at the DoE and NERSA of possible impacts
• Municipalities not in agreement with key principles
➢ MV connections exempt from use of system charges
➢ Any customer and any generator can enter bi-lateral agreements
➢ Compensation must be paid to generators where network is down or vandalized
Delayed by:
• Under the radar connection to the grid
• Potential grid safety issues
• The stifling of a valuable new industry
Resulting in:
• Trading cannot be supported
• Revenues from transport of energy cannot be realized
• If implemented as is, the regulations would further aggravate revenue losses

Grid provides the Green Energy investor a place to sell
or trade their surplus energy and optimize investment
From a national
systems point of
view, the most
efficient green
energy solution
includes the
existing gridGrid enables Green Energy trading and new revenues
from ‘transport’ of energy
13
While storage is
expensive, the EDI
has a small window
of opportunity to
convince customers
of the value of the
grid
New value proposition from grid operators is to provide
backup supply and seamless load balancing services
Regulatory uncertainty may lead to a lost opportunity

New Options – the New Energy Mix
Low Income Suburb / Informal Settlement
Limited Grid Supply
M&C
M&CM&C
M&C
Utility Scale
Storage
Local Storage
Renewable
Energy - hedge
Gas provided
for cooking
energy needs
Load Management to
control non-essential
electric loads
14
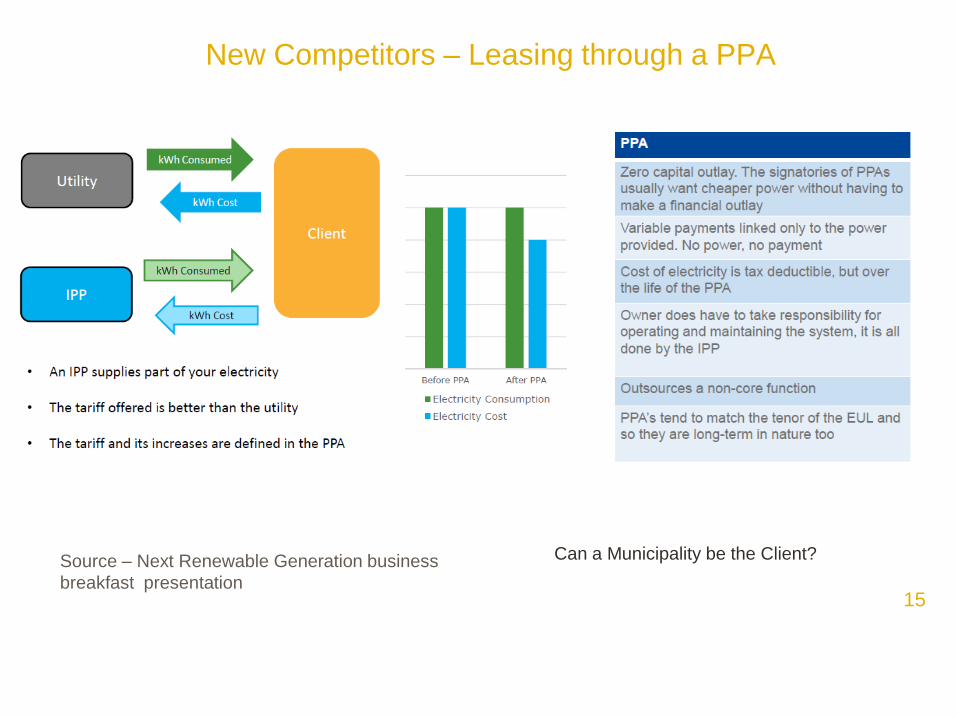
Source – Next Renewable Generation business
breakfast presentation
New Competitors – Leasing through a PPA
Can a Municipality be the Client?
15

Skills and Diversity
Today’s secondary plant technicians and engineers must be
competent in electrical engineering as well as ICT
Engineers are scarce, ICT staff are more abundant
Design bridging
courses for ICT
resources to
come into the
EDI
16

Conclusion
17
Centralized Baseload Generation Entities
Independent National Transmission and Market Operator
Viable Distribution System Operators
Residential Customers
Behind the meter generation
Behind the meter storage
REIPPP –
Green Energy
Prosumers , C&I or Residential
Oversight by a minimum
of government entities
C&I Customers
Distributed
IPPs
EIUG Customers
Consolidated Eskom and Municipal distribution
regions
• There are presently many disruptive factors affecting the EDI
• The most severe is our tarnished image and loss of credibility as a result of graft and corruption
• The slow pace of transformation is leading to an increasingly unsustainable industry
• This is heading towards a mega-disruption
• Eskom and Municipalities are both state owned enterprises, which will government have to bale out first?
• One positive note – we may have a chance to leap-frog some of the transition pains that other parts of the world have already been through
Controlled unbundling of
Eskom