the challenge of meeting freight infrastructure demands: public-private partnerships the answer? jim...
TRANSCRIPT

The Challenge of MeetingFreight Infrastructure Demands: Public-Private Partnerships the Answer?
Jim Hixon
Exec. Vice President Law & Corporate Relations
Norfolk Southern Corporation
June 2007

Overview
I. Freight Capacity Constraints and the Need for New Rail Infrastructure
II. Rail Infrastructure Economics – An Overview
III. Two PPP Models
IV. Public Benefits of Rail

Summary
Freight demand growing rapidly; more rail infrastructure needed
Both public and private investment will be required to meet future rail infrastructure needs
Federal incentives would increase private investment in rail infrastructure
More rail infrastructure would produce substantial public benefits

Major Freight Growth Projected(Domestic Tons All Modes)
90%
100%
110%
120%
130%
140%
150%
160%
2005 2010 2015 2020 2025
ATA DOT
AASHTO*
All figures indexed with each source’s 2005 traffic levels equal to 100 percent*AASHTO: American Association of State Highway and Transportation Officials

Highway Capacity Already Strained
50%
75%
100%
125%
150%
175%
200%
225%
250%
1980 1984 1988 1992 1996 2000 2004
Interstate traffic has grown
much faster than lane miles
Source: Dept. of Transportation, National Transportation Statistics
VMT perLane Mile
Vehicle MilesTraveled (VMT)
Lane Miles

More Highway Gridlock Coming
Source: Dept. of Transportation, FHWA Freight Analysis Framework
Truck Traffic
1998 2020

Rail Capacity Already Strained
0%
50%
100%
150%
200%
250%
300%
350%
1980 1984 1988 1992 1996 2000 2004
Class I Rail ton-miles have
increased dramatically without
growth in track miles
Source: Dept. of Transportation, National Transportation Statistics
Ton Miles perMile of Track
Ton Miles
Track Miles

Variety of Forces Pushing More Freight to Railroads
$1.00
$1.50
$2.00
$2.50
$3.00
Jan-
99Ja
n-00
Jan-
01Ja
n-02
Jan-
03Ja
n-04
Jan-
05Ja
n-06
Jan-
07
U.S. DieselPrices
$9
$10
$11
$12
$13
$14
2000
q220
01q2
2002
q220
03q2
2004
q220
05q2
2006
q220
07q1
Tri
llio
ns
of
Do
llar
s
U.S. GDP

Source: Census Bureau, STBAll figures based on 2002 economic census except railroads and truckingAll transportation includes NAICS 48 industries including: air, rail, trucking, water and pipeline transportationTrucking figures are 1999-2005 average for NAICS 484 based on Census Services Annual SurveyRailroad figures are 1999-2005 average based on STB R-1 filings (Class I railroads cash capital)
Capital Investment as a % of Revenue
Railroads Are Highly Capital Intensive
4.3%
4.2%
12.0%
6.2%
16.2%
0% 5% 10% 15% 20%
All Sectors
Manufacturing
All Transportation
Trucking
Railroads

Source: AAR
0
50
100
150
200
250
300
1964 1969 1973 1977 1981 1985 1989 1993 1997 2001 2005
Revenue
Volume
Productivity
Price
Staggers Act Passed Oct. 1980
U.S. Freight Railroad Performance Since Staggers
Index 1981=100

Freight Rail Investment Challenge
AASHTO (American Association of State Highway and
Transportation Officials)
issued a study in 2003 analyzing the state of freight rail capacity
concluded that freight railroad investment must grow sharply over next 20 years to maintain railroads’ share of growing freight traffic
also found that freight railroads may not be able to attract necessary investment to handle their share of growing freight demand

AASHTO Investment Goal
0
5
10
15
20
25
2000
2001
2002
2003
2004
2005
2006
2007
2008
2009
2010
2011
2012
2013
2014
2015
2016
2017
2018
2019
2020
Bill
ion
s o
f D
olla
rs
Maintain same share of freight
Meet AASHTO goal to increase share of freight carried by rail
AASHTO projected investment;reduced rail share of freight
Based on averages of AASHTO estimates adjusted for inflation
Investment needed to…

Support for AASHTO Findings
Subsequently, similar concerns about the ability of the industry to attract necessary capital have been expressed by:
CBO
Transportation Research Board
Hudson Institute
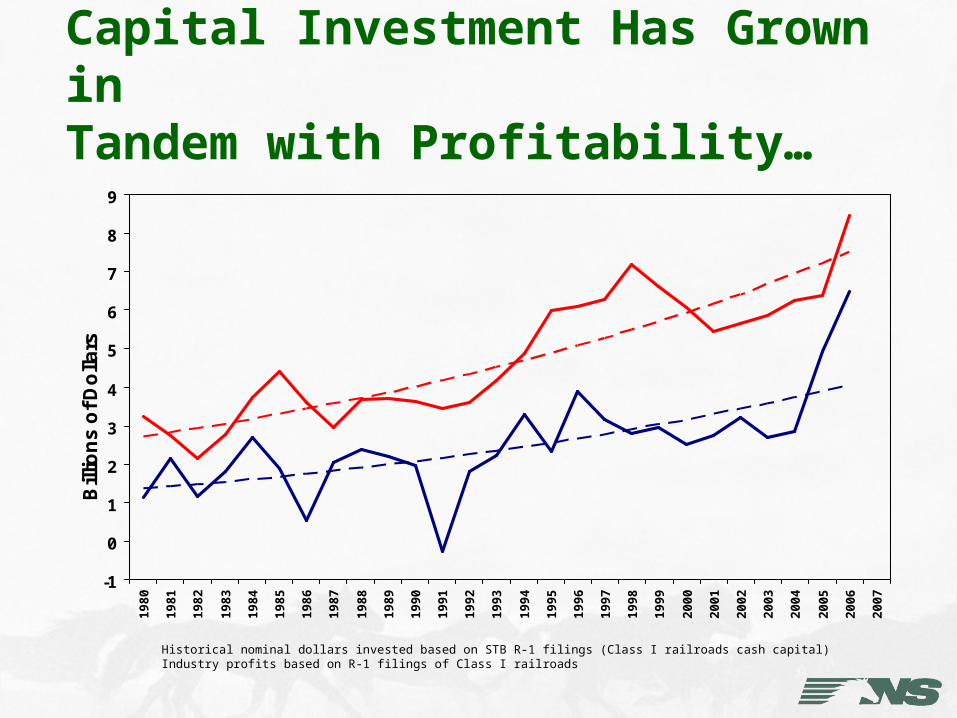
Capital Investment Has Grown inTandem with Profitability…
-1
0
1
2
3
4
5
6
7
8
9
19
80
19
81
19
82
19
83
19
84
19
85
19
86
19
87
19
88
19
89
19
90
19
91
19
92
19
93
19
94
19
95
19
96
19
97
19
98
19
99
20
00
20
01
20
02
20
03
20
04
20
05
20
06
20
07
Bill
ion
s o
f D
olla
rs
Industry Capital Investment
IndustryProfits
Historical nominal dollars invested based on STB R-1 filings (Class I railroads cash capital)Industry profits based on R-1 filings of Class I railroads

Yet Industry Capital Investment StillInsufficient to Meet AASHTO Goal
0
5
10
15
20
25
1980
1982
1984
1986
1988
1990
1992
1994
1996
1998
2000
2002
2004
2006
2008
2010
2012
2014
2016
2018
2020
Bill
ion
s o
f D
olla
rs
Maintain same share of freight
Meet AASHTO goal to increase share of freight carried by rail
Industry Capital Investment
Industry Profits
Based on averages of AASHTO estimates adjusted for inflation to nominal dollarsTrend in actual investment levels based on regression of historical nominal dollars invested (from STB R-1 filings, Class I railroads cash capital) Trend in industry profits based on regression of historical nominal profits excluding 1991 losses (from STB R-1 filings, Class I railroads)
Investment needed to…

Past Industry Capital Investment Shortfalls Will Require Even Higher Levels Than Projected
0
5
10
15
20
25
2000
2001
2002
2003
2004
2005
2006
2007
2008
2009
2010
2011
2012
2013
2014
2015
2016
2017
2018
2019
2020
Bill
ion
s o
f D
olla
rs
Maintain same share of freight
Meet AASHTO goal to increase share of freight carried by rail
Actual IndustryCapital Investment
AASHTO projected investment;reduced rail share of freight
Based on averages of AASHTO estimates adjusted for inflation to nominal dollarsActual investment levels from STB R-1 filings (Class I railroads cash capital)
Investment needed to…

0
5
10
15
20
25
2000
2001
2002
2003
2004
2005
2006
2007
2008
2009
2010
2011
2012
2013
2014
2015
2016
2017
2018
2019
2020
Bill
ion
s o
f D
olla
rs
Maintain same share of freight
Meet AASHTO goal to increase share of freight carried by rail
Actual Industry Capital Investment
Past Industry Capital Investment Shortfalls Will Require Even Higher Levels Than Projected
Necessary investment levels based on averages of AASHTO estimates adjusted for inflationActual investment levels from STB R-1 filings (Class I railroads cash capital)
Investment needed to…

An Overview
Rail Infrastructure Economics

The Fundamental Infrastructure Financing Issue Issue is not whether capital exists – capital
markets have effectively unlimited capital
Issue is the number of infrastructure projects where expected risk-adjusted investment returns meet or exceed capital costs
Much of infrastructure “need” being discussed are projects that have high returns to customers and for the country, but low returns to the railroad, at least at current pricing

Rail Infrastructure Economics
Infrastructure Investment Level
Market Return
Cost of Capital
HIGHER RETURN PROJECTS LOWER RETURN PROJECTS

Rail Infrastructure Economics
Infrastructure Investment Level
Market Return
Depressed Return
Cost of Capital
--Subsidies to competition-- Sector-specific government mandates (e.g., HAZMAT)-- Price regulation-- Risk of increased regulation
ACTUAL
HIGHER RETURN PROJECTS LOWER RETURN PROJECTS
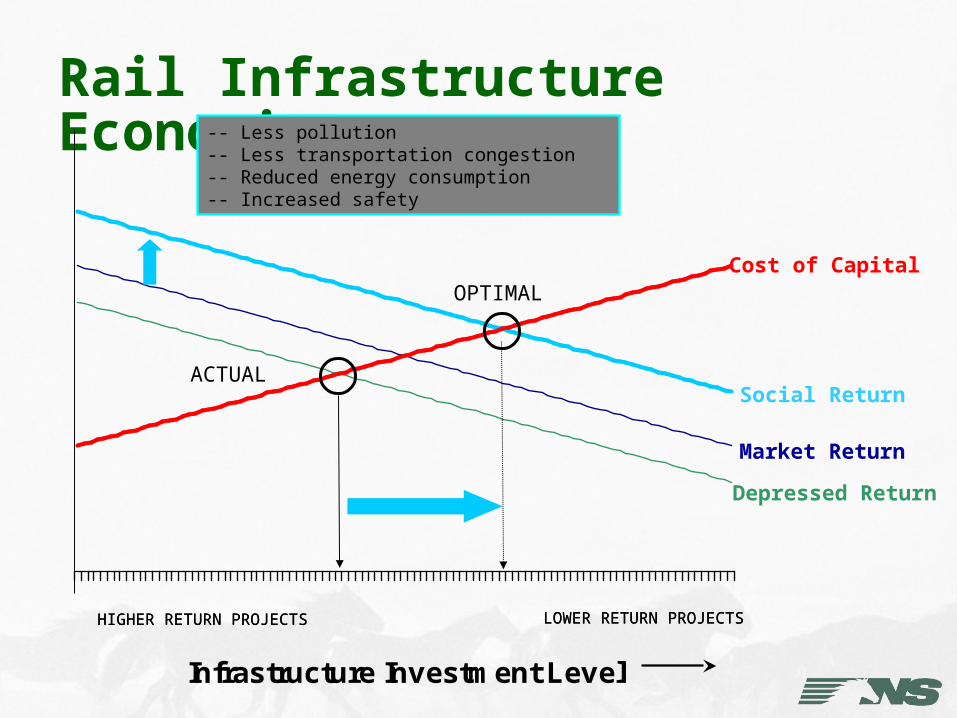
Rail Infrastructure Economics
Infrastructure Investment Level
Market Return
Depressed Return
Social Return
Cost of Capital
-- Less pollution-- Less transportation congestion-- Reduced energy consumption-- Increased safety
OPTIMAL
ACTUAL
HIGHER RETURN PROJECTS LOWER RETURN PROJECTSHIGHER RETURN PROJECTS LOWER RETURN PROJECTS

Rail Infrastructure Economics
Infrastructure Investment Level
Market Return
Depressed Return
Social Return
Cost of Capital
…Proposed
PPPs objective: Reduce gap by lowering cost of capital
PROGRESS
HIGHER RETURN PROJECTS LOWER RETURN PROJECTS

Two PPP Models
Direct Investment by BOTH the Public and the Private Sector
“Indirect” Support by the Public: Investment Tax Credits for Rail

Direct Federal Investment: Highway Bill Principal Sections
Section 1301 – Projects of National & Regional Significance Track, Technology, Facilities
Section 1702 – High Priority Projects Technology, Small Facilities
Section 11143 – Private Activity Bonds Large Facilities
Other Mechanisms [CMAQ, TIFIA, RRIF]

Heartland Corridor
ColumbusColumbus
RickenbackerRickenbacker
AshvilleAshville
HuntingtonHuntingtonKenovaKenova
PrichardPrichard
WilliamsonWilliamsonWelchWelch
BluefieldBluefield
RoanokeRoanokePetersburgPetersburg
RichmondRichmond
Washington, DCWashington, DC
ChristiansburgChristiansburg
PortsmouthPortsmouth
To Chicago, Detroit, and Points West
VA
OH
WV
KYPortsmouthPortsmouth
664
664264
264
464
Western Freeway Rail Corridor
564
64
1. Central Corridor Double-Stack Initiative, and Roanoke and Pritchard Intermodal Facilities
2. Related Terminal Capacity
3. Western Freeway Rail Corridor
L E G E N D
The Heartland Corridor
PortsmouthPortsmouth
NorfolkNorfolk
16`4
CIDMMACIDMMA
PMTPMT
NITNITNITNIT
MaerskMaerskMaerskMaersk
CIMTCIMT(Proposed)(Proposed)
CIMTCIMT(Proposed)(Proposed)

Chicago’s Rail Corridors

Charlotte IM Terminal
Bring in the PAB leveraging effect!!

Indirect Federal Support
Investment Tax Incentive Legislation Introduced Last Congress and this Congress Provides for 25 % Credit for “new” capacity Applies to track, technology, facilities, and locomotives
The rail industry has a number of corridor projects, like the I-81 Crescent Corridor on NS, that could be facilitated by this type of PPP

Why Are Tax Incentives Needed?
2006 CBO Report recognizes that a variety of forces complicate railroads’ ability to attract capital: Tax policies tilt infrastructure playing field in favor of
competitors Railroads bear complex risk on immobile investment Continued government regulation imposes pricing and
operational constraints and many industry- specific financial burdens

Tax Credit for Qualifying Property
25% tax credit for investment in property that allows for an increase in the speed, weight, or volume of freight moved
“Star Trek” property Bridge or tunnel expansion Qualified new locomotives

Public Benefits ofFreight Rail Incentives
A single intermodal train can remove up to 280 trucks from roadway travel …
… saving lives and fuel; reducing congestion, pollution and greenhouse gases
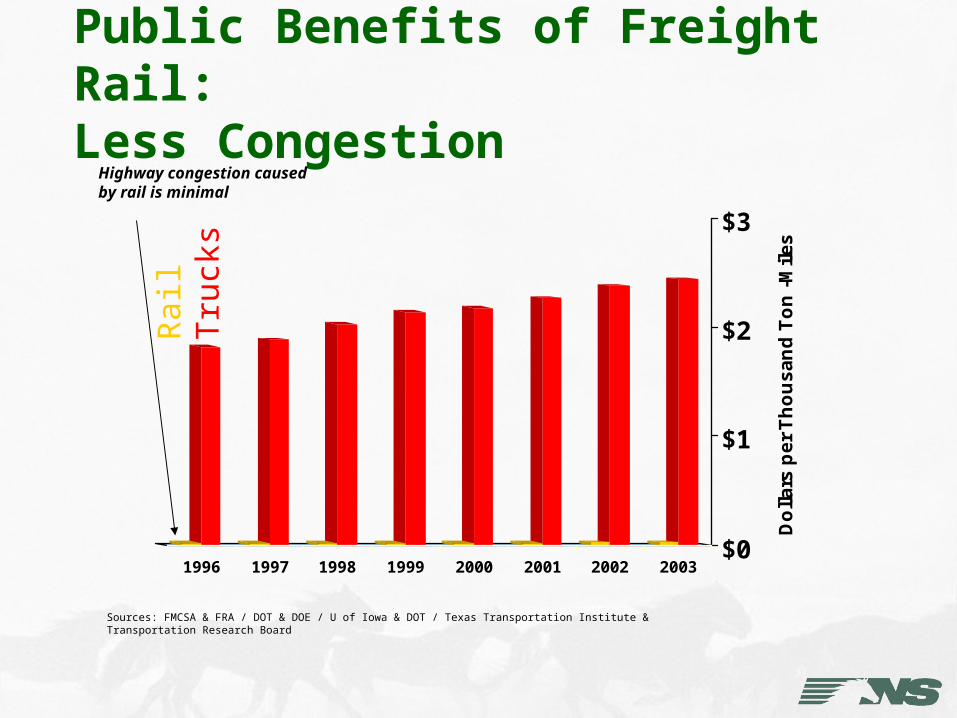
Public Benefits of Freight Rail: Less Congestion
Sources: FMCSA & FRA / DOT & DOE / U of Iowa & DOT / Texas Transportation Institute & Transportation Research Board
$0
$1
$2
$3
Do
lla
rs p
er
Th
ou
sa
nd
To
n -
Mil
es
1996 1997 1998 1999 2000 2001 2002 2003
Rai
lT
ruck
sHighway congestion caused by rail is minimal

Public Benefits of Freight Rail: Less Pollution and Greenhouse Gas
Sources: FMCSA & FRA / DOT & DOE / U of Iowa & DOT / Texas Transportation Institute & Transportation Research Board
0
1
2
3
4
5
Ra
tio
SO2 VOC PM10 NOx CO2
Ratio of Emissionsper ton-mile
(2003)
Rai
lT
ruck
s
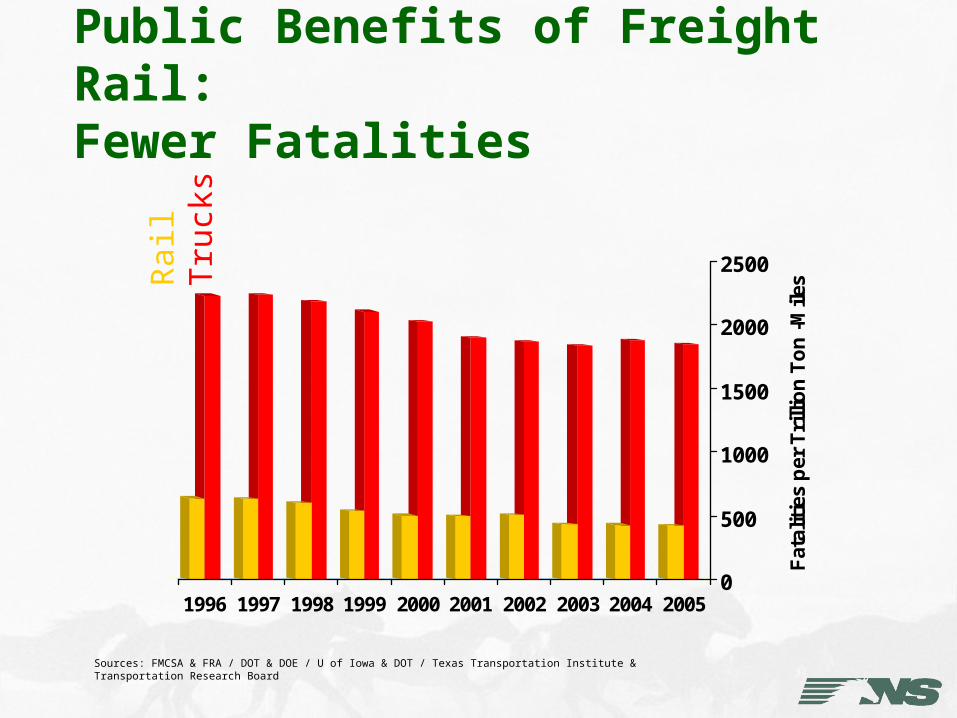
Public Benefits of Freight Rail: Fewer Fatalities
Sources: FMCSA & FRA / DOT & DOE / U of Iowa & DOT / Texas Transportation Institute & Transportation Research Board
0
500
1000
1500
2000
2500
Fat
alit
ies
per
Tri
llio
n T
on
-M
iles
1996 1997 1998 1999 2000 2001 2002 2003 2004 2005
Rai
lT
ruck
s

Public Benefits of Freight Rail: Reduced Energy Consumption
Sources: FMCSA & FRA / DOT & DOE / U of Iowa & DOT / Texas Transportation Institute & Transportation Research Board
0
2
4
6
8
10
12
14
Gal
lon
s p
er T
ho
usa
nd
To
n-M
iles
1996 1997 1998 1999 2000 2001 2002 2003 2004
Rai
lT
ruck
s

Public Benefits From Expanded Rail Capacity
Projections based on costs of congestion, accidents, air pollution derived from FHWA, Texas Transportation Institute, EPA and other sourcesToxic air pollution does not include the costs of carbon dioxide emissions
Social Costs Rail vs. Trucks
$0
$2
$4
$6
$8
$10
$12
Rail Trucks
Do
llar
s p
er T
ho
usa
nd
To
n M
iles Toxic Air Pollution
Accidents
Congestion
Shipping by rail results in social costs approximately 80% lower than shipping by truck.

Public Benefits From Expanded Rail Capacity
0
5
10
15
20
25
2005 2007 2009 2011 2013 2015 2017 2019 2021 2023 2025
Projections based on costs of congestion, accidents, air pollution derived from FHWA, Texas Transportation Institute, EPA and other sourcesToxic air pollution does not include the costs of carbon dioxide emissions
Social Cost Differential Between AASHTO Reduced Share and Increased Share Scenarios:Totals $200 Billion Over 20 Years

The Challenge of MeetingFreight Infrastructure Demands
Questions?