the case for collective dc - aon
TRANSCRIPT

The Case for Collective DCA new opportunity for UK pensions
November 2013 (updated June 2020)

Introduction . . . . . . . . . . . . . . . . . . . . . . . . . . . . . . . . . . . . . . . . . . . . . . . . . . . . . . .1
1 . The context — why do we need Collective DC? . . . . . . . . . . . . . . . . . . . . . . . .2
2 . Plan design and basic principles . . . . . . . . . . . . . . . . . . . . . . . . . . . . . . . . . . . . .6
3 . CDC – the attractions . . . . . . . . . . . . . . . . . . . . . . . . . . . . . . . . . . . . . . . . . . . 11
4 . CDC – the concerns . . . . . . . . . . . . . . . . . . . . . . . . . . . . . . . . . . . . . . . . . . . . 14
5 . Governance of CDC plans . . . . . . . . . . . . . . . . . . . . . . . . . . . . . . . . . . . . . . . . 19
6 . CDC – Doomed to failure (again?) . . . . . . . . . . . . . . . . . . . . . . . . . . . . . . . . . 20
7 . CDC around the world . . . . . . . . . . . . . . . . . . . . . . . . . . . . . . . . . . . . . . . . . . 27
8 . Modelling CDC outcomes . . . . . . . . . . . . . . . . . . . . . . . . . . . . . . . . . . . . . . . . 29
9 . Conclusions . . . . . . . . . . . . . . . . . . . . . . . . . . . . . . . . . . . . . . . . . . . . . . . . . . . 44
References . . . . . . . . . . . . . . . . . . . . . . . . . . . . . . . . . . . . . . . . . . . . . . . . . . . . . . 45
Appendix A – Illustrative DC scheme design . . . . . . . . . . . . . . . . . . . . . . . . . . . 47
Appendix B – Illustrative CDC plan design . . . . . . . . . . . . . . . . . . . . . . . . . . . . . 48
Appendix C – Draft Regulatory Framework . . . . . . . . . . . . . . . . . . . . . . . . . . . . 49
Appendix D – Modelling CDC design sensitivities . . . . . . . . . . . . . . . . . . . . . . 52
Appendix E – Methodology and assumptions . . . . . . . . . . . . . . . . . . . . . . . . . 56
Table of contents

The Case for Collective DC 1
IntroductionThis paper sets out the case for the introduction of Collective Defined Contribution (CDC) plans in the UK . These are risk-sharing plans widely used in several other countries but not currently permitted in the UK .
We have conducted significant research and analysis into the design of CDC plans and the advantages and disadvantages of these plans compared with current pension arrangements . We have developed some sophisticated modelling looking at both the historic and prospective performance of these plans .
Our modelling suggests it is feasible to design a CDC plan in which:
• Members collectively bear the investment and other risks of the plan (no employer guarantee is required) .
• Members can expect to receive a higher average pension than from a DC Lifestyle alternative (for the same level of contributions) .
• Accruing pensions are more predictable for members than a traditional DC Lifestyle alternative,
and more stable over successive cohorts of retirees .
The results of our modelling are summarised in the body of this paper .
CDC plans have some powerful, positive aspects that should improve retirement outcomes for
many UK workers — collective investment by professionals not members, benefits expressed in
income terms not capital accounts, and not having to buy an annuity at poor times in the market,
to name but a few . Equally we accept that here are some challenges posed by CDC plans — but
as our analysis shows, we do not believe any of these are insurmountable .
Collective DC may not be the perfect pensions system — but there again, most other UK pension
designs have been shown to have significant flaws . In our view CDC plans deserve a chance to
demonstrate how they can deliver better member outcomes for generations of UK employees .

The Case for Collective DC 2
1. The context — why do we need Collective DC? Defined ambition
In November 2012 the Department for Work and
Pensions launched an initiative titled “Reinvigorating
workplace pensions”1 . This venture carried an
umbrella heading of Defined Ambition plans and the
Pensions Minister Steve Webb said that “Our work
on “Defined Ambition” pensions is a key part of
establishing a future pension landscape that meets
consumer needs, rebuilds confidence in the system
and ensures good outcomes in retirement .” There
were three broad work-strands under the overall
heading of Defined Ambition plans:
• DB Lite (removing guaranteed and ancillary
benefits to make defined benefit (DB) plans less
“toxic”)
• DC plus (adding in guarantees and more certainty
to Defined Contribution (DC) plans) and
• a final strand of Collective DC (CDC) and larger
scale solutions .
This paper looks at the potential for CDC to improve
pension outcomes for members in the UK . In
November 20132, the DWP confirmed that CDC was
one of the areas under the Defined Ambition banner
that they felt was worthy of further consideration .
The context
The initiative on Defined Ambition plans takes place
against a background where DC pension provision is
the dominant form of provision for the vast majority
of active members of workplace pensions in the
private sector .
The Pensions Policy Institute project that by 2020
there will be 16m active members of DC schemes and
just 1m active members of DB schemes3 .
The reasons for the decline of traditional defined
benefit plans are well known and have been
extensively rehearsed and are not repeated here, but
can be found in eg, PPI research4 It is clear to us, based
on our conversations with clients, that the majority of
private sector employers, in the near future at least,
will simply not contemplate the provision of DB plans,
given their much-publicised ability to wreak havoc on
corporate balance sheets and, increasingly in recent
years, their very large demands on corporate cash
flows and management time .
The basic premise
The basic contention of this paper is that CDC
plans can deliver better member outcomes than
conventional DC schemes by virtue of pooling the
assets and permitting the taking of pension risk
in a different fashion .

The Case for Collective DC 3
What is a Collective DC plan?
Collective DC (CDC) is normally used to describe
a pension plan where the employer and employee
contribution rates are fixed as for conventional DC (in
the sense that once a contribution is paid, there will
be no retrospective adjustment or supplementary
contribution needed) . However, in a CDC plan all the
assets are pooled rather than each member having an
actual or notional pot of money earmarked for their
benefits . A CDC plan is firmly in the Defined Ambition
“spectrum” because it has the ambition (but, in our
definition, not the promise or guarantee) of a certain
level of pension .
The initial amount of CDC pension is set at the
level which is expected to be provided based on
the contributions payable by and in respect of the
member . The aim is that the amount of the pension
should be adjusted each year in line with inflation .
The age at which the pension could be paid might
also change to reflect expected increases in future
life expectancy .
However:
• If investment returns are better than expected,
higher increases — bonuses — could be provided
both pre and post retirement (including for
pensions in payment) .
• If investment returns are worse than expected or
other factors adversely affect the finances of the
plan, then lower increases would be provided in
order to ensure that the cost remains constant . In
extreme circumstances benefits for members —
including pensions in payment — may have to be
reduced in order to ensure that the cost does not
increase beyond that supported by the plan assets .
Consequences of CDC design
Our definition of a CDC plan (without guarantees)
is first and foremost one that is treated as a Defined
Contribution arrangement for the purposes of the
employer’s company balance sheet, profit and loss
statement, cash funding obligations and any potential
future (European) solvency requirements . There must
be no accounting or retrospective cash flow issues
with our definition of a CDC plan . The collective
nature means that the assets are pooled rather
than being allocated to each individual member .
Investment policy is conducted on an aggregate basis
without the need for individual member involvement
or decisions . Benefits are expressed in pension terms
for members rather than the capital value of an
account in the name of an individual member .
Is conventional DC sufficient?
Before looking at the detail of CDC plans, it is worth
asking whether these plans are needed at all — or
is conventional DC sufficient? There are a number
of features of conventional DC schemes that need
to be addressed if outcomes for members are to be
improved . The most basic of these is to increase the
level of contributions being paid by and in respect
of members . Clearly this is an issue for employers
and society at large to decide and it is not an
inherent feature of CDC plans that they enjoy higher
contributions . (We note in passing however, that in
the Netherlands, home of the best global examples
of CDC, typical contributions to pension saving are
significantly higher than in the UK) .
The purpose of our analysis of CDC plans is to
consider whether better outcomes can be obtained
for each unit of contribution . Our contention and our
modelling support the conclusion that not only can
higher pensions be delivered, but there will be less
variable or volatile outcomes for members .

The Case for Collective DC 4
DC Volatility
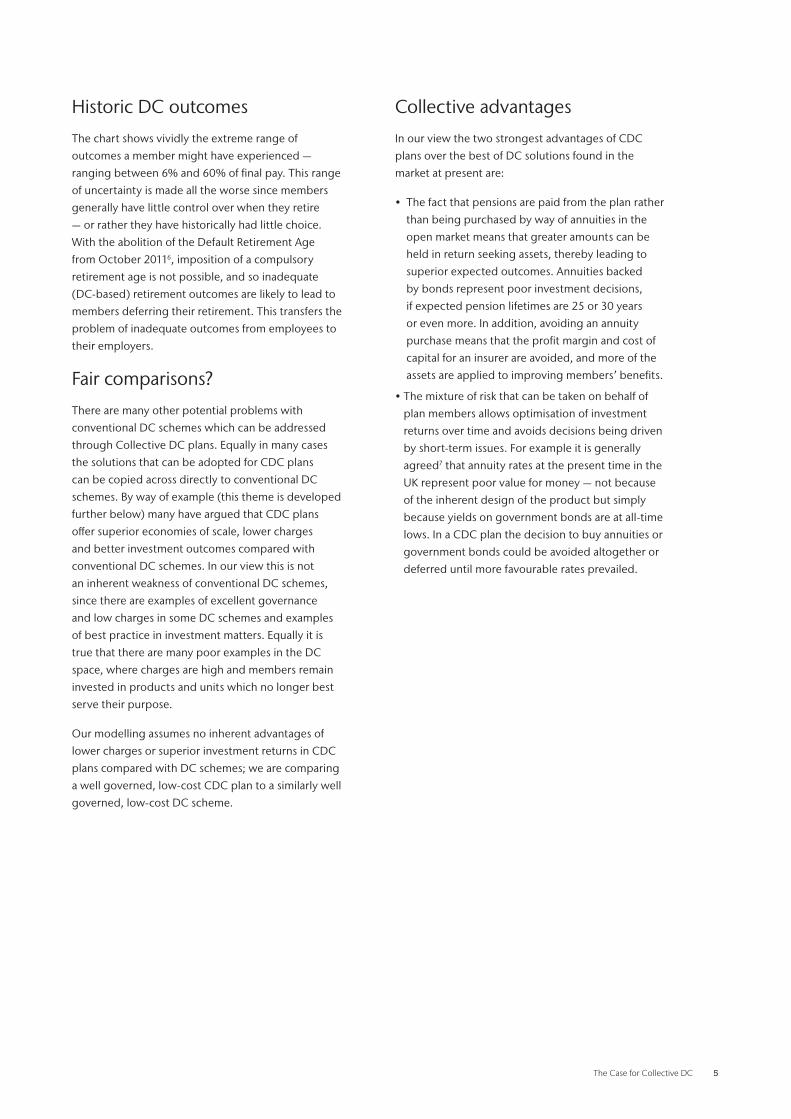
The inherent uncertainty attaching to conventional DC schemes is summarised in Chart 1
below, which is based on a submission to the Work and Pensions Committee on Governance
and Best Practice in Workplace Pension Provision5 . This shows the pension that a member would
receive from a conventional, but well-governed and low cost, DC scheme following either an
equity orientated investment policy, a bond-based policy or a conventional lifestyle policy
pre-retirement, followed in each case by annuity purchase . Under the lifestyle policy, ffrthe
member is invested in equities until 10 years prior to retirement date, and then progressively
switches from equities to bonds so that the portfolio is 100% bond invested to match the price
of an annuity on retirement more closely . The diagram shows the pension as a percentage of
final salary for a member participating in a DC scheme and contributing 10% of pay for 25
years before retiring on the date shown . Full technical details are set out in Appendix A .
Chart 1 — Historic DC outcomes
DC Gilt DC Lifestyle DC Equity
60%
50%
40%
30%
20%
10%
0%1955 1960 1965 1970 1975 1980 1985 1990 1995 2000 2005 2010
Retirement year
Pens
ion
as a
per
cent
age
of fi
nal
pay
The Case for Collective DC 5
Historic DC outcomes
The chart shows vividly the extreme range of
outcomes a member might have experienced —
ranging between 6% and 60% of final pay . This range
of uncertainty is made all the worse since members
generally have little control over when they retire
— or rather they have historically had little choice .
With the abolition of the Default Retirement Age
from October 20116, imposition of a compulsory
retirement age is not possible, and so inadequate
(DC-based) retirement outcomes are likely to lead to
members deferring their retirement . This transfers the
problem of inadequate outcomes from employees to
their employers .
Fair comparisons?
There are many other potential problems with
conventional DC schemes which can be addressed
through Collective DC plans . Equally in many cases
the solutions that can be adopted for CDC plans
can be copied across directly to conventional DC
schemes . By way of example (this theme is developed
further below) many have argued that CDC plans
offer superior economies of scale, lower charges
and better investment outcomes compared with
conventional DC schemes . In our view this is not
an inherent weakness of conventional DC schemes,
since there are examples of excellent governance
and low charges in some DC schemes and examples
of best practice in investment matters . Equally it is
true that there are many poor examples in the DC
space, where charges are high and members remain
invested in products and units which no longer best
serve their purpose .
Our modelling assumes no inherent advantages of
lower charges or superior investment returns in CDC
plans compared with DC schemes; we are comparing
a well governed, low-cost CDC plan to a similarly well
governed, low-cost DC scheme .
Collective advantages
In our view the two strongest advantages of CDC
plans over the best of DC solutions found in the
market at present are:
• The fact that pensions are paid from the plan rather
than being purchased by way of annuities in the
open market means that greater amounts can be
held in return seeking assets, thereby leading to
superior expected outcomes . Annuities backed
by bonds represent poor investment decisions,
if expected pension lifetimes are 25 or 30 years
or even more . In addition, avoiding an annuity
purchase means that the profit margin and cost of
capital for an insurer are avoided, and more of the
assets are applied to improving members’ benefits .
• The mixture of risk that can be taken on behalf of
plan members allows optimisation of investment
returns over time and avoids decisions being driven
by short-term issues . For example it is generally
agreed7 that annuity rates at the present time in the
UK represent poor value for money — not because
of the inherent design of the product but simply
because yields on government bonds are at all-time
lows . In a CDC plan the decision to buy annuities or
government bonds could be avoided altogether or
deferred until more favourable rates prevailed .

The Case for Collective DC 6
2. Plan design and basic principles
Multiple designs
One of the strengths — and weaknesses — of the CDC
concept is that many design options are possible . A
wide range of plan designs can be accommodated
under the CDC banner and each would have a very
different experience for members in terms of ease
of understanding, variability of outcomes, biases or
protections for different plan participants, degrees of
smoothing needed between generations, riskiness of
underlying investment policy and so forth . This huge
range can make it difficult to separate out and focus
on the underlying characteristics of CDC plans and
what they might offer relative to conventional DC
schemes . One approach would be to “let a thousand
flowers bloom” and offer a regulatory framework that
permitted a wide range of CDC options, with market
forces leading to best solutions that adapt over time .
While we can see the logic of this, in order to gain
broader public acceptance and understanding of
CDC plans, we favour a restricted “menu” of CDC
plan design choices .
Plan design components
There are a number of components that need to be
captured in order to understand the essence of any
specific CDC plan:
• The contributions payable to the plan by members
and / or the sponsor .
• The overall benefit style as presented to members
— a DB style pension, a points based system, a
controlled risk DC scheme etc .
• The bonus policy that sets out how benefits will be
adjusted in the light of emerging experience .
• The investment and risk management policies
underlying the plan’s assets .
• We illustrate these design principles with two
selected plans below – an illustrative Career
Average plan and a points based system suggested
by Ray Martin . Other designs are considered in the
international section later . Governance issues are
also considered later .

The Case for Collective DC 7
Illustrative career average plan design
• The contributions payable to the plan are 10% of
a member’s salary – all paid by employer (ie, no
member contributions) .
• The target benefits from the plan are based on
1% of career averaged salary, with CPI revaluation
payable from age 65 . In other words a member
joining the plan with 25 years to retirement would
consider his target pension to be 25% of his
revalued career average pay .
• There is an attaching spouse’s pension payable at a
50% rate if the member dies after retirement .
• Pensioner benefits are paid from the plan during
retirement, rather than being bought out with an
annuity provider .
• There are targeted revaluations of all benefits
under the plan of 100% of CPI (subject to a floor
of 0%, with no cap) . This revaluation applies
uniformly to benefits earned by active members,
deferred benefits and pensions in payment .
• We have assumed a very simple investment policy
– assets are assumed to be 60% in return seeking
assets (UK equities) and 40% in matching assets
(UK government bonds) . We can compare this
with a member of a DC lifestyle scheme – who
will be in return seeking assets for most of his
active membership, switching effectively to bonds
in the run-up to retirement and subsequently in
retirement (through the purchase of an annuity) .
In the CDC plan however the investment policy
can be maintained throughout the period of the
member’s retirement – the investment in return
seeking assets is taken in a different fashion over a
different timeframe; it reduces the concentration of
risk at any point in time .
CARE plan — bonus policy
• Each year the plan’s funding level (value of
the assets divided by value of the liabilities) is
measured, based on the CARE-style benefits which
have accrued up to that point in time .
• The funding assessment is performed using a
market value of assets and a set of market-
consistent best estimate assumptions for valuing
the plan liabilities .
• At each valuation benefits are adjusted, if
necessary, to keep the funding level within a
window of 90%-110% .
• If the funding level is outside the 90-110% window,
then the following adjustments (in order) are made
to return the funding level to 90% or 110% as
appropriate by:
(i) Revaluation target for the current and all future
years is changed via a uniform percentage
adjustment up or down, with the resulting
revaluation subject to a zero floor;
(ii) One-off benefit reduction (applied as a fixed
percentage uniformly to all members) .
Pensions in payment are exposed to both levers (i)
and (ii) above .

The Case for Collective DC 8
Observations
This offers a plan which is most DB-like in design, to
aid ease of comprehension by members . There are
many potential variations in terms of accrual rates,
pension ages, width of the funding gates, bonus
policy etc .
One of the key concerns that we have tried to
address — discussed further in the Modelling section
below — is around protection for pensioners . We
understand that there are serious concerns about the
prospect — however remote — of CDC plans having
to cut pension in payment . One way to mitigate this
is to limit the exposure of pensioners to benefit cuts,
and to compensate for this by making the bonuses
for active and deferred members more variable . We
have looked at ways in which older pensioners could
be progressively protected from the adjustment
in (ii) above . Our initial work suggests this can be
accommodated without significantly adding to the
risks of other plan members .
Ray Martin’s design
In June 2013 Ray Martin (then Royal Bank of Scotland
head of pensions and benefits) was announced as the
winner of the £15,000 Defined Ambition Competition
2013 — run by Professional Pensions and Barnett
Waddingham — for his Pension Points Builder Plan8 .
This was a CDC plan with the following
design features:
• Contributions by and on behalf of a member are
applied to buy Pension Points . A Pension Point
would secure a pension from Pension Maturity Age
(age 67) of £1 per month, or £12 per annum .
• The purchase terms for Pension Points would
vary by age and would be set each year by an
independent party – the Government Actuary,
• Pension Points increase in value each year in
line with CPI and would be subject to annual
adjustment in the light of the financial condition
of the plan .
• The Trustee would have an investment goal to
achieve a return over a long period (10 to 20 years)
of 3% above Consumer Price Inflation, with the
least amount of annual volatility . It would appoint
a team of professional investors to help it achieve
this goal .

The Case for Collective DC 9
Pension points — bonus policy
• If the Plan is more than 110% funded then the
excess can be either retained by the Trustee as
an additional reserve or distributed to members
through Bonus Pension Points . The reserve cannot
exceed 25% of the value of the Plan’s liabilities .
• Any Bonus Pension Points granted will be given
equally in proportion to the number of Pension
Points earned to date by each member, regardless
of whether the member is a current contributor, a
former contributor, or in receipt of a pension .
• If the Funding level is below 100%, the Trustee
must decide what action it will take . If it is above
95% the Trustee can decide that future investment
returns are likely to increase the funding level back
above 100% and take no further action .
• If the funding level is below 95% then the Trustee
must decide what action to take to restore the
Funding level to above 95% . The Trustee’s first
course of action must be to reduce previously
allocated Bonus Pension Points evenly across all
members . They may reduce all Bonus Pension
Points evenly across all years of grant or they may
start with those most recently allocated .
• If after cancelling all Bonus Pension Points the
funding level is below 95% then the Trustee must
consult with the Pensions Regulator over what
further action it should take .
Observation
The points based system enables the value or cost
of the basic benefit — the pension point itself — to
vary by age and so take on board expected future
returns . It does this at the cost of being less clear to
members — it would be virtually impossible for a
member to work out their expected number of future
points throughout their career, and so plan for their
retirement . The way suggested around this is to have
a website — accessible using modern technology
such as smart phones — which does the calculations
for the member, and presents results in a more easily
understandable format .
The version of this points based system, as described,
does not have the revaluation “levers” that are a
feature of our design — but we note these can be
added, without taking away from the underlying
points design .

The Case for Collective DC 10
Benefits cuts
One of the concerns about the operation of CDC
plans is the potential that pensions in payment may
need to be cut in extreme circumstances to keep the
plan financially sound . This is happening at present
among Dutch CDC plans — the Dutch regulator
reported that 66 of 415 Dutch plans had been forced
to cut benefits by an average of 1 .9%9 . It is possible to
address these concerns — at a price . If older members
are more protected then younger members will be
more vulnerable to unfavourable benefit adjustments
or benefit cuts .
One method to offer greater protection to pensioners
is to secure annuities in the external market for them
at the point of retirement . Rather than purchasing
a fully indexed linked pension, the plan could
purchase a level annuity for the member . This would
guarantee a base level of income regardless of future
experience . However to the extent that the premium
to purchase the annuity would leave the CDC plan
assets, the pool of assets would be correspondingly
smaller, and there would be less opportunity to
generate higher long-term returns .
If the annuity purchased were a fully index linked
annuity, the CDC plan would now resemble a
conventional DC plan . Various compromises would
be possible, in addition to the purchase of a level
annuity as above — topping up the level annuity
purchase at regular (eg, three yearly) intervals,
or as market conditions dictate . The purchase of
annuities could be deferred, or timed by the trustees
of the plan . But our modelling suggests that the
opportunity cost is greater than the additional
security gained . Consequently, we favour a model
that does not involve annuity purchase, but does
deliver greater protection for older members by way
of a non-uniform bonus distribution policy .
An alternative route to pension security
We have modelled an alternative approach that
could offer greater security for pensioner members .
Pensions would continue to be paid from the plan,
but the bonus distribution policy would be skewed
rather than operating as a uniform adjustment for all
members . This revised policy progressively phases
out the full benefit adjustment over the ages of 65 to
75 . A pensioner at age 65 is subject to the full annual
adjustment, whereas a 75 year old pensioner suffers
none . After age 75 they are protected against benefit
cuts as a priority over all other benefits . Clearly the
choice of ages is rather arbitrary and would be an
issue for the scheme design phase . The age of 65 in
the above example could be a fixed age, or more
helpfully it could be an age which increases in line
with improvements in life expectancy .
Less variation for one group of members in a
collective plan means greater variability for the
remaining members, and so the question we have
asked in our modelling is whether the risk transfer
to younger members is unfair, in that they have
too much risk with insufficient upside . Based on
our initial modelling, we believe that a CDC plan
can be designed with significant protection for
older members, and without compromising the risk
exposure for younger members .

The Case for Collective DC 11
3. CDC - the attractions
AttractionsIn this section we look at the positive features of CDC plans . The UK section of the 2013 Aon
Global Pension Risk survey received 241 responses covering some 222 plans with over three
million members and around £300 billion of assets — a very powerful representative survey10 .
We asked respondents what they saw as the major advantages of Defined Ambition plans –
the results are illustrated in Chart 2 below .
Chart 2 — What do you see as the biggest positive of Defined Ambition plans?
The biggest positivesThe two biggest positives highlighted above focus
on matters from the employer and then the member
perspectives . The employer requires certainty
this is a DC scheme — a central plank of our whole
investigation of this concept, but one which needs
to be addressed to ensure employers are sufficiently
confident if they embark on a plan like this . The
greater predictability of outcomes for members
is a reflection of the inherent unpredictability of
outcomes from existing DC schemes . The DC Plus
workstrand may offer some possibilities here — but
the CDC plan addresses these outcomes
more directly .
Employers get fixed contribution rates
Greater predictability of outcomes for members
Members don’t need to be involved in investment
Greater investment efficiency and economies of scale
Members get benefits they want
No two-tier pensions workforce
75%
71%
46%
44%
34%
31%
0% 50% 100%
Investment by professionals not membersInvestment policy for a CDC plan will be carried
out by professional trustees acting on behalf of
members . There would be no need for individual
member involvement in investment decisions .
There is repeated evidence (eg, Byrne (2007)11,
Choi et al (2011)12, Lusardi and Mitchelli (2007)13
that members are unwilling or unable to take the
complex investment decisions required under a
DC scheme . The strongest evidence for this in the
UK comes in the widespread adoption of default
investment options14 . In effect default funds
represent attempts to optimise the investment
decisions on behalf of the members so that they
are personally relieved of this process . A CDC plan
does this more directly by simply not involving
members in investment decisions and leaves the
choice to professional trustees .
Source: Aon Global Pension Risk 2013 Survey: Sample size 241

The Case for Collective DC 12
Superior investment choices
The collective approach to investment decisions
potentially delivers access to the best expertise
available in the marketplace . There are many areas
in current DC schemes where investment options
are sub optimal . For example one of the major
drawbacks of contract-based group personal
pensions is that member consent is required to
effect investment switches . Even if there is in place
an investment governance committee (designed
to look at the range of investment options offered
to members and change these over time) they are
powerless to switch members out of existing range .
As such there are many members in contract-based
arrangements where the investment is, for example,
a passive UK equity tracker fund which was
implemented 10 to 15 years ago and would have
been considered leading-edge at the time .
Costs
Many members of DC schemes are bearing excessive
investment and administration charges — the OFT
report into DC outcomes stresses this . This often
reflects the fact that the arrangements were set up
when commission was payable to intermediaries
and this was reflected in higher deductions from
members’ accounts .
Of course in modern well-designed schemes
— notably those adopted for compliance with
auto-enrolment — high charges are not a necessity .
Charges can be negotiated competitively for the
right groups of employees and access to the best
investment thinking delivered .
Wider investment options
The use of larger investment pools should enable
access to a wider range of better-performing asset
managers and some of the more esoteric asset
categories, both of which might be excluded from
conventional DC arrangements . CDC plans can
also take a longer-term view and invest more of
their assets in illiquid investment categories such as
infrastructure, mortgages and other investments .
These can prove an excellent diversifier of investment
returns and are difficult to incorporate into
conventional DC plans where the prevalence of daily
pricing and daily dealing makes the illiquid nature
problematic — and there is no long-term pooling of
investment risk .
Account blindness
In our CDC plan design, benefits for members
would be expressed in pension income terms .
Repeated evidence suggests that account blindness
leads members to underestimate the amount they
need to save for an adequate retirement . In part
this is because members underestimate their own
life expectancy . An IFS report15 suggests that men
(women) aged 50–60 underestimate their life
expectancy on average by around 2 (4) years —
leading to underestimates of how much they need
to save for retirement (and contributing to the
perception that annuities are poor value for money) .
A member with £100,000 in a DC account may feel
a significant source of security from his pension
saving but converting that into an income of a mere
£50 per week may feel less than satisfactory . CDC
plans express benefits in terms of income that can be
related to the member’s standard of living and should
facilitate retirement planning .

The Case for Collective DC 13
Investment efficiency
A CDC plan can invest in return seeking assets over
the longer term because annuity purchase is not
necessary . Since equities and other reward seeking
assets are expected to give higher returns than long
dated government bonds and cash, the CDC plan
could deliver higher benefits . Modelling by the
Government Actuary’s Department16 concluded:
“CDC plans do appear to exhibit superior performance
on average when compared to conventional DC plans.
In theory this improvement is in the order of 20 to 25 per
cent, but in the simulation it is as high as 39 per cent for
some members.”
Bigger and more stable pensions
In 2012 the RSA17 undertook a review of the literature
comparing the outcomes of individual and collective
pensions . They reported on six studies (including the
GAD study above) . They reported that “all (studies)
showed significantly better outcomes for collective
pensions of 25% or more” . These studies were based
on informed estimates of likely costs and returns .
Our own modelling supports these conclusions,
although perhaps not for the same reasons as some
of the studies included in the RSA analysis . In our
modelling we have taken no credit for any increased
returns from the assets underlying CDC plans — nor
any lower charges . In both cases this could be seen as
“generous” and crediting existing DC schemes with
superior returns and lower charges than are actually
found in practice . Our view is that we should focus on
improving both the returns and reducing the costs
associated with DC schemes, since that will directly
benefit members in these schemes . Our modelling
assumes these improvements occur in DC schemes,
and even then we still see superior outcomes for CDC
plans, in terms of both the overall level of benefit and
reduced variability of outcomes for members .

The Case for Collective DC 14
Concerns
In our dealings with potential sponsors of CDC plans two issues dominate their concerns . The
first of these is of legislative creep and the second is the problem of explanation . Chart 3 below,
using results from the Aon 2013 Global Pension Risk survey, illustrates this quite clearly10 .
Chart 3 — What do you see as the biggest disadvantages of Defined Ambition plans?
4. CDC - the concerns
Regulatory creep
The biggest concern expressed to us is that sponsors will be reluctant to establish CDC plans
because they fear that, at some unspecified future date, legislation governing them will
become progressively tightened or amended and convert them to something more onerous
than anticipated . Sponsors cite the legislation covering defined benefit schemes — for example
the obligation to provide benefits to early leavers, to provide inflation protection to benefits
in payment, to indexation and revaluation of early leavers’ benefits, pension protection fund
levies and so forth . The DWP are well aware of this concern and are understood to be looking
at ways of giving employers the protection they seek . The technical difficulties of this should
not be underestimated since it is a feature of English law that the government cannot bind
its successors . Equally, in some areas, the government are not in control . For example, if the
accounting profession decides to treat a CDC plan as some form of constructive obligation, it
could require them to be accounted for in the company books as if they were defined benefit
plans . And the European pensions legislators may attempt to regulate CDC plans as if they were
subject to the full strictures of Solvency II!
Changes by a future government
Presenting 'soft' guarantees
The possibility of cutting benefits
Cross subsidies between generations
Difficulty of the targeting or bonus policy
No need for them – DC is good enough
Age discrimination or other legal issues
76%
73%
38%
35%
31%
20%
14%
0% 50% 100%
Source: Aon Global Pension Risk 2013 Survey: Sample size 241
The Case for Collective DC 15
Employer protection - the big red button
One approach to guarantee employer protection
would be to terminate the CDC plan via a “big red
button” option . If the government changes the
nature of the CDC plans, the employer could hit this
large button which would trigger a requirement for
the trustees to initiate a termination of the CDC plan .
An actuarial assessment of each member’s interest
would take place, and the available assets would be
distributed in proportion to each member’s interest .
This interest could be secured by transfer to a suitable
DC arrangement for active and deferred members .
For pensioners this benefit could be secured by
way of annuity purchase — which raises the issue of
whether the annuity purchase would be for the full
value of the annuity at the point of termination, or the
annuity that could be purchased with the member’s
share of fund . Distribution rules could be adjusted to
reflect the latest bonus distribution policy .
Communicating the benefits
The difficulty of communicating benefits from a CDC
plan should not be underestimated — although as
we have seen over many years, there can be great
difficulty in communicating clearly and effectively
any type of pension arrangement . It is a delicate
balancing act between indicating the level of benefit
that the member can expect but at the same time
retaining enough of the messaging that these are
intentional benefits and not guaranteed benefits . The
fact that benefits can be less than those intended, or
in extreme circumstances reduced below a base level
of benefits, is something that offers great dangers of
being misunderstood by members . In our view clarity
of the legislation would be one way of ensuring that
members understand the reality of their position .
Base benefit reductions will be rare, but will require
sensitive handling, and careful pre-positioning .
The legislation needs to make it clear that benefits
can be reduced in extreme circumstances and that
trustees and employers will be protected in these
trying times .
Cutting benefits
Mention was made earlier of the report from the
Dutch pension regulator that a significant number of
Dutch CDC plans were being forced to cut benefits .
This is seen as a major downside of CDC plans
generally and something which we know the UK
Pensions Minister is keen to avoid . It is worth putting
some of these points into context .
• One quarter of Dutch CDC plans reported9 having
to cut pensions by an average of 1 .9% in 2012 to
restore their funding level .
• These benefit cuts will have priority for restoration,
if and when financial conditions improve .
• In the UK, by contrast, the cost of buying an
annuity increased by 29% over the three years
2009–1218 . Those persons retiring from a DC plan
in 2012 and buying an annuity would have seen a
permanent drop in their retirement income of 29%
compared with their 2009 colleagues — with no
prospect of subsequent review or readjustment .
Benefit cuts may be a drastic last resort for CDC plans
— but they may be much preferred to permanent
DC reductions . In addition, we believe that careful
design can reduce (but not entirely eliminate) the
prospect of having to apply these cuts to the most
vulnerable of pensioners .

The Case for Collective DC 16
Smoothing is inherently “unfair”
Apart from the inevitable comparisons with with-
profit arrangements, one regular criticism levelled at
CDC plans is that smoothing of investment returns is
unfair . Lesley-Ann Morgan of Schroders19 (we are not
attacking her presentation — it just forms a convenient
summary of the purported negative features of CDC)
states: “performance smoothing must cut both ways –
some will win and some will lose.” At an absolute level
this must be self-evident — compared with a pure DC
arrangement, there will be times when smoothed
returns are superior, and times when they are inferior .
The problem we face is that there is no way of
knowing in advance — or even sometimes after the
event! — which of these circumstances will apply .
Smoothing takes away this element of chance . And
unlike conventional DC where the member purchases
an annuity — the luck of market timing does not have
to affect the member’s retirement income forever .
Annuity purchase is irrevocable — smoothing is not .
Suppose that we put an offer to two prospective
(DC) pension scheme members: “One of us will get
a pension of 20% of pay – the other will get a pension
of 30% of pay. There is no way of knowing in advance
who will get which pension — (see Chart 1 to understand
both the volatility and unpredictability of DC outcomes).
Instead, we can both agree to join a CDC plan — in which
case we can assume with a high degree of certainty that
we will BOTH get pensions of 28% of pay. Shall we join
the CDC plan or go our own separate DC ways?” Faced
with a smoothing decision in these terms, we suspect
most members would prefer the collective approach!
There is a significant body of academic evidence
which supports collective investment — eg,
Cui et al . (2011)20 argue that collective plans can be
welfare enhancing compared to optimal individual
investment because of efficient risk sharing . Gollier
(2008)21 concludes that collective plans make it
socially efficient to raise the collective risk exposure to
take advantage of the equity risk premium, through
the means of intergenerational risk sharing .
Gaming the system
Following on from the comments above about
smoothing, Morgan19 argues that members would be
able to select against the CDC plan, by transferring
in or out at a time when smoothing was operating in
their favour . So for example if smoothed returns are
higher than market returns, members might seek to
lock in “profits” by transferring out .
Apart from the remarkable degree of financial
acumen demonstrated by such members, this is
not an inherent weakness of CDC plans . In our
governance framework, any transfers in or out would
take place at market equivalent prices — so that
members would receive a “share of fund” value . So
if assets had fallen by 20% for example, members
might only see a 1% fall in their annual revaluation
awards — but any external transfer would fall by the
full 20% . This can be considered as comparable to
the “Market Value Adjustments” that we came to
know and love in with-profit funds, except in this
case there is no obvious “face value” of the account
against which to compare the (apparently reduced)
transfer value .

The Case for Collective DC 17
Lack of investment choice
Morgan19 cautions that the lack of investment choice
is a weakness of CDC plans: “The Governors of the
CDC face the risk that a single investment option will
not be suitable for all members, but members cannot
choose anything different” . We take the opposite view
and see lack of investment choice as a positive . The
evidence11 is that members are unwilling or unable
to take effective investment decisions for something
as complex as long-term pension investment —
matters are better dealt with by professionals on their
behalf . And under our suggested framework, CDC
plans would be funded solely by way of employer
contributions, with a separate conventional DC
scheme available for any further contributions the
member themselves wished to make (see Appendix
C — contributions) . So individuals would retain all the
attendant choice that a DC scheme offers in respect
of their own contributions .
There is however a rather more subtle point in here .
It can be argued that collective investment is
sub-optimal compared to having a more focussed DC
approach, under which greater emphasis is placed on
return-seeking assets for younger members and more
emphasis on secure assets for older members . There
have been suggestions that a CDC plan could have
two internal asset pools to address these needs and
move members between them over time (eg, Bams
et al22) . We would see this as a design variation of
CDC plans that could emerge over time, or even be
adopted up front by a progressive CDC plan .
New legislation needed
New legislation would be required to cover the
governance of CDC plans and we would support this
since it enables some of the key features to be made
explicit . The latest DWP research paper2 also comes
to this conclusion .
Taxation of CDC plans
CDC plans do not currently exist, and so the post
A-Day tax system does not deal with them adequately
— or at all . Assessing the value of the pension input
amount for a CDC plan like our illustrated benefits
design is not straightforward . The DB-like nature
of the target pension suggests that the “16 times
increase in value of benefit” for DB schemes may
be appropriate . However unlike conventional DB
benefits, the benefit added for a CDC plan member
may be adjusted subsequently — or as we have
noted, in extreme cases even reduced . So instead our
thought is that the obvious approach is to calculate
the pension input amount as the annual contribution
level in the plan . This is by no means perfect, since
while it is true that the CDC plan collective assets
increase by (in our example) 10% of members’
pay, that benefit is not uniformly distributed across
all members, as it would be in a conventional DC
scheme . But we could consider that members receive
a fixed contribution like a conventional DC plan (no
subsequent adjustment in the event of underfunding
etc) and the collective nature is merely an alternative
way of investing that fixed contribution . Adjustments
on account of subsequent investment performance
(and bonus allocations) would be ignored in CDC
plans, just as they are in conventional DC schemes for
pension input purposes .
Another potential issue would be how to place a
value on a CDC plan pension in payment . In most of
our modelling, the pensioner member is still exposed
to at least part of the revaluation increases, and the
expected value of the pension is higher than a “pure”
index-linked pension . Some assessment would be
made of the pension at the point of crystallisation
— say 22 times the pension, compared with the
standard DB valuation at 20 times the initial pension .
This assessment would depend on the bonus policy
of the CDC plan and the prospective increases the
pensioner would accrue .
The Case for Collective DC 18
5. Governance of CDC plans
Governance framework
In Appendix C we provide outline proposals for a
governance framework for CDC plans in the UK . At
its fullest level there could be significant flexibility in
the design and regulation of plans which fall under
the CDC or even Defined Ambition banner . While we
support flexibility we believe there is merit in pushing
(at least initially) for a restricted series of design
options so that they can be more fully appreciated by
the public and all those involved in pensions .
Trust-based framework
Our basic view would be that CDC plans should be
operated in a trust environment where the trustees
operate at arm's length from the employer(s) or
sponsor(s) . The trustees have a principal requirement
to manage the finances of the plan to award equable
distribution of investment returns to different
generations of plan members . Trustees involved
with governance of CDC plans would need a high
level of knowledge and competence in investment
and funding matters and would most likely be
professionally qualified .
A strong regulatory framework
We support the concepts described in the DWP
consultation paper — Reshaping workplace pensions
for future generations2 — that our model of CDC
plans (without guarantees) should be subject to a
high level of regulatory oversight . These plans rely
on a high degree of public confidence, which in
turn requires regular communication, transparency
of operation and the reassurance of a focussed,
powerful regulator . In our model, The Pensions
Regulator would receive all of the documentation
governing the financial operation of the plan
as described below . They would receive copies
of communications to members, so they could
ensure that members were being given realistic
presentations of the expectations of the benefits
they would receive . And the Regulator would have
powers of intervention if they felt that the benefits
promised were inconsistent with the investment
policies and assets backing the plan .
While this might sound a heavy regulatory overhead,
in practice we expect relatively few, but large,
CDC plans and so the costs of regulation should
not be excessive .
The CDC Public Website (“CDCPW”)
We believe that much could be achieved if the
trustees’ approach to financial management were
open and transparent to public scrutiny . We
recommend the establishment of a public website
which contains all key documents relating to financial
management of the plans . In recommending this we
are not suggesting that members themselves will
flock to this website, but we do expect informed
commentators in the pensions environment to
do so . The pressure of this public scrutiny will
quickly identify those schemes that are outliers
and/or are taking excessive risks relative to the
benefits promised to their members, or are failing
to take the tough decisions that might be needed
to restore financial stability . We can harness the
collective power and analysis of all parties involved in
retirement planning via the Internet and other social
media as a powerful incentive to deliver financial
processes that match members’ expectations .

The Case for Collective DC 19
Inferior collective governance?
Morgan19 suggests that the governance arrangements
for CDC plans will be inferior to other governance
structures . This is partly because of the use of “less
suitably experienced people” who are often “slower to
implement new ideas” . The article cites DWP research23
that employers were sceptical that “given the
complexity of CDC scheme, trustees would have sufficient
experience to make investment decisions” .
This supports our view that there is little room for
“generalist” trustees in the management of CDC
plans, and that paid, professional independent
trustees may be required .
Legal matters
There are aspects of CDC plans that would require
adjustment or amendment of existing pensions
legislation (and taxation issues) . A number of these
are highlighted in the DWP's latest research paper2
and we have discussed these extensively with our
legal contacts and representatives of the Association
of Pensions Lawyers . While we do not purport to
give legal conclusions, our extensive analysis and
conversations with the lawyers have not identified
any “show stoppers” that would prevent the
introduction and operation of CDC plans . A flavour of
some of the issues discussed and potential responses
are set out below:
• Some DB legislation such as Section 67 of the
Pensions Act 1995 and statutory indexation and
revaluation of benefits could apply to CDC . Carve
out CDC plans from inappropriate DB legislation .
• The legislative definition of “money purchase
benefits” could cut across the concept of CDC .
Amend the definition of money purchase benefits
to ensure that CDC plans are not included .
• There are potential tax implications if benefits are
reduced (eg, scheme pensions cannot be reduced
under Finance Act 2004) . If needed, amend FA2004
to allow CDC plan pensions to be reduced if
needed to restore the plan to full funding .
• There is the potential for members’ expectations
over time to become “rights”, in which case the
CDC plan would become a DB plan . Ensure
standards of clear and consistent member
communications, plus tightly drawn legislation,
to set and control expectations .
• The CDC plan design involves inter-generational
risk sharing – between different cohorts of
members of the plan . It may also incorporate
bonus policies designed to protect older members
– eg, through the tapering we have proposed .
This might fall foul of anti-age discrimination
legislation . If needed, amend age discrimination
legislation to confirm intergenerational sharing (as
found elsewhere in Europe) .

The Case for Collective DC 20
6. CDC — Doomed to failure (again?)
Strike Three and CDC is out?
In our conversations with other pensions
professionals there are two aspects which recur quite
regularly which are seen as killing off any further
discussion of the merits of CDC plans .
• The government looked at this before and decided
against it – nothing has changed to make it more
likely to happen now
• This is just a with-profits product in a different
disguise – and with-profits is so discredited that we
should consider it dead
We look at both of these issues .
Previous DWP anaylsis
In 2008, as part of its response to the independent
deregulatory review, the Government undertook
to explore the scope for risk sharing in occupational
pensions24 . In their response to the consultation on
risk sharing the Government stated “The Government
has decided to undertake further work on the detail of
how Collective Defined Contribution (CDC) schemes
might operate in the UK.”25. That further work was
published in December 2008, drawing on modelling
carried out for the DWP by the Government Actuary's
Department (GAD)16, 23 However despite the findings
that “the modelling... supports the claims of enhanced
performance on average from CDC schemes and of some
increased predictability of outcomes compared to DC
schemes” the DWP concluded: “the Government should
take no further action on CDC plans” .
So what went wrong — and why would matters be
any different today?
DWP 2008 analysis
The Government (DWP) analysis identified a number
of issues to be addressed, under six headings:
• Level of returns for members
• Predictability of income in retirement
• Intergenerational transfers
• Stability of CDC plans
• Legal implications of CDC plans
• Potential demand for CDC plans
The Case for Collective DC 21
Level of returns for members and predictability of income in retirement
The GAD modelling carried out for the DWP included
these conclusions:
• “CDC schemes do appear to exhibit superior
performance on average when compared to
conventional DC schemes. In theory this improvement is
in the order of 20 to 25 per cent, but in the simulation it
is as high as 39 per cent for some members.”
• “The GAD results show that in a CDC plan an
individual’s starting pension is less dependent on the
particular scenario experienced, ie, is less dependent
on whether the individual happens to retire in a
downturn or in a boom.”
• “Relative to DC there is more predictability in an
individual’s starting pension”
So CDC is a system that delivers a pension that is
bigger and more stable than conventional DC . Our
own latest research and modelling confirms these
conclusions, and is set out in detail in Section 8 of
this paper .
Intergenerational transfers — 2008 concerns
One of the key aspects of CDC plans is that they
do involve risk sharing — not sharing between the
member and the company but between different
generations of members of the plans . In 2008 the
DWP point out one potential pitfall:
“Cross-subsidies arising from the smoothing mechanism
are inherent in the modelled CDC plan. They have
considerable implications for intergenerational equity.”
Dealing with these issues of smoothing requires
very careful communication to members and good
actuarial control processes . Dealing with these long-
term issues is a core part of actuarial training — but
we need to be honest and accept that there may be
actual or perceived pressure on actuarial decision-
making in this environment . So why not have some
robust independent supervision, supported by
public scrutiny?
Intergenerational concerns — what might be different now?
Smoothing is an inherent feature of CDC plans —
and it is not immediately apparent that members
would be prepared to share for their mutual benefit .
If anything the culture of individualism has been
reinforced over recent years, with the growth of
the “me” culture . Perhaps members would prefer a
smaller pension pot — as long as it was their pension
pot . The dog in the manger may be alive and well .
If we look at the current UK pensions system, we can
see that there is huge intergenerational cross subsidy
already . In summary, the older generation have well
protected, generous defined benefit pensions, while
the younger generation has much cheaper, riskier
defined contribution pensions . Logic dictates that
CDC should be a compelling case over individual
arrangements, but it is not obvious to us that the UK
is yet ready to embrace collectivism and risk-sharing
in this fashion .

The Case for Collective DC 22
Stability of CDC plans— 2008 concerns
In 2008, the DWP flagged up a concern as to whether
CDC plans work on a long-term basis:
“the results do suggest that CDC plans appear to require
a continuing stream of member contributions to ensure
100% sustainability over time and to allow risk sharing to
operate between members..”
The GAD points out that:
“It would be very difficult to contain risk levels for schemes
that had very small numbers of new entrants. When there
are few or no new members there is a higher probability
of a scheme failing and leaving some members without
any pension or facing significant cuts being made to
younger members’ pensions.”
Stability of CDC plans — what might be different now?
We agree that this issue needs to be addressed . The
Dutch solution (see Section 7) involves fewer but
larger plans than we typically have seen in the UK .
These larger plans would have a longer life than a
single employer’s plan . Even if an individual CDC plan
is closed, it could be absorbed into larger, continuing
CDC plans .
However this solution does not address the structural
issue that individual plans may become closed
at a time when they are particularly mature, and
when reducing their pension benefits would be a
major change . In our view, the public exposure of
investment, bonus and risk management policies via
the CDCPW would force a plan which had closed to
new entrants, and which was becoming increasingly
mature, to adjust its financing policy to protect the
face value of members’ benefits ie, no reduction in
core benefits .
The GAD modelling cited above looks at a CDC plan
which runs off with no new entrants — and which
failed (ran out of assets) in 40% of scenarios . But this
is unsurprising, because their plan was invested 50%
in equities, yet bought out flat annuities at retirement
and incremental tranches to cover increases in
payment . By the time there are only a few cohorts of
non-pensioners remaining, there is a huge geared
mismatch between assets and liabilities, which
cannot be absorbed by other generations . In order
to avoid these problems, our approach would be to
allow the CDC plan to de-risk its investment strategy
progressively into matching assets as the population
ran off .
Shrinking population means declining plans?
Morgan19 suggests that the shrinking UK population
is likely to place increasing strain on CDC plans and
accentuate the issues of declining CDC plans above:
“as the number of members reduces due to a shrinking
population, smoothing of returns and longevity risk is
likely to result in a disproportionate amount of the costs
being borne by the young.” We are not convinced of
the shrinking population point . ONS statistics26 state;
“The UK population is projected to increase by 4.9 million
to 67.2 million over the ten year period to 2020. This
increase is equivalent to an average annual rate of growth
of 0.8 per cent.” The working population may not be
growing as fast — but this will impact on all holders
of financial instruments — whether they are under
conventional DC schemes or CDC plans .
The trustees of CDC plans would have access to
projections of their changing membership, and could
respond appropriately to demographic trends, where
conventional DC members have no realistic choices .
For example, in our suggested CDC framework the
age from which benefits are payable would not be
fixed, but would be re-assessed on a regular basis to
keep pace with changes in longevity (see Appendix
C) . This would relieve some of the financial pressure
from population ageing and ensure that inter-
generational changes are borne more fairly .

The Case for Collective DC 23
Legal implications – 2008 concerns
How and where do CDC plans fit into European
pension legislation? The DWP ask questions such as:
“We considered whether CDC plans could fit into the
definition of money purchase plans and thus be compliant
with European legislation in a similar way to DC plans
where assets always meet liabilities.”
They point out some difficulties:
“A complexity with this lies in the practicality of assessing
the financial commitments of a plan which could reduce
its liabilities if assets fall in value. It is not clear how the
extent of such liabilities could be assessed and how to
determine funding requirements.”
The DWP noted that another EU country — the
Netherlands — has found ways to make CDC plans
work, but seem to conclude they are fundamentally
different to what we would want to offer in the UK .
More interestingly, leading pensions lawyers back in
2008 had already arrived at alternative conclusions .
Slaughter and May partner Philip Bennett said that
Collective DC plans would not breach the Directive
of Institutions for Occupational Retirement Provision
if they were correctly designed . It seems that more
effort could have been applied here .
Legal implications — what might be different now?
The UK has increasingly adopted a more
confrontational approach to Europe — or rather has
been more prepared to challenge European rulings
as they apply to UK pension plans . The spirited
challenge of UK plans to the adoption of Solvency
II would be a classic example of this new-found
enthusiasm not to accept blindly Euro initiatives .
Other European countries — notably the Netherlands
— have found ways to accommodate European
legislation for their CDC plans . In fact, Dutch plans
have made substantial changes which from a UK
perspective would appear to contravene basic
European principles – changing past benefits from
DB to CDC benefits . Against this background, we
believe that the UK government should be totally
prepared to ensure that European legislation does
not de-rail the introduction of a UK version of
CDC plans .

The Case for Collective DC 24
Potential demand for CDC plans — 2008 concerns
The DWP carried out a small-scale survey
among employers .
“In the small-scale qualitative research investigating
employer attitudes to CDC plans, it transpired that
employers were sceptical of the potential for higher returns
(due to administration costs and scepticism about the
performance of financial markets) and of the greater
predictability of CDC plan pension outcomes (as pensions
are not guaranteed).”
We suspect there is something here around the
framing of this question . Suppose we were to ask
employers the following question: “Would you be
interested in a type of pension that, at the same cost, is
expected to give your employees one third more than your
current DC plan, greater stability and predictability, but
was guaranteed not to involve you in any DB liability?”
Why would anybody not be in favour? The DWP did
note that enthusiasm was higher among existing DC
plans, rather than DB plans: “Employers with contract-
based DC schemes who would like to deliver a better
pension to their employees might consider CDC schemes,
especially if CDC schemes became the expected norm in
their industry.”
If employers are to be consulted on their attitudes
towards potential CDC plans, we believe that the
potential advantages identified in our research and
elsewhere (eg, the RSA analysis17) should be placed
firmly as a backdrop to any questioning .
Potential demand for CDC plans — what might be different now?
At the Aon Pensions Conferences in 2013, delegates
(typically pension professionals) were asked about
the government’s proposed activities under the
Defined Ambition headings of DB Lite, DC Plus and
CDC . Only 21% of the 757 responses said they felt
the current pension system was fit for purpose and
that they were satisfied with existing DC and DB
plans . Support for the DB Lite proposals was relatively
modest at 14%, suggesting that most sponsors and
plans feel the future of pensions will have little or
no DB exposure . However, there was widespread
support for looking to improve the outcomes from
DC plans, with 34% in favour of the DC Plus work-
strand, and 32% in favour of CDC solutions . As we
commented in our press release announcing these
findings: “It seems clear that the industry believes that
we could — and should — try harder to deliver better
outcomes for our DC members. The broad support
for CDC solutions was even more encouraging, and
significantly more favourable than the generally negative
stories one sees about these approaches.”27
We have also discussed the CDC concept with several
of our larger clients (typically FTSE 100 companies)
and have found an encouraging degree of interest
in the idea of collective plans, and the associated
benefits, despite the acknowledged issues .

The Case for Collective DC 25
2008 conclusions
Given the DWP analysis of the issue, one could have
been forgiven for expecting the exact opposite
conclusion to the one they gave — why not support
CDC plans, with their potential for higher, more
stable member pensions? The stated objections are
discussed above — but in our view there was another,
unstated item which may have influenced the
thinking at the time — the potential for accusations
of mis-selling . We have acknowledged throughout
this paper that there are real challenges in
communication of CDC plans and the “soft guarantee”
nature of the benefits . In particular the nature of
the guarantees that members can expect (ie, there
are none!) and the potential for reducing “granny’s”
pension . We wonder whether the government’s
reluctance to support CDC plans is that it has been
criticised for issuing misleading announcements
regarding the level of guarantees in final salary plans
and doesn’t want to run the risk of being accused of
mis-selling CDC plans .
The mis-selling of defined benefit plans?
In 2008 the Appeal Court upheld a verdict that
government mal-administration played a role in
tens of thousands of workers losing their pensions28
The previous year the High Court had ruled that
government leaflets helped mislead up to 125,000
people whose pension schemes went bust between
1997 and 2005 . Campaigners such as Ros Altmann
pointed out:
Successive Governments actively encouraged people
to join occupational pension schemes and promoted
the benefits of these, without ever mentioning the
risks. Scheme booklets were allowed to use words like
“guaranteed” and “promise” and were not required to
mention the risk that pensions might not be paid.
Since Government promoted and encouraged
occupational scheme membership (even allowing
employers to make joining the company scheme a
condition of employment) it was reasonable for members
to assume that the benefits “promised” were secure.
Official advice was that occupational schemes give a
known amount of pension, in contrast to private pensions,
which depend on investment performance and annuities
to provide a particular level of pension. In practice, this is
not true and many members would have been better off
in personal pension schemes, if they had realised the risks.
The setting up of the Financial Assistance Scheme to
help these employees — and the Pension Protection
Fund for future generations of DB members —
represented a significant cost and distraction for
the government . They would naturally be wary
of embarking on another venture (CDC) that had
the potential to be misunderstood, and where
disaffected members in years to come might
seek to blame the government for endorsing and
encouraging these plans .
The political will and demand for CDC
There is no doubt that the political will to consider
a solution such as CDC is now present, in a way that
it was patently not in 2008 . The Pension Minister,
Steve Webb, had stated that CDC would “feature
prominently” in his upcoming defined ambition
paper29 and this has been followed through in the
latest research2 . We can ask the question why he
is so enthusiastic, where previous ministers have
been more reluctant (in spite of the evidence for
improved performance)? Our view is that it has
become progressively clear that DC schemes are not
the ultimate solution to pension provision for private
sector employees in the UK and that some type
of innovation is needed . Whether that innovation
comes in the form of CDC plans, or improvements or
additions to DC schemes is a moot point — but CDC
is definitely under political consideration .

The Case for Collective DC 26
With-profits
The comparison with with-profits funds is a fair challenge, since the smoothing concepts behind
our version of CDC plans have strong similarities with the operation of with-profits funds . We
do believe that the debate has moved on substantially since the issues surrounding Equitable
Life and the decline of this once leading with-profits life office, and that many of the reasons that
commentators would cite as to why with-profits is discredited can be addressed directly and
fully in the operation of CDC plans .
• Clarity on the nature of the benefit. With-profits policies typically had a mixture of
guaranteed benefits and discretionary benefits (bonuses) on top . The separation of these
two could be confused and in some cases required High Court clarification . Our CDC plans
would operate without any underlying guarantees, and this would be made clear in all
communications to members .
• Changing expectations. Many with-profits polices operated at times of very high bonus
declarations, on the back of strong equity markets during the 1980’s and 1990’s . As market
conditions changed, and returns became more modest, there was a commercial reluctance
to reduce the projected benefits illustrated to members, and final outcomes often fell short
of (arguably over inflated) expectations . Communication of our CDC plans would be subject
to regulatory oversight and public scrutiny to ensure that expectations of outcomes are
realistically presented .
• Transparency. The financial operation of most with-profits life office funds was an opaque
process — there was little opportunity for advisers and commentators to establish the
credibility of bonus declarations and the connection back to the assets supporting the with-
profits funds . In the absence of public disclosure, challenging the life offices was extremely
difficult for external observers . Under our model, there would be complete transparency of
operation of CDC plans, via the CDC Public Website . Challenge would not be something
that a CDC plan operation could resist — transparency would be part of the essential fabric
of a CDC plan .

The Case for Collective DC 27
7. CDC around the world
Learnings
It is not the place of this paper to conduct an
extensive review of the operation of CDC plans
around the world . We have however considered
a limited number of instances of CDC — or more
broadly risk-sharing plans — to identify some lessons
and experiences that can be taken on board in
helping to frame the implementation of CDC plans
in the UK .
The Netherlands
The Netherlands is the country most commonly
quoted as having the most developed Collective DC
system . CDC plans have become increasingly popular
in recent years as employers have moved away from
defined benefit plans for reasons similar to those in
the UK . In many cases, past benefit obligations have
in effect been converted from defined benefit to
CDC benefits .
The Dutch system is characterised by two things
which differentiate it from the UK (DC) system . The
first of these is the level of contributions — typically
around 20% of pay compared to the much more
modest UK levels . The Dutch like to think of working
Friday for their retirement savings . The second
characteristic is that the Dutch have a smaller number
of large pension plans . The Dutch pension regulator
has been active in seeking to reduce the number
of schemes in their country from over 3,000 to
around 500 . Clearly from a regulatory perspective
any pension regulator would rather have a smaller
number of well-run schemes than a large number of
potentially problematic schemes .
A good overview of the Dutch system is set out in
Van Rooij et al (2007)30 and Ponds and Riel (2009)31 .
New Brunswick
What is perhaps less well known is that certain
Canadian provinces have made strides towards
Defined Ambition, risk sharing plans32 . The Province
of New Brunswick33 adopted this approach as
part of its reform of public sector pensions, which
was prompted by some familiar global issues —
unpredictable investment revenue, low interest rates
affecting fixed-incomes, and increasing costs due
to longer retirement periods . The New Brunswick
(NB) system has garnered considerable attention
and interest for its capacity to make pensions more
secure, transparent, sustainable, reliable, affordable
and predictable, and is being considered by other
Canadian provinces .

The Case for Collective DC 28
Features
Although the central rationale of the NB reforms
is that they share risks between employers and
employees, there are a number of features that we
feel can be adopted into UK CDC thinking including:
• Pension plans must be subject to robust risk
management, and be checked annually, including
stress tests .
• Risk management targets are focused on delivering
a high degree of pension security for members and
retirees .
• A pension plan should be able to demonstrate that
it will be sustainable over the long term .
• The plan must be equitably designed — no single
age cohort should unduly subsidise another, and
no one should be able to “game the system” .
• The plan must be transparent . The pension goals
and risks must be clearly stated up-front; who
shares in the risks and rewards and by how much
must be clear and pre-established .
• There should be no sudden shocks to members’
and retirees’ retirement plans .
New Brunswick stress testing
• “Stress-testing” in the context of the risk
management protocols means using 20,000
computer simulations, and demonstrating there is
a high probability of delivering sustainable benefits
under adverse financial and economic circumstances .
• The model was designed to prevent any reduction
in the base benefits in a minimum 97 .5% of
scenarios and to provide enhanced benefits such
as cost-of-living increases which on average
over all scenarios produce at least 75% of the
desired indexing . Even in the remaining 2 .5% of
scenarios, representing the most severe economic
depressions, the decreases to the base benefits
would be temporary and tightly managed .

The Case for Collective DC 29
8. Modelling CDC outcomes
Modelling
We have developed some sophisticated modelling
tools to enable us to gain insights into the potential
behaviour of CDC plans, and how they compare
with conventional DC schemes . Specifically we
have modelled:
• the historic behaviour of an illustrative CDC plan
compared with DC schemes over the period from
1930 to 2012; and
• the plans’ prospective future behaviour over the
period 2013 to 2062, using stochastic methods
to illustrate outcomes under a range of possible
economic scenarios .
The results of our modelling are framed in terms of
members’ income replacement ratios (that is, their
pension as a proportion of final pay at retirement) .
This allows for a greater level of comparability
between members retiring in different years .
Comparisons
• We contrast the pension outcomes for members
in the sample CDC plan with those that
they would be expected to receive under a
conventional Defined Contribution (“DC”) pension
arrangement .
• Appendix A contains a description of the
conventional DC schemes we have modelled .
A key feature of these DC schemes is that they are
well governed and low cost DC scheme — we are
not giving our CDC plans any inherent advantages
in terms of extra investment returns or lower costs
(although we note in passing that many current
DC schemes fall well short of these ideals) .
Appendix B sets out the CDC plan design, which
is in line with that described earlier and targets
a 1% CARE pension . Both arrangements cost the
employer the same — 10% of pay .
• As noted earlier, a wide variety of CDC plan designs
is possible and we have focussed on just one for
the modelling in this paper . Other variations of
CDC plan design could behave differently and offer
different member outcomes to the sample CDC
plan we have chosen .
Appendix E sets out the key methodology and
assumptions that lie behind our modelling .

The Case for Collective DC 30
Past performance
Chart 4 shows the income replacement ratio (pension / final pay) which would have been
achieved by a member after contributing 10% of pay each year for 25 years to either a DC
scheme or our selected CDC plan . In effect this takes Chart 1 and shows the comparison with the
CDC plan outcomes . As in Chart 1, three types of DC investment are illustrated: equities (gold),
gilts (light blue) and lifestyle (dark blue) — compared with the CDC plan outcome (grey) .
In each DC scenario, the member is assumed to purchase a CPI-linked annuity at retirement
using their accumulated fund . Under the CDC plan, the member would continue to receive
annual adjustments to their pension in the same fashion as active members of the CDC plan .
In order to illustrate a fair comparison with the DC schemes, we have taken the average pension
received during retirement for the CDC plan pensioner (expressed in real terms relative to their
retirement date) . For example, if the pensioner in the CDC plan experienced a revaluation of
CPI + 2% just after retirement and revaluations in line with CPI thereafter, then the average
retirement pension shown below would be their initial retirement pension uplifted by 2% .
Chart 4 — Historic CDC and DC outcomes
DC Gilt (Median = 14%) DC Lifestyle (Median = 21%) DC Equity (Median = 27%) CDC (Median = 28%)
0%1955 1960 1965 1970 19901975 19951980 20001985 2005 2010
Retirement year
Pens
ion
as a
per
cent
age
of fi
nal
pay
10%
30%
20%
40%
50%
60%

The Case for Collective DC 31
0%41 5347 5944 5650 6242 5448 6045 5751 6343 5549 6146 5852 64 65
Age
Proj
ecte
d in
com
e re
pla
cem
ent
rati
o at
ag
e 65
10%
30%
20%
40%
60%
50%
Observation on historic outcomes
• The average pension from the CDC plan is bigger than the average pension from all three DC
schemes . On average over this time period, it is broadly double that from the gilts-based DC
scheme, one third higher than DC lifestyle and comparable with the equity-based DC scheme .
• Simply by inspection of Chart 4, it appears that the CDC plan gives smoother outcomes for
members . For example look how the pensions for the DC lifestyle plan change so dramatically
from the start of 2000 as equity markets collapsed (repeatedly!) and interest rates (which drive
annuity prices) continue their secular drops to all time lows .
• Therefore, from a historic perspective, the CDC plan offers higher, more stable pensions .
Stability of historic outcomes
• Members will want to know what pension they can expect from their savings – especially as
they approach retirement . The greater smoothness of the CDC plan hinted at in Chart 4 is
therefore a desirable feature .
• Chart 5 below considers this in more detail . It looks at the way in which the projected pension
at age 65 varies over time for an individual member retiring in 2011 . Again, we consider the
projected pension as a percentage of projected final pay, rather than in absolute terms .
• In a DC scheme at present, a member would receive an annual SMPI statement, and may also
have access to some form of modelling and projection tools made available to plan members .
As each year passes, the projections will reflect changes in the market value of the DC account
held, and also prospective changes in annuity rates, when the account is converted into
pension . The pension illustrated at age 65 can vary significantly from one year to the next,
making retirement planning more difficult .
• Appendix E gives the full technical detail on how the projections for the DC schemes and the
CDC plan are made .
Chart 5 — Variability of projected pension for 2011 retirements
DC Lifestyle CDC

The Case for Collective DC 32
Observations
Chart 5 shows how hard it can be for a DC member to plan for retirement . Early in his career
our DC member might be planning on a pension of half his pay — the eventual figure turns out
to be rather less than one fifth of pay — a significant difference that would need to be corrected
by increasing contributions and / or deferring the chosen date of retirement .
The CDC pension only varies between 20% and 30% of pay and avoids large swings from
year to year .
Our CDC member has a smoother journey towards the eventual pension, without having
to invest heavily in “low-risk” asset classes such as bonds which would offer lower growth
prospects . As demonstrated by Chart 4, this approach also means that the benefits members
receive under CDC are more similar between generations (ie, there are inter-generational
cross-subsidies) .
CDC benefit adjustments
We have analysed the adjustments that would have been made to the CDC benefits over the
course of members’ participation in the plan . The intention is that each year an adjustment
is made in line with the increase in inflation (measured by the Consumer Prices Index, or a
proxy for it) . If the plan has a funding level in excess of 110% then additional increases may be
awarded . Conversely if the funding level falls below 90% then a lower increase may be granted
and in extreme conditions benefit cuts may need to be applied .
Chart 6 summarises the historic pattern of benefit changes for
• Our “base” design (left-hand bar)
• Two designs with alternative “control mechanisms” (that is, rules for benefit adjustment) .
– The first of these has wider and asymmetric funding “gates” — no adjustment to benefits is
made if the funding level is between 85% and 125% .
– The second variation looks at offering greater protection for older members, who are
progressively phased out of the risk of benefit cuts from ages 65 to 75 . This means that after
age 75 they are receiving a protected pension, subject to the plan revaluations each year
but shielded from any benefit cuts in periods of poor performance .
Remember that the inflationary revaluation awarded under each design is subject to an annual
minimum of zero . For example, if the CPI increase for the year is 2%, then a revaluation of
“CPI less 4%” means awarding a revaluation of 0% (not -2%) .

The Case for Collective DC 33
Chart 6 — Historic adjustment to benefits
Revaluation addition: CPI plus 4–8% CPI plus 0–4% Revaluation targetRevaluation reduction: CPI less 0–4% CPI less 4%+Cut core benefit: Cut core benefit by 0–10% Cut core benefit by 10%+
Observations
• For all three designs, the revaluation part of the control mechanism is sufficient to keep plan
funding on track in about 96% of cases (without resorting to any core benefit cuts) .
• The design with the 85% – 125% funding gate reacts more slowly to both good and
bad performance .
This means
– There are fewer and smaller benefit cuts, but…
– … the revaluation control mechanism is less generous more of the time (for example, there
are around twice as many years with a revaluation target of CPI less 4%+ compared with
the base design) . This is because the plan funding level has to improve by 40% (from 85%
to 125%) in order to restore the revaluation target once it has fallen initially . This compares
with a movement of just 20% in the base design .
– The plan’s funding level is more volatile than in the base design (ie, the plan is allowed
to carry a larger surplus or deficit before any correction is imposed by way of benefit
adjustment) .
– Members’ income replacement ratios in retirement are (slightly) more uncertain, and less
smooth between generations . This is because the revaluation target is more “sticky” and
less inclined to average out over a member’s time in the plan .
100%
90%
80%
70%
60%
50%
40%
30%
20%
10%
0%Base case
Freq
uen
cy
Wider gates Tapered exposure

The Case for Collective DC 34
Observations (continued)
The last two points are not in themselves evident from Chart 6, but are supported by the more
detailed analysis we have performed on these design sensitivities (which is set out in
Appendix D) .
• The design with tapered exposure to benefit cuts behaves broadly the same as the base
design except where a cut is actually required .
– This means the chance of benefit cuts being imposed is unchanged (around 4% for the
past history modelled), but…
– … when cuts are required, they apply only to the younger members (and are larger as
a consequence) .
– Even for a mature CDC plan like the one we have modelled, the risk of substantial benefit
cuts for younger members remains relatively small (2 years out of 82 with a benefit cut
greater than 10%) . Clearly this is a matter of perspective — but it does illustrate that some
protection of older members can be viable in principle .
– Again, members’ income replacement ratios in retirement are more uncertain overall with
this design than with the base design, because there is less risk sharing between members
and so reduced “smoothing” of outcomes for each individual .
This last point is not evident from Chart 6, but can be seen from the more detailed modelling set
out in Appendix D .

The Case for Collective DC 35
Alternative Illustration
Moving back to the base design, the scale and frequency of benefit adjustments is further
illustrated in Charts 7 and 8 . These show (respectively):
• The benefit addition to / deduction from CPI and, separately, the extent of any benefit cut
each year during the period .
• The combined effect of these factors each year (in terms of the overall adjustment applied to
accrued benefits) .
For example in 1995, the increase awarded would have been 7 .5% — which was a 5% bonus on
top of CPI for that year of 2 .5% .*
Chart 7 — Historic adjustment to benefits over time
Revaluation target (addition to CPI) Benefit adjustment
* Of course the astute reader will know that the CPI was only introduced from 1996. Our historic modelling uses the increase in RPI less 0.8% as a proxy for the notional increase in CPI each year. This is based on the average difference between CPI and RPI increases for the period where both have been published. Appendix E sets out further details on the methodology and extrapolation of historic data.
10% 10%
5% 5%
0% 0%
-5% -5%
-10% -10%
-15% -15%
-20%
Year
-20%
1931
1936
1941
1946
1951
1956
1961
1966
1971
1976
1981
1986
1991
1996
20012006
2011
Perc
enta
ge

The Case for Collective DC 36
Chart 8 — Combined effect of historic adjustment to benefits over time
Observations
• The overall pattern of increases looks consistent with what one would expect . In the late 1980s
an1990s, against a background of roaring equity markets and reasonable levels of real interest
rates, bonuses were regularly awarded in excess of the anticipated rates . This positioning
changes as conditions deteriorated in the aftermath of the dot com bust, and as interest rates
continue their secular declines .
• In 96% of years no reduction to base benefits would have applied .
• The 3 reductions to base benefits which would have applied were 8% (in 1932), 12% (in 1941)
and 2% (in 1953) .
• So even in the shadow of global economic turbulence, with the Great Depression in the early
1930s and the Second World War in the early 1940s, benefit reductions were rare and limited
to around 10% .
1941
1956
1931
1936
1941
1946
1951
1956
1961
1966
1971
1976
1981
1986
1991
1996
2001
2006
2011
Year
-10%-10%
-5%-5%
0%0%
5%5%
10%10%
15%15%
Perc
enta
ge
20%20%

The Case for Collective DC 37
Pens
ion
as a
per
cent
age
of fi
nal
pay
(L
ogar
ith
mic
Sca
le)
Future projections
To obtain a better feel for the behaviour of our CDC plan in different economic circumstances
(other than those actually experienced over the past 80 years), we have also tested our
illustrative design over a distribution of possible future economic scenarios .
We have looked at an “existing” scheme that starts with a mature steady state membership
at today’s date, and also starts life fully funded . We then project a large number of future
simulations (around 450) between 2013 and 2062, encompassing a wide range of economic
scenarios, asset returns and other financial conditions .
As in our past analysis we look at the income replacement ratio for members retiring over a
range of years (this time 2037 to 2046) after contributing 10% of their pay to the plan for 25
years . However, we are no longer just looking at the distribution of member outcomes over time
— instead we are looking at the distribution of member outcomes across all 10 years of all 450
scenarios (ie, 4,500 outcomes altogether) .
As previously noted, under the CDC plan, the member would continue to receive annual
adjustments to their pension when it is payment (in the same fashion as active and deferred
members) . We have therefore used their average pension in retirement (expressed in real terms
relative to the retirement date) as a measure of outcome consistent with the DC schemes .
For each plan design, we have shown in Chart 9 the “average” (median) of the 4,500 outcomes
as the heavy black line . The potential range of outcomes is illustrated by the coloured areas which
incorporate every tenth percentile of the distributions (up to the 10% and 90% percentiles) .
Chart 9 — Summary of projected outcomes (for retirements 2037 to 2046)
75th Percentile Median 25th Percentile
Ranked outcomes by
80–90% 75–80% 70–75% 60–70% 50–60% 40–50% 30–40% 25–30% 20–25% 10–20%
DC lifestyle(Median = 20%)
DC gilt(Median = 12%)
DC equity(Median = 24%)
CDC(Median = 33%)
10%
20%
30%
40%
50%60%
100%90%80%70%

The Case for Collective DC 38
Observation
• The median projected pension for the CDC plan
is higher than for all three DC scenarios: one third
higher than DC Equity; two thirds higher than DC
Lifestyle and over double the outcome from the
DC Gilt plan .
• The distribution of outcomes for the CDC pension
is broadly similar to those under the DC Equity
scheme — in fact the modelling shows a slightly
wider distribution . This is essentially because the
CDC plan has a higher exposure to equities (which
are inherently more uncertain) than the DC schemes
over the course of the member’s participation .
• However, if we look at the distribution of the
outcomes broken into deciles, we find that the
CDC outcomes are consistently higher at every
decile than the DC outcomes . So the distribution of
ultimate outcomes may be wider for the CDC plan
than its DC comparators — but the unpredictable
element is just how much better it will be than the
corresponding DC scheme!
• Furthermore, the CDC plan delivers a smoother
ride to members as they accrue benefits in the
plan (in spite of the greater exposure to equities) .
We can see this by delving a little deeper into the
results in the chart that follows .
Further detail
Chart 10 again looks at the distribution of outcomes
for members retiring in the 10-year window 2037 –
2046 after contributing 10% of their pay to the plan
for 25 years . But this time we have split the overall
distribution down into the range of outcomes for
each simulation scenario .
• For each of the simulated scenarios (horizontal axis)
we have plotted the spread of pension outcomes
at retirement (vertical axis) for members retiring
in years 2037 to 2046 inclusive . The heavy line
represents the median outcome in each scenario,
and the fainter lines depict the 5%, 25%, 75% and
95% percentiles of the outcomes for that scenario .
• The simulated scenarios have been plotted in
order of ascending median outcome for visual
clarity . (Note that this order has been determined
separately for CDC and DC Lifestyle, so the points
will not necessarily correspond scenario-by-
scenario along the horizontal axis .)
We have again analysed all three DC flavours, but the
chart below focuses on just DC Lifestyle to avoid
becoming cluttered .
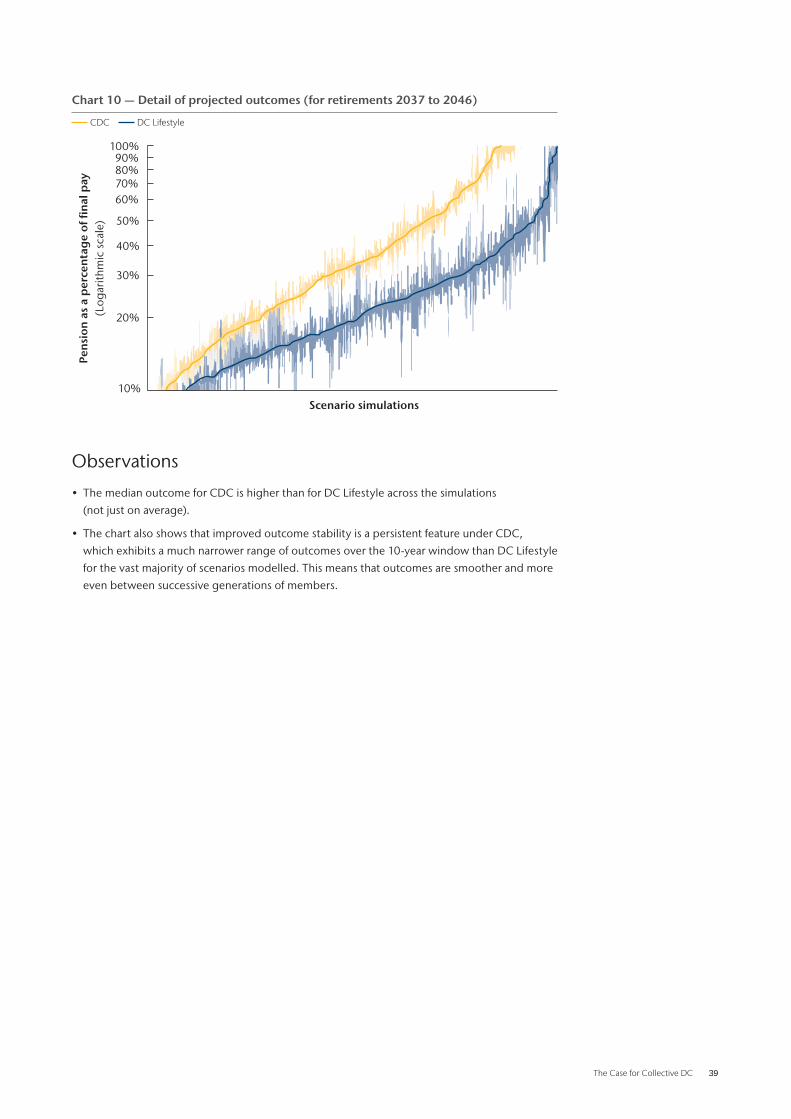
The Case for Collective DC 39
Chart 10 — Detail of projected outcomes (for retirements 2037 to 2046)
CDC DC Lifestyle
Observations
• The median outcome for CDC is higher than for DC Lifestyle across the simulations
(not just on average) .
• The chart also shows that improved outcome stability is a persistent feature under CDC,
which exhibits a much narrower range of outcomes over the 10-year window than DC Lifestyle
for the vast majority of scenarios modelled . This means that outcomes are smoother and more
even between successive generations of members .
100%
30%
Pens
ion
as a
per
cent
age
of fi
nal
pay
(Log
arith
mic
sca
le)
Scenario simulations
40%
20%
10%
60%
90%
50%
80%70%
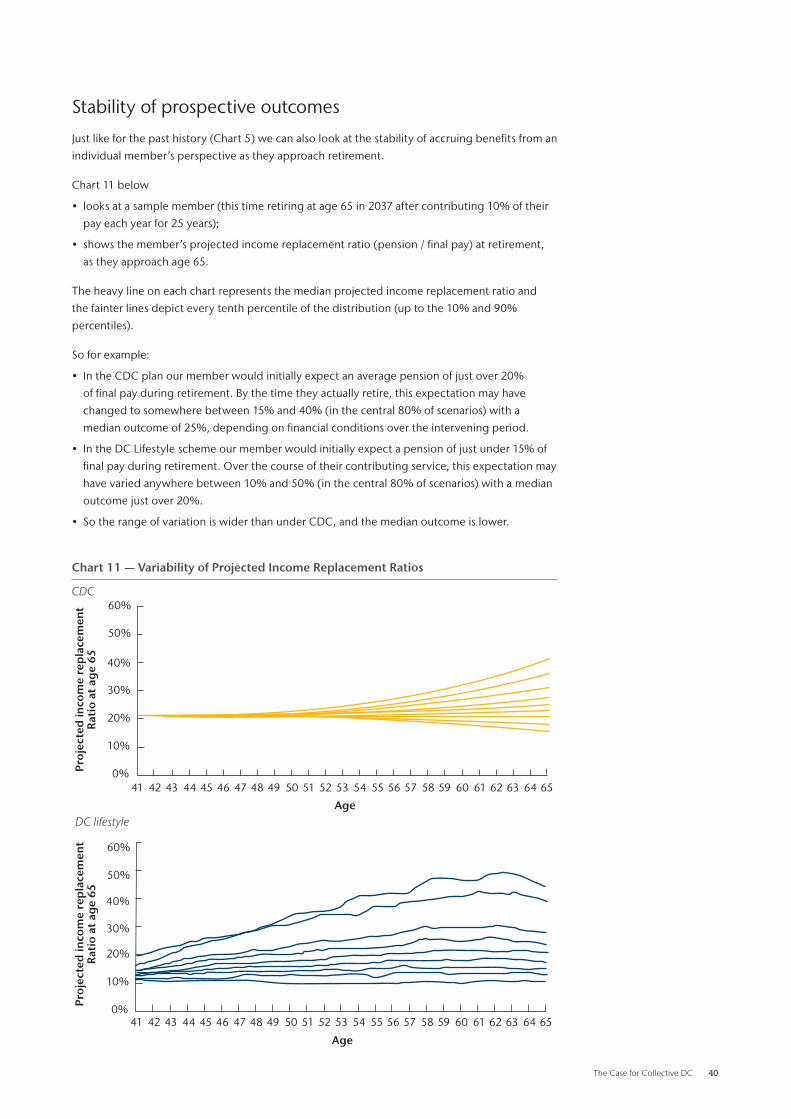
The Case for Collective DC 40
Stability of prospective outcomes
Just like for the past history (Chart 5) we can also look at the stability of accruing benefits from an
individual member’s perspective as they approach retirement .
Chart 11 below
• looks at a sample member (this time retiring at age 65 in 2037 after contributing 10% of their
pay each year for 25 years);
• shows the member’s projected income replacement ratio (pension / final pay) at retirement,
as they approach age 65 .
The heavy line on each chart represents the median projected income replacement ratio and
the fainter lines depict every tenth percentile of the distribution (up to the 10% and 90%
percentiles) .
So for example:
• In the CDC plan our member would initially expect an average pension of just over 20%
of final pay during retirement . By the time they actually retire, this expectation may have
changed to somewhere between 15% and 40% (in the central 80% of scenarios) with a
median outcome of 25%, depending on financial conditions over the intervening period .
• In the DC Lifestyle scheme our member would initially expect a pension of just under 15% of
final pay during retirement . Over the course of their contributing service, this expectation may
have varied anywhere between 10% and 50% (in the central 80% of scenarios) with a median
outcome just over 20% .
• So the range of variation is wider than under CDC, and the median outcome is lower .
Chart 11 — Variability of Projected Income Replacement Ratios
CDC60%
60%
50%
50%
Proj
ecte
d in
com
e re
pla
cem
ent
Rat
io a
t ag
e 65
Proj
ecte
d in
com
e re
pla
cem
ent
Rat
io a
t ag
e 65 40%
40%
30%
30%
20%
20%
10%
10%
0%
0%
41
41
42
42
43
43
44
44
45
45
46
46
47
47
48
48
49
49
50
50
51
51
52
52
53
53
59
59
54
54
60
60
55
55
61
61
56
56
62
62
57
57
63
63
58
58
64
64
65
65
Age
Age
DC lifestyle

The Case for Collective DC 41
Observations
This chart shows that a CDC plan would deliver a
more stable pension expectation than a typical
DC Lifestyle arrangement .
So as members save each year they see their
estimated income replacement ratio at retirement
(allowing for future contributions and future
expected investment returns) vary by very little
year on year, something that is significantly lacking
in today’s DC schemes . And they can achieve this
without having to invest heavily in “low-risk” asset
classes such as bonds which would offer lower
growth prospects .
Prospective benefit adjustments
We acknowledge that Chart 11 only considers the
position pre retirement and that CDC plans are more
uncertain post retirement than DC schemes . So
in Chart 12, we have also repeated the analysis
illustrated earlier about benefit adjustments, but
based on the prospective economic scenarios . The
conclusions mirror those of Chart 6, but looking at
prospective future outcomes, and are as one would
expect . You can see in the base case that 70% of the
scenarios deliver higher than the target benefits,
so the post retirement CDC plan is more uncertain
but on average it increases the additional benefits
compared with the DC scheme .
We have again illustrated three potential variations
of our CDC plan — the base case model (with control
gates at 90% and 110% funding), the wider gates
of 85% and 125% and the tapering protection for
older members .

The Case for Collective DC 42
Observations
The analysis of future projections shows that under the base design:
• in around 95% of years no reduction is applied
• in around 3% of years a reduction is applied of between 0% and 10%
• in around 2% of years a reduction is applied of more than 10%
If we look (Appendix D) at our scheme with age tapering to offer greater protection for older
pensioners, then in none of the projections do the pensioners over age 75 suffer a benefit cut
— in 29% of cases pensions are not fully increased in line with inflation . The consequence of this
greater protection for older members is that younger members are more likely to suffer a larger
benefit reduction . The figures of 95%, 3% and 2% above would move to 95%, 2% and 3% . That
is, the overall likelihood of benefit cuts is unchanged, but the magnitude of any cuts would be
higher . Having said that, one could argue that the extra risk looks reasonable compared with the
additional security for pensioners .
The potential for benefit reductions in a CDC framework would of course require careful
communication and management .
However, we need to remember that:
• The security of members’ pensions in a conventional DC arrangement is no better than CDC
overall (it is just that the volatility is concentrated pre-retirement and at the point of annuity
purchase) . One could argue that sharing the volatility between employees and pensioners is
more equitable .
• It appears viable to use a design structure where the exposure to potential reductions is
tapered by age and hence lower for pensioners in payment (as above) . It should be possible
to refine this design further so as to optimise inter-generational fairness (using a symmetrical
exposure to greater upside performance for younger members) .
• The CDC design can be formulated so that any reductions are restored as a priority before
increasing the target revaluation rate going forward . This makes it more likely that reductions
will be temporary and members’ benefits will be more stable in the long run .
Revulation addition
Revulation target
Revulation deduction
(CPI)
CPI plus 4% to 8%CPI plus 4% to 8%
CPI plus 4% to 8%
CPI plus 0% to 4%
CPI plus 0% to 4%
Cut core benefit
Cut core benefit
Cut core benefit
(by 0% to 10%)
(by 10%+)
Chart 12 — Prospective adjustment to benefits
Revaluation addition: CPI plus 8% CPI plus 4–8% CPI plus 0–4% Revaluation targetRevaluation reduction: CPI less 0–4% CPI less 4%+Cut core benefit: Cut core benefit by 0–10% Cut core benefit by 10%+
100%
90%
80%
70%
60%
50%
40%
30%
20%
10%
0%Base case
Freq
uen
cy
Wider gates Tapered exposure

The Case for Collective DC 43
9. Conclusions
Modelling conclusions
By sharing risk between members we achieve higher,
more stable pension outcomes for members, than by
using an individual DC pension arrangement .
In addition, the implementation of a collective
arrangement may offer scope for further savings or
enhanced outcomes compared with an individual
product (for example, reduced administration
overheads, or higher investment returns) . We have
not analysed such savings in this paper, but it is
worth noting here .
“The best is the enemy of the good”
Voltaire
Collective DC may not be the perfect pensions
system — but there again, most other pensions
systems have been shown to have significant flaws .
It has always been relatively easy to criticise CDC and
to spot potential flaws . But CDC has many powerful,
good aspects that should improve retirement
outcomes for many UK workers — collective
investment by professionals not members, benefits
expressed in income terms not capital accounts,
not having to buy an annuity at poor times in the
market to name but a few . CDC deserves a chance
to demonstrate how it can deliver better member
outcomes and this paper sets out our (balanced)
reasons for coming to that conclusion — warts and all .
The Case for Collective DC 44
References1 . Department for Work and Pensions; November 2012, Reshaping Workplace pensions for future
generations. Command 8478.
2 . Department for Work and Pensions; November 2013, Reinvigorating Workplace pensions.
Command 8710.
3 . Pensions Policy Institute; June 2012, The changing landscape of pension schemes in the private
sector in the UK.
4 . Pensions Policy Institute; October 2007, The changing landscape for private sector Defined Benefit
pension schemes.
5 . House of Commons; 12 December 2012, Oral evidence taken before the Work and Pensions
Committee on Governance and Best Practice in Workplace Pension Provision, accessible at
http://www .publications .parliament .uk/pa/cm201213/cmselect/cmworpen/c768-iii/c76801 .htm
6 . The Employment Equality (Repeal of Retirement Age Provisions) Regulations 2011 .
7 . The Daily Mail; 12 August 2013, Millions forced to take pension gamble: Annuity rates now so
bad you’d have to live to 90 to get value for money, accessible at http://www .dailymail .co .uk/news/
article-2390732/Millions-forced-pension-gamble-Annuity-rates- bad-youd-live-90-value-moneyhtml .
8 . Professional Pensions; 13 June 2013, Defined Ambition Competition 2013 – The winners, accessible
at http://www .professionalpensions .com/professional- pensions/news/2274698/defined-
ambitioncompetition-2013-the-winners .
9 . De Nederlandsche Banke; 25 April 2013, DNB assesses pension funds’ recovery plan evaluations,
accessible at http://www .dnb .nl/en/news/news-and-archive/nieuws- 2013/dnb290230 .jsp# .
10 . Aon; 2013, Global Pension Risk Survey 2013: UK survey findings, accessible at http://www .aon .com
unitedkingdom/pension-risk .jsp .
11 . Byrne, A .; 2007, Employee Saving and Investment Decisions in Defined Contribution Pension Plans:
Survey Evidence from the UK, Financial Services Review, Vol . 16, No . 1 .
12 . Choi, J . Laibson, D . Madrian, B .; 2011 . $100 bills on the sidewalk: Suboptimal investment in 401 (k)
plans . Review of Economics and Statistics 93, 748-763 .
13 . Lusardi, A . Mitchelli, O . 2007; Financial literacy and retirement preparedness: Evidence and
implications for financial education. Business Economics 42, 35-44 .
14 . Byrne, A . Dowd, K . Blake, P . Cairns, A .; 2007, Default Funds in UK Defined Contribution Pension
Plans, Financial Analysts Journal, July/August 2007 .
15 . Crawford, R . Tetlow, G .; November 2012, Expectations and experience of retirement in Defined
Contribution pensions: a study of older people in England, The Institute of
Fiscal Studies .
16 . Department for Work and Pensions; December 2009, Modelling Collective Defined Contribution
Schemes: A summary of The Government Actuary’s Department modelling of collective defined
contribution schemes .
The Case for Collective DC 45
17 . RSA; July 2012, Collective Pensions in the UK .
18 . Which? News, 26 April 2013; Annuity rate decline revealed, accessible at
http://www .which .co .uk/news/2013/04/annuity-rate-decline-revealed-317692/ .
19 . Morgan, L .; July 2013, Collective DC – digging a deeper hole, Schroder
Investment Management .
20 . Cui, J . Jong, F . Ponds, E . 2011; Intergenerational risk sharing within funded pension schemes Journal of
Pension Economics and Finance 10, 1-29 .
21 . Gollier, C . 2008; Intergenerational risk-sharing and risk-taking of a pension fund . Journal of Public
Economics 92, 1463-1485 .
22 . Bams, D . Schotman, P . Tyagi, M; January 2013: Optimal risk sharing in a collective defined contribution
pension system, International Mathematical Finance Conference, Bradley University .
23 . Department for Work and Pensions; December 2009, Collective Defined Contribution Schemes: An
assessment of whether and how collective defined contribution schemes might operate in the UK.
24 . Lewin, C, and Sweeney, E .; July 2007, Deregulatory Review of Private Pensions: An independent report to
the Department for Work and Pensions .
25 . Department for Work and Pensions; December 2008, Risk Sharing Consultation: Government response .
26 . ONS (2011), National Population Projections, 2010-Based Projections, accessible at
http://www .ons .gov .uk/ons/rel/npp/national-population-projections/2010-based-projections/sum-2010-based-
national-population-projections .html .
27 . Aon:31 July 2013, Aon conference delegates support defined ambition but remain concerned
over potential future government tinkering, accessible at http://aon .mediaroom .com/index .
php?s=25776&item=136721 .
28 . BBC News; 7 February 2008, Court maintains pension verdict, accessible at:
http://news .bbc .co .uk/2/hi/business/7232410 .stm .
29 . Financial Times; 30 June 2013, UK considers Dutch-style collective pensions, accessible at:
http://www .ft .com/cms/s/0/03ec45c8-df16-11e2-881f-00144feab7de .html#axzz2dID419t2 .
30 . Van Rooij, M . Kool, C . Prast, H . 2007; Risk-return preferences in the pension domain: are people able to
choose? Journal of Public Economics 91, 701-722 .
31 . Ponds, E . Riel, B .; 2009, Sharing risk: the Netherlands’ new approach to pensions. Journal of Pension
Economics and Finance 8, 91-105 .
32 . Aon: 2013, Target Benefit Plans; The Future of Sustainable Retirement Programs, accessible at
http://www .aon .com/canada/products-services/human-capital- consulting/consulting/target_benefit_
plans/index .html .
33 . A Government of New Brunswick report; February 2013, Rebuilding New Brunswick:
The Case for Pension Reform .

The Case for Collective DC 46
Appendix A — Illustrative DC Scheme design
DC scheme design
We have calculated outcomes from a specimen DC
scheme, and in our modelling have compared this
with outcomes from a CDC plan . The design of the
baseline DC scheme is set out below .
Basic design
• Contributions have been set at 10% of pay each
year — the cost of any risk benefits and expenses of
administration would be in addition and has been
excluded from our modelling . The full 10% goes
towards providing retirement benefits .
• Pay increases in line with the UK’s National Average
Earnings each year, overlaid with an allowance for
additional promotional increases .
• Retirement occurs at age 65, at which point the
member (assumed to be male) ceases contributions
and starts to draw their pension;
• We have modelled “Equity”, “Gilt” and “Lifestyle”
approaches to the investment of the DC funds .
These are simplified approaches — “Equity” is
UK equities, “Gilt” is UK government bonds and
“Lifestyle” means a 10 year linear switch from
equities to gilts leading up to retirement at age 65 .
• Contributions are assumed to be invested in the
relevant asset class up to retirement and then
disinvested to purchase an immediate annuity .
Annuity purchase
• There is an 80% chance of the member being
married at age 65 (in which case the member’s
spouse is assumed to be female and 3 years
younger and a 50% contingent spouse’s pension
is purchased) .
• All members survive until age 65 (and continue
contributing to the plan over that period) .
• At age 65 the member purchases an inflation
linked annuity, which increases in line with CPI
each year . In practice CPI linked annuities have not
existed throughout this period and so we have
approximated their cost, using net interest rates
and a suitable longevity assumption .
• Mortality rates are in line with the “S1PxA” standard
tables published by the Actuarial Profession’s
Continuous Mortality Investigation (CMI), with
assumed improvements in mortality rates from
2002 in line with the CMI 2011 projections model
using a long-term improvement rate of 1 .25% p .a .

The Case for Collective DC 47
Appendix B — Illustrative CDC plan design
CDC plan design
The base design modelled here is simply an example
to draw out the key features of CDC behaviour .
We are not suggesting that this design is
optimal . Although it is a reasonable candidate for
investigation, there are refinements which could be
made to improve its performance (depending on the
criteria which one uses to measure this) .
Target benefits
• 1% CARE accrual payable from age 65 .
• Attaching spouse’s pension payable at a 50% rate if
the member dies after retirement .
• Revaluations of 100% of CPI (zero floor, no cap) –
both pre and post retirement .
• Company contributions 10% of pay
(no member contributions) .
• Assets held 60% in UK equities, 40% in
UK government bonds .
• Cash commutation would be available, but for
simplicity has been excluded from this modelling .
Control mechanism
• Each year the plan’s funding level (the value of
the assets divided by the value of the liabilities) is
measured based on the CARE-style benefits which
have accrued up to that point in time .
• The funding assessment is performed using a
market value of assets and a set of market-
consistent best estimate assumptions for valuing
the plan liabilities . The liabilities valued use the
base pension to date, including any past increases
awarded and any benefit cuts made . They allow
for future revaluations in line with those set after
the latest annual funding review (rather than the
100% CPI target) .
• If the assessed funding level is outside the window
of 90% - 110% then the following adjustments
(in order) are made to return the funding level to
either 90% or 110% by:
(i) The revaluation target for the current and
all future years is changed via a uniform
percentage adjustment up or down (with the
resulting revaluation subject to a zero floor);
(ii) A one-off benefit reduction (applied as a fixed
percentage uniformly to all members) .
• Pensioner benefits are paid from the plan during
retirement, rather than being bought out with an
annuity provider (for example) .
• Pensions in payment are exposed to both levers (i)
and (ii) above .

The Case for Collective DC 48
Appendix C — Draft regularity framework
Some ground rules
A potential system of governance and financial
management of CDC plans in the UK context is set
out below .
Benefits
Target benefits are split into two parts:
• Base benefits, which represents the amount of all
benefits accrued to date plus any past ancillary
benefits awarded to the relevant date .
• Ancillary benefits, which are the expected
additional benefits — principally increases to
pensions in payment, and revaluations of base
benefits for active and deferred members . It may
also include enhanced early retirement terms
and any improvements in the normal form of
the pension . Using funding surpluses to improve
ancillary benefits may only be allowed after all past
indexing of the base benefit has been provided .
Target benefits then consist of Base Benefits plus
future Ancillary Benefits .
Pivotal pension age
Benefits are expressed as payable from a Pivotal
Pension Age (PPA) decided by the employer . There
will be flexibility for members to choose any other
age to draw all or part of their benefit, in which case
actuarially equivalent benefits will be paid . The PPA
will be increased (or reduced) by the Plan Actuary
on a regular basis (at least once every three years)
to reflect expected and experienced changes in the
longevity of Plan members . The adjustment to PPA
will apply to all of the benefits earned by active and
deferred members — ie, in respect of both future
and past accruals .
Contributions
• The employer’s obligation to contribute is fixed and
finalised at the point any contribution is made . The
contribution may be a common percentage of pay,
or may vary according to the age of the member .
• Increased employer contributions are not an
inherent part of the CDC model .
• Contribution reductions or contribution holidays
are not permitted for CDC plans .
• CDC plans will be funded solely by way of
employer contributions . Any member contributions
would be invested on a conventional DC basis, and
could be applied primarily to provide the member
with any desired tax free cash on retirement .
Trustees and disclosure
• A CDC plan operates at arm’s length from the
employer or sponsor and is administered by a
group of trustees . The primary duty of the trustees
is to manage the finances of the plan to award
equitable distribution of investment returns to
different generations of plan members .
• The Trustees’ governance process and approach
to financial management must be open and
transparent, and subject to public scrutiny .
• The Trustees must produce and publish documents
regularly on a CDC Public Website (the CDCPW) .

The Case for Collective DC 49
CDC Public Website
The key documents to be disclosed on the CDC
Public Website are:
• A Statement of Investment Policies, and regular
reports on investment performance
• A Statement of Funding Policies and regular
actuarial updates
• A Statement of Risk Management Policies, and
regular testing of those principles
• A Statement of Bonus Policy and regular updates
showing the operation of the bonus policy in action
Statement of Investment Policies
• The Trustees will produce a Statement of Investment
Policies, setting out their policy concerning:
– the kinds of investments to be held
– the balance between different kinds of
investments
– risks, including the ways in which risks are to be
measured and managed
– the expected return on investments
– the realisation of investments
– the extent (if at all) to which social,
environmental or ethical considerations are
taken into account in the selection, retention and
realisation of investments
• The Trustees will receive and publish regular
reports on the investment performance of the Plan
and the attribution of their achieved returns
• Investment reports will be produced at least quarterly
Statement of funding policies
• The Trustees must ensure that an actuary values
the plan at least once a year, and publish the results
on the CDCPW
• The actuarial valuation will show the extent to
which there is a surplus or deficit in the plan
• The actuarial report will disclose the full
assumptions underlying the calculations, to
enable another independent actuary to carry out
the calculations and verify the results . Assumptions
will include anticipated future investment returns,
correlations between asset classes as well as
liability profiles
• The actuarial valuation will also disclose the
probability of having to make cuts in base benefits
and the actions to be taken to keep this probability
to acceptable levels
• Quarterly interim updates of funding are to be
encouraged, and daily updates could be
made available

The Case for Collective DC 50
Statement of Risk Management policies
• The Trustees must formulate and publish details of
their risk management policies and procedures
• At least once a year they will publish on the
CDCPW the results of the stress testing they have
carried out
• Stress testing is required to provide the flexibility
and forewarning to enable the Trustees to take
corrective measures so that base benefits and
ancillary benefits can be delivered with the
appropriate degree of confidence
Statement of bonus policy
• The Trustees must formulate and publish details of
their policies for dealing with variations from their
expected funding position – dealing with surpluses
and deficits
• The Bonus Policy will set out how the Trustees will
award additional ancillary benefits in the event that
the funding is better than anticipated
• The Bonus Policy will also describe how benefit
reductions will be applied if the funding is less
than anticipated
• Of particular interest will be the process for
reducing base benefits in the rare and unexpected
circumstances where this is necessary . Different
potential approaches are possible, such as:
– The reduction is borne by all plan beneficiaries
(actives, deferreds and pensioners) in the same
proportion
– The reduction is tapered so that older members
(eg, those approaching and in retirement) are
less likely to experience reductions . The counter
to this should be that younger members gain
proportionately more of the upside rewards
Payments in and out
• Any transactions between the CDC plan and other
registered scheme will take place on the basis of
the (disclosed) actuarially assessed fair value of the
member’s interest in the CDC plan
• So individual transfers will be an approximation
to a share of fund — a practical computation will
be required, but this should reduce the impact
that even significant transfers out have on the
remaining members

The Case for Collective DC 51
Appendix D — Modelling CDC design sensitivities
Control mechanism
In Section 8 of this paper we (briefly) described the
results of our testing two sensitivities to the “base”
control mechanism set out in Appendix B .
• In the base design, the intention is that each year
an adjustment to benefits is made in line with the
increase in inflation (measured by the Consumer
Prices Index, or a proxy for it) . If the plan has a
funding level in excess of 110% then additional
increases may be awarded . Conversely if the
funding level falls below 90% then a lower increase
may be granted and in extreme conditions benefit
cuts may need to be applied (in which case they
are applied uniformly across all non-pensioner
and pensioner members) .
Perc
enta
ge
5% 5%
5%
10% 10%
10%
0% 0%
0%
-5% -5%
-5%
-10% -10%
-10%
-15% -15%
-15%
-20%
Perc
enta
ge
Perc
enta
ge
5%
5%
10%
10%
0%
0%
-5%
-5%
-10%
-10%
-15%
-15%
-20%
-20%
1931
1931
1931
1936
1936
1936
1941
1941
1941
1946
1946
1946
1951
1951
1951
1956
1956
1956
1961
1961
1961
1966
1966
1966
1971
1971
1971
1976
1976
1976
1981
1981
1981
1986
1986
1986
1991
1991
1991
1996
1996
1996
2001
2001
2001
2006
2006
2006
2011
2011
2011
Year
Year
Year
5%
10%
0%
-5%
-10%
-15%
-20%
• The two sensitivities we have tested are designs
with alternative “control mechanisms” (that is,
rules for benefit adjustment) .
– The first of these has wider and asymmetric
funding “gates” – no adjustment to benefits
is made if the funding level is between 85%
and 125% .
– The second variation looks at offering greater
protection for older members, who are
progressively phased out of the risk of benefit
cuts from ages 65 to 75 . This means that after
age 75 they are receiving a protected pension,
subject to the plan revaluations each year but
shielded from any benefit cuts in periods of
poor performance .
This appendix sets out some further detail on the
comparative output from the three design variations .
Chart 13 — Historic adjustment to benefits over times
Revaluation target (addition to CPI) Benefit adjustment
Wider gates
Tapered exposure
Base case

The Case for Collective DC 52
Chart 14 — Combined effect of historic adjustment to benefits over time
Observations
The top left figure in Chart 13 is the same as Chart 7 from the main body of the paper (and by
a similar token the top left figure in Chart 14 is the same as Chart 8) . The other two charts show
how our design sensitivities would perform over identical financial conditions between 1930
and 2012 .
You can see that:
• The design with 85%-125% funding gate reacts more slowly to both good and bad performance .
This means
– The benefit cuts tend to be smaller, but…
– … the revaluation control mechanism is less generous more of the time . This is because
the plan funding level has to improve by 40% (from 85% to 125%) in order to restore the
revaluation target once it has fallen initially . This compares with a movement of just 20% in
the base design .
• The design with tapered exposure to benefit cuts behaves broadly the same as the base
design except where a cut is actually required .
– This means the behaviour of the revaluation mechanism, and the incidence of cuts are
unchanged, but…
– … when cuts are required, they apply only to the younger members (and are larger as
a consequence) .
1946
1961
1951
1966
1956
1971
1976
1981
1986
1991
1996
2001
20062011
20061936
19411946
19611951
19661956
19711976
19811986
19911996
20012011
19311936
1941
1946
1961
1951
1966
1956
1971
1976
1981
1986
1991
1996
2001
20062011
19311936
1941
19461961
19511966
19561971
19761981
19861991
19962001
20062011
19311936
1941
1946
1961
1951
1966
1956
1971
1976
1981
1986
1991
1996
2001
20062011
193619
41
5%10%
10%
Wider gates
Tapered exposure
Base case
Year
Year
Year
10%
Perc
enta
ge
Perc
enta
ge 5%
10%
10%20%
20%
20%
10%
20%
0%0%
0%
0%
0%
0%
-10%-10%
-10%
-10%
-10%
-10%
-20%-20%
-20%
-20%
-30%
-20%
-20%
-30%
1931
Perc
enta
ge

The Case for Collective DC 53
Chart 15 — Historic funding level over time
ObservationsChart 15 shows how the CDC plan’s funding level would have varied over the historic period modelled .
The key point to draw from this is that the design with 85%-125% funding gate exerts a looser
control over the funding level than the other designs (ie, the plan is allowed to carry a larger
surplus or deficit before any correction is imposed by way of benefit adjustment) .
Wider gates
Tapered Exposure
Base case
1946
1961
1951
1966
1956
1971
1976
1981
1986
1991
1996
2001
20062011
193619
411931
80%85%
95%100%105%110%
130%
Fun
din
g le
vel
90%
115%120%125%
1946
1961
1951
1966
1956
1971
1976
1981
1986
1991
1996
2001
20062011
193619
411931
80%85%
95%100%105%110%
130%
Fun
din
g le
vel
90%
115%120%125%
1946
1961
1951
1966
1956
1971
1976
1981
1986
1991
1996
2001
20062011
193619
411931
80%85%
95%100%105%110%
130%
Fun
din
g le
vel
90%
115%120%125%
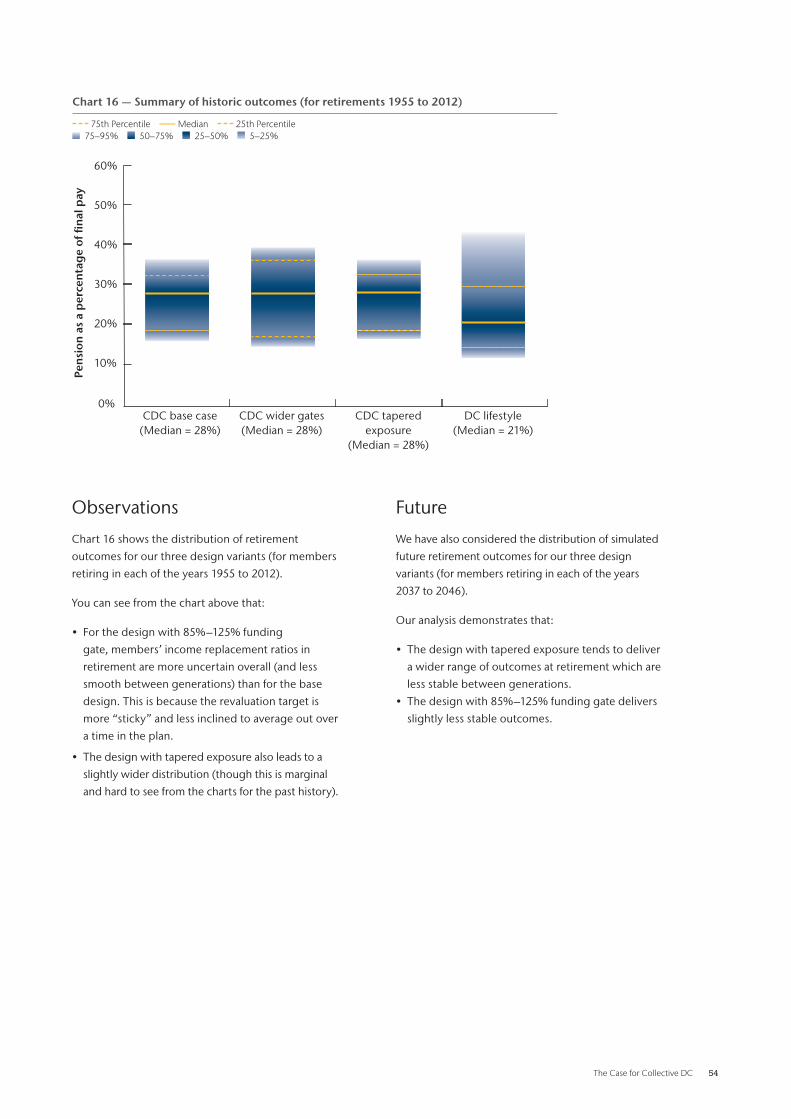
The Case for Collective DC 54
Chart 16 — Summary of historic outcomes (for retirements 1955 to 2012)
75th Percentile Median 25th Percentile 75–95% 50–75% 25–50% 5–25%
Observations
Chart 16 shows the distribution of retirement
outcomes for our three design variants (for members
retiring in each of the years 1955 to 2012) .
You can see from the chart above that:
• For the design with 85%–125% funding
gate, members’ income replacement ratios in
retirement are more uncertain overall (and less
smooth between generations) than for the base
design . This is because the revaluation target is
more “sticky” and less inclined to average out over
a time in the plan .
• The design with tapered exposure also leads to a
slightly wider distribution (though this is marginal
and hard to see from the charts for the past history) .
CDC base case(Median = 28%)
CDC wider gates(Median = 28%)
CDC taperedexposure
(Median = 28%)
DC lifestyle(Median = 21%)
Pens
ion
as a
per
cent
age
of fi
nal
pay
0%
10%
20%
30%
40%
50%
60%
Future
We have also considered the distribution of simulated
future retirement outcomes for our three design
variants (for members retiring in each of the years
2037 to 2046) .
Our analysis demonstrates that:
• The design with tapered exposure tends to deliver
a wider range of outcomes at retirement which are
less stable between generations .
• The design with 85%–125% funding gate delivers
slightly less stable outcomes .

The Case for Collective DC 55
Appendix E — Methodology and assumptions
Nature of calculations
The historic calculations covered in this paper are
approximate estimates of the member outcomes
which might have arisen in practice (under the plan
designs considered) .
The stochastic future projections aim to show the
distribution of outcomes under a range of possible
scenarios consistent with the modelling behind
Aon's Global Capital Market Assumptions as at
30 September 2012 .
Where we refer to a “best estimate” assumption in
this paper we mean one which is expected to have an
equal probability of understating or overstating the
true future value .
Scenarios modelled
We have modelled past performance assuming:
• The CDC plan starts with a mature “steady state”
membership profile in 1930, and is fully funded at
that point .
• Between 1930 and 2012 the plan develops
within its design rules, with a steady flow of
new entrants, retirements and deaths, and an
allowance for broad historic asset returns and
other changes in financial conditions .
The future performance analysis is independent of
this and assumes instead that:
• The CDC plan starts with a mature “steady state”
membership profile in 2013, and is fully funded at
that point .
• Between 2013 and 2062 the plan develops along
one of ~450 possible simulated futures . In each
case, it develops within its design rules, with a
steady flow of new entrants, retirements and
deaths, and an allowance for the asset returns and
other changes in financial conditions associated
with that simulation .
• For the past history and each of the ~450 future
simulations, corresponding DC outcomes are
constructed based on identical financial conditions
to the CDC scenario .
Membership profile
For simplicity we have assumed that for each member
in the CDC (or DC) plan:
• service commences at age 40;
• contributions are paid to the scheme at a rate of
10% of pay between ages 40 and 65;
• pay rises in line with the UK’s National Average
Earnings each year, overlaid with an allowance for
additional promotional increases .
• retirement occurs at age 65, at which point the
member ceases contributions and starts to draw
their pension;
• thereafter mortality rates are in line with
the assumptions adopted in the liability
assessment (below) .

The Case for Collective DC 56
Asset roll-forward
The assets in the CDC (or DC) plans are projected in
an approximate manner year-by-year with
allowance for:
• new contributions paid in;
• (for CDC) benefits paid out to pensioners;
• asset returns in line with a proxy total return index
according to the broad class of investment held
(UK equities, UK government bonds, or a mix of
the two) .
In all of the modelling assets are assessed at
(approximate) market value .
For the historic analysis up to 2012, investment
in “gilts” (whether in the gilts-based DC scheme,
the lifestyle DC scheme or the CDC plan itself)
means investment in long-dated fixed-interest
UK government bonds . In practice, plans attempting
to align investment performance with annuity prices
in the approach to retirement might be more likely
to invest in index-linked government bonds . Our
modelling of future projected behaviour over the
period 2013 to 2062 allows for this, but as index-
linked gilts were first issued in the 1980s our historic
analysis uses fixed-interest bonds throughout
for consistency .
Liability assessment – financial assumptions
• The assessment of liabilities for calculating the CDC
plan funding level each year is based on market
consistent best estimate assumptions .
• For the purpose of the modelling best estimate
assumptions are derived from the assumed market
yield data at the point of assessment, with:
– a CPI inflation assumption based on the
difference between nominal and real (RPI)
UK government bond yields of appropriate
duration, adjusted downwards by 0 .8% p .a . to
make broad allowance for an assumed future gap
between RPI and CPI inflation;
– a forward-looking inflation volatility assumption
of 2 .3% p .a . for the historic period, reducing to
1 .7% p .a . for assessment dates in the future .
• The discount rate used in the CDC plan assessment
of liabilities is taken as:
– the yield on long-dated fixed interest
government bonds, plus
– an equity risk premium in respect of that
portion of the liabilities backed by UK equity
holdings (to make some allowance for
expected outperformance of equities
overgovernment bonds) .
– In practice the equity risk premium would be
re-calibrated to a suitable best estimate each
year by the plan’s actuary based on current
market conditions .
– Our modelling uses a simplistic formula to
attempt to capture the first order impact of this
recalibration, with a cap of 5% p .a . and a floor
of 0% p .a . applied to the resulting equity risk
premium before use in the discount rate .
• Given the purpose of the modelling (to illuminate
broad features of CDC and DC plan behaviour)
we are not attempting to use a full yield curve
discount rate or inflation assumption for the
funding assessment basis .

The Case for Collective DC 57
Liability assessment — demographic assumption
The demographic assumptions used for valuing the liabilities in our modelling are held fixed
throughout the projections (for example, we have not modelled an increasing expectation of
longevity throughout the historic period) .
The reason for doing this is simply to isolate the behaviour of CDC and DC plan designs under
changes in financial conditions . Mixing this with variations in the demographic assumptions
would have made the analysis less transparent (though of course we would expect changes to
the demographic assumptions from time to time if managing a CDC plan in practice) .
The key assumptions used are:
• Male gender for the plan member;
• 80% chance of being married at age 65 (in which case the member’s spouse is assumed to be
female and 3 years younger than them) and a 50% contingent spouse’s pension is provided;
• All members survive until age 65 (and continue contributing to the plan over that period);
• From age 65, mortality rates are
– in line with the “S1PxA” standard tables published by the Actuarial Profession’s
Continuous Mortality Investigation (CMI), with
– assumed improvements in mortality rates from 2002 in line with the CMI 2011 projections
model using a long-term improvement rate of 1 .25% p .a .

The Case for Collective DC 58
Projected income replacement ratio
When we talk about the projected ratio of pension
to final salary at retirement (for example, in Charts 5
and 11), what we mean is:
For CDC
• The member’s accrued pension to date…
• … plus the pension expected to accrue at the 1%
CARE rate if they remain in service between now
and retirement at age 65…
• … in each case projected to age 65 assuming CARE
revaluations in line with CPI subject to an annual
floor of 0%…
• … divided by projected pay at age 65 .
The member’s current pay is assumed to grow
in line with CPI + 1 .5% p .a . (subject to an overall
minimum of 0%) with an overlay for promotional
increases consistent with the membership
projection assumptions .
The member’s projected pay affects both the pension
assumed to accrue over future years, and the final pay
at retirement against which their pension is measured
(to calculate an income replacement ratio) .
For DC
• The member’s accumulated pot of contributions…
• … plus the contributions expected to accrue if they
remain in service between now and retirement at
age 65…
• … in each case projected to age 65 using a
deterministic asset return assumption based on
government bond yields at the time (allowing for
an equity risk premium, where relevant, of
3 .5% p .a .)…
• … and finally converted to a pension figure at
age 65 based on an assumed annuity rate reflecting
financial conditions at the time .
The pay growth assumption used for this DC
projection is consistent with that used for the
CDC projection .
Both the “future” annuity rate used in this projection,
and the “actual” annuity rate used to convert a
member’s fund to a pension stream when they
reach 65, are based on:
• consistent mortality assumptions to the CDC
funding assessment basis;
• an assumed discount rate in line with long-dated
fixed-interest UK government bonds (and no
risk premium) .
• This is intended to give a very broad benchmark
measure of the annuity rate a member might be
able to secure on retirement in the year in question,
allowing for the approximate impact of changing
market conditions over time .

The Case for Collective DC 59
Historic data
The historic total return indices, real and nominal
government bond yields, annual inflation and
National Average Earnings growth figures assumed
for the period 1930 to 2012 are based on:
• Financial data from Barclays’ published 2012
“Equity Gilt Study”…
• … with suitable extrapolations where series are not
available; for example:
– Real government bond yields did not exist prior
to 1983, so before that point we have assumed
“notional” real yields consistent with a 10 year
central moving average of realised inflation;
– Similarly, for the period prior to publication of
the National Average Earnings index we have
assumed earnings inflation in line with RPI
growth +0 .7% p .a .
Stochastic simulation data
The distributions of future total return indices,
real and nominal government bond yields, annual
inflation and National Average Earnings growth
figures assumed for the period 2013 to 2062 are
based on ~450 independent simulations from the
proprietary Aon Asset Model, calibrated to market
conditions at 30 September 2012 .
This is an econometric model designed to generate
plausible (and plausibly volatile) future scenarios in
the financial markets . It has the following key features:
• Arbitrage free
• Market consistent
• Full yield curve
• Fat tails to reflect observed market characteristics
Limitations and scope
The figures and charts in this paper are intended as
an illustration of the research that we are conducting
at Aon, and as a starting point for further discussion .
They do not constitute formal advice and should
not be relied upon in themselves to make
policy decisions .
In particular, this paper is not subject to “Technical
Actuarial Standard R: Reporting Actuarial
Information” (or to the other Technical Actuarial
Standards in force at the time of writing) .
ActionsAon has carried out significant research into CDC plan designs and is actively consulting with the DWP on the
implementation of CDC in the UK . We are interested in hearing your thoughts on how pension provision should evolve
in the UK . We would also relish the opportunity to talk to you about our work in the CDC arena, both to get your input
into the subject and to continue to evolve our CDC template design .
If you would like to discuss any of the Government’s proposals further, see further details of our research or would like
more information, please speak to your usual consultant or one of the CDC team .

ContactsChintan Gandhi +44 (0)1371 733 322
Matthew Arends +44 (0)20 7086 4261
David Hardern +44 (0)1727 888 640
Andy Harding +44 (0)121 262 6946

The Case for Collective DC 61
About Aon Aon plc (NYSE:AON) is a leading global professional services firm providing a broad range of risk, retirement and health solutions. Our 50,000 colleagues in 120 countries empower results for clients by using proprietary data and analytics to deliver insights that reduce volatility and improve performance. For further information on our capabilities and to learn how we empower results for clients, please visit http://aon.mediaroom.com. This document and any enclosures or attachments are prepared on the understanding that it is solely for the benefit of the addressee(s). Unless we provide express prior written consent, no part of this document should be reproduced, distributed or communicated to anyone else and, in providing this document, we do not accept or assume any responsibility for any other purpose or to anyone other than the addressee(s) of this document. Notwithstanding the level of skill and care used in conducting due diligence into any organisation that is the subject of a rating in this document, it is not always possible to detect the negligence, fraud, or other misconduct of the organisation being assessed or any weaknesses in that organisation’s systems and controls or operations.
This document and any due diligence conducted is based upon information available to us at the date of this document and takes no account of subsequent developments. In preparing this document we may have relied upon data supplied to us by third parties (including those that are the subject of due diligence) and therefore no warranty or guarantee of accuracy or completeness is provided. We cannot be held accountable for any error, omission or misrepresentation of any data provided to us by third parties (including those that are the subject of due diligence).
This document is not intended by us to form a basis of any decision by any third party to do or omit to do anything.
Any opinions or assumptions in this document have been derived by us through a blend of economic theory, historical analysis and/or other sources. Any opinion or assumption may contain elements of subjective judgement and are not intended to imply, nor should be interpreted as conveying, any form of guarantee or assurance by us of any future performance. Views are derived from our research process and it should be noted in particular that we can not research legal, regulatory, administrative or accounting procedures and accordingly make no warranty and accept no responsibility for consequences arising from relying on this document in this regard.
Calculations may be derived from our proprietary models in use at that time. Models may be based on historical analysis of data and other methodologies and we may have incorporated their subjective judgement to complement such data as is available. It should be noted that models may change over time and they should not be relied upon to capture future uncertainty or events.
To protect the confidential and proprietary information included in this material, it may not be disclosed or provided to any third parties without the prior written consent of Aon.
Aon does not accept or assume any responsibility for any consequences arising from any person, other than the intended recipient, using or relying on this material.
Copyright © 2020. Aon Solutions UK Limited. All rights reserved.
Aon Solutions UK Limited Registered in England and Wales No. 4396810 Registered office: The Aon Centre, 122 Leadenhall Street, London, EC3V 4AN.
Aon Solutions UK Limited is authorised and regulated by the Financial Conduct Authority.
Aon Solutions UK Limited’s Delegated Consulting Services (DCS) in the UK are managed by Aon Investments Limited, a wholly owned subsidiary, which is authorised and regulated by the Financial Conduct Authority.