the cartographic projections used in albanian...
TRANSCRIPT
ISSN: 1857-9000, EISSN: 1857-9019
http://mmm-gi.geo-see.org
121 121
THE CARTOGRAPHIC PROJECTIONS USED
IN ALBANIAN MAPS
Pal NIKOLLI1, Ferim GASHI
2, and Ismail KABASHI
3
UDC: 528.93:528.235(496.5)
SUMMARY Map projections and coordinate transformations are the basis of achieving a
common frame of reference for geographic information. The requirement of a
common ellipsoid, datum, map projection, and finally plane coordinate systems
make it possible to use plane geometry for all types of spatial overlay and analysis.
Projection of geographic data from the ellipsoidal Earth to a plane coordinate system
always results in distortion in area, shape, distance, and other properties. With
appropriate selection of a projection, the user can preserve desired characteristics at
the expense of others.
For the production of Albanian maps are used different cartographic projections.
This is explained with the fact that most of these maps are created from foreign
persons and geographic institutions, keeping safe their cartographic traditions.
The cartographic projections used as mathematical base of topographic and thematic
maps of Albania are:
Polar conic projection in the new edition of Ptolemy maps;
Gauss-Krüger projection in Bessel ellipsoid, with origin the intersection of the
Equator by the meridian of Ferro with λFerros = 17° 39’ 46.5’’ in the maps, scale
1:75000 and 1:50000, published by Military Geographic Institute of Wien
(1868-98, 1913-18);
Polyconic equivalent Projection of Bonn in Clark ellipsoid with origin the
intersection of the Equator by the central meridian Λ0 = 180 39’ 09‖, in the
maps of scales 1:50000, published by Military Geographic Institute of Florence
(MGIF) (1922-25);
Bonne pseudo-conic equivalent projection in Bessel ellipsoid with origin the
intersection of parallel Φ0 = 41° 20’ 12’’.809 by the central meridian Λ0 = 19°
1 Prof.Dr.Ing. Pal NIKOLLI; [email protected]; [email protected]
University of Tirana, Faculty of History and Philology, Department of
Geography, Tirana, Albania. 2 Dr. Ferim GASHI; +377 (0) 44 114 674, [email protected],
University of Prishtina ―Hasan Prishtina‖. Faculty of Mathematics and Natural
Sciences, Department of Geography, Prishtine 3 Prof.As.Dr. Ismail Kabashi, [email protected]; Universiteti Prishtinës,
FNA-programi studimor i gjeodezisë www.uni-pr.edu, Prishtinw, Kosovë
c/o: Vermessung Angst ZT GmbH, Mayergasse 11, 1020-Wien, www.angst.at.

No.6, Year 2016
Publisher: Geo-SEE Institute
122 122
45’ 45‖.285, in the maps of scales 1:50000, published by Military Geographic
Institute of Florence (MGIF), Italy (1927-1934);
Gauss ‐ Boaga projection in Bessel ellipsoid with origin the intersection of the
Equator by the central meridian Λ0 = 200,
in the maps of scales greater than
1:50000 and topographical plans of residential areas at 1:5000 scale, published
by Military Geographic Institute of Florence (MGIF) (1939 - 1948);
Gauss-Krüger projection in Krassowsky ellipsoid with origin the intersection of
the Equator by the central meridian L0=21º in the maps, scale 1:25000 and
1:10000, published by Military Geographic Institute of Albania (1950 - 1955,
1970 - 1992)4. During the period 1946-1996 are also created a series of
cadastral maps (which covered approximately 56.27% of the Albania’s
territory) in scale 1: 500; 1: 1000; 1: 2000; 1: 5000; 1: 10000 and 1: 50000.
Cadastral maps created during the years 1946 - 1960, are in 1: 2500 and 1: 5000
scale and based on the Bessel ellipsoid, Gauss-Kruger projection and the central
meridian Lo = 20º 00'. Almost all cadastral maps created after 1960 were
constructed in the state coordinate system: the Krasowsky ellipsoid, Gauss-
Kruger projection and central meridian Lo = 210 00’.
UTM projection in WGS 84 ellipsoid with origin the intersection of the Equator
by the central meridian Λ0 = 210,
in the maps of scales 1:50000 and 1:25000,
published by Military Geographic Institute of Albania (MGIA) (after 1994);
Version of the pseudoconic projection, developed by prof. dr. Agim Shehu
(Polytechnic University of Tirana, Albania) in the Earth sphere, was used for
the first time at the ―The geographical atlas of Albania‖ 1968, in the scales
1:2000000 and smaller ones. In the 1980 year this projection was used for the
creation of the maps of Albania in the scale 1:200000, as geological,
hidrogeological and fitogeographical maps, etc. also it is used for all (127) the
maps of ―Climatic atlas of Albania‖, 1986, in the scale 1:800000 and for all
(256) the maps of ―Agricultural geographical atlas of Tirana district‖ in the
scales 1:100000.
Keywords: cartography, map, mapping, map projections, mathematical
cartography, Albania
1. INTRODUCTION
New methods of acquiring spatial data and the advent of geographic
information systems (GIS) for handling and manipulating data mean that we
no longer must rely on paper maps from a single source, but can acquire,
4 The central meridian, Λ0 = 21˚, is located at easternmost extreme of Albania,
leaving on his west over 99.7% of the territory. The area with the greatest distortions
of the projection is the coastal zone. The distortions in this area reduce accuracy of
topographical plans of large scales, which are necessary for development of tourist
infrastructure, economic and cadastral system.

ISSN: 1857-9000, EISSN: 1857-9019
http://mmm-gi.geo-see.org
123 123
combine, and customize spatial data as needed. To ensure quality results,
however, one must fully understand the diverse coordinate frameworks upon
which the data are based. Datums and Map Projections provides clear,
accessible explanations of the terminology, relationships, transformations,
and computations involved in combining data from different sources.
The concept of cartography as science was presented for the first time under
the title geography in the second century in the famous Ptolemy's work
Introduction into Geography. In the middle Ages, the regional direction in
geography that was built on Ptolemy's ideas, found its expression in the most
important geographic works of that time, in big atlases from the 16th and
17th centuries that were collections of maps and comprehensive texts. The
synonym for cartography was cosmography, and some cartographers of that
time were called cosmographers.
Theory of map projections is a branch of cartography studying the ways of
projecting the curved surface of the earth and other heavenly bodies into the
plane, and it is often called mathematical cartography5. Map projections have
been developing parallel with the development of map production and
cartography in general.
The subject of map projections, either generally or specifically, has been
discussed in thousands of papers and books dating at least from the time of
the Greek astronomer Claudius Ptolemy (about A.D.150 ), and projections
are known to have been in use some three centuries earlier.
Mapmakers have developed hundreds of map projections, over several
thousand years. Three large families of map projection, plus several smaller
ones, are generally acknowledged. These are based on the types of geometric
shapes that are used to transfer features from a sphere or spheroid to a plane.
Map projections are based on developable surfaces, and the three traditional
families consist of cylinders, cones, and planes. They are used to classify the
majority of projections, including some that are not analytically
(geometrically) constructed. Which developable surface to use for a
projection depends on what region is to be mapped, its geographical extent,
and the geometric properties that areas, boundaries, and routes need to have,
given the purpose of the map.
During last six centuries are used different cartographic projections for the
production of Albanian maps. This is explained with the fact that most of
these maps are created from foreign persons and geographic institutions,
5 The object of study of the mathematical cartography it is on the one hand
representation of Earth’s curved surface on a flat surface (map), on the other hand
how to use the maps in various scientific and practical purposes. Plan representation
of a portion of the land area is done by choosing an appropriate projection system
purpose and destination topographic map or plan which is to be drawn.

No.6, Year 2016
Publisher: Geo-SEE Institute
124 124
keeping safe their cartographic traditions. For a small country as Albania,
number of the projections used must be tightly related with criteria well
determined.
Albania always has profited by the wide cartographic experience of the other
countries with a great economic and scientific potential. Our cartographers
have followed with much attention and interest the progress in theory,
technique and technology of cartography. A lot of this progress is reflected
in the practice of Albanian mathematical cartography particularly in the
theory of cartographic projections.
In our article, we analyzed, except some of the usual cartographic
projections, some projections processed theoretically and practically by prof.
Agim Shehu, which are used in the compilation of several thematic atlases in
Albania.
2. A BRIEF HISTORY OF ALBANIA MAPPING
Albania is one of the oldest nations in the European Continent. Some of the
cities as Berat (antique name is Antipatra), Durres (Durrahcium), Apollonia
(Apoloni), Lezha (Lissus), Butrint (Buthranton), etc., are founded since the
fifth and fourth centuries before Christ. Some of these cities are reflected
also in the small scale maps of Hecate, Eratosten, Strabon, etc.
Albania is presented detailed in the maps of Ptolemy6 (map 1), in the Roman
maps of Peutinger, in the Albanian maps and portulanes ones. In the 16-th
century, after the discovery of the new continent, at the time when the world
economical center has moved from Italy at Netherland, at the time when the
6 In cartography, Ptolemy is best known for three map projections: the first
projection employed straight meridians that converged at the poles and curved
parallels—qualities of a simple conic projection; the second projection would be
classified today as a pseudoconic projection (it has curved evenly-spaced parallels
and curved meridians that converge at the poles); his third projection would be
classified today as an azimuthal projection. One of the most surprising features of
Ptolemy's world map (ca. 150 AD) is its excessive distortion along the east-west
direction. This is because the excessive distortion of Ptolemy's maps is a natural
result of the erroneous value he adopted for the Earth's circumference in
combination with Ptolemy’s attempt to preserve the latitudes of some locations
gained through astronomical observations. Another consequence is the instability of
the position of Ptolemy’s Prime Meridian in the geographical coordinate system,
mutual rotation of the local maps and the displacement of positions given with
respect to a reference point lying approximately on the same meridian along the
north-south axis. It resembled a modified perspective view of the earth, but there is
little, if any, evidence that he actually used it.

ISSN: 1857-9000, EISSN: 1857-9019
http://mmm-gi.geo-see.org
125 125
flow of Europeans going towards America has began, it was seemed a great
fall of cartography in many countries of Europe. The contrary has happened
in Albania, where it was a great increase in the mapping of its land.
Map 1. Ptolemy’s map of Albanian territory. Claudius Ptolemy
"Geographia" is a fundamental geographic and cartographic work of the
2nd century A.D. which influenced European cartography of the
Renaissance. Ptolemy can be considered as one of the first who gave a
"concrete" cartographic evidence to the region of central Europe a part of
which is covered by today's territory of the Albania.
We can mention through the numerous portulane maps in the 16-th century
the maps of Comotio (1571), which are considered the first topographical

No.6, Year 2016
Publisher: Geo-SEE Institute
126 126
maps of our land; the maps of Reis (1529), Gastald (1560), Mercator (1585),
etc., present rather detailed all the territory (Shehu & Dragovoja, 1984),
In the 17th century were considered valuable the maps of Canteli (1689),
Coronelli (1691) and Tchelebi (1635). They have personally carried out
itineraries in different areas of Albania. The maps of the above mentioned
authors have served as a base for the creation of the new maps, in the 18th
century.
Hartenthum (Hartenthum, 1903) has given a completed table for the maps
produced in the 19th century: among them we can mention the maps of
Palma, Lapie, Weis, Hahn, Kiepert, Gubernatis, Military Geographic
Institute of Wien, etc.
At the beginning of the 20th century were created new accurate and rich
maps for all territory of Albania from Baldacci (Baldacci, 1917) and Nopcsa
(Nopcsa, 1929). These maps were based on the results of the itineraries
carried out by authors.
During the First World War, the Military Geographic Institute of Wien has
carries out the topographical surveying of Northern and Central Albania, in
the scale 1:75000, while the Military Geodesic Services of Italy and France
have surveyed a part of Southern Albania in the scale 1:50000. After the
First World War, Herbert Louis (Louis, 1928) has surveyed in the scale
1:100000 the areas unfinished by the above mentioned military services and
has published in 1928 the new map of Albania in the scale 1:200000.
From 1927 until 1939 the Military Geographic Institute of Firenze was
involved in the creation of new topographical maps, in the scale 1:50000 for
all the territory of Albania. Because of the beginning of the Second World
War the works was interrupted, making impossible surveying of a small part
of southern Albania.
Until this period of 20 – the century are produced a lot of thematic maps,
also by Albanian authors inside and outside Albania. During centuries the
Albanian administration and specialists have contributed in a decisive way to
provide a complete and accurate content of the maps, continuing of the
surveys, itineraries, etc. In the places where their presence has missed there
are a lot of mistakes. Those who have read Armao (Armao, 1937), Ginzel
(Ginzel, 1918) and Traversi (Traversi, 1965), have understood the necessity
of the presence of Albanian administration and topographers.
After the Second World War were founded in the new state of Albania
different topographical and cartographical services giving their precious
contribution in this field (Shehu & Dragovoja, 1984).

ISSN: 1857-9000, EISSN: 1857-9019
http://mmm-gi.geo-see.org
127 127
3. THE MAIN CARTOGRAPHIC PROJECTIONS USED IN
TOPOGRAPHIC AND THEMATIC MAPS AND IN
GEOGRAPHICAL ATLASES
Mapmakers have a general rule that small-scale maps can be projected from
a sphere, but large-scale maps always must be projected from an ellipsoidal
surface such as e.g. the WGS 84 ellipsoid etc. In the above mentioned maps
are used different cartographic projections:
- The new edition of Ptolemy maps are based in his polar conic
projection,
- Military Geographic Institute of Wien and H. Louis have used Gauss
– Kruger projection;
- Military Geographic Institute of Firenze has used Bonn pseudoconic
projection;
- Most of the above mentioned authors of maps have used polar conic
projections;
- Military Geographic Institute of Albania and Albanian geodesical
Services have used Gauss – Kruger projection;
- The cartographic services has used polar conic, Gauss – Kruger and
the versions of pseudoconic projections prepared by prof. Agim Shehu
for the creation of thematic maps.
- Actually, the Military Geographic Institute of Albania is using the
UTM projection for preparation of topographical maps in scale 1:50000
and 1:25000.
3.1. Polar Conic Projection of Ptolemy
Conic map projections are appropriate for mapping regions at medium and
large scales with east–west extents at intermediate latitudes. Conic
projections are appropriate for these cases because they show the mapped
area with less distortion than other projections. In order to minimize the
distortion of the mapped area, the two standard parallels of conic projections
need to be selected carefully.
The new edition of Ptolemy maps are based in his polar conic projection7.
Ptolemy C. ACE 130 revolutionized the depiction of the spherical earth on a
map, and suggested precise methods for fixing the position of geographic
features on its surface using a coordinate system with parallels of latitude
and meridians of longitude. Ptolemy's eight-volume atlas Geographia
7 The simple conical projection, from Ptolemy, Cosmographia. Ulm: Lienhart Holle,
1482

No.6, Year 2016
Publisher: Geo-SEE Institute
128 128
(Geography) is a prototype of modern mapping. It included an index of
place-names, with the latitude and longitude of each place to guide the
search, scale, conventional signs with legends, and the practice of orienting
maps so that north is at the top and east to the right of the map—a universal
custom today. In this work, he used information first presented by the
Greeks, and was the first to come up with what are known as projections.
Ptolemy approved the use of the projection for maps of smaller areas,
however, with spacing of meridians to provide correct scale along the central
parallel. Although Ptolemy’s maps were incredible for the time, his maps
were very inaccurate.
To determinate the geographical coordinates of the objects, it is necessary to
know the dimensions and characteristics of the geometrical figure, which
approximately coincides with the true form of earth. For that purpose,
Ptolemy was based on the dimensions of the sphere, calculated by Poseidon,
in which the length of the meridians and equator is 37800 km (Codazzi,
1959), i.e. about 2200 km less than the length calculated earlier by
Eratosthenes. So, the radius of the Poseidon’s sphere: R = 6016.057 km and
the longest semi axis (a) of the Krasowsky’s ellipsoid is a= 63778.245 km.
Then, the difference a – R = 362.188 km.
The projection of Ptolemy is a conical, polar and equidistant, in which the
length of the meridians (m) and that of standard parallel (P0) aren’t distorted.
The standard parallel has the latitude F0 = 41000’.
3.2. The Transverse Mercator (TM) projection;
The Transverse Mercator (TM) projection in its various forms is the most
widely used projected coordinate system for world topographical and
offshore mapping. All versions (e.g. Gauss-Kruger, Gauss Boaga, and UTM)
have the same basic characteristics and formulas. The differences which
distinguish the different forms of the projection which are applied in
different countries arise from variations in the choice of values for the
coordinate conversion parameters, namely the latitude of the natural origin,
the longitude of the natural origin (central meridian), the scale factor at the
natural origin (on the central meridian), and the values of False Easting and
False Northing. Additionally there are variations in the width of the
longitudinal zones for the projections used in different territories.

ISSN: 1857-9000, EISSN: 1857-9019
http://mmm-gi.geo-see.org
129 129
3.2.1. Gauss-Kruger Projection, 1868-98, 1913-18, 1950 - 1951
and 1970 - 1985 Austro-Hungarian Empire for its interests in the Balkans
8, from the second
half of the century 19-th and early the century 20-th through the Military
Geographical Institute of Vienna (MGIW), built in the north of Albania, a
reference coordinate to support mapping of this part of the territory of
Albania, in scale 1:75000 and 1:50000. Geodetic co-ordinates of the points
of triangulation were calculated on Bessel ellipsoid - 1841, Gauss-Krüger
projection9, with origin the intersection of the Equator by the meridian of
Ferro with λFerros = 17° 39’ 46.5’’, in the year 1918. False Northing origin
0.000 m and false Easting origin 0.000 m. Central meridian, each meridian
go from central meridian, and the Equator are straight lines. Other meridians
and parallels are complex curves, concave toward the central meridian and
the nearest pole, respectively.
8 In support of military operations during the First World War, the southern part of
Albania was surveyed by Geodetic Services of the Italian Army (for Vlora’s district)
and the French Army (for Kortcha’s district) at 1:50000 scale. These maps were
used by MGIW, to produce maps at 1:75000 scale. The 1:75000 scale maps covered
approximately 75% of Albania’s territory. 9 In Europe this projection is called the Gauss-Kruger, in honor of the
mathematicians Carl Gauss and Johann Kruger who later worked out formulas
describing its geometric distortion and equations for making it on the ellipsoid. The
Gauss-Kruger projection, also known as the Gauss Conformal, is the one conformal
projection of the earth ellipsoid, in which the central meridian of the projection is
held to have the same length and scale as the meridian arc of the ellipsoid. The
central meridian, also known as the ―principal meridian‖, is the central axis of the
projection. In its standard form, the central meridian is taken to be at longitude 0
degrees. The central scale factor set at 1.0000, coordinate units in meters, for
Northing’s Xn and Easting’s Ye. Xn is negative for latitudes south of equator. For a
conformal projection, the source image and its projection must consist of complex
coordinates with isometric properties.
The conversation, of geodetic coordinates (φ, λ) into Gauss – Gruger plane grid
coordinates (N, E) is accomplished in three stages:
- To convert geodetic latitude φ into isometric latitude q (a Mercator variable).
The transformation of (φ, λ) into (q, λ) creates a mapping of geodetic
coordinates into Mercator variables, isometric coordinates pairs (q is known as
the ―isometric latitude‖.
- To transform complex isometric latitude ψ = q + i λ into the ―complex
intermediate latitude‖: w = u + iv, by the inverse Lambertian eGud (ψ, w).
- To evaluate the integral E3 on w, to find the unitary coordinates: z = x + iy, and
convert these to Gauss – Kruger metric coordinates N and E.
No.6, Year 2016
Publisher: Geo-SEE Institute
130 130
In the years 1950 -1955, the specialists of Military Topographic Group of
Albania (MTGA) carried out the reconstruction and the densification of the
MGI Net in order to grant the request for mapping in 1:25000 scales. At the
same time, the first–order network was transformed from the MGI reference
system (1934) into the 1942 co-ordinate system, which was based on
Krassovsky ellipsoid, Gauss-Krüger projection10
with central meridian
L0=21º.
The New Albanian Net, constituted from Triangulation and Leveling
Networks, was designed, rebuilt, measured and calculated from the Military
Topographic Institute of Albania (MTI) during the years 1970-1985. The
triangulation was designed to fulfill the requirements of mapping till at
1:10000 scale (on account of accuracy) and for perspective maps at 1:5000
scale (on account of density).
The geodetic horizontal datum [coordinate reference of Albania (ALB86)] is
based on: the ellipsoid of Krasowsky 1940; North ellipsoid origin, Φ0 = 00;
East ellipsoid origin, Λ0 = 210; Gauss-Krüger (TM) projection; False
Northing rectangular origin, 0,000 m; False Easting rectangular origin,
4500000 m, and coefficient of deformation in central Meridian, K0 = 1.
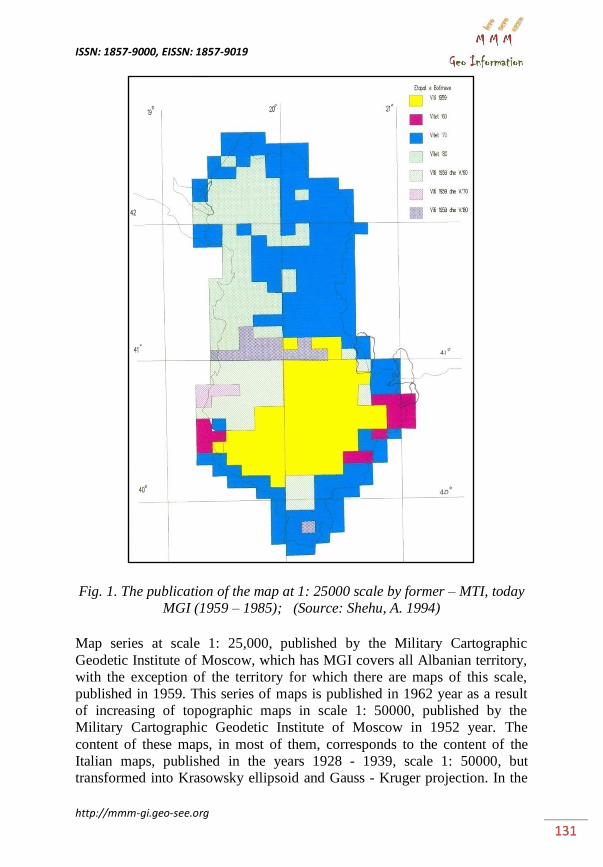
In this geodetic horizontal datum is based topographic map of the Albania
territory at scale 1: 25000 created by former MTIA (today IGU) in the period
1959 - 1985. Figure 1 shows the number of first and second editions, by
years (Shehu, 1994).
10
The Gauss-Krüger projection is a conformal mapping of a reference ellipsoid of
the earth onto a plane where the equator and central meridian remain as straight lines
and the scale along the central meridian is constant; all other meridians and parallels
being complex curves. The Gauss-Krüger projection is the result of a triple-mapping
in two parts (Bugayevskiy & Snyder 1995).
ISSN: 1857-9000, EISSN: 1857-9019
http://mmm-gi.geo-see.org
131 131
Fig. 1. The publication of the map at 1: 25000 scale by former – MTI, today
MGI (1959 – 1985); (Source: Shehu, A. 1994)
Map series at scale 1: 25,000, published by the Military Cartographic
Geodetic Institute of Moscow, which has MGI covers all Albanian territory,
with the exception of the territory for which there are maps of this scale,
published in 1959. This series of maps is published in 1962 year as a result
of increasing of topographic maps in scale 1: 50000, published by the
Military Cartographic Geodetic Institute of Moscow in 1952 year. The
content of these maps, in most of them, corresponds to the content of the
Italian maps, published in the years 1928 - 1939, scale 1: 50000, but
transformed into Krasowsky ellipsoid and Gauss - Kruger projection. In the
No.6, Year 2016
Publisher: Geo-SEE Institute
132 132
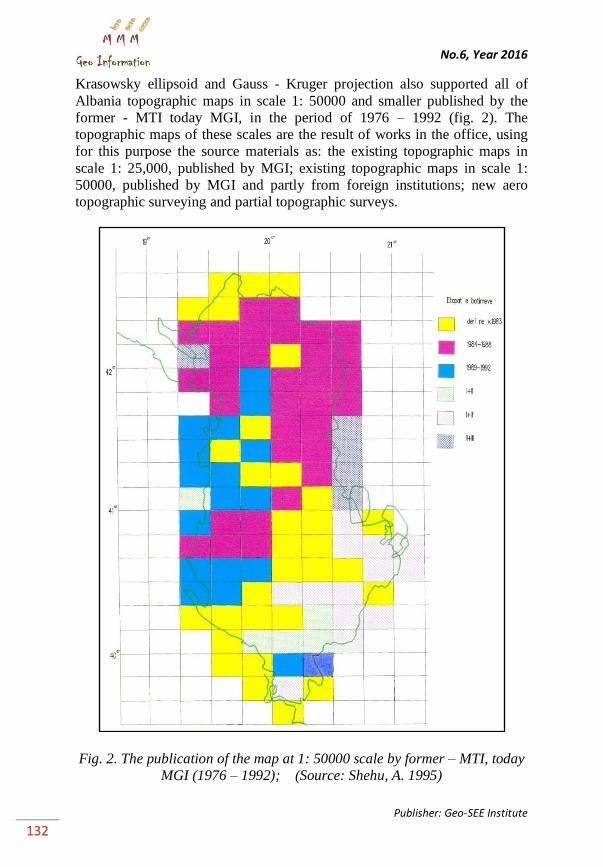
Krasowsky ellipsoid and Gauss - Kruger projection also supported all of
Albania topographic maps in scale 1: 50000 and smaller published by the
former - MTI today MGI, in the period of 1976 – 1992 (fig. 2). The
topographic maps of these scales are the result of works in the office, using
for this purpose the source materials as: the existing topographic maps in
scale 1: 25,000, published by MGI; existing topographic maps in scale 1:
50000, published by MGI and partly from foreign institutions; new aero
topographic surveying and partial topographic surveys.
Fig. 2. The publication of the map at 1: 50000 scale by former – MTI, today
MGI (1976 – 1992); (Source: Shehu, A. 1995)

ISSN: 1857-9000, EISSN: 1857-9019
http://mmm-gi.geo-see.org
133 133
During the period 1946-1996 are also created a series of cadastral maps
(which covered approximately 56.27% of the Albania’s territory) in scale 1:
500; 1: 1000; 1: 2000; 1: 5000; 1: 10000 and 1: 50000. Maps created during
the years 1946 - 1960, are in 1: 2500 and 1: 5000 scale and based on the
Bessel ellipsoid, Gauss-Kruger projection and the central meridian Lo = 20º
00'. Almost all cadastral maps created after 1960 were constructed in the
state coordinate system: the Krasowsky ellipsoid, Gauss-Kruger projection
and central meridian Lo = 210 00’ (Shehu & Nikolli, 2001).
The central meridian, Λ0 = 21˚, is located at easternmost extreme of Albania,
leaving on his west over 99.7% of the territory. The area with the greatest
distortions of the projection is the coastal zone. The distortions in this area
reduce accuracy of topographical plans of large scales, which are necessary
for development of tourist infrastructure, economic and cadastral system.
Remember that Italians selected as the projection central meridian λ0 = 200
for Albanian territory to support the mapping of the country at large scale (1:
5000, 1: 2000, 1: 1000).
3.2.2. Gauss Boaga projection
After 1939 year, for topographic maps of scales greater than 1:50000 and
topographical plans of residential areas at 1:5000 scale, the Military
Geographic Institute of Florence (MGIF) passed to another coordinate
reference. The geodetic datum of this reference was: Bessel (1841) ellipsoid;
the North ellipsoidal reference origin, Φ0 = 00; the East ellipsoidal reference
origin, Λ0 = 200; the Gauss‐ Boaga projection
11; false Northing origin, 0.000
m; false Easting origin, 0.000 m.
At 1948, the horizontal coordinative base transformed from Moskva’s
CNIGA‐IK Institute into Krassowsky ellipsoid (4‐th zone 6°) with central
meridian λ0 = 21° to support the territory mapping at 1:25 000 scale.
3.2.3. UTM Projection
The UTM and Gauss–Krüger coordinate systems are based on the
Transverse Mercator projection. The most familiar and commonly used
11
The Gauss–Boaga projection is a map projection used in Italy that uses a Hayford
ellipsoid. The projection is named after Carl Friedrich Gauss and Giovanni Boaga. It
was created by Giovanni Boaga in the 1940s who was at that time the head of the
Istituto Geografico Militare. The projection method is a slight variant of the Gauss–
Krüger series development for the ellipsoidal transverse Mercator projection. Like
the closely related UTM, the Gauss–Boaga scales the projection down so that the
central meridian has a scale factor of 0.9996 rather than 1.0.

No.6, Year 2016
Publisher: Geo-SEE Institute
134 134
Transverse Mercator in the topographical mapping is the Universal
Transverse Mercator (UTM).
The Universal Transverse Mercator (UTM) projection and grid were adopted
by the U.S. Army in 1947 for designating rectangular coordinates on large-
scale military maps of the entire world. The UTM is the ellipsoidal
Transverse Mercator to which specific parameters, such as central meridians,
have been applied. The Earth, between lats. 84° N. and 80° S., is divided into
60 zones each generally 6° wide in longitude. Bounding meridians are
evenly divisible by 6°, and zones are numbered from 1 to 60 proceeding east
from the 180th meridian from Greenwich with minor exceptions.
Each geographic location in the UTM projection is given x and y coordinates
in meters, according to the Transverse Mercator projection, using the
meridian halfway between the two bounding meridians as the central
meridian, and reducing its scale to 0.9996 of true scale (a 1:2,500 reduction).
The lines of true scale are approximately parallel to and approximately 180
km east and west of the central meridian. Between them, the scale is too
small; beyond them, it is too great. In the Northern Hemisphere, the Equator
at the central meridian is considered the origin, with an x coordinate of
500,000 m and a y of 0.
The Military Geographic Institute of Albania has distributed hard-copy maps
in 1:50,000 scales produced in collaboration with the USA agency NIMA
(National Image and Mapping Agency – now called NGA: National
Geospatial-Intelligence Agency). These products are spatially referenced in
the UTM (WGS84) coordinate system.
Reference parameters of the Coordinative Reference established by Military
Geographic Institute of Albania after 1994 year are: ellipsoid name - WGS
8412
; ellipsoid origin of North - Earthy Equator (φ = 00); Ellipsoid origin of
East - Central Meridian λ0 = 210 E; map projection name - UTM zone 34 N;
false northing, in grid units - 0.000 m; false easting, in grid units - 500
000.000 m, in west of meridian λ0 = 210; scale factor at natural origin in
central meridian (λ0 = 210): k0=0.9996; Magnitude of projection zone - 6
0 and
projection Zone – 34.
12
The WGS84 ellipsoid was established by satellite positioning techniques. It is
referenced to the centre mass of the Earth (i.e., geocentric) and provide a reasonable
fit to the entire Earth. The WGS84 datum provides the basis of coordinates collected
from the GPS, although modern receivers transform the coordinates into almost any
user selected reference datum.

ISSN: 1857-9000, EISSN: 1857-9019
http://mmm-gi.geo-see.org
135 135
3.3. Polyconic equivalent Projection of Bonn, 1922-25.
During years 1922-25, the Military Geographic Institute of Florence
(MGIF), constructed the triangulation network of I, II, III‐orders to support
the border mapping [734 km (length) x 2 km (width)] in scale 1: 50000. The
geodetic datum of this reference was: Clark Ellipsoid; the North ellipsoidal
reference origin, Φ0 = 00; the East ellipsoidal reference origin, Λ0 = 18
0 39’
09‖; the projection, Bonn's equivalent Polyconic; false Northing origin,
0.000 m and false Easting origin, 0.000 m.
Polyconic projection is a modified form of conical projection in which
cutting point of all parallels to the central meridian is true to scale. The
distances between the meridians along each parallel are also true to scale.
Near the central meridian both area and shape are approximately correct, but
away from it both are wrong. Properties of this projection are:
Parallels are arcs, having different centre,
Except the central meridian, all other meridians are regular curves.
The central meridian is a straight line,
All parallels are standard parallels,
East west distances are correctly represented along the particular
parallels and north south distances are correctly shown only along
the central meridians,
The projection is neither equal area nor orthomorphic.
This projection is suitable for representing small areas. Areas with a
large latitudinal and limited longitudinal extent in the middle latitudes can be
represented on this projection.
3.4. Bonne pseudo-conic equivalent projection
In 1927-1934 period Military Geographic Institute of Florence (MGIF), Italy
carried out the geodetic base in four orders to support the territory mapping
at 1:50000 scale. The geodetic datum of this reference was: Bessel (1841)
ellipsoid; the north ellipsoidal reference origin, Φ0 = 41° 20’ 12’’.809; the
east ellipsoidal reference origin Λ = 19° 46’ 45‖.285; the projection, Bonn's
Pseudo ‐ conic Equivalent; central meridian Λ0 = 20° (Shehu, 1995); false
northing origin, 300 000 m; false easting origin, 100 000 m. Maps of scale 1:
50000 were published by MGIF in the years 1928-1939 (fig. 3).

No.6, Year 2016
Publisher: Geo-SEE Institute
136 136
Fig. 3. The publication of the map at 1: 50000 scale, by Military Geographic
Institute of Florence (MGIF) (1928– 1939) (Source: Shehu, A. 1995)
In the Bonn's Projection
13 a central meridian and a standard parallel are
assumed with a cone tangent along the standard parallel. The central
13
A Bonne projection is a pseudoconical equal-area map projection, sometimes
called a dépôt de la guerre or a Sylvanus projection. Although named after Rigobert
Bonne (1727–1795), the projection was in use prior to his birth, in 1511 by Sylvano,
Honter in 1561, De l'Isle before 1700 and Coronelli in 1696. The Bonne projection
can be seen as an intermediate projection in the unwinding of a Werner projection
into a Sinusoidal projection; an alternative intermediate would be a Bottomley
projection

ISSN: 1857-9000, EISSN: 1857-9019
http://mmm-gi.geo-see.org
137 137
meridian is developed along that element of the cone which is tangent to it
and the cone developed on a plane.
Bonn's Projection is modified conical projection in which exaggerations of
scale are removed along the parallels in the sense that all parallels are true to
scale. The central meridian is straight, while the others are drawn by joining
the intervals along the parallels by smooth curves. The parallels are
concentric circles. It is an equal area projection. It is easy to draw with
reasonable shapes around the central meridian.
Properties of this projection are:
All the parallels are true to scale and are concentric curves,
Central meridian is a straight line and other meridians are smooth
curves,
The scale is correct only along the central meridian; along the other
meridians there is exaggeration which is increases away from the
central meridian. Due to that the shape becomes increasingly distorted
away from the central meridian, and
It is an equal area projection.
3.5. Version of the pseudoconic projection, developed by prof. dr.
Agim Shehu (Polytechnic University of Tirana, Albania)
The state of Albania is situated between latitude φ s = 390 38' and φ N = 42
0
39' (Δ φ = 30 01’), and longitude λw = 19
0 16' and λE = 21
0 04' (Δλmax = 1
0
48', Δλmin = 00 49') and extends over an area of 28.748 km
2 (land 27.398 km
2,
water 1.350 km2). The terrain is mostly mountainous (highest point 2753 m)
and hills with small plains along coast.
The proportions:
K1 = Δ φ / Δλmax = 30 01'/1
0 48' = 1.67
K2 = Δ φ / Δλmin = 30 01'/0
0 49' = 3.75
show the meridional extension of Albania.
Applying the well known formulas of the above mentioned projections, it is
noticed that for the scale 1:1000000, λ0 = 200 00', Δ φ = Δλ = 0
0 30', in the
most disfavorable points (λw, λE):
- the differences between coordinates (x, y) in the same points of the
cartographic network and for all versions (tangential, secant) are very small
(Δxmax, Δλmin = 0.13 mm);
- the differences of the abscissa values in the same parallel are also small
(Δxmax, Δλmax = 1.12 mm);
- small differences are noticed in the values of deformations in the same
meridian (m), parallel (p), surfaces (s) and angles (ω), where: pmax =
1.001599 and ω = 00 02’ 47‖ at central perspective projections;

No.6, Year 2016
Publisher: Geo-SEE Institute
138 138
- in the group of polar cylindrical projections, the maximal longitude
deformations reach the value 36.52% (for the tangential case) and the value
2.97% (for the secant case: φ 0 = 410 00’), while angle deformation is ωmax =
350 06’ 34‖ (for the tangential case) and 3
0 11’ 22‖ (for the secant case)
(Shehu, 1977).
Based in the above mentioned observations prof. Agim Shehu (Shehu, 1977)
has elaborated versions of pseudoconic projection, having these demands:
1. The meridians must be straight lines, going out from pole P;
2. The parallels must be straight lines parallel to coordinate axis E;
3. The length of the central meridian must not be deformed (m0 = 1);
The studied versions are not conform (ω ≠ 0) and m≠ p, but one version can
be equivalent if it is completed the condition that the length of all parallels is
not deformed (p = s =1). Then fixing the tangential versions (φ 0 = 410 00’),
secants pN = pS = 1; pN ≠ pS ≠ 1 and the equivalent one, Shehu 1977 has
calculated the values of coordinates (x, y) and deformations (m, p, s, ω),
from which he has arrived in these conclusions:
1. For the extreme points of the cartographic network (Δλ = ± 10 30')
coordinates (x, y) and the values of deformation, change very little between
them and the values of the classic projections;
2. Also in the equivalent case meridians are straight lines;
3. The deformation of the meridians is smaller than the deformation of
parallels;
4. Isocolls of deformation for meridians and angles correspond with the
orientation of meridians, for this reason these projections are suitable for use
for Albanian territory, because it has a meridional orientation;
5. The maximal deformations of the angles are 00
19’ 44‖, 00 39’ 24‖
and 00 59’ 09‖, respectively for the points with a longitude from the central
meridian Δλ1 = ±00 30', Δλ2 = ±1
0 00' and Δλ3 (max) = ±1
0 30'.
The tangential version of the projection above mentioned was used for the
first time at the ―The geographical atlas of Albania‖ 1968, in the scales
1:2000000 and smaller ones. In the 1980 year this projection was used for
the creation of the maps of Albania in the scale 1:200000, as geological,
hydro geological and fit geographical maps, etc. also it is used for all (127)
the maps of ―Climatic atlas of Albania‖, 1986, in the scale 1:800000 and for
all (256) the maps of ―Agricultural geographical atlas of Tirana district‖ in
the scales 1:100000.

ISSN: 1857-9000, EISSN: 1857-9019
http://mmm-gi.geo-see.org
139 139
4. CONCLUSIONS
Map projections have a wide use. They have been widely used to solve some
geometric problems of spherical geometry, astronomy, crystallography,
geology, etc., in graphical form. Today, topographical and geographical
maps are very important for every GIS; therefore map projections are
especially important in creating geoinformation systems. Knowledge of
cartographic projections of topographic and thematic maps has a great
importance in creation of a geographic database suitable for studies and
different geographic analyzes etc.
Map projections have their largest and most frequent application in
producing maps showing a smaller or bigger part of the Earth's surface.
Theory of map projections is a branch of cartography studying the ways of
projecting the curved surface of the earth and other heavenly bodies into the
plane, and it is often called mathematical cartography. Map projections have
been developing parallel with the development of map production and
cartography in general.
The cartographers working on map projections have made great
achievements in both the study of theory of map projections and the
exploring of new types of projections, as well as their application and
development of new directions in map projections. Mapmakers have a
general rule that small-scale maps can be projected from a sphere, but large-
scale maps always must be projected from an ellipsoidal surface such as the
WGS 84 ellipsoid.
In the Albanian maps and atlases are used different cartographic projections
as:
Polar conic projection in the new edition of Ptolemy maps;
Gauss-Krüger projection in Bessel ellipsoid, with origin the intersection
of the Equator by the meridian of Ferro with λFerros = 17° 39’ 46.5’’ in the
maps, scale 1:75000 and 1:50000, published by Military Geographic
Institute of Wien (1868-98, 1913-18);
Polyconic equivalent Projection of Bonn in Clark ellipsoid with origin the
intersection of the Equator by the central meridian Λ0 = 180 39’ 09‖, in the
maps of scales 1:50000, published by Military Geographic Institute of
Florence (MGIF) (1922-25);
Bonne pseudo-conic equivalent projection in Bessel ellipsoid with origin
the intersection of parallel Φ0 = 41° 20’ 12’’.809 by the central meridian Λ0
= 19° 45’ 45‖.285, in the maps of scales 1:50000, published by Military
Geographic Institute of Florence (MGIF), Italy (1927-1934);
Gauss‐ Boaga projection in Bessel ellipsoid with origin the intersection of
the Equator by the central meridian Λ0 = 200,
in the maps of scales greater

No.6, Year 2016
Publisher: Geo-SEE Institute
140 140
than 1:50000 and topographical plans of residential areas at 1:5000 scale,
published by Military Geographic Institute of Florence (MGIF) (1939 -
1948);
Gauss-Krüger projection in Krassovsky ellipsoid with origin the
intersection of the Equator by the central meridian L0=21º in the maps, scale
1:25000 and 1:10000, published by Military Topographic Institute of
Albania (1950 -1955, 1970-1992)14
;
UTM projection in WGS 84 ellipsoid with origin the intersection of the
Equator by the central meridian Λ0 = 210
in the maps of scales 1:50000 and
1:25000, published by Military Geographic Institute of Albania (MGIA)
(after 1994);
Version of the pseudoconic projection, developed by prof. dr. Agim
Shehu (Polytechnic University of Tirana, Albania) in the Earth Sphere, was
used for the first time at the ―The geographical atlas of Albania‖ 1968, in the
scales 1:2000000 and smaller ones. In the 1980 year this projection was used
for the creation of the maps of Albania in the scale 1:200000, as geological,
hydro geological and fit geographical maps, etc. also it is used for all (127)
the maps of ―Climatic atlas of Albania‖, 1986, in the scale 1:800000 and for
all (256) the maps of ―Agricultural geographical atlas of Tirana district‖ in
the scales 1:100000.
REFERENCES
1. Almagia R. (1928) La nuove carte dell’Albanie. Roma
2. Armao E. (1937) Localita, chiese, fiumi, monti, toponimi varii di una antica
carta dell’Albania Settentrionale. Roma.
3. Baldacci A. (1917) Intinerari Albanesi. Roma.
4. Bugayevskiy, L.M. and Snyder, J.P., (1995), Map Projections: A Reference
Manual, Taylor & Francis, London.
5. Cerabregu, M. (1977) Kosova në hartat e vjetra, Prishtinë
6. Codazzi, A. (1959) Storia della carte geografiche. Milano
7. Coronelli P. M. (1697) Memoire Istoriographiche. Venecie
8. Ginzel H. (1918) Aufgaben und Tatigteit der krigsmappierung auf der
Balkan halbinsel. Wien
9. Hahn J. (1854) Albanische studien. Jena
10. Hartenthum H. (1903) Die cartographie der Balkan halbinsel. Wien
11. Loui H. (1928) Die neue carte von Albanian. Berlin
14
The central meridian, Λ0 = 21˚, is located at easternmost extreme of Albania,
leaving on his west over 99.7% of the territory. The area with the greatest distortions
of the projection is the coastal zone. The distortions in this area reduce accuracy of
topographical plans of large scales, which are necessary for development of tourist
infrastructure, economic and cadastral system.

ISSN: 1857-9000, EISSN: 1857-9019
http://mmm-gi.geo-see.org
141 141
12. Pal Nikolli, Bashkim Idrizi & Ferim Gashi. (2012) Zhvillime të hartografisë
shqiptare: 1912-2012. ―Studime Albanologjike‖, IV, 2012/4, Tiranë.
13. Ptoleme C. (1613) La Geografia. Venezia.
14. Shehu, A. & Dragovoja, M. (1984) Shqipëria në hartat e paraçlirimit.
Tiranë
15. Shehu, A. & Nikolli, P. (2001) Historia e hartografisë shqiptare. ShB.
Julvin 2. Tiranë
16. Shehu, A. (1967) Një variant i projeksionit pseudokonik. Buletini i
Universitetit Shtetëror të Tiranës. Seria ―Shkencat e Natyrës‖. Nr. 3. Tiranë
17. Shehu, A. (1977) Projeksione hartografike të përshtatëshme për hartat tona
tematike. Bul. Shkencave Teknike. Nr. 3. Tiranë
18. Shehu, A. (1994) Buletin i informacionit ―Shkenca dhe Mjedisi‖, nr. 1,
Tirana
19. Shehu, A. (1995) Buletin i informacionit ―Shkenca dhe Mjedisi‖, nr. 2,
Tirana
20. Traversi C. (1965) Storia della Cartografia italiana della isole Egee e dell’
Albania. Firenze
21. Zulfequar Ahmad Khan. (1998) Text Book of Practical Geography.
Concept publishing company, New Delhi, 110059.