the canadian dairy sector: structure, …ageconsearch.umn.edu/bitstream/16950/1/ag960011.pdfthe...
TRANSCRIPT

THE CANADIAN DAIRY SECTOR:STRUCTURE, PERFORMANCE AND POLICIES
Agriculture and Agri-Food Canada
The objective of this paper is to provide a description of the segments of the Canadian
dairy sector, its structure and performance, and of the major policies which affect it.
THE MILK AND DAIRY PRODUCTS INDUSTRY'
Raw milk is a combination of water, fat, proteins, lactose, and minerals. Production
of manufactured products from raw milk involves the disaggregation and transformation of
its constituent parts. The broad range of products derived from basic raw milk includes
processed dairy products themselves, functional and nutritional food ingredients for use in
other food and beverage processing industries, and industrial inputs for a variety of non-food
manufacturing (Figure 1).
Demands for dairy products range from lower value, relatively undifferentiated,
standardized products, to higher-value, differentiated, specialized, and premium priced
products (Figure 2).
Industry has traditionally produced a wide range of consumer dairy products, such as
fluid milk, butter, cheese, ice cream and yogurt. In the relatively undifferentiated and
standardized market segments, competition can be more on the basis of price. Factors such
as the larger volumes required to capture economies of scale and lower production costs can
be important elements in competitive position. In the more differentiated, specialized and
higher-value market segments, competition is more on the basis of attributes of the products
for which premium prices are paid. In these product market segments, factors such as
specialized ingredients and production processes used, research and development outlays,
branding and marketing investments are critical competitive factors.
1 Based on Jelliss (1995).

12 Proceedings
Figure 1. Dairy Products Production Possibilities
Raw milk
Fluid MilkProducts
Flavoured Low LactoseMilks Milks
Whole, Low- Liquid
Fat, & Non-Fat Infant MilksMilks
Milk ProteinProducts
- I - ' -I IIEdible Co-precipitates CustardsCaseins
Caseinates Milk Protein- JelliedVegetable Milks Cr
ProteinMixtures
RecombinedProducts
Milk AnhydrousPowders Milkfat
Enzym
Dairy
Cheeses
Desserts
Creams,Mousses
Ice Milk'earn Puddings
PMrodified Dairy Spreads/Products
s Milk ProteinHydrolysates
Hgh Fat Low Fat Butter-(Butter) Vegetable
Fractionated Feed Fat MixturesFat Modified
Fat
Whey Products Cultured Milks
Dried Beverages Biomass Dietetic FlavouredWhey Yogurts
Lactose Whey Yogurt Acidophilus ProteinProtein Milk Enriched
Concentrate
Source: Jelliss (1995) Adapted from Briant (1991).
Similar distinctions occur in dairy-based food ingredients markets. Competition inundifferentiated commodity market segments, such as that for standardized nonfat milkpowders, may be more related to price considerations, whether in domestic or internationalmarkets. In specialized, more differentiated, dairy-based food ingredient markets, such ascustom-designed milkfat mixes, special composition casein and whey based milk proteinproducts, competition is more on the basis of the critical investments and competencies inproduct, process, market, and customer development.
Industrial demands for dairy-based manufacturing inputs derive from the use ofparticular milk constituents in the manufacture of products such as pharmaceuticals, viruscombatants, beauty aids, glues, or knitting needles, as well as from their functional propertiesin such areas as immunology and the combating of tooth decay. Various industrial uses formilk-based constituent inputs are located in more technically advanced, higher-value marketsegments, where the special properties of the milk fractions involved are reflected inpremium prices. Establishment and maintenance of a competitive position in these highervalue market segments is frequently related to investments in research and development,product and process technologies, and customer relationships.
s1

Agriculture and Agri-Food Canada
Figure 2. The Milk and Dairy Products Value System
Source: Jelliss(1995).
The relatively large investments in product, process, market and customerdevelopment required in the higher-value, more specialized consumer products and dairyingredient markets are rewarded by higher margins and lower price sensitivities (Table 1).
13

Proceedings
Table 1. Margins and Price Sensitivities in Different Dairy Product Markets
Product Market Segment Margins Price Sensitivity
Dairy Commodities Low High
Dairy Ingredients Medium-High Medium
Consumer Dairy Products:
- Standard Low-Medium Low
- Specialty High Low
Source: Jelliss (1995) based on Crocombe, Enright, and Porter (1991).
PRESSURES FOR POLICY CHANGE
This section examines five factors which are expected to affect the future structureand performance of the dairy industry.
Global Trends in Supply and Demand.2 The world dairy market experienced aparticularly difficult period in the early 1980s. World recession reduced demand for dairyimports in third world and oil producing countries, while milk production in the EC and theUnited States rose significantly. The result was an increase in surpluses. Since then, therehave been determined efforts to curb overproduction. However, the overall picture remainsone of imbalance between supply and demand, with substantial sums of public money tiedup in storing surplus stocks and underpinning markets. The danger persists that the dairyindustry will remain caught between rapid technological progress, highly flexible productionand the slow growth of import demand and consumption.
Technological Change. Embryo transplants, improved methods of genetic evaluationand selection, and improved management practices have contributed to a global increase incow productivity. These genetic improvements are enhanced by developments inbiotechnology such as the recent introduction of recombinant bovine Somatotropin (rbST).This synthetic version of a naturally occurring hormone has been found to increase milkproduction in average yielding cows. Recent estimates suggest that national productionincreases in the order of 4 percent are realistically attainable, although for individual cowsthe increase may be as high as 10-15 percent.
Based on Grant (1991)Based on Grant (1991)
14

Agriculture and Agri-Food Canada
Improvements in filtration technology are enhancing the ability to extract specificingredients and to develop niche market products. These same technologies are alsochanging the transportation economics for products by allowing the extraction of water, forexample, which reduces the volume and the weight of the product and allows fortransportation over greater distances. Such technological breakthroughs will provide a basisfor another round of plant consolidation and relocation consistent with these changedtransportation economics.
Low-fat/ Value-Added Market Shifts. The market for "traditional" dairy products,(i.e., milk, cheese, butter) is in decline. Specialty cheeses, yogurt, ice cream, and fast-foodproducts, such as pizzas and cheese burgers, are a growing segment of the market. The useof dairy ingredients in further processed foods is a growing market.
The former market control rules and the new rules agreed in various trade negotiationsdo not allow the same degree of market protection for value-added products as for"traditional" dairy products. As this market segment expands, internationally competitiveingredient pricing will be increasingly necessary to support domestic processing and furtherprocessing industries.
Consumption trends affect the structure of the dairy industry and dairy policy.Butterfat, once considered the most important component of milk, is becoming a surpluscomponent. Policies that encouraged farmers to produce milk with higher levels of butterfathave become obsolete because butterfat consumption is declining.
As the relative economics of production and processing shift, over the longer term,with changes in component values for milk and the dairy products produced from thesecomponents, there will be a need for structural adjustment at both the farm and processinglevels.
Freer Trade. Improvements in communications, financial transactions,transportation, packaging, processing, marketing and distribution have encouraged a globalapproach to the production, processing and marketing for most products, includingagriculture and agri-food products. In response to "globalization", governments arenegotiating new bilateral and multilateral trading rules which include the reduction of tradebarriers. The dairy industry, one of the world's most protected industries, is affected by thispolicy shift more than other industries.
The Uruguay Round of the GATT resulted in tariffication of import quotas previouslypermitted under Article XI.2(c)(I). Domestic supply control is no longer a prerequisite forborder controls. Under the CUSTA, both Canada and the United States retained their GATTrights with respect to agricultural goods. Under NAFTA, these rights were also protectedand restrictions consistent with GATT Article XI or an "equivalent provision of a successoragreement" were specifically allowed.
Neither the CUSTA, NAFTA nor UR GATT have significantly affected the importprotection afforded the Canadian and U.S. dairy industries. The changes resulting from these
15

Proceedings
negotiations are a clear indication that governments intend to further reduce trade barriersin the future.
Fiscal Pressures. Budget pressures have stimulated major changes in the dairymarket management systems of the European Union and the United States, and are asignificant factor in overall Canadian policy reform.
THE CANADIAN MILK AND DAIRY PRODUCTS SECTOR 3
The milk and dairy products industry in Canada has operated within a heavilyregulated policy environment. Domestic industry operations under a national supplymanagement system have been largely insulated from international markets by a combinationof quotas, tariffs, and other import control, industry support, and price stabilizationarrangements.
Milk production in Canada is split into two commodity markets: the "fluid milk"market and the "industrial milk" market. Fluid milk products consist of standard milk (3.25percent butterfat), lower fat milk (2 percent, 1 percent, skim), buttermilk, chocolate milk, andfresh creams. Industrial milk products are divided into two categories: 1) hard products, suchas hard cheese, butter, and skim milk powder, and 2) soft products, such as ice cream, yogurt,and cottage cheese. Both the fluid and industrial milk markets use the same dairy input - rawmilk. However, different regulations govern each market.
Price discrimination is extensively applied in the Canadian milk market. For example,in dairy year 1992/93 there were more than 50 different prices for milk according to end-useand province of production. Prices paid for milk differ between provinces, between milkmarkets (fluid versus industrial) and between industrial milk classes.
Individual dairy producers produced milk for one or both of these markets.Historically, there was a difference in milk quality between these two markets; today,virtually all milk is fluid quality.
Most industrial milk is processed into cheese in Canada, mainly cheddar and variousspecialty cheeses. Although cheese is a major dairy product from a production point of view,there is a large variety of dairy products on the market. As in the rest of the food industry,there has been a shift away from commodity markets to increasingly segmented nichemarkets. This shift has occurred mainly through extensions to existing product lines (e.g.,low fat, flavours, packaging format). Examples of such highly segmented markets includecheese, yogurt and ice cream.
3
Based on Jelliss (1995)
16

Agriculture and Agri-Food Canada
Economic Importance of the Canadian Dairy Sector
The milk and dairy products industry ranks among the major industries in theCanadian agri-food sector in terms of farm cash receipts, processed product shipments,employment, value-added and contribution to gross domestic product (Table 2).
Altogether, dairy farming and processing industries generated sales of more than $10billion in 1992. Over the last three decades, the dairy industry has shown moderate growth(dairy farming 1.1 percent, dairy processing 1.9 percent), but slower growth than the rest ofthe agriculture and agri-food industries. Thus, dairy industry contribution to total agricultureand agri-food sector sales has declined slightly.
Dairy farming, ranked second of all Canadian agricultural commodities in value ofsales, has maintained its importance for the last 30 years. From 1991-93 dairy productsgenerated average annual farm sales of $3.13 billion; 15 percent of market receipts for allagricultural products.
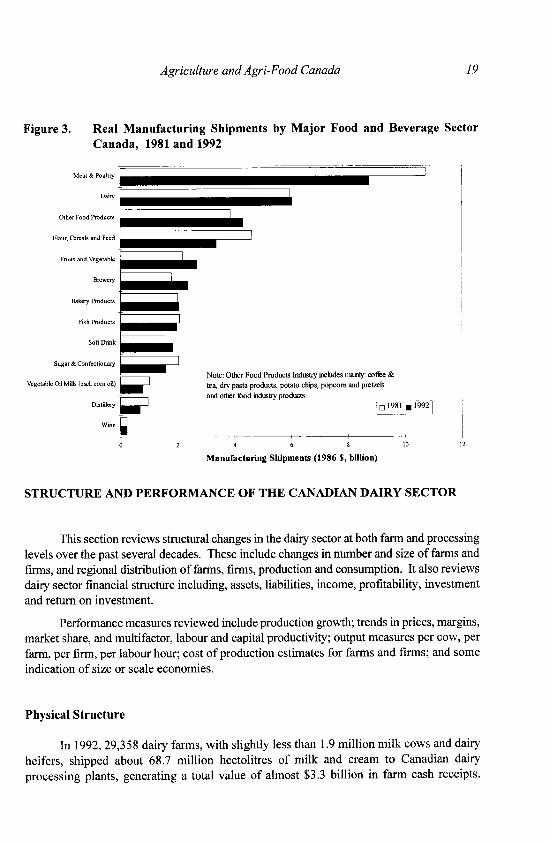
Dairy processing is the second ranked sector of the Canadian food and beverageprocessing industry (Figure 3). In 1992, dairy processing manufacturing shipments were$7.46 billion; 16 percent of the value of manufacturing shipments of the food and beverageindustry.
While employment data are not readily available, the number of commercial dairyfarms reflects the minimum number of producers or families that make a living from dairyfarming, as most dairy farms are family farms. According to the Canadian DairyCommission (CDC), there were 29,350 farms selling milk or cream in Canada in 1993.Dairy farms accounted for 11 percent of all farms in 19914.
The dairy processing industry, ranking second to meat and poultry in value ofshipments, employed 24,600 people in 1992; about 11 percent of total food and beverageindustry employees. This proportion has remained stable over the last decade. Of total dairyprocessing employees, 53 percent are in fluid milk, 47 percent in industrial milk processing.
4
Among all the farms with sales of $2 500 or more in 1991, 28,910 out of 256,182 farmswere classified as dairy farms. (Statistics Canada, Census of Agriculture).
17

18 Proceedings
Table 2. Importance of the Dairy Products Industry 1980 - 1991
Dairy Farm Cash Receipts
% of Total Farm Cash Receipts
Dairy Farming Industry Rank
Dairy Processing Industries
% of Food and Beverage Sector
Dairy Products Industry Rank
Dairy Processing Industries
% of Food and Beverage Sector
Dairy Products Industry Rank
Dairy Processing Industries
% of Food and Beverage Sector
Dairy Products Industry Rank
Dairy Processing Industries
%/o of Food and Beverage Sector
Dairy Products Industry Rank
Dairy Processing Industries
o of Food and Beverage SalesDairy Products Industry Rank
1980
2,763
17.7%
3
1980
4,315
15.3%
2
1980
26,028
11.1%
4
1980
949
11.4%
2
1980
801
11.6%
2
1980
1,490
13.1%
1
Farm Cash Receipts (S millions)
1981 1982 1983 1984 1985 1986 1987 1988 1989 1990 19913,079 3,348 3,141 3,410 3,444 3,509 3,617 3,833 3,828 3,878 3,85316.5% 17.6% 16.8% 16.9% 17.3% 17.1% 17.3% 17.7% 17.0% 18.0% 18.1%
3 2 2 2 2 2 2 2 2 2 2Processed Product Shipments (S millions)
1981 1982 1983 1984 1985 1986 1987 1988 1989 1990 19914,883 5,345 5,615 6,096 6,410 6,668 6,884 7,195 7,349 7,530 7,57615.4% 16.2% 16.6% 16.9% 17.0% 17.0% 16.6% 16.7% 16.8% 17.0% 17.2%
2 2 2 2 2 2 2 2 2 2 2Employment
1981 1982 1983 1984 1985 1986 1987 1988 1989 1990 199126,196 25,734 25,306 25,368 25,445 26,201 25,582 25,870 25,920 25,238 25,781
11.2% 11.3% 11.6% 11.6% 11.4% 11.6% 11.2% 11.1% 11.3% 11.4% 12.0%4 4 3 3 4 4 4 4 4 4 3
Value Added (S millions)1981 1982 1983 1984 1985 1986 1987 1988 1989 1990 1991
1,106 1,180 1,310 1,412 1,661 1,759 1,946 2,074 2,156 2,474 2,49711.6% 11.5% 11.8% 12.0% 13.3% 13.2% 13.3% 13.5% 14.0% 15.0% 14.5%
2 2 2 2 2 2 2 2 2 1 2Gross Domestic Product at Factor Cost (Current S millions)
1981 1982 1983 1984 1985 1986 1987 1988 1989 1990 1991951 1,048 1,172 1,285 1,533 1,581 1,755 1,824 1,970 na n.a.
11.9% 11.9% 12.2% 12.5% 13.7% 13.3% 13.7% 13.8% 14.6% n.a. n.a.2 1 I 1 1 1 1 1 I na na
Gross Domestic Product at Factor Cost (Constant 1986 S millions)1981 1982 1983 1984 1985 1986 1987 1988 1989 1990 1991
1,523 1,398 1,273 1,381 1,586 1,581 1,636 1,582 1,548 1,567 1,54513.4% 12.5% 11.7% 12 1% 13.2% 13.3% 13.7% 13.2% 13.2% 13.3% 13.6%
2 1 2 1 I I I 1 1 1 1
Note: Dairy products industry ranking is based on a comparison of all 3-digit food and beverage product industries excluding that of miscellaneous food products.
Source: Dairy Farmers of Canada, 1992 and various issues; Statistics Canada, various sources (as cited in Jelliss, 1995).
�
Agriculture and Agri-Food Canada 19
Figure 3. Real Manufacturing Shipments by Major Food and Beverage SectorCanada, 1981 and 1992
Meat & Poultry
Dairy
Other Food Products
Flour, Cereals and Feed
Fruits and Vegetable
Brewery
Bakery Products
Fish Products
Soft Drink
Sugar & Confectionary
Vegetable Oil Mills (ecl. corn oil)
Distillery
Wine
l
i
~~- --- I ~Note: Other Fo(tea, dry pasta piand other food i
il
od Products Industry includes mainly: coffe &roducts, potato chips, popcorn and pretzelsndustry products
1981 · 1992
4 6 8
Manufacturing Shipments (1986 $, billion)
10 12
STRUCTURE AND PERFORMANCE OF THE CANADIAN DAIRY SECTOR
This section reviews structural changes in the dairy sector at both farm and processinglevels over the past several decades. These include changes in number and size of farms andfirms, and regional distribution of farms, firms, production and consumption. It also reviewsdairy sector financial structure including, assets, liabilities, income, profitability, investmentand return on investment.
Performance measures reviewed include production growth; trends in prices, margins,market share, and multifactor, labour and capital productivity; output measures per cow, perfarm, per firm, per labour hour; cost of production estimates for farms and firms; and someindication of size or scale economies.
Physical Structure
In 1992, 29,358 dairy farms, with slightly less than 1.9 million milk cows and dairyheifers, shipped about 68.7 million hectolitres of milk and cream to Canadian dairyprocessing plants, generating a total value of almost $3.3 billion in farm cash receipts.
�
I I I I I
0 2

Proceedings
Approximately 27.3 million hectolitres (39.7 percent), were sold for fluid purposes, and 41.5million hectolitres (60.3 percent), for industrial purposes, including 1.2 million hectolitresshipped as cream.
Processing occurred at 308 plants across Canada, employing a total workforce of24,614 persons, and producing some $7.4 billion of processed dairy products shipments. Justunder $3.5 billion (47 percent), shipped as fluid milk products, and slightly less than $4billion (53 percent), as industrial milk products.
An estimated $185.2 million of these shipments were exported, $17.1 million (9.2percent), as fluid milk products, and $168.1 million (90.8 percent), as industrial milkproducts. Offsetting this were an estimated $189.4 million of dairy product imports, $2million (1.1 percent), of which were classified as fluid milk products, and $187.4 million(98.9 percent), as industrial milk products.
Distribution to consumers, primarily in the form of dairy products or as ingredientinputs in other processed food and beverage products, occurred through a network of justover 30,000 retail food stores and more than 114,000 food service industry outlets. Thesefood service industry outlets included the activities of licensed and unlicensed restaurants,accommodation, leisure industry, and institutional food service operations, as well asdistribution channels provided by vending, department store, and other retail food serviceindustry outlets.
Table 3 provides an overview of Canadian milk and dairy products industry operationsin 1992.
20

Agriculture and Agri-Food Canada
Table 3. Overview of Canadian Dairy Industry Operations - 1992
MILK PRODUCTION OPERATIONSNumber of Farms Shipping Milk or Cream 1992/93 29,358.0Number of Milk Cows (thousand head) 1,290.5Number of Dairy Heifers (thousand head) 592.5Total Farm Sales of Milk and Cream (millions of hectolitres) 68.7Farm Cash Receipts from Dairying (millions of $) 3,271
PROCESSING AND MANUFACTURING OPERATIONSNumber of Dairy Processing Plants 308.0Production Workers 14,523.0Total Employment 24,614.0Shipments (millions of $) 7,449Exports (millions of $) 185.2Imports (millions of $) 189.4
RETAIL AND FOOD SERVICE OPERATIONSRetail Food Stores 30,163.0Food Service Industry Outlets 114,196.0
Note: Food service industry outlets include licensed and unlicensed restaurants,take-out and delivery and social/contract caterer operations, pubs/taverns/lounges, accommodation, leisure industry and institutional food serviceoperations, as well as vending, department store, and other retail food service
activities.
Sources: Jelliss (1995). Based on information provided in Dairy Farmers of
Canada (1993); Statistics Canada (1992a, 1994); ISTC (1993); Canadian Grocer (1993);Canada Restaurant and Food Services Association (1993).
Number and Size of Dairy Farms
The family farm orientation of the Canadian dairy industry is not unlike that of the
United States or other major milk producing countries in Europe or Oceania. However, the
average size of dairy farms in the main Canadian milk producing regions, and in Canada as
a whole, is noticeably smaller than in the United States and a number of other competitorcountries (Table 4).
About 29 thousand farms sold milk or cream (quota holders)5 in 1993, compared with
174 thousand in 1968, a reduction of 145 thousand farms. Over the last 25 years, about one
farm out of six has remained in the dairy sector. Compared with other farm types in Canada,
As defined by the Canadian Dairy Commission.
21

Proceedings
the number of dairy farms has dropped the most, with small dairy farms showing the greatestdecline.
Table 4. Average Size of Dairy Farms in Canada, the United States, and OtherCountries 1989
NUMBER OF NUMBER OF COWSCOUNTRY/REGIONS DAIRY FARMS PER FARM
Quebec 14,969 38.5Ontario 12,000 40.6
CANADA Alberta 2,340 52.6B.C. 1,050 71.4
Canada 36,445 42.5North-East 32,300 66South-East 1,200 245
U.S. Pacific 4,500 339Midwest 54,850 54
U.S. 128,000 79OTHER Netherlands 35,000 55
COUNTRIES New Zealand 14,000 164
Source: Janelle (1992)
Average dairy farm size was 45 cows6 in 1993. Canada's dairy farms are stillcharacterized as small and medium size enterprises, mainly family operations, but there isa trend toward larger dairy farms.
Number and Size of Dairy Processing Firms
Canadian dairy processing plant numbers decreased from 880 in 1970 to 308 in 1992,and plants increased in size. (Figure 4) Small plant numbers decreased the most. The paceof rationalization was faster in dairy processed products than in the fluid milk industry. From1982 to 1992, the number of fluid milk plants decreased from 168 to 140 (-17 percent), whilethe number of other (non-fluid) dairy products plants decreased from 232 to 168 (-28percent). 7
6
Average for farms being classified as dairy farms, Farm Financial Survey (1994).
Statistics Canada, Census of Manufacturers.
22

Agriculture and Agri-Food Canada
In 1992, dairy plants employed 80 persons per plant, on average, up from 35 in 1970.Employees per plant averages higher in the dairy industry than the food industry (excl.
beverages) as a whole.
Regional Distribution of the Dairy Industry
Dairy farm numbers have been declining in all provinces; more rapidly on the Prairies.
Quebec is the only province to significantly increase its relative share of dairy farms inCanada. Quebec and Ontario, collectively account for over 70 percent of Canadian dairyindustry operations (Table 5).
Figure 4. Number of Dairy Processing Plants by Employment Size Group Canada,1972 and 1989
Number of Establishments
180 l
1-4 5-9 10-19 20-49
Employment Size Group
(a 1972 1989
50-99 100-199 200 and over
160 t1
140 +
120 -
100
80 -
60 -
40 --
20 --
23
o0 i

Proceedings
Table 5. Regional Distribution of the Dairy Industry in Canada
Atlantic Quebec Ontario Westpercentage share of Canada
Dairy FarmingDairy Farms (1993) 5% 43% 33% 18%Dairy Cows (1994) 6% 39% 34% 22%Production 1
(1993) 6% 38% 34% 22%Dairy Cash Receipts (1991-93) 6% 36% 34% 23%
Dairy Processing 2
Establishments (1989) 12% 26% 35% 27%Total Employees (1989) 10% 34% 33% 24%Manuf. Value Added (1989) 7% 46% 30% 18%
Population (1993) 8% 25% 37% 29%
Source: Based on Statistics Canada.
Production (shipments) in milk equivalents, butterfat basis.
2Note: regional data related to processing are not available for a more recent period.
Fluid milk production and processing industries are distributed across provincesconsistent with their population base (Tables 5 and 6). Industrial milk industries are moreconcentrated in central Canada, with Quebec accounting for almost half and Ontario forapproximately 30 percent, of Canadian industrial milk production.
Production
Canadian milk production has been stable over the last 40 years. Other majorcommodities increased substantially, and both U.S. and world milk production increasedsignificantly (Figure 5). Dairy products production is almost exclusively oriented toward thedomestic market.
24

25Agriculture and Agri-Food Canada
Table 6. Regional Distribution of Dairy Production and Population
Butterfat Production ('000 kg)three-year average 1991-92-93
Fluid Milk
as a percent of Canada
Industrial Milk and Cream
as a percent of Canada
Total Dairy (butterfat)
as a percent of Canada
Population in 1993millions
as a percent of Canada
Maritimes' Quebec Ontario Prairies
7,372 27,850 43,151 18,405
7% 25% 39% 17%
B.C. Canada
12,643 109,422
12% 100%/
7,190 73,399 49,160 20,321 6,812 156,880
5% 47% 31% 13% 4% 100%
14,562 101,249 92,311 38,726 19,455 266,302
5% 38% 35% 15% 7% 100%
1.8 7.2 10.7 4.8 3.5 28.8
6% 25% 37% 17% 12% 100%
Excludes Nfld.Source: Statistics Canada
Consumption
Aggregate per capita disappearance of all milk and dairy products (in milkequivalents, milkfat basis) has decreased in Canada (Figure 6). This overall decline in dairyproducts consumption derives mainly from a declining overall trend in the consumption offats. There are, however, some divergent trends between individual dairy products. Forexample, the demand for certain higher butterfat content products (such as whole milk,butter) has been reduced, while the demand for certain high-value products (such as specialtycheeses) and those perceived as more healthy (such as yogurt) has increased.

26 Proceedings
Figure 5. Milk Production Index 1961-1993: World, United States, Canada
Milk Production(Index 1961=100)
180
170
160
150
140
130
120 -
90 0 " " - -_-_- -
80 _-------- ,______r____r_________, _________,___I_
100
80 .
-- World - - - U.S.A. Canada
Figure 6. Total and Per Capita Disappearance of Dairy Products: Canada 1967-1992(milk equivalents, butterfat basis)
75 -
50 -
25
Dairy years (August-July)
I - Disappearance .Per capita disappearance
100 360
9a
S
u
r
X.3IIILJ
I'a

Agriculture and Agri-Food Canada
The shift in consumption patterns of milk and dairy products has been attributed tothree major factors (Nagengast, 1994). First, consumer awareness of the relation betweenhealth and diet has stimulated the demand for reduced-fat, reduced-calories food products.Second, some decades ago, milk was popular with children at meals and snack time, and thelarge numbers of children born in the 1950s affected the volume of milk consumed. In morerecent decades, soft drinks and juices came to dominate consumption patterns, and thebaby-boom was followed by a slow population growth. Third, although milk and dairyproducts are mainly consumed at home, products such as cheese have benefited substantiallyfrom the quick service restaurant with the popularity of products such as pizza, tacos, andcheeseburgers. In addition, frozen dairy products in specialized retail outlets (e.g., ice creamand frozen yogurt) have become a popular segment. These factors appear to be consistentwith Canadian experience.
Trade
Imports and exports of dairy products represent a small portion of Canadianproduction, as expressed in milk equivalents, butterfat basis. Dairy products account for avery small portion of Canadian agri-food exports (1 to 2 percent) and these exports decreasedmoderately in the early 1990s (Table 7).
Table 7. Trade Balance for Dairy Products in Canada 1989-1993(Million Dollars)
1989 1990 1991 1992 1993 1989-1993annual change
Imports 152 158 153 181 200 +8%
Exports 188 194 186 187 152 -5%Balance 36 35 33 6 -49
Source: Statistics Canada Trade Data.
Note: total may not add up due to rounding.
27

Proceedings
FINANCIAL STRUCTURE
Farm Cash Receipts
Real dairy farm cash receipts have grown very moderately, at a more stable, but muchslower, pace than the aggregate agricultural sector. This has resulted in a decline in the dairyindustry share of total farm cash receipts (Figure 7).
Figure 7. Farm Cash Receipts, Total Agriculture and Dairy 1960-1993(constant 1986 dollars)
thousand dollars (1986 S)
xc -n -o
l'i---- ~r TOTAL AGRICULTURE
I I
i/^ II------ - /__________________________
20,000,000
15,000,000
10,000,000
5,000,000j~'t~~~~~~ ~~~~DAIRY
O0 l o l lr '
Net Farm Cash Income
As farm numbers declined and dairy receipts increased, average net farm cash incomefor dairy farms has increased substantially. It is now well above average for the agriculturalsector and the second highest average net farm cash income in Canadian agriculture by farmtype (Figure 8).
28
£~,uUUUuU

29Agriculture and Agri-Food Canada
Figure 8. Net Farm Income by Major Farm Type, Canada Average 1989-93
Ave. Net Farm Income
(dollars per farm)
60,000
40,000
30,000
20,000
10,0()0
0 --
Beef Grains Hogs Dairy Poultry
Table 8. Returns on Assets and Equity in Canadian Agriculture 1989-93
Dairy Farms All FarmsReturns on Assets
1989 9.6% 7.1%1991 9.9% 7.2%1993 8.0% 6.2%
Returns on Equity1989 9.6% 6.7%1991 9.9% 6.9%1993 8.0% 6.0%
Source: Calculations based on Farm Financial Survey Data
Return on Assets
Return on assets for dairy farms in Canada was 9.9 percent in 1991 (Table 8). Thisis above the rate of return for all farms in Canada (7.3 percent) and also above the same ratefor U.S. dairy farms (7.4 percent) shown in Figure 9.
11 IIIH!

Proceedings
Figure 9. Return on Assets for Dairy and All Farms, Canada and United States: 1991
Rate of Return on Assets
10%
6% 4
0% -i-
Dairy Farms, Canada Dairy Farms, U.S. All Farms, Canada All Farms, U.S.
Production Costs: Farm Level
Table 98 shows that average Canadian raw milk production costs are generally abovethose in the United States and countries such as the Netherlands, and significantly abovethose in very low-cost countries such as Ireland and New Zealand. The only exception tothis relative ranking is a Price Waterhouse cost comparison between Canada and the UnitedStates done for the National Dairy Task Force. This study suggested that Quebec costs couldbe approximately equivalent to the average of those in the United States as a whole andslightly lower than those in twenty Northeastern U.S. states. Estimated Ontario costsremained higher than both. Wages paid, paid and unpaid family labour and return to equitywere excluded from cost comparisons in this study. There is also considerable variationbetween average production costs in different Canadian provinces and U.S. states. Ingeneral, Alberta appears to have the lowest raw milk production costs among Canadianprovinces, and California the lowest among reviewed U.S. states.
There also can be wide variations in production costs between the high-cost andlow-cost raw milk producers within individual Canadian provinces.
8 Given the diversity of estimating procedures, data sources, and time periods, Table 9summarizes various raw milk cost-of-production estimates in index form.
30

Agriculture and Agri-Food Canada 31
Table 9. Indices of Recent Canadian, U.S., and International Raw Milk Production
Cost Estimates
Baker,Hallberg,
Tanjuakio,Elterich Phillips, White Nicholson Hamm
Beck, and and Price and and
Jeffrey Liebrand Stonehouse ISTC Waterhouse Knoblauch Nott
Canada 100Alberta 100 100Manitoba 109N.B. 100
Quebec 113 102 120 100
Ontario 121 112 118 105 100 100
B.C. 127Sask. 130
U.S. 71 93 100
California 78 79
Minnesota 85Washington 94Wisconsin 99 89
New York 90 74-77
Michigan 96
Northeast 104
Netherlands 72 83
Ireland 45New Zealand 30 25
Source: Jelliss (1995) calculated from data in Jeffrey (1992); Baker, Hallberg, Tanjuakio, Elterich, Beck and
Liebrand (1990); Phillips, White, and Stonehouse (1989); ISTC (1991b); Price Waterhouse (1991a); Nicholson and
Knoblauch (1993); Hamm and Nott(1986). Each index is based on the lowest Canadian cost in each study.
Within province raw milk production costs for Ontario and Quebec are estimated tohave ranged from slightly above to generally below the Canadian target price for industrialmilk in 1990 (Figure 10). They also ranged from noticeably above to somewhat below the1990 support price for U.S. raw milk.
Production Costs: Processing Level
With regard to cost competitiveness in the Canadian dairy processing industry, subjectto the influence of exchange rate fluctuations, the input price of Canadian raw milk suppliesis generally higher than in the United States and a number of other competitor countries.(Table 10) However, once this is accounted for, there remains a noticeable variation inestimates concerning the competitiveness with which dairy processing industry operationsthemselves are conducted.
Canadian dairy processing costs are generally above those in the United States, withthe extent of the Canadian cost disadvantage being more noticeable in certain product linesthan in others.

32 Proceedings
Figure 10. Ontario and Quebec Industrial Raw Milk Production Costs by ProducerDeciles - 1990
$/hl
50
45
40
35
30
20
15
10
0
1 2 3 4 5 6 7 8 9
Deciles
Oantario 1--- Quebec Cdn Target Price U Target Price
Table 10. Indices of Recent Canadian and U.S. Dairy Processing Cost Estimates
Source: Jelliss (1995). Calculated from data in ISTC (1991b); Price Waterhouse (1991a, 1991b, 1991c); Canadian Dairy Commission (1993c);Commodity Credit Corporation (1993). Canada =100.
Fluid Milk Cheddar Cheese Butter Skim Milk Powder Ice Cream YogurtCan. U.S. Can. U.S. Can. U.S. Can. U.S. Can. U.S. Can. U.S.
ISTC 100 100 100 100 100 100
Price Waterhouse 100 98 100 77 100 88 100 83 100 76 100 88(Manufacturing only)
McClain(Manufacturing only) 100 87 100 94
Price Waterhouse(Total Processing) 100 87 100 54 100 89
McClain(Total Processing) 100 88 100 96
Official Processor Margins 100 44 100 44
I

Agriculture and Agri-Food Canada
The one exception to this relative ranking involves an ISTC study which suggestedthat potential Canadian cost competitiveness could be equivalent to that of the United Statesfor commodity cheddar cheese, ice cream, and yogurt. This analysis, based on anengineering cost study methodology, measured potential cost competitiveness on the basisof hypothesized investments in newly constructed, state-of-the-art processing plants,operating at full capacity utilization and optimal internal plant operating efficiencies. Thestudy was not designed to assess cost competitiveness of actual Canadian and U.S. dairyprocessing plants under the conditions which these plants would in fact be conducting theiroperations at any given time (Jelliss, 1992).
As in the case of milk production, the higher costs in Canada could be due to higherinput prices and the efficiency or productivity of processing operations. With respect toproductivity, multifactor productivity in the Canadian dairy processing industry between1961 and 1989 on a gross output basis is estimated to have increased approximately 6.1percent. However, most of this improvement occurred before 1980. Between 1980 and1989, multifactor productivity growth in Canadian dairy processing is negative, decliningapproximately 1.9 percent over this period (Statistics Canada, 1993e).
In summary, subject to the influence of exchange rate fluctuations, Canadianproduction costs are generally above those of the United States in both raw milk productionand dairy products processing. Lower-cost Canadian milk producers may be costcompetitive with certain of their higher-cost U.S. counterparts, and individual Canadianprocessing plants may also be cost competitive with certain of those in the U.S. Canadianraw milk production cost is considerably above that of extremely low-cost producers suchas New Zealand. Cost competitiveness of Canadian dairy processors vis-a-vis competitorsin countries other than the United States remains subject to further verification.
Organizational and Market Structure
Dairy farming is one of the least concentrated major agricultural sectors in Canada,with only 28 percent of production realized by the largest 10 percent of dairy farms.
Institutional arrangements can influence the way firms compete with each other and,thereby, industry performance in both cost and product competitiveness terms. For example,the supply management system has tended to constrain the degree of processing industryrivalry through such factors as restrictions on the movement of fluid milk beyond theprovince of origin, barriers to entry associated with quota systems (including plant supplyquotas in some provinces), domestic industry protection from import competition, anddifficulties incurred by processors in obtaining raw milk supplies for particularmanufacturing purposes (Brinkman, et al, 1993, pp. 50-53).
The regulation of prices by provincial authorities for both fluid and industrial milk inall provinces except Prince Edward Island (where only fluid milk price is regulated),constrains rivalry within the industry on the basis of price (Deloitte & Touche, 1992).Within this context, however, Canadian dairy processing firms have tended to compete overtime for increased market shares in particular industry market segments, for increased shares
33

Proceedings
of industrial raw milk supplies, and through profitability improvements from increased plantoperating efficiencies (ISTC, 1992a).
The degree of rivalry may also have been influenced over time by continuing mergerand acquisition activity and increase in industry concentration at both the national andprovincial levels. Recent consolidation activities involving cooperatives such as Agropur inQuebec and Dairyworld Foods in British Columbia, have been designed in part to combatperceived threats to competitive positions from investor-owned multinationals such asBeatrice and Kraft-General Foods, and to better position the companies concerned forpossible changes in provincial government regulations and altered international trading rules(Co-operatives Secretariat, 1992).
The 4-firm concentration ratios for the Canadian fluid milk products industryincreased from 1983 to 1992, while concentration changed little in the industrial milkproducts industry (Table 11). These are national data and do not necessarily reflect thedegree of concentration for particular product segments nor geographic areas.
Notwithstanding involvement of individual dairy products companies (Ault Foods inOntario, Agropur cooperative agro-alimentaire in Quebec, and Dairyworld Foods in BritishColumbia) in foreign market activities, Canadian-owned companies have comparatively littleexperience in dairy industry operations and differentiated customer requirements outside thedomestic market. The largely domestic and regional focus of the Canadian dairy productsindustry limits participation in more dynamic markets elsewhere. It also limits developmentof expertise in international production, marketing, sales and distribution characteristic ofmore internationally oriented competitors in Europe, New Zealand, and the United States.However, a number of large Canadian subsidiaries of multinational firms may have accessto such expertise in serving foreign markets.
Table 11. 4-firm Concentration Ratios in the Canadian Dairy Products ProcessingIndustry: 1983-1992
Fluid Milk Industrial Milk ProductsIndustry Industry
1983 41.9% 48.1%1984 48.3% 47.1%1985 48.5% 47.7%1992 50%+
Source: 1983-1985: Statistics Canada (1986); 1992: ISTC (1992a), cited by Jelliss (1995)
34
Agriculture and Agri-Food Canada
Ownership Structure
A structural characteristic of the dairy industry in Canada and other countries is theprominent role of cooperatives. About one-half of Canadian dairy processing firms arecooperatives, owned by the dairy farmers who provide their raw milk supplies.Approximately 35 percent are publicly traded investor-owned companies. The remaining 15percent are generally smaller, privately held, investor-owned operations. Investor-ownedfirms are relatively more prominent in fluid milk operations. Cooperatives are relativelymore prevalent in industrial milk processing activities (ISTC, 1992a). Cooperatives holdleading positions in milk marketing and dairy products processing in all provinces, exceptOntario, where their market share is estimated at 20 percent (Sullivan, 1992).
The relationship between form of ownership and industry competitiveness is not clear.Lambert and Romain (1992) reported that from 1977-1986 labour productivity in the stronglycooperative Quebec processing industry was consistently above that in Ontario and the restof Canada combined. However, they also reported that the trend of labour productivity inQuebec from 1977-1986 showed a relative decrease compared to that in Ontario and the restof Canada. While these results could be due to factors unrelated to ownership, Lambert andRomain found that the decrease in labour productivity in Quebec was concentrated in thecooperatives segment of the industry while labour productivity in the investor-ownedsegment increased. Investor-owned firms appear to hold a relatively greater market share ingrowing segments of the market, processing an estimated 78 percent of milk used forspecialty cheeses, 49 percent of that for yogurt, ice cream, and cottage cheese, and 37 percentof that consumed in fluid form in 1989 (GREPA, 1990). A question to be addressed,therefore, is the role that differences in the organizational, management, and goal structuresof cooperatives and investor-owned firms may play in such divergent competitiveness trends.
PERFORMANCE INDICATORS
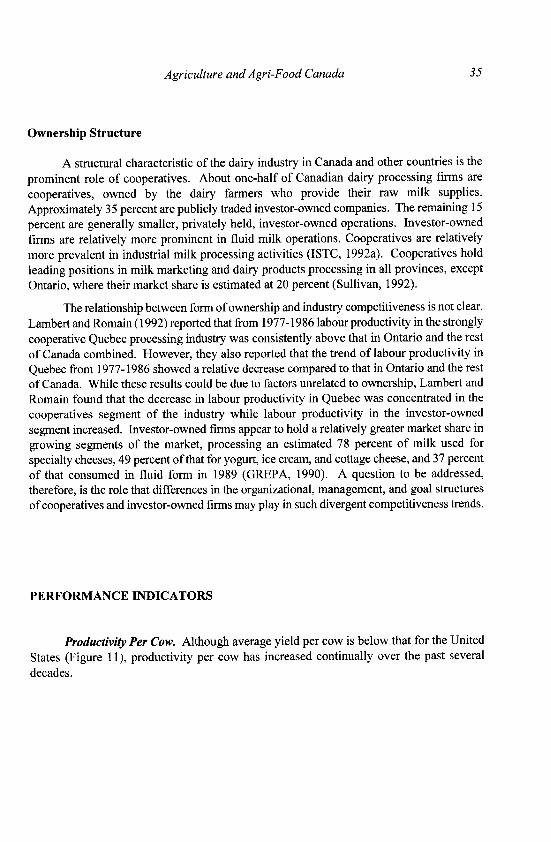
Productivity Per Cow. Although average yield per cow is below that for the UnitedStates (Figure 11), productivity per cow has increased continually over the past severaldecades.
35
Proceedings
Figure 11. Average Yield Per Cow: Canada, United States, Rest of World: 1967-1992
Milk per cow
8,000
7,000
United States , -
6,000
_ ..-- '- Canada
5,000 - - -
4,000 -
3,000World Excl. Canada and U.S.A.
! ... . _ ...................... ..................
2,000 - ...................................................
1,000
I- - -Unieted States Canada ...... WORLD EXCL CANADA AND U.S.A.
Production Stability. Milk supply has evolved toward more stable productionthroughout the year (Figure 12).
Financial Performance Indicators by Farm Size. Performance indicators vary byfarm size (Table 12). For instance, dairy sales per cow increase with the size of theenterprise (number of cows or value of sales), suggesting that larger farms are moreproductive.
Growth in GDP. For the period 1961 to 1993, the Canadian dairy processing industryhas grown more slowly, in terms of gross domestic product (GDP), than the rest of the foodand beverage industry. Dairy processing GDP (constant dollars) increased by 1 percentannually, compared with 3 percent, 7 percent and 7 percent, respectively, for the rest of thefood and beverage industry, for the rest of the manufacturing industry and for the entireeconomy. As a result, the dairy processing share of food and beverage GDP declined from16 percent to 12 percent.
Real growth in GDP declined from the 1960s to the 1970s for both the dairyprocessing industry and the food industry as a whole. In the 1980s, both have shownincreases, but at a slow pace, with dairy processing growing slower than the food industry.
36

Agriculture and Agri-Food Canada 37
Figure 12. Monthly Milk Deliveries, Canada: January 1976-June 1994
Kilolitres
800000

38 Proceedings
Table 12. Selected Characteristics of Canadian Farms by Sales Class: 1993 (1)
less than $25,000 $50,000 $100,000$25,000 $49,999 $99,999 $249,999 $250,000+ all classes
Dairy Farms as a % of all dairy farmsNumber of Dairy FarmsQuotaTotal AssetsFarm RevenueDairy Sales
Average per farmNet Farm Income $Total Govt. payments $(2Average number of cows
Financial IndicatorsMargin before int.& sal.Returns on Equity (3)Returns on Assets (3)
Average per cowDairy sales/cow ($)
2.3%
0.5%
0.8%
0.3%
0.2%
5.2% 25.8% 52.9% 13.9% 100%1.6% 13.7% 54.1% 30.2% 100%2.2% 15.2% 53.6% 28.2% 100%1.3% 13.4% 53.8% 31.3% 100%1.2% 12.9% 53.8% 31.8% 100%
479 13,860 22,425 45,082 100,213 44,2452,503 4,468 10,507 15,690 23,663 14,575
17 22 30 45 81 45
9.8% 41.7% 39.0% 41.9% 43.1% 41.8%0.47% 4.35% 6.33% 8.01% 9.44% 7.99%0.62% 4.66% 6.56% 8.03% 9.09% 7.98%
762 1,370 2,155 2,912 3,681 2,915
All Farms excluding Dairy as a % of all farms excl. dairyNumber of Farms 42.5% 18.0% 16.9% 15.6% 7.0% 100%Quota 0.8% 1.1% 4.6% 19.9% 73.6% 100%Total Assets 22.5% 13.0% 17.5% 23.3% 23.7% 100%Farm Revenue 5.5% 7.5% 13.7% 25.6% 47.7% 100%
Average per farmNet Farm Income $Total Govt. payments $
Financial IndicatorsMargin before int.& sal.Returns on Equity (3)Returns on Assets (3)
-1,113 8,361 20,218 39,089 151,613 21,1252,858 7,888 13,628 20,242 35,867 10,594
2.9% 28.3% 34.2% 33.9% 30.0% 29.9%-0.28% 2.83% 4.94% 7.03% 12.76% 5.69%0.15% 3.21% 5.23% 7.14% 11.66% 5.88%
Source: Based on Farm Financial Survey 1994.
Notes: (1) Adjustments made to data in order to exclude non-farm operations.(2) Government payments for dairy farms include non-dairy payments.(3) Returns include wages and salaries paid to family members.

Agriculture and Agri-Food Canada
Labour and Capital Productivity
Canadian dairy processing labour and capital productivity is higher than that of the overall
food and beverage industry (Table 13). While Canadian dairy processing labour productivity
has increased at a faster rate than in the United States (Table 14), it is still below the U.S.
productivity level.
Table 13. Labour and Capital Productivity: Dairy Vs Food and Beverage in Canada
Food and Fluid OtherBeverage Dairy Milk Dairy
Labour productivity(manuf. v.a. $K1986/person hrs), 1992 46.39 59.96 58.47 61.20
Growth (annual % change), 1983-1992 1.7% 2.7% 1.5% 3.7%
Capital productivity(manuf. v.a. $'000k 1986 plant), 1992 4,514 5,948 5,827 6,048
Growth (annual % change), 1983-1992 3.2% 7.2% 4.9% 9.2%
Source: Based on Statistics Canada.
Table 14. Labour Productivity in the Dairy Industries, Canada and United States
Canada United States(annual % change)
Labour productivity - growth 1982/3-1992(manuf.v.a.$ current/person hours) 7.3% 5.7%
Labour productivity - value in 1992(manuf.v.a. $Can./person hours) 72.73 90.20
Source: Based on Statistics Canada, U.S. Bureau of Census.
39

Proceedings
Compared with the United States, the gap in labour productivity is higher in the fluidmilk than in the other dairy products industry, as shown below for 1992:9
* fluid milk industry:- 93.25 $Can/person hour in the United States- 70.93 $Can/person hour in Canada
* other dairy products industry:- 88.29 $Can/person hour in the United States- 74.24 $Can/person hour in Canada.
Economies of Scale and Capacity Utilization. Scale of operations and plant capacityutilization rates can affect costs. Various studies have identified potential economies of scaleacross a number of processed fluid and industrial dairy product categories (ISTC, 1991b;Rude, 1992).
While Canada has a number of world scale capable dairy processing plants underexisting technology (ISTC, 1991b), most plants tend to be smaller than those in the UnitedStates. The United States has 6 times the number of dairy processing plants as Canada, butprocesses 9 times the dairy products on a milk equivalent basis (Price Waterhouse, 1991 a).
Canadian dairy processing plant capacity utilization rates are lower than those in theUnited States across all industry segments, except ice cream and frozen desserts (Table 15).Additional costs associated with such excess capacity problems impact adversely the overallcost competitiveness of Canadian dairy processing firms in the various industry segmentsconcerned.
Profitability. Dairy processing industry profitability is generally higher than that of the foodprocessing industry as a whole (Table 16).
Table 15. Profitability Indicators in the Dairy and Food Industries in Canada
9 It should be noted that these productivity comparisons are affected by the exchange ratebetween the two countries.
Profitability Indicators Dairy Industry Food Industry
Return on Capital Employed (1987) 19.3% 13.3%Return on Equity (1987) 14.9% 14.6%Profits (after tax) as % of Income (1990) 2.7% 3.3%Source: Jelliss (1995)
40

Agriculture and Agri-Food Canada
In 1987, the dairy processing industry earned the highest return on capital employedamong all the food processing industries. It also ranked fourth among the food sectors, bothin terms of return on equity and in terms of profits as a percent of income.
Price Trends. Prices paid to milk producers have grown at a faster pace than prices foraggregate agricultural products. This has been reflected in the prices that processors chargedfor their products. However, the extensive price differentiation for milk at the producerlevel, has not led to a faster increase of prices at the consumer level, compared to the priceindex for all foods (Table 16).
Table 16. Prices and Trends in the Canadian Dairy and Food Systems, 1981-1993
Index 1986=100 Farm Product Industrial Product Consumer
Price Index Price Index Price Index
All Dairy All Dairy All Dairy
Agriculture Products Food Products Food Products
1981 107.1 85.4 84.2 75.1 78.9 76.5
1986 100.0 100.0 100.0 100.0 100.0 100.0
1993 106.4 117.1 116 123 122.8 116.9
Source: Statistics Canada.
Prices in the dairy processing industry have increased at a faster pace than in the foodindustry since 1981. Fluid milk product prices have increased at a faster pace than prices forindustrial milk products.
Relative to other major producing countries, prices for dairy products in Canada aregenerally higher (Figure 13). Compared with the United States, Canadian dairy prices arehigher at all levels from farmers to consumers, and have increased at a faster rate (Figure 14).
CANADIAN DAIRY POLICIES
This section first examines the evolution of dairy policy, and then describes thebackground behind the development of the current supply management system and relatedsectoral polices.
41

42 Proceedings
Figure 13. Farm Gate Milk Price for Canada and Selected Countries, 1979-1993
Cdn $/tonne
400
100
200
1979 1980 1981 1982 1983 1984 1985 1986 1987 1988 1989 1990 1991 1992 1993
(e) (p)
Canada USA ........ EEC New Zealan d
Figure 14. Consumer Price Indices for All Food and All Dairy Products Canada andUnited States, 1978-1992
Index 1978 = 100
220
200
180 /
01
/0
160+
140 - - '.
Dairy products-Canada;120 n
- - Food -USA
- - --Dairy products -USA
1978 1979 1980 1981 1982 1983 1984 1985 1986 1987 1988 1989 1990 1991 1992

Agriculture and Agri-Food Canada
Evolution of Canadian Dairy Policies
Many agricultural programs and institutions introduced in reaction to major economicdisruptions, such as depression and war, have become entrenched as features oflong-standing agricultural policy. These tendencies are evident in Canadian dairy policy andinstitutions (Veeman, 1987).
In Canada, the federal government appointed the first Dominion Dairy Commissionerin 1890. Prior to World War I, Canada was a major exporter of cheese and butter to theUnited Kingdom. In 1935, a temporary subsidy on butter and cheese was introduced.During World War II, federal subsidies were paid to dairy farmers to maintain productionlevels under a system of wartime price controls. Postwar assistance for industrial milkproducts, initially intended to be transitional, included programs to support prices, to exportsurplus products and to restrict imports. These programs, administered by the AgriculturalPrices Support Board, subsequently were extended and administered by the AgriculturalStabilization Board established in 1958. In 1963, the lack of coordination between federaland provincial policies and the absence of effective mechanisms to control milk productionled to a Canadian Dairy Conference. In 1965, a milk marketing board was established in thekey Ontario market. In 1967, establishment of the Canadian Dairy Commission (CDC)under the Canadian Dairy Commission Act provided a federal body to develop initiatives inmanagement of milk supply in cooperation with the provinces and provided the legislativebasis for the implementation of supply management of industrial milk and cream. Supplymanagement for fluid milk was enabled under the existing Agricultural Products MarketingAct (1957) which allowed provinces to control the fluid milk market. The National MilkMarketing Plan approach to managing the dairy market was adopted at the end of 1970.Dairy programs formerly under the Agricultural Stabilization Board are currentlyadministered by the CDC (Grant, 1991 and Veeman, 1987).
Most marketing boards date from the 1930s when they were established underprovincial legislation. The use of marketing boards in Canada as an effective means of majorincome transfers to farmers mainly dates from the 1960s and 1970s, in particular, the supplyrestricting boards. The evolution of marketing boards in Canada reflects the dual jurisdiction(federal and provincial) over agriculture and marketing. The general lack of jurisdictionalconflict over the establishment of the various provincial fluid milk boards reflected theperishable nature of fluid milk and the localized nature of regulated markets for this product(Veeman, 1987).
Dairy policy in Canada uses import limitations to support the sector, and combinesthe long-standing feature of direct subsidy payments on specified marketed quantities ofmilk, along with quota restraints on marketings by producers. The milk market sharingprogram, basic to this policy since the early 1970s, is embodied in an agreement between thefederal and provincial governments and is administered by a committee composed of theCanadian Dairy Commission, the provincial milk boards, and government agencies (Veeman,1987).
43

Proceedings
Structures to manage the dairy industry were put in place in Canada rather later thanin other advanced industrial countries. This was partly due to the need to negotiate a nationalpolicy between the federal government and the provinces, but the Canadian policy can alsobe seen as a response to changed world market conditions created by the existence of dairymanagement systems elsewhere. The structures that exist to regulate milk marketing underprovincial jurisdiction and under supply management are described in the Veeman and St.Louis and Barichello and Romaine papers which follow.
Sectoral Policies Affecting the Dairy Industry'o
Technical Regulations. A variety of provincial and federal government health and safety,labelling, and compositional standards, and grading and environmental rules and regulationsapply to the Canadian dairy products industry at both the farm and processing plant levels.
Provincial governments undertake milk testing on the farm, and monitor products forquality and safety in provincially registered milk processing plants. The federal governmentcarries out similar inspection activities in the federally registered processing plants thatprocess industrial milk into manufactured dairy products entering interprovincial andinternational trade.
The Federal government and some provincial governments also test and monitor dairyproducts at the retail level to ensure consumer safety through a variety of packaging,labelling, composition, weight, and sanitation controls.
Research and Development. The research component of combined federal, provincial andindustry expenditures approached $130 million in 1991-1992, representing approximately1.7 percent of the value of dairy products industry shipments in 1991. If cost-of-productionstudies and milk recording programs are added, the total approaches $164 million; or slightlyless than 2.2 percent of shipments value. Technology transfer activities entail just over $17million in outlays; or less than one-quarter of one percent of shipments value. Of the totaloutlays identified, the combined federal and provincial government share amounted to anestimated $55.4 million, 31 percent of the total, and the private sector share to approximately$126 million, 69 percent of the total.
Government contributions to dairy industry research and development involve boththe conduct and support of basic and applied research in government, university, and privateinstitutions. Agriculture and Agri-Food Canada operates a network of research stationsaddressing various aspects of dairy cattle production. These include genetics, embryomanipulation, animal welfare, and food safety. Federal and provincial governments alsocontribute to the funding of university-based dairy research at the eight universities havingdairy programs within their faculties of Agriculture.
10 Based on Jelliss (1995).
44

Agriculture and Agri-Food Canada
Recent Policy Changes1
Reduction In Direct Subsidy. Up until 1988, the federal government paid dairy farmers adirect subsidy for industrial milk produced within domestic requirements. From 1988 to1989, the direct subsidy was paid on actual domestic requirements plus the export sleeve.Since 1989, the direct subsidy has been paid only on actual domestic requirements.
In 1992, this direct subsidy was $6.03/hl. Beginning August 1993, the federalgovernment lowered the subsidy by 60 cents to $5.43/hl. On August 1,1993, the CDCannounced that they would fully support the target price by raising the support price for skimmilk powder. In effect, consumers would be charged a higher price to offset the drop in thedairy subsidy.
The effect of these changes has been to reduce the total amount of subsidy paid fromapproximately $270 million (pre-1988) to $225 million in 1994. It has been estimated that,as a result of this reduction as implemented by the CDC, there is no great effect onproduction or consumption. The skim milk powder support price increases, the buttersupport price remains constant, and cheese and other dairy product prices rise slightly dueto the increase in industrial milk price to processors. Due to these higher product prices,there is a slight reduction in consumption of skim milk powder, cheese and other dairyproducts, a small increase in butter consumption due to substitution effects, and a net smallreduction in domestic requirement for industrial milk leading to a small decrease in MSQ.
The 1995 federal budget announced a 30 percent reduction in the direct subsidy overthe next two years (i.e., to $4.62/hl in 1995 and to $3.80/hl in 1996). As a result, the valueof the subsidy will fall to $160 million by 1996. The future of this remaining subsidy amountwill be further considered over the next year, with the intent of identifying alternative usesfor, and/or additional reduction in, these funds. The 1996 federal budget announced that thedairy subsidy will be phased out entirely over the next several years.
Crossloading Butter And Skim Milk Powder Prices. Historically, target price increaseswere shared evenly by butter and skim milk powder support prices. On August 1, 1991, theCDC started to shift the relative weights so that skim milk powder support prices increasedmore than butter. This was extended and expanded on August 1, 1993 when the CDCannounced that it would reduce the butter support price and maintain the target price byincreasing skim milk powder support prices. The effect of this crossloading is an increasein butter demand and a reduction in skim milk powder demand. Overall, MSQ (in butterfatequivalents) is still dropping with declining domestic demand, but the rate of decline is lessunder this scenario. This move seems appropriate given that demand for butterfat isdeclining relative to solids non-fat.
1 i Based on Ewing (1994).
45

Proceedings
Multiple Component Pricing. Multiple Component Pricing (MCP) is an approach thatpermits all components of milk to be measured and valued to reflect market demands. Since1992, four provinces have introduced multiple component pricing for industrial milk(Ontario, Quebec, Manitoba and New Brunswick). Initial component prices for butterfat,protein and other solids were selected such that overall returns for milk of averagecomposition was unchanged. Multiple component pricing is not expected to have a largeimmediate impact on returns or milk supplies. Depending on the relative prices set, MCPcould have a long-run impact on the composition of milk produced in Canada. If componentprices are set with market demands in mind then pricing and resulting milk allocation andprocessed product mix will move toward a more market responsive pattern. If componentprices are set with an eye to maintaining producer revenues then such allocative efficienciesmay not be achieved.
Change In The Basis For Applying Levies. Levies are collected by provincial boards oragencies and forwarded to the CDC. Three types of levies have been charged to dairyproducers in recent years: the in-quota levy, a fluid skim-off levy, and the over-quota levy.The CDC uses levy revenue to finance exports of dairy products not required for domesticpurposes. The levies are also used to finance special programs designed to increase domesticutilization of butterfat and skim milk powder.
The in-quota levy ($3.40/hl in 1990) has traditionally been charged on all industrialmilk produced within MSQ. The fluid skim-off levy has been charged on the volume ofskim-off transferred from the fluid sector to the industrial sector. The over-quota levy($32.64/hl in 1990) is charged on all production over MSQ, and is set very high to discourageproducers from delivering milk above their quota level.
The in-quota levy is now applied to both fluid and industrial milk production and theskim-off levy is dropped. A three year phase-in period began in 1991-92 when 55 percentof each province's in-quota levy requirements were from traditional MSQ in-quota levy plusfluid skim-off levy and 45 percent from a levy applied to all milk production. This ratiobetween the new and old methods increased to 75-25 percent in 1992-93 and to 100-0percent in 1993-94.
This policy change moves the regulation of the fluid and industrial markets closertogether. The fluid market is now a large contributor of skim-off cream to the industrialsector, as a result of the demand shift towards low-fat fluid products. This levy changeequalizes the contribution of each sector in financing demand enhancing programs.
The net effect seems likely to be a move towards a more integrated and more marketresponsive sector.
Butterfat Utilization And Rebate Programs. Two programs were introduced recently toaddress the declining demand for butterfat - the Butterfat Utilization Program (1991) andthe Rebate Program for Further Processors (1992). Both programs are entirely industryfunded.
46

Agriculture and Agri-Food Canada
The Butterfat Utilization Program pays a flat rate of $2.00 per kilogram to processorssuch as bakeries and popcorn manufacturers who buy butter. It also compensatesmanufacturers of clarified butter ($1.00/kg), ghee ($1.50/kg) and fractionated butter($2.75/kg). In total, the program expended approximately $6.4 million from June 1992 toMay 1993. The support price of butter was about $5.33/kg at the time and the world pricewas about $1.90/kg.
The Rebate Program for Further Processors offered a rebate equivalent to 60 percentof the Canada-U.S. ingredient cost difference to processors who demonstrate actual orpotential loss of market share to an imported product, due to higher ingredient costs.Spending on the program was $3.2 million in 1991-92 and $7.3 million in 1992-93. Theprogram has been extended for three years and the rebate expanded to 85 percent of the costdifferential.
The CDC credits these two programs with stimulating butterfat demand such thatMSQ increased by 2 percent at the beginning of the 1993-94 dairy year, the first increasesince 1988. This increase in demand was also aided by the lack of increases in butter supportprices over the past two years.
Single Quota For Fluid And Industrial Milk. Manitoba, Saskatchewan, New Brunswickand Ontario are currently using a single quota for fluid and industrial milk. Many otherprovinces are considering changing to a single quota system. The implications of suchchanges include:* simpler administration.* all producers receive the same price for their milk -- essentially a means of sharing accessto all market uses equally among all producers.* skim-off is no longer a fluid vs. industrial issue but one that all milk producers must face.This presumably will enhance intra-industry cooperation and coordination.* easier movement towards a national system of supply control in Canada. (The next stagewould be a single national market for quota.).* no major effects on aggregate quantities and prices but there could be significant individualimpacts on producers who did not have a 50/50 split between fluid and industrial quota,which includes most producers. The impact could be positive or negative depending onwhether industrial or fluid quota was the bigger share of an individual's production. Howthe change is implemented and compensated for in each province will affect the magnitudeof these effects.
SUMMARY
The milk and dairy products industry ranks among the major industries in theCanadian agri-food sector in terms of farm cash receipts, processed product shipments,employment, value-added and industry contribution to gross domestic product. It has
47

Proceedings
operated within an extensively regulated policy environment. The federal governmentsupports the target price through two programs: a direct subsidy to industrial milk producers,and intervention purchasing of surplus butter and skim milk powder. Fluid milk pricing isunder provincial jurisdiction and is based on provincial cost-of-production formulas, thenational industrial milk target price, and end-use. Government policies in areas such as dairyfood safety and quality regulations, as well as research and technology developmentactivities contribute positively to both cost and product competitiveness.
Supply management is the key policy affecting the Canadian dairy industry. It usesa combination of production and marketing controls (production quotas), import controls(tariff rate quotas) and administered pricing (based on cost-of production) to stabilize andsupport farm income in the dairy sector. The supply management system for dairy hassuccessfully achieved most of its initial objectives; for instance, regional production capacityhas been maintained, the vast majority of dairy farms are family owned and operated, farmfamily incomes in the dairy industry exceed the average family income of all other farmtypes (except poultry) and are higher than the average Canadian family income. However,certain elements of the supply management system, while upholding the objectives of thesystem, have imposed a number of inflexibilities tending to constrain adjustments to morecompetitive forms of industry organization.
While supply management contributed stability to the industry and has resulted inhigh returns to producers and processors, it reduced incentives for growth, prevented efficientreallocation of production and processing among regions, and added to the cost ofrationalization within regions. It restricted the size and raised the costs of dairy farms andprocessing plants. Canadian milk production costs are noticeably above those of the UnitedStates and the Netherlands, more than double those of Ireland, and more than three timesthose of low cost producers such as New Zealand.
The overall Canadian market is relatively small and, to a degree, fragmented byinterprovincial trade barriers, which can affect the ability of the industry to achieveeconomies of scale and improved levels of capacity utilization.
Sector structure, linkages and strategies also exhibit a number of positive and negativecharacteristics. The potential for additional economies of scale and enhanced levels of bothtechnical and allocative efficiency appear to exist in raw milk production.
In dairy products processing, similar opportunities for economies of scale andtechnical efficiency improvements are in evidence, while reported plant capacity utilizationrates in Canada are below those in the United States. Some larger firms and plants may becompetitive with certain of their U.S. counterparts, and some firms have had success indeveloping export markets for higher valued products. However, the largely domestic andregional focus of the industry has provided relatively limited opportunities for participationin more dynamic markets elsewhere, and the development of expertise in the internationalproduction, marketing, sales, and distribution skills characteristic of more internationallyoriented competitors.
48

Agriculture and Agri-Food Canada
Various factors, including dairy policies and institutions, have contributed to thedomestic orientation of the industry, constrained structural adjustment, and influenced theway firms compete.
While the dairy industry clearly faces competitive challenges, a number of strengthsappear to exist and a number of opportunities for improvements can be identified. Inparticular, there exist strengths in the areas of genetics and dairy stock breeding, as well asin many of the regulations governing product safety and quality. Opportunities exist toimprove management practices and technical efficiency at both the dairy farm and dairyproducts processing levels. Modifications to the operation of the supply managementsystem, along with appropriate investments in the process, product, and marketingdevelopments are required to facilitate movement into higher-value dairy product marketsegments. Raw milk cost disadvantages are likely to be relatively less important and offerareas of potential improvement. It will be important to ensure that current industrystakeholder initiatives in these areas are continued, and that policies at other levels and inother areas of the economy play a supportive role.
Neither the CUSTA, the NAFTA nor the Uruguay Round GATT agreements havesignificantly affected the import protection afforded the Canadian dairy industry. Recentpolicy discussions have focused on relatively modest adjustments to existing policies to makethem compatible with the GATT/WTO rules.
The major pressures for change are the consumer preference for low-fat products andthe global trend toward more liberal trading environments. Gradual adjustment to the newtrading regime is the preferred course of action in Canada. Sudden and completederegulation of the dairy sector is not desirable politically, socially or economically.
BIBLIOGRAPHY
Briant, Cathy. 1991. "Milk: A Magic Mix of Market Opportunities." Australian DairyFoods, February.
Brinkman, G., R. Romain, R. Lambert, P. Stonehouse. 1993. "A Review of FactorsAffecting the Competitiveness of the Canadian Dairy Industry", Intercambio Ltd.,January 4.
Canadian Agricultural Research Council. 1992. "Strategy for Dairy Research andTechnology Transfer in Canada", Working Paper, October.
Canadian Dairy Commission. 1989. The Canadian Dairy Industry: Where Tradition andTechnology Meet, Catalogue No. CC 104-2/1989E, Ottawa, Canadian DairyCommission.
(1992-1993). Annual Report.
49

Proceedings
(1993a). "Dairy products: Choice and Quality", February.
(1993b). "Pricing Mechanism for Industrial Milk in Canada", June.
(1993c). "Processor Margins 1992".
(1994a). "Dairy Products: Choice and Quality", March.
(1994b). "The National Dairy Policy: Key Elements", March.
(1994c). "Supply Management in Canada", March.
Commodity Credit Corporation. 1993. Personal communication.
Co-operatives Secretariat. 1992. Canadian Co-operatives. Resource File, Ottawa,Co-operatives Secretariat.
Cozzarin, Brian. 1992. "The Economic Impact on Producer's Net Revenues and QuotaValues of a Change in the Federal Dairy Subsidy", Agriculture Canada DiscussionPaper 4/92, September. (as quoted by Ewing [1994])
Dairy Farmers of Canada. 1993. Facts and Figures at a Glance, Ottawa, Dairy Farmers ofCanada, November.
1992. Facts and Figures at a Glance, Ottawa, Dairy Farmers of Canada, October.
Deloitte & Touche. 1992. "Competitiveness Profile of the Canadian Cheese Industry",Consultant Report for the Canadian International Trade Tribunal, Reference No.GC-91-001, March.
Desbiens, Carol, and Patti Negrave. 1993. "Cost of Production of Milk in Ontario andQuebec: An Analysis at the Farm Level", Farm Analysis Bulletin No. 55, FarmEconomic Division, Policy Branch, Agriculture Canada, April.
Ewing, Rebecca. 1994. "The Canadian Dairy Industry: Institutional Structure and DemandTrends in the 1990s", Working Paper 1/94, Policy Branch, Agriculture and Agri-FoodCanada, February.
Grant, Wyn. 1991. The Dairy Industry An International Comparison, Dartmouth PublishingCompany Limited, Aldershot, England.
GREPA. 1990. Quebec Dairy Facts, 1990, Groupe de recherche en economie et politiqueagricoles, Departement d'dconomie rurale, Universite Laval.
Grimard, Julie and Isabelle Farella. 1994. Financial Characteristics of Canadian and U.S.Dairy Farms, 1989 and 1991", unpublished paper, March.
Hurd, L. W. 1982. "The Canadian System of Milk Marketing", a paper given to a MilkMarketing Seminar, Michigan State University as cited by Grant [1991].
Industry, Science and Technology Canada. 199 a. "The Cost of Capital in the U.S. andCanadian Dairy Processing Industries", Special Projects Branch, January.
50

Agriculture and Agri-Food Canada
1991b. "Canada's Food Processing Industry: A Competitiveness Analysis of PrincipalIndustrial Milk Products", Special Projects Branch, August.
1992a. Industry Profile. Dairy Products.
1992b. A Taste of Tomorrow, Food Products Branch, June.
Jelliss, Arvin D. 1995. "Competitiveness Assessment of the Canadian Milk and DairyProducts Industry", unpublished draft Working Paper, Economic and Policy AnalysisDirectorate, Policy Branch, Agriculture and Agri-Food Canada, Fall.
Jelliss, Arvin D. 1992. "Economic Impacts of Increased Import Competition on theCanadian Dairy Farm and Dairy Products Processing Sectors Under AlternativePolicy Scenarios", Competitiveness Division, Agri-Food Policy Directorate, PolicyBranch, Agriculture Canada, January.
Lambert, Rdmy, and Robert Romain. 1992. Structure etperformance de l'industrie de latransformation desproduits laitiers du Quebec face au nouveau contexte commercial,Entente Auxiliaire Canada-Quebec sur le developpement agro-alimentaire, leministere de l'Agriculture, des Pecheries et de l'Alimentation du Quebec et leministere de I'Agriculture du Canada.
Nagengast, Z.T. et al. 1994. "The Quick Service Restaurant Industry" in Food andAgricultural Markets: The Quiet Revolution, L.P. Schertz and L.M. Daft, eds.
Price Waterhouse. 1991a. "A Comparison of the Canadian and U.S. Dairy Industries - FinalReport", Commissioned Study prepared for the Task Force on National Dairy Policy,February.
199 lb. "A Comparison of the Canadian and U.S. Dairy Industries - Appendix A -Analysis of the Canadian and U.S. Dairy Production Sector", Commissioned Studyprepared for the Task Force on National Dairy Policy, March.
1991c. "A Comparison of the Canadian and U.S. Dairy Industries - AppendixAnalysis of the Canadian and U.S. Dairy Processing Sector", Commissioned Studyprepared for the Task Force on National Dairy Policy, March.
Romain, Robert and Rdmy Lambert. 1992. "Economies of Size, Technical Efficiency, andthe Cost of Production in the Dairy Sectors of Quebec and Ontario", Research SeriesNo. 21, Groupe de recherche agro-alimentaire (GRAAL), Department d'6conomierurale, Faculte des sciences de l'agriculture et de l'alimentation, Universite Laval,December.
Rude, James. 1992. "The Impact of Trade Liberalization on the Canadian Dairy ProcessingIndustry", Ph.D. Dissertation, University of Guelph.
Statistics Canada. 1978. Corporation Financial Statistics 1975, Ottawa, Published byAuthority of the Minister of Industry, Trade and Commerce, May.
51

Proceedings
1985. Corporation Financial Statistics 1983, Ottawa, Minister of Supply andServices Canada, November.
1986. Industrial Organization and Concentration in the Manufacturing, Mining andLogging Industries, Catalogue 31-402 Occasional.
1988a. Corporation Financial Statistics 1985, Ottawa, Minister of Supply andServices Canada, April.
1988b. ,Destination of Shipments of Manufactures, 1984, Catalogue 31-530Occasional.
1990. Corporation Financial Statistics 1987, Ottawa, Minister of Supply andServices Canada, January.
1991. Census ofAgriculture, Catalogue 93-351.
1991. Gross Domestic Product by Industry (1986=100) 1961-1985, Catalogue 15-512Occasional, January.
1992a. Livestock Report, Catalogue 23-008 Quarterly, May.
1992b. Imports, Merchandise Trade, 1991, Catalogue 65-203 Annual, May.
1992c. Exports, Merchandise Trade, 1991, Catalogue 65-202 Annual, June.
1992d. Gross Domestic Product by Industry, June, 1992, Catalogue 15-001 Monthly,September.
1993a. Imports by Commodity, December 1992, Catalogue 65-007 Monthly, March.
1993b. Exports by Commodity, December 1992, Catalogue 65-004 Monthly, March.
1993c. Gross Domestic Product by Industry, February, 1993, Catalogue 15-001Monthly, May.
1993d. "Manufacturing Industries of Canada: National and Provincial Totals:Principal Statistics by Major Group and Industry 1991", Special Tabulation.
1993d. "MFP Indices 1961-1989: Gross-Output MFP-Dairy", Special Tabulation.
1994. "Survey of Manufactures 1992", Special Tabulation, May.
Sullivan, J.M. 1992. Co-operation in Canada 1990, Ottawa, Minister of Supply andServices Canada.
Veeman, Michele, M. 1987. "Marketing Boards: The Canadian Experience", AmericanJournal of Agricultural Economics, December 1987, pp. 992-1000.
52