better world.better dairy. dairy cooperative 100% canadian milk, the seal of quality canadian milk,...
TRANSCRIPT
AGROPUR COOPERATIVE
A N N U A L R E P O R T 2018
DA
IRY
CO
OP
ER
AT
IVE
Better Dairy.
Better World.
AGROPUR COOPERATIVE
A N N U A L R E P O R T 2018

AGROPUR COOPERATIVE
A N N U A L R E P O R T 2018
DA
IRY
CO
OP
ER
AT
IVE
2018
1938
For 80 years.
We are dedicated to achieving better dairy
and a better world. Our goal has not
changed since the day, 80 years ago, when
a group of far-sighted farmers who wanted to
take control of their own future founded Agropur:
to make a difference for our community.

Table ofcontentsIntroduction 2Message from the President 8Message from the CEO 10Board of Directors 12Senior Management Committee 14
Pillars
Brand Strategy 16Innovation 22Cost Leadership 26Human Capital 30National and InternationalDevelopment 34
Corporate Social Responsibility 38Financial Review 42Consolidated Financial Statements 52
1
Derny and Araya on their way home with Brie L’Extra, drinkable iÖGO nanö and Natrel 2% milk in the basket.

2IN
TR
OD
UC
TIO
N
Introduction

3IN
TR
OD
UC
TIO
N
For 80 years, Agropur has been building a better world. The 3,161 member dairy farmers who are the Cooperative’s owners are committed to offering consumers a unique experience, while caring about animal welfare
and the environment. To deliver that experi-ence, the Cooperative’s 8,800 employees strive with pride every day to make dairy products that meet the expectations of today’s consumers and those of the future.
In 1938, in the midst of the Great Depression,
87 Quebec farmers joined forces and
formed a cooperative in which they invested
all their savings and all their hopes. Agropur was born.
The C
oopera
tive
M
odel

3IN
TR
OD
UC
TIO
N
For 80 years, Agropur has been building a better world. The 3,161 member dairy farmers who are the Cooperative’s owners are committed to offering consumers a unique experience, while caring about animal welfare
and the environment. To deliver that experi-ence, the Cooperative’s 8,800 employees strive with pride every day to make dairy products that meet the expectations of today’s consumers and those of the future.

2IN
TR
OD
UC
TIO
N
Introduction The strength of the cooperative model
At a time when traditional economic models are being questioned, Agropur bears the standard of modern, ambitious cooperation high and proud. Even as its growth has accelerated in recent years, Agropur has stayed true to its core values and maintained the dynamism of its associative life. As our members put it, “We’re just as much a business as any other, but we’re not just a business like any other.”
“I’m happy to support a sustainable business model. Agropur is owned by its members, and I think the fact that they are engaged in the decision-making process is a guarantee of quality, performance and democracy. When I buy Agropur products, it’s partly to support their fair payment system, which enables dairy farmers to acquire the best tools to develop their businesses.”

Better Dairy. Better World.
Agropur, one of North America’s largest dairy processing cooperatives, is proud of its distinctive business model, one that lets it help share the wealth everywhere it operates.
FONTABEL FARM WEEDON, QC

5IN
TR
OD
UC
TIO
N
2
That cooperative model, rooted in solidarity, democracy and the sharing of resources, has served as a powerful vehicle for dairy farmer empowerment for 80 years.
For customers and consumers alike, the Agropur experience extends well beyond the product: buying an Agropur product means contributing to the local economy and making a difference in the community.
Two years ago, Agropur proudly became the first major processor in Canada to commit to displaying the blue cow certification-of-origin logo for 100% Canadian milk, the seal of quality Canadian milk, on all the dairy products sold under its own brands. It remains the only national processor to do so. Created by Dairy Farmers of Canada, the logo certifies that all of the milk and/or dairy ingredients used in the product are sourced in Canada.
Agropur also distributes annual patronage dividends to its members and contributes to the vitality of rural communities. In keeping with its values of mutual assistance, it allocates significant amounts to its donations and sponsorships program. And, as a socially responsible business, Agropur takes environmental, social and economic initiatives focused on the welfare of animals and communities.
During the past year, Agropur reaped the fruits of its efforts: 2018 was a banner year in terms of awards and distinctions. The leading American magazine Forbes ranked Agropur first in the agri-food industry on its list of Canada’s best employers. The Cooperative picked up 10 medals, including five gold, at the World Championship Cheese Contest, in Wisconsin, winning for best Camembert, best mozzarella, best smoked provolone, best shredded cheese and best feta in the world in a field of 3,400 products from 26 countries. At Quebec’s prestigious Mercuriades business awards, Agropur won in the Enterprise of the Year and Successful Business Strategy categories.
1
Maude starting her day at the crack of dawn.
2
In the freestall barn, Tailgate can move around as she pleases.

6IN
TR
OD
UC
TIO
N

7
2 3
4
1
Maxime and daughter Ariane.
2
Maude cleaning the gestation area.
3
With the robotic milking machine, the cow decides when she wants to be milked.
4
Ferme Fontabel’s new buildings on the right, with the old ones to the left.
INT
RO
DU
CT
ION
As these honours demonstrate, our transformative actions are earning recognition from our peers.
This year more than ever, the importance of planning and investing for the long term was evident. We pressed ahead with our business strategy, which revolves around our five pillars: brand strategy, innov ation, cost leadership, human capital, as well as national and international development.
We made very significant investments in infrastructure, notably at Lake Norden, South Dakota, laying the groundwork for our next organic growth phase.
As one of the top 20 largest dairy processors in the world and the one offering the most extensive line of dairy products in Canada, the Cooperative intends to remain a leading player that stands out by virtue of its values. At Agropur, we know that Better Dairy means a Better World.
8M
ES
SA
GE
FR
OM
TH
E P
RE
SID
EN
T
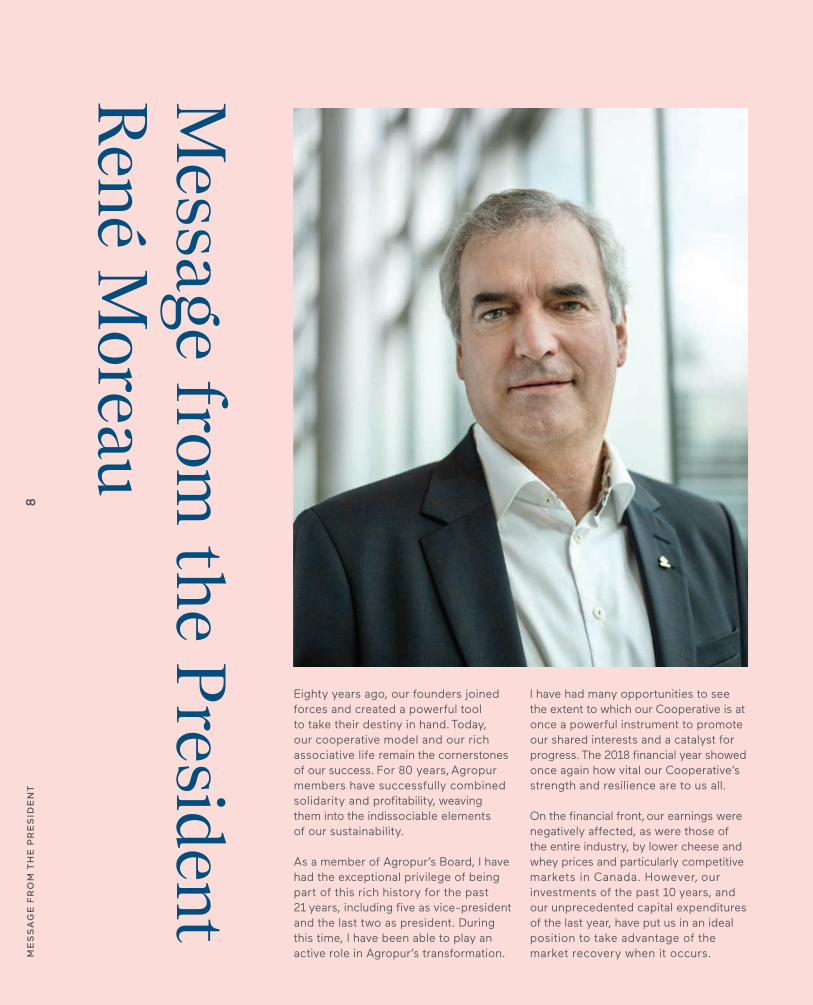
Eighty years ago, our founders joined forces and created a powerful tool to take their destiny in hand. Today, our cooperative model and our rich associative life remain the cornerstones of our success. For 80 years, Agropur members have successfully combined solidarity and profitability, weaving them into the indis sociable elements of our sustainability. As a member of Agropur’s Board, I have had the exceptional privilege of being part of this rich history for the past 21 years, including five as vice-president and the last two as president. During this time, I have been able to play an active role in Agropur’s transformation.
I have had many opportunities to see the extent to which our Cooperative is at once a powerful instrument to promote our shared interests and a catalyst for progress. The 2018 financial year showed once again how vital our Cooperative’s strength and resilience are to us all. On the financial front, our earnings were negatively affected, as were those of the entire industry, by lower cheese and whey prices and particularly competitive markets in Canada. However, our investments of the past 10 years, and our unprecedented capital expenditures of the last year, have put us in an ideal position to take advantage of the market recovery when it occurs.
Message from
the President René M
oreau

9M
ES
SA
GE
FR
OM
TH
E P
RE
SID
EN
T
On the trade front, Canada, the US and Mexico signed on November 30, 2018, the Canada–United-States–Mexico Agreement (CUSMA), which will replace NAFTA. Under the agreement, the Canadian government has sacrificed a piece of our supply-management system for the third time in just a few years. After the Canada-EU trade agreement and the Trans-Pacific Partnership, the Canadian dairy industry has been used as a bargaining chip in yet another round of international trade negotiations. On all three occasions, Canada’s concessions were described as minor, but once all the treaties have come into effect, those concessions will add up to 10% of the Canadian market. That is milk that will not be processed at our plants.
In addition to the market access, the CUSMA limits some of our dairy exports to other countries of the world, a dangerous precedent. Moreover, Canada agreed to eliminate Class 7, which is needed to ensure Canadian dairy processors a supply of milk ingredients at competitive prices, as well as to manage our structural surpluses of skim milk powder.
Against this background, it is all the more surprising that the government has granted a US multinational a licence to import into Canada, duty-free, a dairy product of which an equivalent is already available on the Canadian market, pending the completion of its plant in Ontario. This preferential treatment gives the multinational a significant advantage over the pro-cessors that are already established in Canada, even though Agropur is making much more substantial invest-ments—$153 million this year alone. And yet the federal government keeps repeating that it believes in supply management and will defend it. It must be said that there is a disconnect between words and deeds at the federal government. The inconsistency is creating considerable uncertainty and increasing the complexity of planning investments in our Canadian infrastructure. While financial compen-sation is necessary, what Canada’s dairy industry needs is more consistent
dairy policies and strategies that will, among other things, help the entire value chain adjust sustainably to the new market realities created by the recent series of concessions. There is an urgent need for representatives of the entire dairy industry to sit down with government officials at the same table and redefine Canada’s dairy policies and strategies along those lines. Agropur intends to be a key player in any such discussions. In light of the current situation, some of our decisions of recent years appear all the wiser. In 2016, we decided to offer Canadian products made with 100% Canadian milk. Agropur became the first major dairy processor to use the Dairy Farmers of Canada certification-of-origin logo on its product packaging. We did so to meet the needs of consumers, who want to be able to identify and buy local products.
In addition to where their food comes from, consumers want to know how it was produced, and particularly how the animals are treated. Therefore, we strongly encourage not only our members but all our milk suppliers to follow best practices with regard to animal welfare. In practical terms, we provide our members with training and support to help them meet the highest standards of care in the treatment of their herds. Our “Better Dairy. Better World.” signature states our reality, from one end of the supply chain to the other. Programs such as proAction® promote best practices on the farm and, most importantly, they help position Canadian milk in the eyes of consumers as milk of the highest standard that is among the best in the world. Given the current environment, supporting proAction® and animal welfare has never been more vital.
We are always privileged to be part of Agropur but never more so than in a challenging business environment such as the one we are facing now.We are the owners of a world-class Cooperative. It serves as a kind of insurance policy and stabilizes our incomes by absorbing most of the cyclical fluctuation in world markets.
We have amply demonstrated the value and robustness of our cooperative model. We are where we are today because those who came before us understood long ago that to secure our future and control our destiny, we had to grow.
I am counting on my colleagues and the next generation to continue our work. After all these years of active involvement in the Cooperative, I have decided to pass the torch and retire. As I take my leave of the Board and the president’s office, I would like to thank my fellow directors, past and present, and to pay tribute to the skills and dedication of our senior managers. In particular, I am very grateful to Robert Coallier, and I thank the 8,800 Agropur employees who pursue both the cooperative values and operational excellence.
I am confident that we have established winning strategies for our Cooperative’s future development. We must continue to grow and develop by investing in our facilities and systems, in product innovation, in cutting costs and promoting our brands.
In these uncertain times, being a member of Agropur is a tremendous privilege of which we can be proud and must preserve for future generations.
René MoreauPresident

10
ME
SS
AG
E F
RO
M T
HE
CE
O
Two related developments dominated the dairy industry landscape in 2018: a significant decrease in world whey prices and a drop in the cheese block price in the United States. Everywhere in the world, this phase in the industry’s economic cycle has led to narrower margins and lower operating income for processors. Agropur was no exception.
Nevertheless, we continued our progress, expanded our footprint in the US market for ingredients and industrial products, grew our share
of the Canadian consumer market and increased our operating efficiency. Our sales increased 4.7% year over year in fiscal 2018, or 5.5% at constant exchange rates. Our Canadian sales were up 11.7%, reflecting in part the inclusion of Ultima Foods and our growth in the cheese and fresh products segments. In the United States, our sales, expressed in US dollars, were down by only 2.4%, despite the decrease in cheese block prices and especially whey prices.
Message from
the CEO
Robert C
oallier

11
ME
SS
AG
E F
RO
M T
HE
CE
O
Our earnings picture can be summed up in three points:
1. The decrease in our EBITDA was essentially due to lower cheese and whey prices, which had a $109-million negative impact on the EBITDA of our US operations.
2. On the other hand, in Canada, EBITDA was stable year over year even though the aggressive competition continued exerting pressure on dairy prices. The addition of Ultima Foods and the full-year contribution from Scotsburn’s activities were positive factors, as were the growth in our market share and the shift in our sales towards a higher value-added product mix.
3. On both sides of the border, our cost-reduction program has been very successful. Three years ago, we set a $100-million target for annual cost savings by the end of 2018. We are at $117.9 million, of which $28.9 million was realized in 2018. We’re now targeting an additional $50 million in annual savings as of 2019.
We remain confident that the moves we have made in recent years will accelerate our growth going forward.
Projects in progress
There are other developments specific to Agropur that should help boost our sales and our earnings in 2019. Our market share continues to grow on both sides of the border. Our progress is being driven by innovative and effective marketing and, most importantly, the intrinsic quality of our products. This year, as in years past, the excellence of our products won wide recognition. At the World Championship Cheese Contest, our L’Extra Camembert was named the world’s Best Camembert and four of our made-in-USA cheeses took top honours. In Quebec, we won a Caseus award for our OKA L’Artisan.
During the year, we signed or renewed major contracts with a number of customers. Our vast national network enabled us to land these contracts and increase our market share from coast to coast, which should make a positive contribution to our results in 2019.
In the US, we are pressing ahead with the expansion of our cheese plant in Lake Norden, South Dakota, which will triple its capacity. It is the largest capital investment project in Agropur’s history. The plant will be commissioned in phases in the second quarter of 2019.
Between 2014 and 2018, we invested $1.3 billion in our facilities, 56% of it in Canada. After 80 years of existence,
innovation is more important than ever to Agropur’s sustainability. We scored major successes on this front in 2018. Canadian consumers ranked iÖGO PROTEINe the Product of the Year and OKA L’Artisan portion packs the Best New Product. We launched Inno Accel, North America’s first dairy business accelerator. An offshoot of the Inno Agropur program, Inno Accel matches Agropur’s knowledge and know-how with the dynamism of high-potential start-ups.
The first cohort of five start-ups from Canada and the US has graduated from Inno Accel. These young businesses are reinventing dairy with us in a brand-new co-working space at our head office.
I cannot leave unmentioned the fact that Agropur won two Mercure awards in 2018, for Successful Business Strategy and Enterprise of the Year in the large business category. The coveted Quebec business awards are recognition of the invaluable and unstinting work of everyone at Agropur.
I thank the members of the Board and particularly our president, René Moreau. And I thank all Agropur members: their support and solidarity are the basis of the Cooperative’s success and sustainability.
In conclusion, I would like to salute the entire management team and all Agropur employees for their outstanding work. Day after day, they translate our strategy into reality and into successes on the ground.
Robert CoallierCEO

12
Board of Directors
1
Alain ForgetLaurentides–Lanaudière 2014
2
Michel BoisvertMontérégie 2017
3
Jeannie van DykVice-PresidentAtlantic 2013
4
René Moreau President Nicolet–Bois-Francs 1998
5
Roger MassicotteVice-PresidentMauricie–Portneuf 2003
6
Jean-Pierre Lacombe First Member of the ExecutiveSalaberry–Richelieu 2007
7
Valère Lieutenant Third Member of the Executive Estrie–Granby 2012
8
Michel Couture Second Member of the ExecutiveChaudière-Appalaches 2001
9
Céline Delhaes Presented and elected by universal suffrage 2011
10
Claude Cressier Érable–Seigneuries 2015
11
Suzanne Blanchet Guest member of the Board 2015
12
Ralph Ballam Guest member of the Board 2013
13
Jim Walker Guest member of the Board 2014
14
Stéphanie Benoit Presented and elected by universal suffrage 2015
15
Roger Beaulieu Eastern Quebec 2014
BO
AR
D O
F D
IRE
CT
OR
S

13
1 / 2
3 / 4 / 5 6 / 7 / 8
9 / 10
11 / 12 / 13
14 / 15
BO
AR
D O
F D
IRE
CT
OR
S

14
1 2 3
4 / 5 6
SE
NIO
R M
AN
AG
EM
EN
T C
OM
MIT
TE
E
1
Pierre Corriveau Senior Vice-President, Human Capital
2
Marie-France VeilleuxVice-President, Cooperation and Governance
3
Lorraine Bédard Outgoing Senior Vice-President, Legal Affairs, Member Relationsand Corporate Secretary
4
Émile Cordeau Senior Vice-President and Chief Financial Officer
5
Robert Coallier Chief Executive Officer
6
Dominique Benoit Senior Vice-President, Institutional Affairs and Communications
Senior Management Committee

15
7 / 8 9
10 11 / 12 13
SE
NIO
R M
AN
AG
EM
EN
T C
OM
MIT
TE
E
7
Nicolas Marie Senior Vice-President and General Manager, Ice Cream
8
Simon Olivier Senior Vice-President, Strategy and Innovation
9
Benoît Zolnaï Senior Vice-President, Operational Excellence and Quality
10
Serge Fortier Senior Vice-President, Information Technology
11
Michael Aucoin President, Canada Operations
12
Doug Simon President, US Operations
13
Christine ForgetVice-President, Global Strategic Sourcing

16
Brand StrategyP
ILL
AR
B
RA
ND
ST
RA
TE
GY

17
Our brands continued to grow, picking up market share during the year. In Canada, we performed well and our strong brands were boosted by our close relationship
with consumers. In the US, we continued developing the Agropur brand and completed the integration of Davisco’s operations, which we acquired in 2014.
PIL
LA
R
BR
AN
D S
TR
AT
EG
Y

18
PIL
LA
R
BR
AN
D S
TR
AT
EG
Y
19
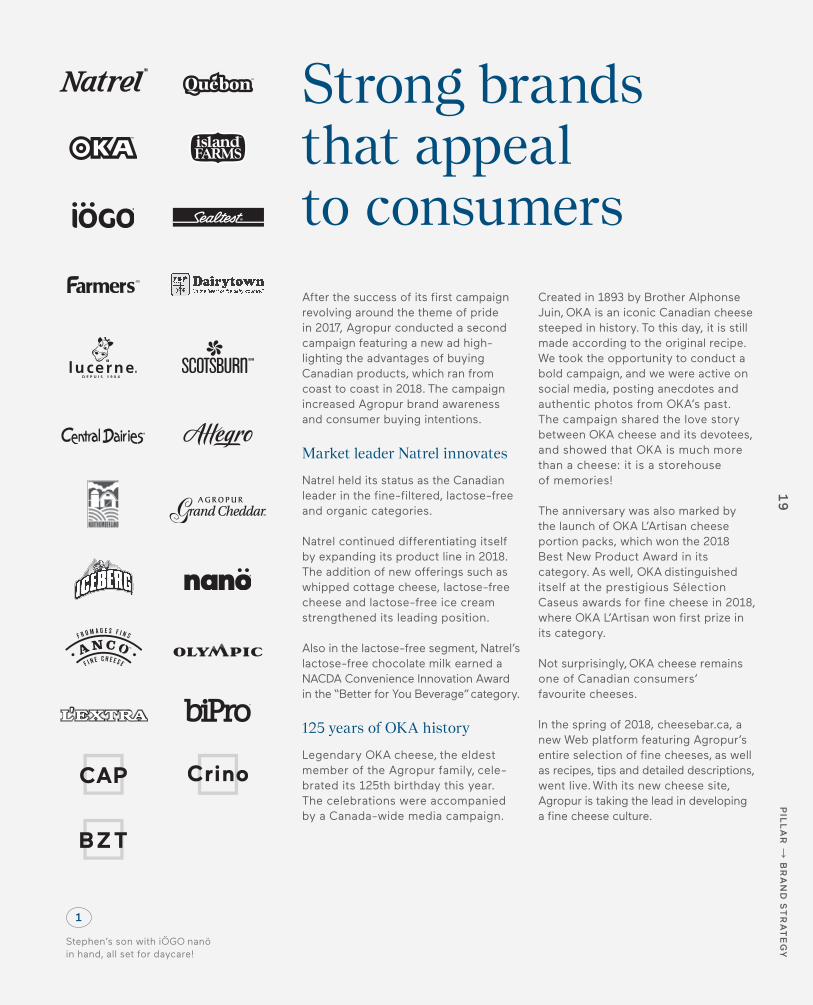
Strong brands that appeal to consumersAfter the success of its first campaign revolving around the theme of pride in 2017, Agropur conducted a second campaign featuring a new ad high-lighting the advantages of buying Canadian products, which ran from coast to coast in 2018. The campaign increased Agropur brand awareness and consumer buying intentions.
Market leader Natrel innovates
Natrel held its status as the Canadian leader in the fine-filtered, lactose-free and organic categories. Natrel continued differentiating itself by expanding its product line in 2018. The addition of new offerings such as whipped cottage cheese, lactose-free cheese and lactose-free ice cream strengthened its leading position. Also in the lactose-free segment, Natrel’s lactose-free chocolate milk earned a NACDA Convenience Innovation Award in the “Better for You Beverage” category.
125 years of OKA history
Legendary OKA cheese, the eldest member of the Agropur family, cele-brated its 125th birthday this year. The celebrations were accompanied by a Canada-wide media campaign.
Created in 1893 by Brother Alphonse Juin, OKA is an iconic Canadian cheese steeped in history. To this day, it is still made according to the original recipe. We took the opportunity to conduct a bold campaign, and we were active on social media, posting anecdotes and authentic photos from OKA’s past. The campaign shared the love story between OKA cheese and its devotees, and showed that OKA is much more than a cheese: it is a storehouse of memories! The anniversary was also marked by the launch of OKA L’Artisan cheese portion packs, which won the 2018 Best New Product Award in its category. As well, OKA distinguished itself at the prestigious Sélection Caseus awards for fine cheese in 2018, where OKA L’Artisan won first prize in its category.
Not surprisingly, OKA cheese remains one of Canadian consumers’ favourite cheeses.
In the spring of 2018, cheesebar.ca, a new Web platform featuring Agropur’s entire selection of fine cheeses, as well as recipes, tips and detailed descriptions, went live. With its new cheese site, Agropur is taking the lead in developing a fine cheese culture.
PIL
LA
R
BR
AN
D S
TR
AT
EG
Y
1
Stephen’s son with iÖGO nanö in hand, all set for daycare!
20
1
2
IÖGO, the preferred brand of millennials
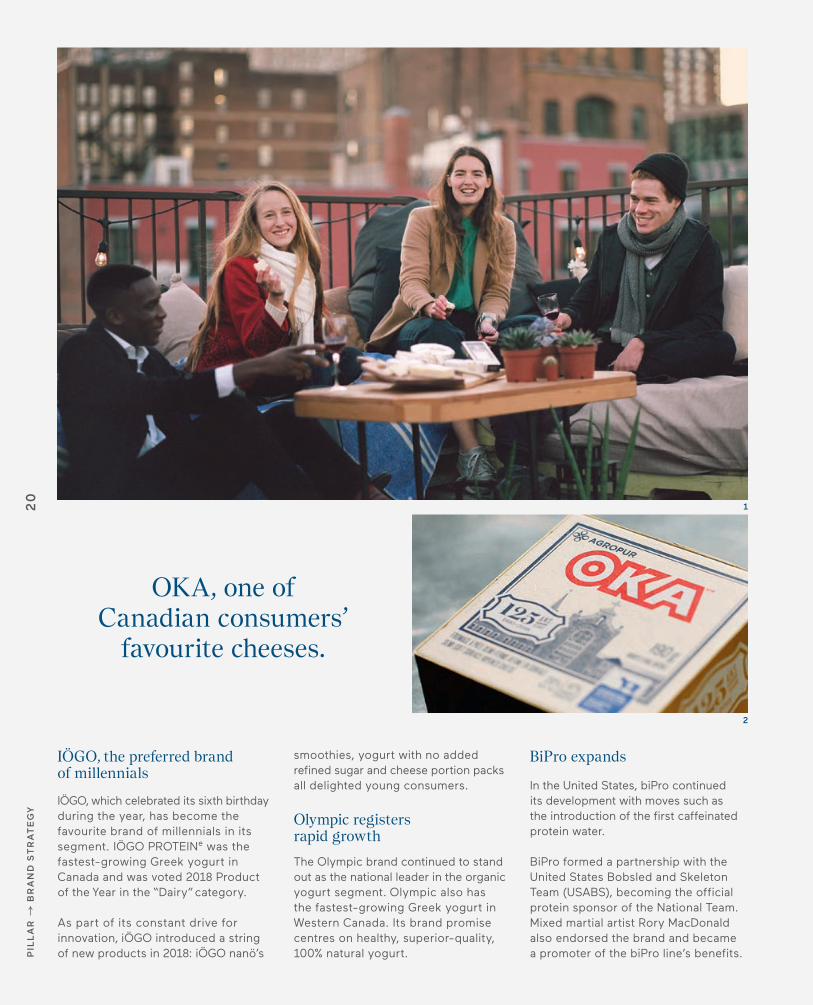
IÖGO, which celebrated its sixth birthday during the year, has become the favourite brand of millennials in its segment. IÖGO PROTEINe was the fastest-growing Greek yogurt in Canada and was voted 2018 Product of the Year in the “Dairy” category.
As part of its constant drive for innovation, iÖGO introduced a string of new products in 2018: iÖGO nanö’s
smoothies, yogurt with no added refined sugar and cheese portion packs all delighted young consumers.
Olympic registers rapid growthThe Olympic brand continued to stand out as the national leader in the organic yogurt segment. Olympic also has the fastest-growing Greek yogurt in Western Canada. Its brand promise centres on healthy, superior-quality, 100% natural yogurt.
BiPro expands
In the United States, biPro continued its development with moves such as the introduction of the first caffeinated protein water.
BiPro formed a partnership with the United States Bobsled and Skeleton Team (USABS), becoming the official protein sponsor of the National Team. Mixed martial artist Rory MacDonald also endorsed the brand and became a promoter of the biPro line’s benefits.
OKA, one of Canadian consumers’
favourite cheeses.
PIL
LA
R
BR
AN
D S
TR
AT
EG
Y

21
3
The biPro brand, already well known in the US, is now available in Canada, where it is supported by athletes Mikaël Kingsbury and Benoît Huot, its Canadian ambassadors. The brand’s popularity is increasing on Amazon, a new platform for Agropur.
Agropur strengthens its presence in the USWhile Agropur’s brands already have a firmly established reputation in Canada, its marketing teams are raising the
Cooperative’s profile with American customers. To this end, the Agropur logo has been added to the packaging of all ingredients sold internationally.
Following the Cooperative’s recent acquisitions, the research and develop-ment teams have been consolidated and are spearheading the development of new products.
1
Wine and cheese with friends on the deck, always a treat when the cheese is Agropur Grand Cheddar.
2
The legendary OKA cheese celebratedits 125th birthday this year.
3
Skateboarders burn up a lot of energy! Derny and Charles always pack biPro protein water to quench their thirst and restore their strength.
PIL
LA
R
BR
AN
D S
TR
AT
EG
Y
22
PIL
LA
R
IN
NO
VA
TIO
N
Innovation

23
PIL
LA
R
INN
OV
AT
ION
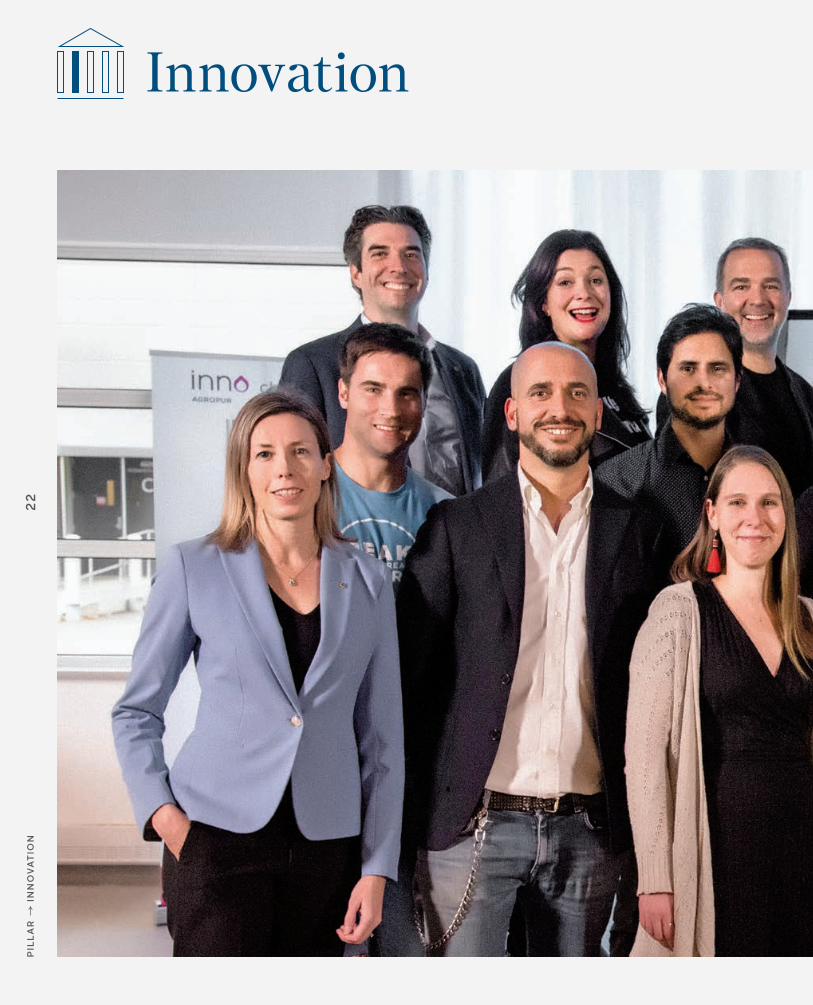
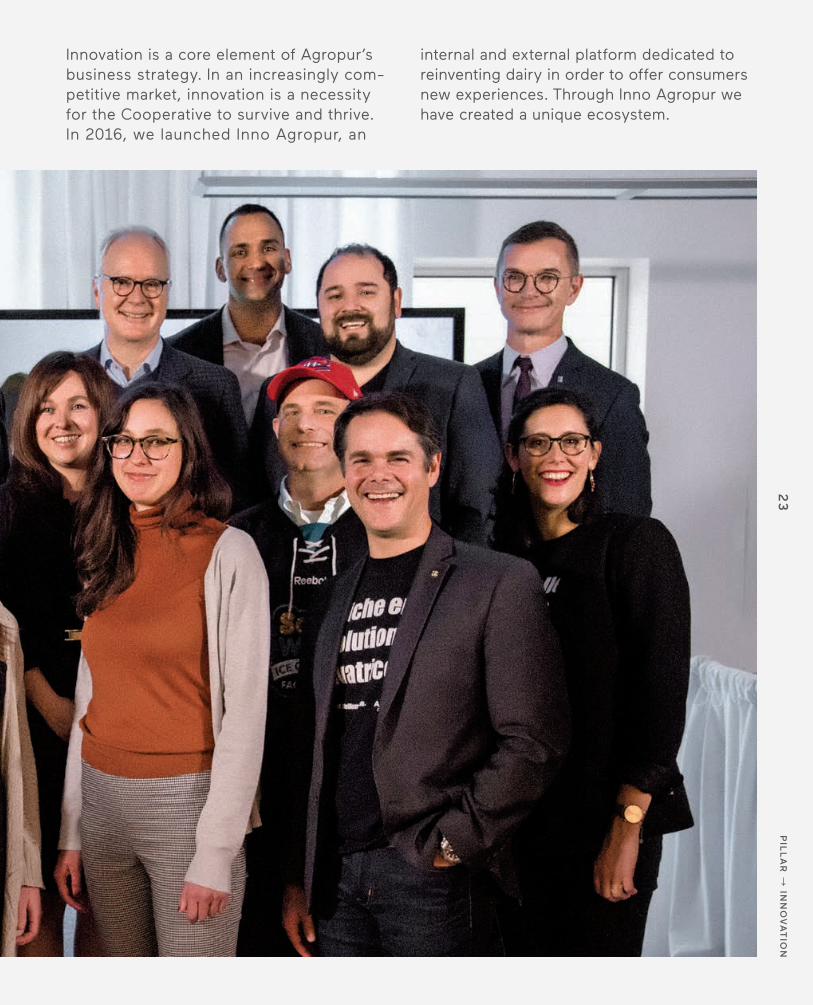
Innovation is a core element of Agropur’s business strategy. In an increasingly com-petitive market, innovation is a necessity for the Cooperative to survive and thrive. In 2016, we launched Inno Agropur, an
internal and external platform dedicated to reinventing dairy in order to offer consumers new experiences. Through Inno Agropur we have created a unique ecosystem.
Innovation is key to Agropur’s future. The Cooperative has
therefore created Inno Agropur, an
innovation process designed to reinvent
dairy products.
Innova
tion
23
PIL
LA
R
INN
OV
AT
ION
Innovation is a core element of Agropur’s business strategy. In an increasingly com-petitive market, innovation is a necessity for the Cooperative to survive and thrive. In 2016, we launched Inno Agropur, an
internal and external platform dedicated to reinventing dairy in order to offer consumers new experiences. Through Inno Agropur we have created a unique ecosystem.
22
PIL
LA
R
IN
NO
VA
TIO
N
Innovation Ideas that are changing the world
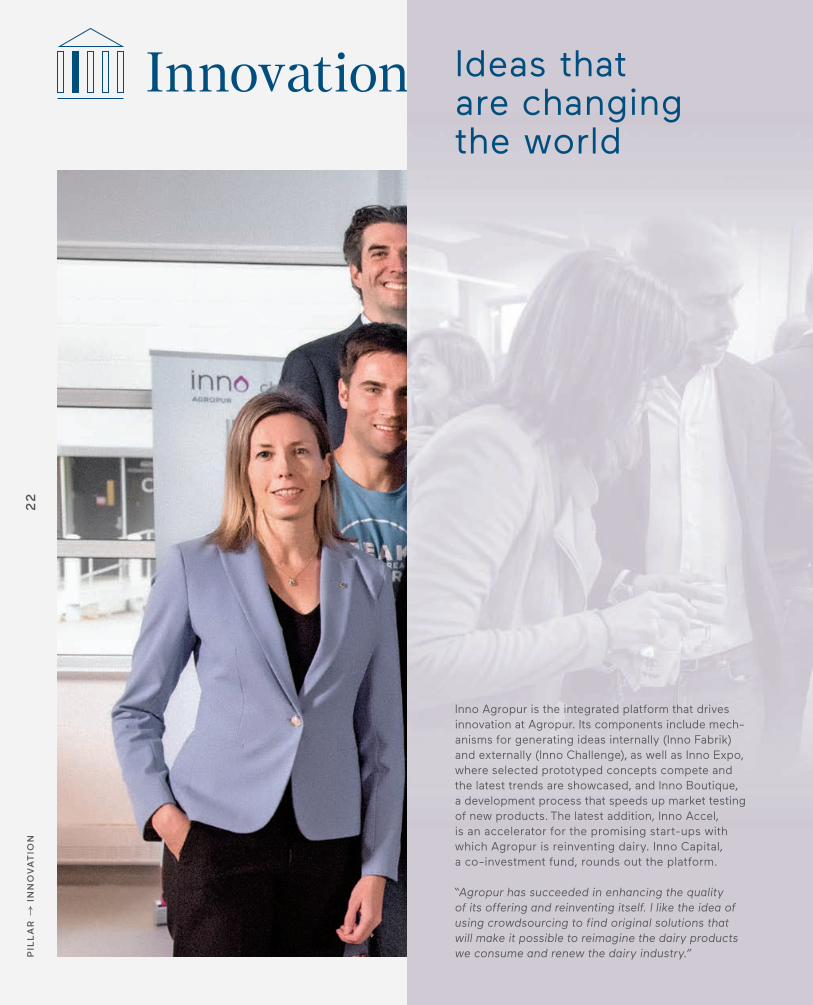
Inno Agropur is the integrated platform that drives innovation at Agropur. Its components include mech-anisms for generating ideas internally (Inno Fabrik) and externally (Inno Challenge), as well as Inno Expo, where selected prototyped concepts compete and the latest trends are showcased, and Inno Boutique, a development process that speeds up market testing of new products. The latest addition, Inno Accel, is an accelerator for the promising start-ups with which Agropur is reinventing dairy. Inno Capital, a co-investment fund, rounds out the platform.
“Agropur has succeeded in enhancing the quality of its offering and reinventing itself. I like the idea of using crowdsourcing to find original solutions that will make it possible to reimagine the dairy products we consume and renew the dairy industry.”

24
PIL
LA
R
IN
NO
VA
TIO
N
25
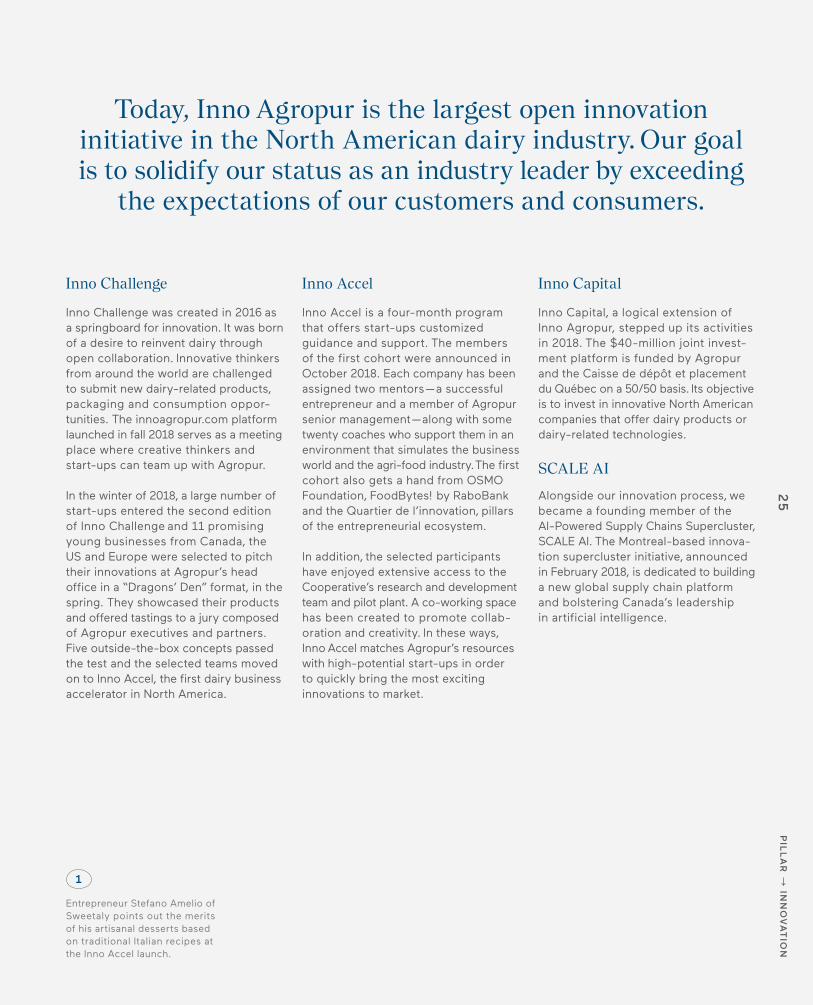
Inno Challenge
Inno Challenge was created in 2016 as a springboard for innovation. It was born of a desire to reinvent dairy through open collaboration. Innovative thinkers from around the world are challenged to submit new dairy-related products, packaging and consumption oppor-tunities. The innoagropur.com platform launched in fall 2018 serves as a meeting place where creative thinkers and start-ups can team up with Agropur. In the winter of 2018, a large number of start-ups entered the second edition of Inno Challenge and 11 promising young businesses from Canada, the US and Europe were selected to pitch their innovations at Agropur’s head office in a “Dragons’ Den” format, in the spring. They showcased their products and offered tastings to a jury composed of Agropur executives and partners. Five outside-the-box concepts passed the test and the selected teams moved on to Inno Accel, the first dairy business accelerator in North America.
Inno Accel
Inno Accel is a four-month program that offers start-ups customized guidance and support. The members of the first cohort were announced in October 2018. Each company has been assigned two mentors — a successful entrepreneur and a member of Agropur senior management — along with some twenty coaches who support them in an environment that simulates the business world and the agri-food industry. The first cohort also gets a hand from OSMO Foundation, FoodBytes! by RaboBank and the Quartier de l’innovation, pillars of the entrepreneurial ecosystem. In addition, the selected participants have enjoyed extensive access to the Cooperative’s research and development team and pilot plant. A co-working space has been created to promote collab-oration and creativity. In these ways, Inno Accel matches Agropur’s resources with high- potential start-ups in order to quickly bring the most exciting innovations to market.
Inno Capital
Inno Capital, a logical extension of Inno Agropur, stepped up its activities in 2018. The $40-million joint invest-ment platform is funded by Agropur and the Caisse de dépôt et placement du Québec on a 50/50 basis. Its objective is to invest in innovative North American companies that offer dairy products or dairy-related technologies.
SCALE AI
Alongside our innovation process, we became a founding member of the AI-Powered Supply Chains Supercluster, SCALE AI. The Montreal-based innova-tion supercluster initiative, announced in February 2018, is dedicated to building a new global supply chain platform and bolstering Canada’s leadership in artificial intelligence.
Today, Inno Agropur is the largest open innovation initiative in the North American dairy industry. Our goal is to solidify our status as an industry leader by exceeding
the expectations of our customers and consumers.
PIL
LA
R
INN
OV
AT
ION
1
Entrepreneur Stefano Amelio of Sweetaly points out the merits of his artisanal desserts based on traditional Italian recipes at the Inno Accel launch.

26
PIL
LA
R
CO
ST
LE
AD
ER
SH
IP
Cost Leadership
27
PIL
LA
R
CO
ST
LE
AD
ER
SH
IP
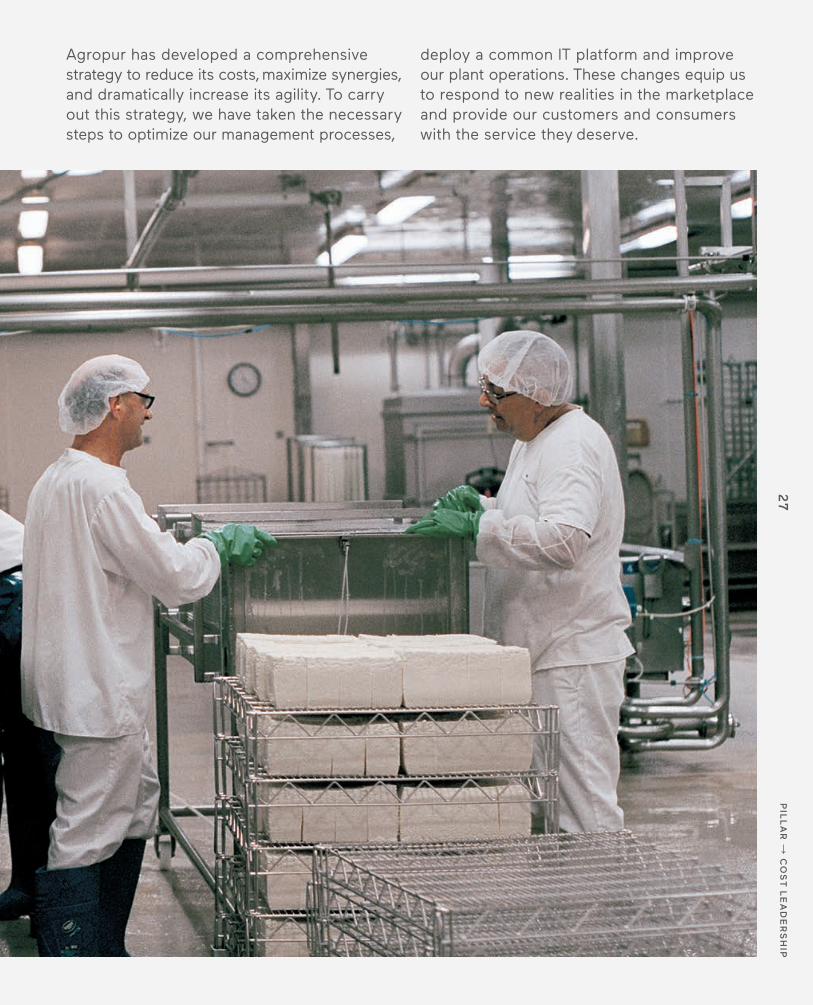
Agropur has developed a comprehensive strategy to reduce its costs, maximize synergies, and dramatically increase its agility. To carry out this strategy, we have taken the necessary steps to optimize our management processes,
deploy a common IT platform and improve our plant operations. These changes equip us to respond to new realities in the marketplace and provide our customers and consumers with the service they deserve.

28
Ever aware of the importance of effi-ciency, Agropur has continued its efforts to reduce costs. In 2016, we set a three-year, $100 million cost-reduction target. After three years, we have not only achieved this objective but exceeded it by a wide margin. In total, the orga-nization has reduced its costs by more than $200 million since 2013. We have no plans, however, to relax our efforts. Starting in the next fiscal year, we plan to cut an additional $50 million from our cost structure annually.
To manage its entire supply chain in Canada more effectively, Agropur created a new position, Vice-President, Supply Chain, in summer 2018. The person appointed to this position is responsible for the logistics, distribution, customer service, and operations planning depart-ments. Capturing synergies and best business practices will enable these departments to make Agropur a business partner of choice for its customers.
Optimizing management processes In 2013, Agropur began implementing an Enterprise Resource Planning (ERP) system to manage the vast majority of its operational processes on a single IT platform. The rollout of phase 2, which covered processes from order-taking to depositing payments at some Fresh Products operations, has been completed and deployment at many Agropur sites in Canada is under way. Among other things, implementation of the platform will give Agropur harmon-ized processes and a single database, supporting improved information sharing and better cost management.
Reducing costsP
ILL
AR
C
OS
T L
EA
DE
RS
HIP
1
Agropur 75 ash-ripened cheese, aged at least 110 days, in the ripening room.
Increasing agility exponentially
Plant automation has also improved the efficiency of many operations, such as the packaging and boxing operations at the plant in Saint-Hyacinthe, Quebec.
In fall 2018, Agropur decided to review all of its in-plant practices with the introduction of the Agropur Operating System, which will gradually replace the Evolution program as the organization’s operational-excellence system.
From 2014 to 2018, the Evolution program enabled Agropur to increase its productivity, reduce its costs and improve its quality indicators. The dynamic approach that the new Agropur Operating System demands will let us go even further, enabling employees to take ownership of the workplace and enriching their tasks. This integrated system for managing operations will help provide employees with knowledge and tools to facilitate decision-making and problem-solving in real time, and will also promote the empowerment of every employee in the plant.
2017
Three-year target
2018
2016
100M
118M
48M
41M
THREE-YEAR COST-REDUCTION TARGETIn millions of dollars
29M

29
PIL
LA
R
CO
ST
LE
AD
ER
SH
IP

30
PIL
LA
R
HU
MA
N C
AP
ITA
L
Human Capital

31
PIL
LA
R
HU
MA
N C
AP
ITA
L
Agropur’s 8,800 employees play a primary role in pursuing the organization’s objectives. Our employees are united and committed to
achieving a common goal: manufacturing top-quality dairy products and building the Cooperative.

32
Our human capital management practices are tailored to a bustling labour market and reflect the changes wrought by the arrival of new generations of employees who demand specific recruitment, training and job enrichment measures.
Skills development and grooming the next generation
The VisionR program helps high-potential employees achieve their professional development objectives by giving them access to a leadership program and the support of a mentor. Since it was implemented at Agropur, VisionR has made it possible to entrust participants with more responsibility and has increased retention of our best talent.
The LeadR team management training program, which is being introduced in Canada and the US, helps managers develop their organizational, problem- solving, communication and team leadership skills.
Agropur also places a strong emphasis on succession management. Our Future Leaders program prepares recent graduates for careers with Agropur in the United States, and we have a robust internship program that brings talented young people into Agropur workplaces.
Recruiting the best talent
The increasingly competitive market and the labour shortage are forcing us to use innovative methods to attract the best candidates. In September 2018, we launched a far-reaching recruitment campaign in Canada and the United States based on a new employer brand and revolving around our employees, who serve as Agropur’s ambassadors. The campaign highlights the benefits
of working at Agropur, as defined and proudly articulated by the employees themselves. It will continue in 2019, internally and externally.
Enriching employees’ jobs and working environment Over the past year, Agropur has auto-mated tasks that are repetitive and pose higher risks of injury. This approach helps enrich employees’ work.
In addition, the plant environment has been improved and standardized, while Agropur’s new LEED silver-certified head office building provides an outstandingly healthy and stimulating work environment. With its 80 formal and informal meeting places, it enables employees to translate the Cooperative’s five values—boldness, communication, integrity, excellence and collaboration—into reality on a daily basis.
Making employees’ daily lives easierOver the past year, Agropur continued implementing a new state-of-the-art IT system (Workday and Kronos) that brings human capital management tools together on one platform and introduces a new approach to managing human capital/payroll.
A major milestone in the revamp of our approach to human capital/payroll management was also reached in spring 2018 with the creation of the
Employee Service Centre, a single point of contact for employees who need help with requests or questions about human capital or payroll.
Health and safety
At each of our sites, we have a joint occupational health and safety commit-tee, which serves to target and prioritize the improvement opportunities that are most important in the eyes of the people who do the work.
New governance structure
Agropur also introduced category leadership (ice cream, cheese, fine cheese, fresh products and yogurt) at Canada Operations. The new manage-ment structure leverages each team’s know-how more effectively and maintains alignment with corporate objectives.
PIL
LA
R
HU
MA
N C
AP
ITA
L
In September 2018, Agropur launched a far-reaching recruitment campaign in Canada and the United States.
Our employees
33
1
2
3
PIL
LA
R
HU
MA
N C
AP
ITA
L
1
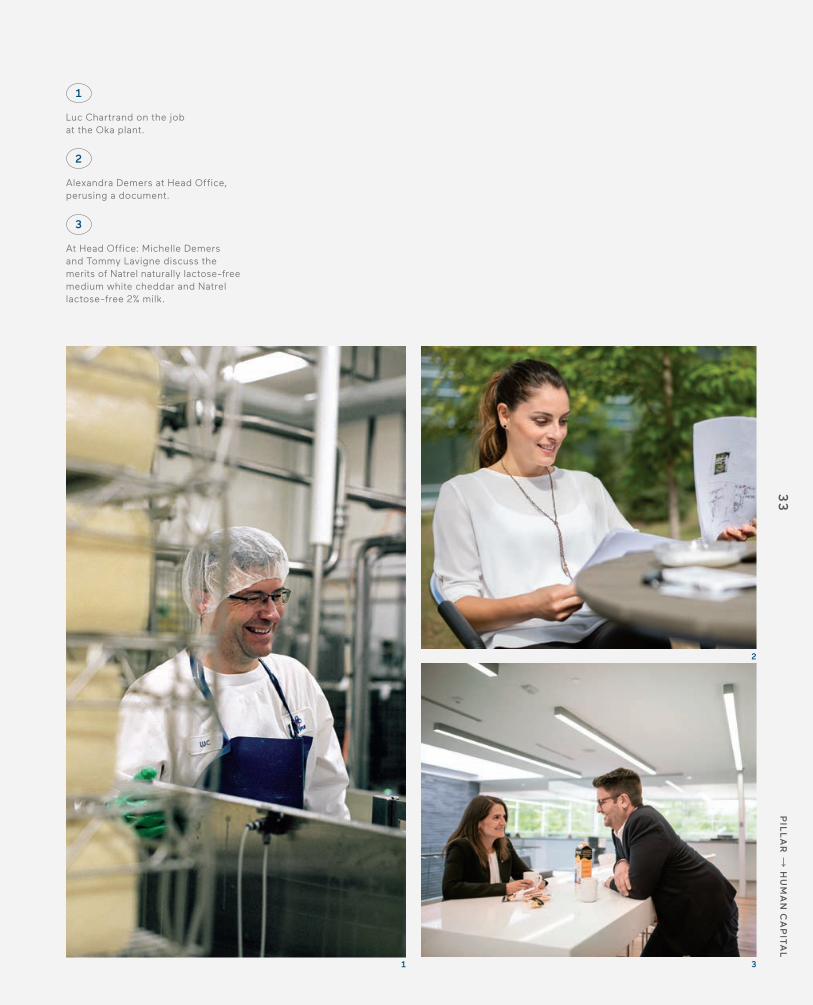
Luc Chartrand on the job at the Oka plant.
2
Alexandra Demers at Head Office, perusing a document.
3
At Head Office: Michelle Demers and Tommy Lavigne discuss the merits of Natrel naturally lactose-free medium white cheddar and Natrel lactose-free 2% milk.

34
PIL
LA
R
NA
TIO
NA
L A
ND
IN
TE
RN
AT
ION
AL
DE
VE
LO
PM
EN
T
National andInternational Development

35
National andInternational Development
PIL
LA
R
NA
TIO
NA
L A
ND
INT
ER
NA
TIO
NA
L D
EV
EL
OP
ME
NT
Complex market conditions, changing consumer habits and the shifting social and demographic landscape have prompted Agropur to accelerate its development. Over the past five years, the entire industry
has picked up the pace of its investments, but Agropur has been a leader in this regard with capital expenditures totalling $733 million in Canada and $565 million in the United States.
“The Cooperative knows no borders,” said the founders of
Agropur. Their modern, ambitious dream lives on today, thanks to the
members and employees who continue working
to realize it.
80
year
s

35
National andInternational Development
PIL
LA
R
NA
TIO
NA
L A
ND
INT
ER
NA
TIO
NA
L D
EV
EL
OP
ME
NT
Complex market conditions, changing consumer habits and the shifting social and demographic landscape have prompted Agropur to accelerate its development. Over the past five years, the entire industry
has picked up the pace of its investments, but Agropur has been a leader in this regard with capital expenditures totalling $733 million in Canada and $565 million in the United States.
34
PIL
LA
R
NA
TIO
NA
L A
ND
IN
TE
RN
AT
ION
AL
DE
VE
LO
PM
EN
T
National andInternational Development
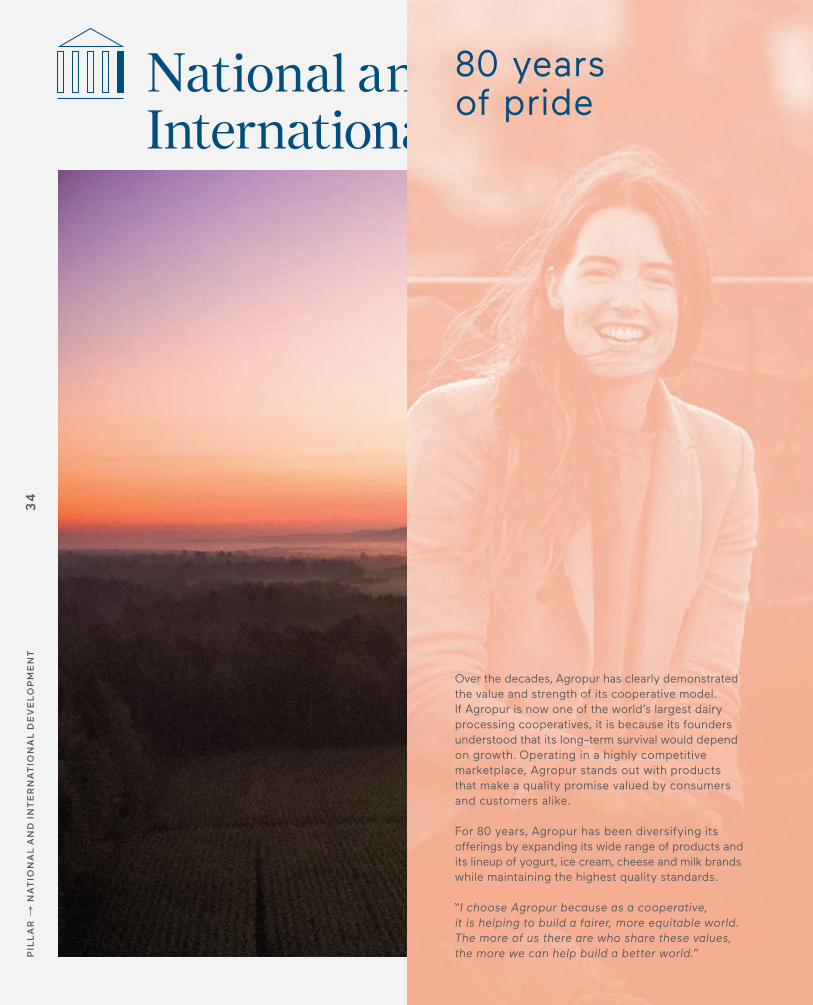
80 years of pride
Over the decades, Agropur has clearly demonstrated the value and strength of its cooperative model. If Agropur is now one of the world’s largest dairy processing cooperatives, it is because its founders understood that its long-term survival would depend on growth. Operating in a highly competitive marketplace, Agropur stands out with products that make a quality promise valued by consumers and customers alike.
For 80 years, Agropur has been diversifying its offerings by expanding its wide range of products and its lineup of yogurt, ice cream, cheese and milk brands while maintaining the highest quality standards.
“I choose Agropur because as a cooperative, it is helping to build a fairer, more equitable world. The more of us there are who share these values, the more we can help build a better world.”

36
19781968195819481938
Tripling the Lake Norden plant’s capacity
Agropur has invested 255 million USD in the expansion of its plant in Lake Norden, South Dakota, in the heart of a fast-growing dairy region. The project that began in fall 2017 will make Lake Norden Agropur’s largest plant and support faster development in the United States.
Currently, the plant makes mozzarella, provolone, Parmesan and cheddar
cheeses. The expansion will triple its daily processing capacity to over 9 million pounds of milk, enabling it to produce nearly 1 million pounds of cheese and 540,000 pounds of whey powder per day. The project is expected to create more than 100 new jobs.
This investment consolidates Agropur’s position as a key player in South Dakota. The expansion project proceeded on schedule in 2018 and commissioning is planned for the second quarter of 2019.
Meeting the demand for protein drinks
As the aseptic dairy beverage industry continues to grow, Agropur’s Grand Rapids, Michigan plant pressed ahead with initiatives to provide the production capacity to meet its customers’ needs. An investment of over 22 million USD will expand the overall capacity of the aseptic lines.
Adding new equipment and automating certain tasks will increase their capacity P
ILL
AR
N
AT
ION
AL
AN
D I
NT
ER
NA
TIO
NA
L D
EV
EL
OP
ME
NT
Strong growthSince its founding in 1938, Agropur has completed more than 145 mergers and acquisitions.
328M61M4.2M52K 17M

37
1988 2008 20181998
PIL
LA
R
NA
TIO
NA
L A
ND
INT
ER
NA
TIO
NA
L D
EV
EL
OP
ME
NT
by 144%, making it possible to increase contract manufacturing of high-protein dairy-based beverages, an increasingly popular category with consumers.
Capital expenditures in Canada
In Canada, despite the signing of international trade agreements that increase uncertainty and make long-term planning of investments in Agropur’s Canadian infrastructure more complex, Agropur invested close to $153 million over the past year.
Ultima Foods
Agropur acquired all of the shares of Ultima Foods Inc. at the start of the fiscal year.
Like the acquisition of Scotsburn, the acquisition of Ultima Foods has helped increase Agropur’s sales in Canada. With this acquisition, Agropur has become the dairy processor with the largest product line in Canada and the only major yogurt maker that is Canadian-owned.
SALES
1,445M
796M
2,824M
6,714M

38
CO
RP
OR
AT
E S
OC
IAL
RE
SP
ON
SIB
ILIT
Y
Corporate SocialResponsibility

39
At Agropur, we always strive to manufacture dairy products in a way that is consistent with the values of our customers and consumers. Consumers are more demanding when it comes to accountability: they are especially
concerned about the production and manu-facturing process, the product’s impact, and the experience associated with it. They want businesses to be held to account.
CO
RP
OR
AT
E S
OC
IAL
RE
SP
ON
SIB
ILIT
Y
Agropur is committed to offering high-quality
dairy products made in an environmentally
responsible manner using top-grade milk
from well-treated animals at all times.
Anim
al W
elfar
e a
nd
Envi
ronm
ent

39
At Agropur, we always strive to manufacture dairy products in a way that is consistent with the values of our customers and consumers. Consumers are more demanding when it comes to accountability: they are especially
concerned about the production and manu-facturing process, the product’s impact, and the experience associated with it. They want businesses to be held to account.
CO
RP
OR
AT
E S
OC
IAL
RE
SP
ON
SIB
ILIT
Y

38
CO
RP
OR
AT
E S
OC
IAL
RE
SP
ON
SIB
ILIT
Y
Corporate SocialResponsibility
A responsible cooperative
Respect for animals has always been a fundamental value of the dairy farmers who are our members. Agropur and its members know that a prosperous, viable dairy industry depends on the care and attention every animal receives. That is why the Cooperative has produced a Statement on Animal Welfare and promotes it to its members.
As regards the environment, Agropur applies best practices and is taking a series of initiatives, including steps to reduce its greenhouse gas emissions, manage its water consumption and ensure that its waste materials are reused.
This year, Agropur published a full Corporate Social Responsibility Report that describes everything it does to achieve its vision: “Better Dairy. Better World.”
“Animal welfare and product quality go hand in hand. I am convinced that it’s a cause-and-effect relationship: a well-treated cow gives high-quality milk.”

40
1
Agropur’s approach to corporate social responsibility encompasses five areas, based on best practices and agri-food industry trends.
Products
Our promise to our customers and consumers is that we will offer quality products that meet the highest food safety and compliance standards.
In 2017, we launched a comprehensive supplier-quality program to ensure the traceability and conformity of the packaging, ingredients, dairy compon-ents and products that we buy from our 565 suppliers and thus extend our own commitment to excellence to the companies with which we do business. In 2018, we further optimized supplier quality management through improved access to information, enhanced traceability (including packaging and ingredients) and effective performance monitoring.
To maintain the highest production standards directly on the farm, the Agropur Club of Excellence recognizes the members who provide the
In 2018, Agropur published its first
full social corporate responsibility
report, which bears witness to our social,
economic and environmental commitments.
It describes Agropur’s main initiatives to help
build a better world.
CO
RP
OR
AT
E S
OC
IAL
RE
SP
ON
SIB
ILIT
Y
best-quality milk. This year, the Jolipré Holstein Inc. dairy farm in Saint-Moïse, Quebec, received the top award for the second year in a row.
Members
Our Cooperative’s democratic life is sustained by its 3,161 members. In 2018, more than 95 meetings, courses and training sessions nourished our associative life. Those gatherings provide members with an opportunity to exchange ideas and discuss Agropur’s priorities with the management team.
The Cooperative is also an important support network for its members. A team of Cooperative Advisors assists members at every stage of the milk production process, from milking to storage. Since 2018, the Cooperative Advisors have acquired extensive expertise in animal welfare, and they are now ready to help members achieve their goals and meet the proAction® program’s requirements. The 11th edition of the Young Cooperative Leaders Program introduced 17 young people to the Cooperative’s democratic life.

41
2
CO
RP
OR
AT
E S
OC
IAL
RE
SP
ON
SIB
ILIT
Y
Human Capital
Agropur’s team of 8,800 employees in Canada and the US work day by day to grow the business. Our organ-izational structure and human resource management practices must support our ambitions. We have therefore embarked on a major effort to improve our practices, become more agile and capture internal synergies.
On the health and safety front, implementation of a prevention program based on safe behaviours continued. Each plant has developed action plans and tools to promote a zero tolerance approach to industrial accidents.
In the vast majority of jurisdictions where we operate, our workers’ com-pensation premiums are lower than the industry average, an indication of our forward stance on health and safety.
Environment
We are making wide-ranging efforts to reduce the environmental impact of our activities and we are transparent
about our initiatives. During the year, we continued tracking our greenhouse gas emissions, from processing plant to transport truck. Our carbon inventory, prepared by a third party, showed a 1.3% reduction in our emissions per litre of milk between 2016 and 2017.
We are also making efforts with respect to water consumption, optimization of packaging, waste management and our buildings’ energy consumption.
Community
By virtue of its cooperative nature, Agropur has close ties to the com-munities in which it operates. Through our member farmers and our plants, our activities strengthen the social and economic fabric of communities across North America. In fiscal 2018, more than $65.2 million was distributed in patronage dividends, supporting the communities where our members live.
We also support organizations that work for the common good. In 2018, we provided more than $1.5 million in donations and sponsorships.
Agropur provides financial assistance to the Breakfast Club, the Canadian Red Cross, the Quebec Make-A-Wish Foundation, Fondation OLO, Institut Pacifique, the Moisson network of food banks, and many hospital, college and university foundations in North America. Agropur was also part of Academos’ Coalition for Student Retention.
Last but not least, Agropur funds scholarships for outstanding students enrolled in agricultural and food sciences programs at North American colleges and universities.
1
Derny quenches his thirst with biPro protein water.
2
Urban joggers admire the early-morning light.
42
Financial ReviewF
INA
NC
IAL
RE
VIE
W
43
FIN
AN
CIA
L R
EV
IEW

44
2018(1)20172015 20162014
2018(3)20172015(2) 20162014(2) 2018(2)20172015(1) 20162014(1)
FIN
AN
CIA
L R
EV
IEW
Agropur in numbers
5,874.95,952.2
6,412.4
6,714.4SALESIn millions of dollars
EARNINGS FROM OPERATIONS(1)
In millions of dollars
NET EARNINGSIn millions of dollars
277.7
306.0
411.7
444.1
362.1
(1) Excluding the impact of Davisco’s inventories accounting treatment, net of income taxes.
(2) Fiscal year including 53 weeks.
(1) Earnings before interest, income taxes, depreciation, amortization, restructuring costs, integration and other non-recurring costs and joint ventures.
(2) Excluding the impact of Davisco's inventories accounting treatment.(3) Fiscal year including 53 weeks.
(1) Fiscal year including 53 weeks.
44.054.1
98.6
174.9
67.7
4,662.3

45
201820172015 20162014
2018(2)20172015 20162014 201820172015 20162014
92.3
40.6
65.2
(1) Milk processed includes joint ventures.(2) Fiscal year including 53 weeks.
60.165.2
1,230.4
1,291.4
5,658.9
1,537.8
6,228.3
1,358.9
5,940.5
1,490.0
6,062.3
3,831.5 FIN
AN
CIA
L R
EV
IEW
MILK PROCESSED(1)
In millions of litres
PATRONAGE DIVIDENDSIn millions of dollars
MEMBERS’ EQUITYIn millions of dollars

46
FIN
AN
CIA
L R
EV
IEW
Message from
the Senior V
ice-President and C
hief Financial Officer É
mile C
ordeauThe Cooperative’s sales continued to grow in 2018, rising to a record $6.7 billion. However, the year was characterized by challenging market conditions in the US. The state of the cheese market and of international whey markets had a $109-million negative impact compared with the previous year. Also during the year, more than half a billion dollars was spent on capacity expansion, efficiency improvement projects, and a business combination.
Sales increased by 4.7% year over year. Adjusted for calendar effects, as our 2018 fiscal year had 53 weeks, the increase was 2.7%. Earnings from operations amounted to $362.1 million, a decrease of $82.0 million or 18.5% due mainly to the unfavourable market environment in the US, which negatively impacted us by $109 million compared with 2017. Canadian markets also remained highly competitive, and despite significant market share gains our earnings fell short of expectations. Our cost-reduction program exceeded its target of $100 million over three years; our initiatives removed $28.9 million out of our cost structure in 2018, bringing the cumulative total savings to $117.9 million after three years. Earnings before patronage dividends and the Cooperative’s income taxes totalled $128.2 million, a decrease of 48.5% or $120.9 million from the previous year. Excluding one-time gains and purchase price adjustments related to acquisitions and asset impair ment, the decrease was $92.6 million or 51.3%.

47
FIN
AN
CIA
L R
EV
IEW
More than 6.2 billion litres of milk were processed at our plants in 2018, a 2.7% increase from the previous year. The volume of milk processed at our Canadian plants increased, while in the US, volume was relatively stable.
Governance
The financial statements were prepared in accordance with International Financial Reporting Standards and reviewed by the Audit Committee. On the Committee’s recommendation, the Board of Directors approved the 2018 financial statements.
REVIEW OF 2018 FINANCIAL STATEMENTS
Earnings
The Cooperative’s sales continued to grow, increasing $302.0 million to pass the $6.7 billion mark in fiscal 2018. Adjusted for the effect of the 53rd week in 2018, the increase was $173.0 million.
Canadian sales increased 11.7% to $3.8 billion, mainly as a result of the acquisition of all outstanding shares of Ultima Foods in 2018 and the full-year contribution from the oper-ations of Scotsburn acquired in January 2017. Sales were also up at most of our Canadian operations, including fresh dairy products and cheese. The increases were due primarily to customer acquisitions and market share gains.
US operations recorded $2.9 billion in sales, a 4.0% decrease. While cheese and whey product sales volumes increased, the value of sales declined because of a 4.3% decrease in the average cheese price and lower international prices for whey products. Our US operations accounted for 42.7% of consolidated sales in 2018, compared with 46.6% in 2017.
The first chart on page 44 shows the evolution of consolidated sales over the past five years. The increase from $4.7 billion in 2014 to $6.7 billion today amounts to a compound annual growth rate of 9.0% (excluding the 53rd week). The growth was due in part to the mergers and acquisitions carried out during the year, as well as expanded production capacity as a result of significant capital expenditures.
Earnings from operations amounted to $362.1 million, a year-over-year decrease of $82.0 million or 18.5%.
Earnings from Canadian operations were stable compared with the previous year. The addition of the activities of Ultima Foods and the full-year contribution from Scotsburn’s activities were positive factors. As well, the savings generated by the various initiatives in our cost-reduction program reduced our operating costs in Canada by $22.8 million during the year. Cheese sales increased as a result of new contracts. However, the extremely competitive Canadian market remains a reality. As such, price erosion had an unfavourable effect and neutralized the gains listed above.
Earnings from US operations decreased 30.6% from 2017. While cheese and whey product sales volumes increased, the unfavourable impact of the cheese block price/cost of milk ratio and the significant decrease in world prices for whey products negatively impacted earnings. Positive factors included the savings generated by the various initiatives in our cost-reduction program and the decrease in the cost of milk compared with 2017 due to abundant milk supply.
One of the charts on page 44 shows the decrease in earnings from operations in 2018, explained above. Over the past five years, however, earnings from operations have increased by $84.4 million for a compound annual growth rate of 6.9%, driven primarily by business combinations and organic growth in the US. Overall, earnings rose from $277.7 million in 2014 to $362.1 million in 2018.
From earnings from operations, we subtract a $183.0-million depreciation and amortization expense, a $14.9-million increase essentially due to the addition of the assets of Ultima Foods. We then deduct costs related to restructuring, integration and other non-recurring costs, which were $39.1 million and fall into three major categories: restructuring costs, including the restructuring of our Canadian operations following the integration of Ultima Foods, which amounted to $11.4 million; start-up costs for major projects, which amounted to $21.1 million; and costs caused by events that gave rise to expenses outside the normal course of business, which totalled $6.5 million.
Financial expenses increased from the previous year, mainly as a result of higher interest rates and, to a lesser degree, increased indebtedness. A $47.7-million gain was recognized during the year in connection with the acquisition of all shares of Ultima Foods. As required by accounting standards, we remeasured the fair value of the interest held in the joint venture prior to the acquisition, giving rise to the gain. Following the announcement in September 2018 of a plant closure, the Cooperative performed an impairment test to determine whether there had been any loss of value and a $7.4-million asset impairment charge was recognized. Lastly, the subsidiaries’ income tax expenses decreased by $41.8 million due to lower US earnings and the reduction in tax rates following the passage of the Tax Cuts and Jobs Act in the US, commonly referred to as the US tax reform. Earnings before patronage dividends therefore totalled $128.2 million, a decrease of 48.5% or $120.9 million from the previous year. Excluding one-time gains and purchase price adjustments related to acquisitions and asset impairment, the decrease was $92.6 million.
The Board of Directors approved patronage dividends of $65.2 million. As in the past, the patronage dividends were payable 25% in cash and 75% in investment shares. After deduction of patronage dividends, the Cooperative recorded $4.7 million in income tax recovery. Agropur therefore generated net earnings of $67.7 million, which were added to the reserve.
48
271
75
77
105
5632
Total 702 Total 702
324
464
FIN
AN
CIA
L R
EV
IEW
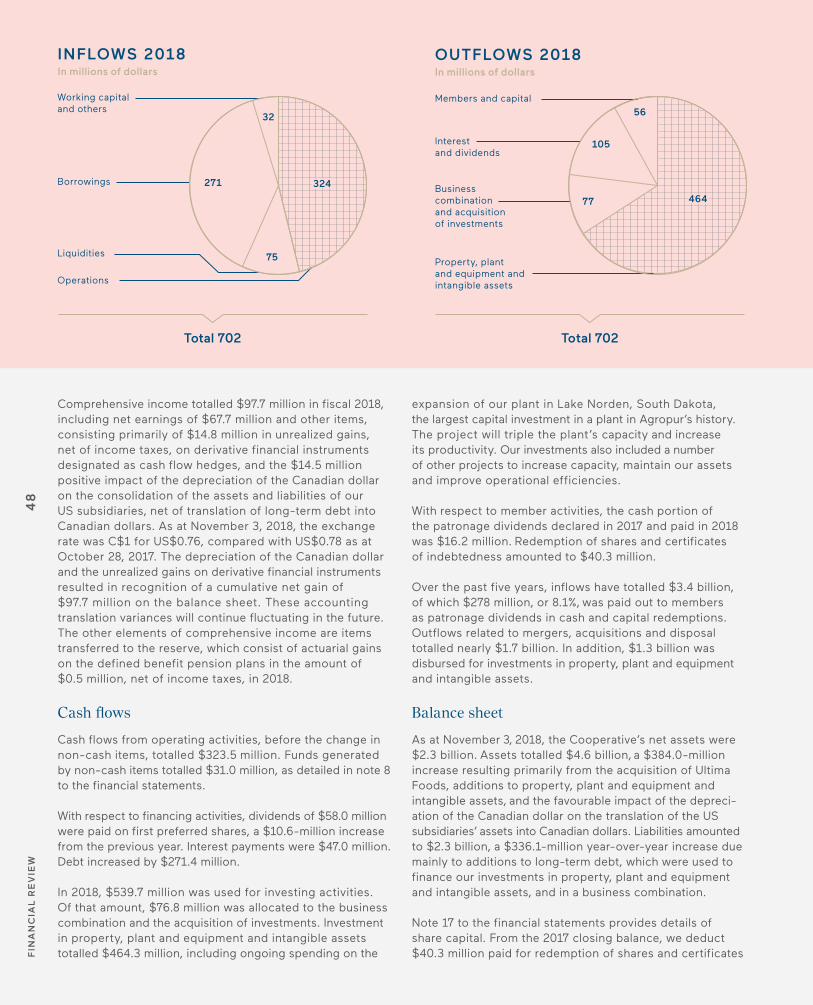
Comprehensive income totalled $97.7 million in fiscal 2018, including net earnings of $67.7 million and other items, consisting primarily of $14.8 million in unrealized gains, net of income taxes, on derivative financial instruments designated as cash flow hedges, and the $14.5 million positive impact of the depreciation of the Canadian dollar on the consolidation of the assets and liabilities of our US subsidiaries, net of translation of long-term debt into Canadian dollars. As at November 3, 2018, the exchange rate was C$1 for US$0.76, compared with US$0.78 as at October 28, 2017. The depreciation of the Canadian dollar and the unrealized gains on derivative financial instruments resulted in recognition of a cumulative net gain of $97.7 million on the balance sheet. These accounting translation variances will continue fluctuating in the future. The other elements of comprehensive income are items transferred to the reserve, which consist of actuarial gains on the defined benefit pension plans in the amount of $0.5 million, net of income taxes, in 2018.
Cash flows
Cash flows from operating activities, before the change in non-cash items, totalled $323.5 million. Funds generated by non-cash items totalled $31.0 million, as detailed in note 8 to the financial statements.
With respect to financing activities, dividends of $58.0 million were paid on first preferred shares, a $10.6-million increase from the previous year. Interest payments were $47.0 million. Debt increased by $271.4 million.
In 2018, $539.7 million was used for investing activities. Of that amount, $76.8 million was allocated to the business combination and the acquisition of investments. Investment in property, plant and equipment and intangible assets totalled $464.3 million, including ongoing spending on the
expansion of our plant in Lake Norden, South Dakota, the largest capital investment in a plant in Agropur’s history. The project will triple the plant’s capacity and increase its productivity. Our investments also included a number of other projects to increase capacity, maintain our assets and improve operational efficiencies.
With respect to member activities, the cash portion of the patronage dividends declared in 2017 and paid in 2018 was $16.2 million. Redemption of shares and certificates of indebtedness amounted to $40.3 million.
Over the past five years, inflows have totalled $3.4 billion, of which $278 million, or 8.1%, was paid out to members as patronage dividends in cash and capital redemptions. Outflows related to mergers, acquisitions and disposal totalled nearly $1.7 billion. In addition, $1.3 billion was disbursed for investments in property, plant and equipment and intangible assets.
Balance sheet
As at November 3, 2018, the Cooperative’s net assets were $2.3 billion. Assets totalled $4.6 billion, a $384.0-million increase resulting primarily from the acquisition of Ultima Foods, additions to property, plant and equipment and intangible assets, and the favourable impact of the depreci-ation of the Canadian dollar on the translation of the US subsidiaries’ assets into Canadian dollars. Liabilities amounted to $2.3 billion, a $336.1-million year-over-year increase due mainly to additions to long-term debt, which were used to finance our investments in property, plant and equipment and intangible assets, and in a business combination.
Note 17 to the financial statements provides details of share capital. From the 2017 closing balance, we deduct $40.3 million paid for redemption of shares and certificates
Property, plant and equipment and intangible assets
Borrowings
Operations
Liquidities
Business combination and acquisition of investments
Members and capital
Interest and dividends
INFLOWS 2018In millions of dollars
OUTFLOWS 2018In millions of dollars
Working capital and others

49
278
140
46
FIN
AN
CIA
L R
EV
IEW
1,663
1,298
Total 3,425
Property, plant and equipment and intangible assets
Members and capital
Mergers, acquisitions and disposals
Dividends, liquidities and others
Working capital
USE OF FUNDS 2014 TO 2018In millions of dollars
Émile CordeauSenior Vice-President and Chief Financial Officer
of indebtedness in 2018. As at November 3, 2018, total equity was nearly $2.3 billion. Excluding the first preferred shares, members’ equity stood at more than $1.5 billion, up $47.8 million from 2017.
Outlook
The decrease in our earnings in 2018 reflects unfavourable international markets for whey products, low cheese prices in the US and persistent aggres sive competition in the Canadian market. Under the circumstances, we are pressing ahead with our efforts on our cost-reduction program, integration of our acquisitions, and organic growth.
In this regard, the expansion of our plant in Lake Norden, South Dakota, is on schedule and commissioning is slated for the second quarter of 2019. The US$255-million (approximately C$330 million) investment approved last year will eventually triple the plant’s processing capacity, enabling us to step up our development in the US, capture a share of the growth in US cheese consumption, and strengthen our position as a key player in the dairy processing industry.
The Cooperative has a sound financial position. Despite the decrease in 2018, Agropur’s earnings from operations are up 30.4% over the past five years. Our milk processing capacity is increasing as a result of significant investments that have been completed or are in progress. We are therefore strongly positioned to continue our growth in the coming years.
50
Risks and Uncertainties
Product- related risks
Given its processing activities, the Cooperative is exposed to the risk of contamination of its ingredients or products by internal or external agents. If this should occur, a product recall could prove to be costly and have a negative impact on our reputation and, by extension, on future sales.
Raw material risks
Price volatility and the availability of the raw materials used in the manufacture of goods, particularly milk, which represents the major cost component, and the necessary packaging materials, could have a negative impact on product costs. In a competitive market environ-ment, the impact of a price increase in inputs will depend on the Cooperative’s ability to convert this increase into a comparable increase in the selling prices of its products.
Customer -related risks
Increasing concentration in the food distribution industry in recent years has resulted in a more limited number of customers and an increase in the relative importance of some customers. Since the Cooperative serves this industry, such concentration could lead some distributors to exert pressure on prices, causing an adverse effect on operating earnings.
Consumption trend risks
Changing consumption trends could affect demand for our products and thus affect the earnings of the Cooperative. The repercussions of such changes will depend on our ability to meet consumers’ needs, develop new products and innovate.
Competition risks
The Cooperative is exposed to risks associated with heightened competition in the dairy industry, the possible arrival of new competitors on the market, and changing consumer needs. Business combinations in the dairy industry in recent years have intensified international competition. In Canada, the dairy industry is dominated by three main players, including the Cooperative. In the United States, we face numerous regional and national competitors. Regional, national and international competitors seeking to strengthen their market position could force the Cooperative to grant additional discounts on its products in order to maintain its market share.
Market risks
Prices for milk and whey products on international markets and cheese prices in the United States are dependent on fluctuations in supply and demand, which in turn are influenced by global economic conditions.
Business environment risks
Demand for our products could be affected by an economic slowdown or market recession, which would consequently impact earnings.
Supplier risks
The concentration of suppliers means that for some goods and services, our supplies are restricted to a limited number of suppliers. Problems may also arise in the supply chain, particularly with logistics suppliers. Insufficient quantities, quality or timeliness could negatively impact our earnings.
Risks related to unplanned disruption of operations
Major events such as a fire, equipment failure, epidemic, natural disaster, etc. may occur and cause harm to employees or damage to property, which could lead to an unplanned disruption of the Cooperative’s operations. The impact would depend on the Cooperative’s ability to manage the crisis. The Cooperative has insurance coverage to reduce its exposure to some business interruption-related risks.
Acquisition risks
In a fast-consolidating global dairy industry, the Cooperative has grown through business combinations and intends to continue doing so in the future. The impact will depend on our ability to identify strategic acquisitions, determine their fair value, put in place the resources needed to integrate the acquired businesses, and achieve the expected synergies. The success of this strategy will also depend on our ability, as a cooperative, to access liquidity in the capital markets.
Interest rate risks
The Cooperative has assumed long-term debt as a result of the numerous business combinations it has carried out. It is therefore exposed to risk arising from fluctuations in interest rates on this financial instrument. The cash flow impact will be negative if interest rates rise and positive if interest rates fall. In keeping with its risk management strategy and in order to reduce its exposure to interest rate fluctuations on a portion of its term loan, the Cooperative trades floating-rate interest payments for fixed-rate payments at specified intervals.
FIN
AN
CIA
L R
EV
IEW

51
Information system risks
The integration of computer applications into the Cooperative’s operations makes the Cooperative more dependent on such applications. Computer service availability, completeness and confi-dentiality are the main risks associated with the use of such applications. A system malfunction could lead to poor decisions or affect production levels.
Cyberattack risks
To conduct its business, the Cooperative relies on properly functioning computer applications, including internal networks, integrated systems, cloud services and external data centres. In order to protect its data and systems, the Cooperative has implemented various security measures to guard against the rising risk of cyberattack. Those measures include continuously updated computer controls, staff training sessions, strict rules for the suppliers whose services we use, and a disaster recovery plan. Despite these safeguards, the Cooperative is not immune to the threat. A successful cyberattack could affect our operations and there-fore have negative financial impacts.
Regulatory risks
The Cooperative is subject to multiple governmental and tax laws, regulations and policies. Amendments to, or tightening of, those laws and regulations could affect our operations or lead to additional costs for compliance with such new obligations, particularly with respect to the production, labelling and distri-bution of food products. Regulatory risks are growing due to the current context of growth through business combinations in different countries, provinces and states. We attach great importance to compliance with applicable laws and regulations in all jurisdictions where we do business, as breaches can lead to sanctions, penalties or fines.
Environmental risks
The Cooperative is subject to a number of environmental protection laws and regulations concerning, in particular, wastewater discharge, air pollution, the use of toxic chemicals, and the clean-up of contaminated sites. Any amendments to such laws and regulations could involve additional outlays for compliance.
Labour relations risks
Several groups of employees at our various worksites are unionized. Nego-tiating collective agreements can create conflicts resulting in work stoppages or slowdowns. We make the necessary efforts to maintain good relations with the unions.
Personnel risks
The Cooperative’s success is dependent on its people’s efforts and skills. Work-force availability and engagement, as well as occupational health and safety, present risks to our ability to achieve our growth objectives. Each of our plants has a health and safety plan. The Cooperative conducts an annual review of its succession management plan and ensures that contingency plans exist for all critical positions.
Risks associated with tariff rules
The Cooperative operates in the dairy industry, in which imports are subject to tariff rules. International trade rules may be modified by international treaties, which could have the effect of changing the competitive environment in the markets in which the Cooperative operates. The Cooperative’s future profitability will depend on its ability to adapt to new rules by offering its customers products that are competitive in quality and price.
Risks related to employee future benefits
The Cooperative offers some groups of employees defined benefit plans. Changes in long-term interest rates, volatility of returns and regulations governing such plans could potentially require the Cooperative to make contri-butions which are significantly different from those currently paid. A review of the Cooperative’s obligations under these plans was completed and most of them are now closed to new participants.
FIN
AN
CIA
L R
EV
IEW

52
Consolidated Financial Statements
CO
NS
OL
IDA
TE
D F
INA
NC
IAL
ST
AT
EM
EN
TS
53
CO
NS
OL
IDA
TE
D F
INA
NC
IAL
ST
AT
EM
EN
TS
CONSOLIDATED FINANCIAL STATEMENTS
INDEPENDENT AUDITOR’S REPORT
December 14, 2018
To the members of Agropur cooperative
We have audited the accompanying consolidated financial statements of Agropur cooperative, which comprise the consolidated balance sheet as at November 3, 2018, and the consolidated statements of earnings, of comprehensive income, of cash flows and of changes in equity for the year then ended, and the related notes, which comprise a summary of significant accounting policies and other explanatory information.
Management’s responsibility for the consolidated financial statements Management is responsible for the preparation and fair presentation of these consolidated financial statements in accordance with International Financial Reporting Standards, and for such internal control as management determines is necessary to enable the preparation of consolidated financial statements that are free from material misstatement, whether due to fraud or error.
Auditor’s responsibility Our responsibility is to express an opinion on these consolidated financial statements based on our audit. We conducted our audit in accordance with Canadian generally accepted auditing standards. Those standards require that we comply with ethical requirements and plan and perform the audit to obtain reasonable assurance about whether the consolidated financial statements are free from material misstatement.
An audit involves performing procedures to obtain audit evidence about the amounts and disclosures in the consolidated financial statements. The procedures selected depend on the auditor’s judgment, including the assessment of the risks of material misstatement of the consolidated financial statements, whether due to fraud or error. In making those risk assessments, the auditor considers internal control relevant to the entity’s preparation and fair presentation of the consolidated financial statements in order to design audit procedures that are appropriate in the circumstances, but not for the purpose of expressing an opinion on the effectiveness of the entity’s internal control. An audit also includes evaluating the appropriateness of accounting policies used and the reasonableness of accounting estimates made by management, as well as evaluating the overall presentation of the consolidated financial statements.
We believe that the audit evidence we have obtained in our audit is sufficient and appropriate to provide a basis for our audit opinion.
Opinion In our opinion, the consolidated financial statements present fairly, in all material respects, the financial position of Agropur cooperative as at November 3, 2018 and its financial performance and its cash flows for the year then ended, in accordance with International Financial Reporting Standards.
Montréal, Quebec
1 CPA auditor, CA, public accountancy permit no. A119427

54
CONSOLIDATED EARNINGS
Years ended November 3 October 282018 2017
(IN THOUSANDS OF CANADIAN DOLLARS) (53 weeks) (52 weeks)
Sales 6,714,365 6,412,409
Operating expenses excluding depreciation and amortization 6,352,218 5,968,279
Earnings before interest, income taxes, depreciation, amortization,restructuring costs, integration and other non-recurring costs 362,147 restructuring costs, integration and other non-recurring costs 362,147 restructuring costs, integration and other non-recurring costs 362,147 444,130
Depreciation and amortization (notes 10 and 11) 183,025 168,080 Restructuring costs, integration and other non-recurring costs (note 4) 39,066 11,035
Operating earnings 140,056 265,015
Net financial expenses 44,614 35,661 Loss (gain) on disposal of assets 198 (212) Impairment of assets (notes 10 et 11) 7,382 538 Purchase price adjustment - (55,156) Accounting gains as a result of business combinations (note 3) (47,660) (13,971) Income taxes of subsidiaries (note 5) 7,286 49,042
Earnings before patronage dividends and the Cooperative's income taxes 128,236 Earnings before patronage dividends and the Cooperative's income taxes 128,236 Earnings before patronage dividends and the Cooperative's income taxes 128,236 249,113
Patronage dividends (note 6) 65,219 65,236 Cooperative's income taxes (note 5) (4,669) 8,972
Net earnings 67,686 174,905
CO
NS
OL
IDA
TE
D F
INA
NC
IAL
ST
AT
EM
EN
TS

55
CONSOLIDATED COMPREHENSIVE INCOME
Years ended November 3 October 282018 2017
(IN THOUSANDS OF CANADIAN DOLLARS) (53 weeks) (52 weeks)
Net earnings 67,686 174,905
Other comprehensive income
Components that may be reclassified to net earnings:
Net change in fair value of derivative instruments designated as cash flowhedges, net of income tax expense of $5,547 (2017 income tax recovery – $426) 14,764 (417)
Change in foreign currency translation adjustment of foreign operations 33,087 (76,659)
Change in foreign currency translation adjustment of long-term debtsdesignated as hedge of a net investment in foreign operations (18,552) 42,109
Reversal of the share of other comprehensive income of joint ventures 218 -
29,517 (34,967)
Components that will not be reclassified to net earnings:
Actuarial gains on the accrued benefit obligation, net of income tax expenseof $196 (2017 income tax expense – $5,229) (note 21) 537 14,417
Total other comprehensive income 30,054 Total other comprehensive income 30,054 Total other comprehensive income 30,054 (20,550)
Total comprehensive income 97,740 Total comprehensive income 97,740 Total comprehensive income 97,740 154,355
CO
NS
OL
IDA
TE
D F
INA
NC
IAL
ST
AT
EM
EN
TS

56
CONSOLIDATED CASH FLOWS
Years ended November 3 October 282018 2017
(IN THOUSANDS OF CANADIAN DOLLARS) (53 weeks) (52 weeks)
CASH FLOWS FROMOperating activitiesEarnings before patronage dividends and the Cooperative's income taxes 128,236 249,113 Net financial expenses 44,614 35,661 Items not involving use of funds
Depreciation and amortization 183,025 168,080 Accounting gains as a result of business combinations (note 3) (47,660) (13,971) Deferred income taxes of subsidiaries 7,752 46,142 Impairment of assets (notes 10 and 11) 7,382 538 Loss (gain) on disposal of assets 198 (212)
323,547 485,351
Patronage dividends paid (16,178) (14,946) Change in non-cash items (note 8) 30,959 6,664
338,328 477,069
Financing and share capital activitiesInterest paid (47,039) (36,960) Long-term debt, net of issuance expenses (note 15) 271,407 (102,586) Dividends on first preferred shares (57,967) (47,380) Issuance and redemption of members' shares and certificates of indebtedness (40,036) (40,245)
126,365 (227,171)
Investing activitiesBusiness combinations (note 3) (68,059) (54,815) Acquisition of investments (8,767) - Property, plant and equipment and intangible assets (notes 10 and 11) (464,321) (174,285) Subordinated loan to a joint venture (note 7) - (3,000) Proceeds from disposal of assets 1,403 16,542
(539,744) (215,558)
Effect of exchange rate fluctuations on cash position (306) Effect of exchange rate fluctuations on cash position (306) Effect of exchange rate fluctuations on cash position (306) 664
Net change in cash position over the year (75,357) Net change in cash position over the year (75,357) Net change in cash position over the year (75,357) 35,004
Cash position – Beginning of year (note 8) 84,531 49,527
Cash position – End of year (note 8) 9,174 84,531
Additional information:Member and share capital activitiesPatronage dividends paid (16,178) (14,946) Issuance of shares and certificates of indebtedness 250 218 Redemption of shares and certificates of indebtedness (40,286) (40,463)
(56,214) (55,191)
CO
NS
OL
IDA
TE
D F
INA
NC
IAL
ST
AT
EM
EN
TS

57
CONSOLIDATED BALANCE SHEETS
November 3 October 28(IN THOUSANDS OF CANADIAN DOLLARS) 2018 2018 2018 2017 2017 2017
ASSETSCurrent assetsCash 35,709 89,614 Accounts receivable 358,207 449,142 449,142 449,142 Inventories (note 9) 777,234 806,732 Income taxes 2,537 2,537 2,537 2,226 2,226 2,226 Prepaid expenses 25,543 25,543 25,543 25,386 25,386 25,386
1,199,230 1,373,100
Investments and loan (note 7) 9,014 17,280
Property, plant and equipment (note 10) 1,845,385 1,433,223
Intangible assets (note 11) 407,941 407,941 407,941 337,146
Goodwill (note 11) 1,056,712 1,005,158
Other assets (note 12) 83,575 50,251
4,601,857 4,601,857 4,601,857 4,216,158 4,216,158 4,216,158
LIABILITIESCurrent liabilitiesBank overdrafts and lines of credit (note 13) 26,535 26,535 26,535 5,083 Accounts payable and accrued liabilities (note 14) 717,155 791,215 Income taxes 4,636 4,636 4,636 379 Current portion of long-term debt (note 15) 44,540 44,540 44,540 43,836 43,836 43,836
792,866 840,513
Long-term debt (note 15) 1,395,779 1,022,906
Deferred income taxes (note 5) 76,337 65,230
Employee future benefits obligation (note 21) 25,054 25,054 25,054 23,427 23,427 23,427
Other long-term liabilities (note 16) 4,035 4,035 4,035 4,127 4,127 4,127
2,294,071 2,294,071 2,294,071 1,956,203
EQUITYMembers' capital (note 17) 804,739 795,706
First preferred shares (note 17) 770,000 770,000
Reserve 638,789 629,508
Accumulated other comprehensive income (note 18) 94,258 64,741
2,307,786 2,307,786 2,307,786 2,259,955
4,601,857 4,601,857 4,601,857 4,216,158 4,216,158 4,216,158
Approved by the Board of Directors, on December 14, 2018.
René Moreau, Director Roger Massicotte, Director
CO
NS
OL
IDA
TE
D F
INA
NC
IAL
ST
AT
EM
EN
TS

58
CONSOLIDATED CHANGES IN EQUITY
First Total
Class M Classes Total Certificates Total preferred share Comprehensive
and member A and B Contributed shares of members' shares capital income
(IN THOUSANDS OF CANADIAN DOLLARS) shares shares surplus (note 17) indebtedness capital (note 17) (note 17) Reserve (“AOCI”)4 Total
As at October 30, 2016 4,199 695,510 As at October 30, 2016 4,199 695,510 As at October 30, 2016 4,199 51,180 695,510 51,180 695,510 750,889 51,180 750,889 51,180 19,948 750,889 19,948 750,889 770,837 19,948 770,837 19,948 770,000 770,837 770,000 770,837 1,540,837 770,000 1,540,837 770,000 488,367 1,540,837 488,367 1,540,837 99,708 488,367 99,708 488,367 2,128,912 99,708 2,128,912 99,708
Net earnings - - Net earnings - - Net earnings - - - - - - - - - - 174,905 - 174,905 - 174,905 174,905
Other comprehensive
income (loss) - - income (loss) - - income (loss) - - - - - - - - - - (34,967) 14,417 (34,967) 14,417 (20,550)
Issuance of shares as
payment for patronage
dividends - 49,058 dividends - 49,058 dividends - - 49,058 - 49,058 49,058 - 49,058 - 49,058 - - - - 49,058
Issuance of shares for cash 109 109 Issuance of shares for cash 109 109 Issuance of shares for cash 109 - 109 - 109 218 - 218 - 218 - - - - 218
Dividends on first preferred
shares including income1 - - - - - - - - - - - - - (48,181) - (48,181) - (48,181) (48,181)
Redemption of shares and
certificates of indebtedness (51) (38,435) certificates of indebtedness (51) (38,435) certificates of indebtedness (51) - (38,435) - (38,435) (38,486) (1,977) (40,463) - (40,463) - - - - (40,463)
Issuance of shares and
certificates of indebtedness
in a business combination2 695 - 695 - 695 - - - - 695 15,361 16,056 - 16,056 - - - - 16,056
As at October 28, 2017 4,952 706,242 As at October 28, 2017 4,952 706,242 As at October 28, 2017 4,952 51,180 706,242 51,180 706,242 762,374 51,180 762,374 51,180 33,332 762,374 33,332 762,374 795,706 33,332 795,706 33,332 770,000 795,706 770,000 795,706 1,565,706 770,000 1,565,706 770,000 629,508 1,565,706 629,508 1,565,706 64,741 629,508 64,741 629,508 2,259,955 64,741 2,259,955 64,741
As at October 29, 2017 4,952 706,242 As at October 29, 2017 4,952 706,242 As at October 29, 2017 4,952 51,180 706,242 51,180 706,242 762,374 51,180 762,374 51,180 33,332 762,374 33,332 762,374 795,706 33,332 795,706 33,332 770,000 795,706 770,000 795,706 1,565,706 770,000 1,565,706 770,000 629,508 1,565,706 629,508 1,565,706 64,741 629,508 64,741 629,508 2,259,955 64,741 2,259,955 64,741
Net earnings - - Net earnings - - Net earnings - - - - - - - - - - 67,686 - 67,686 - 67,686 67,686
Other comprehensive
income (loss) - - income (loss) - - income (loss) - - - - - - - - - - 29,517 537 29,517 537 30,054
Issuance of shares as
payment for patronage
dividends - 49,069 dividends - 49,069 dividends - - 49,069 - 49,069 49,069 - 49,069 - 49,069 - - - - 49,069
Issuance of shares for cash 105 145 Issuance of shares for cash 105 145 Issuance of shares for cash 105 - 145 - 145 250 - 250 - 250 - - - - 250
Dividends on first preferred
shares including income3 - - - - - - - - - - - - - (58,942) - (58,942) - (58,942) (58,942)
Redemption of shares and
certificates of indebtedness (98) (37,539) certificates of indebtedness (98) (37,539) certificates of indebtedness (98) - (37,539) - (37,539) (37,637) (2,649) (40,286) - (40,286) - - - - (40,286)
As at November 3, 2018 4,959 717,917 As at November 3, 2018 4,959 717,917 As at November 3, 2018 4,959 51,180 717,917 51,180 717,917 774,056 51,180 774,056 51,180 30,683 774,056 30,683 774,056 804,739 30,683 804,739 30,683 770,000 804,739 770,000 804,739 1,574,739 770,000 1,574,739 770,000 638,789 1,574,739 638,789 1,574,739 94,258 638,789 94,258 638,789 2,307,786 94,258 2,307,786 94,258
1 Dividends on first preferred shares net of current income tax expense of $11,845 and deferred income tax recovery of $11,044.2 Par value of the shares and certificates of indebtedness issued to former shareholders of Scotsburn Co-operative Services Ltd. (note 3).3 Dividends on first preferred shares net of current income tax expense of $14,492 and deferred income tax recovery of $13,517.4 Accumulated other comprehensive income (note 18).
CO
NS
OL
IDA
TE
D F
INA
NC
IAL
ST
AT
EM
EN
TS

59
NOTES TO THE FINANCIAL STATEMENTS AS AT NOVEMBER 3, 2018(IN THOUSANDS OF CANADIAN DOLLARS, UNLESS OTHERWISE INDICATED)
1. GENERAL INFORMATION
Agropur cooperative (“the Cooperative”) was established on August 29, 1938, under the Act respecting Cooperative AgriculturalAssociations and, since October 26, 2000, has been governed by the Canada Cooperatives Act.
The Cooperative and its subsidiaries carry on the business of processing and selling dairy products. Facilities are located inCanada and the United States. The head office is located in Saint-Hubert, Canada.
2. SIGNIFICANT ACCOUNTING POLICIES
BASIS OF PRESENTATION
These consolidated financial statements of the Cooperative have been prepared in accordance with International FinancialReporting Standards (“IFRS”) in effect as at November 3, 2018, as issued by the International Accounting Standards Board(“IASB”).
CONSOLIDATION PRINCIPLES
These consolidated financial statements include the accounts of the Cooperative and its subsidiaries.
ESTIMATES
The preparation of financial statements requires management to make estimates and assumptions, in particular with respect to the fair value measurement of net assets combined and the consideration transferred as part of business combinations, theelection of depreciation and amortization methods, the estimation of useful life of depreciable or amortizable assets, theimpairment tests of assets, and the valuation of standard costs for finished goods and of employee future benefits.
CASH POSITION
Cash position consists of cash, bank overdrafts and lines of credit.
INVENTORIES
Finished goods and goods in process are valued at the lower of average cost and net realizable value. Raw materials are valuedat the lower of cost and net realizable value, cost being determined under the first-in, first-out method.
Borrowing costs attributable to mature inventories are included in the cost of the finished goods inventory.
INVESTMENTS
Investments are tested for impairment by the Cooperative if there is an indication that the carrying amount may not be recovered.To establish the recoverable amount, the Cooperative determines the higher of an investment's value in use using discountedfuture cash flows and its fair value less costs to sell.
PROPERTY, PLANT AND EQUIPMENT
Property, plant and equipment are recorded at cost less accumulated depreciation and impairment losses, net of applicablegovernment grants.
Depreciation of property, plant and equipment is calculated over their estimated useful lives, mainly using the following methodsand rates:
• Buildings Straight-line 40 years• Equipment Diminishing balance 10% and 15%• Rolling stock Diminishing balance 30%
CO
NS
OL
IDA
TE
D F
INA
NC
IAL
ST
AT
EM
EN
TS

60
NOTES TO THE FINANCIAL STATEMENTS AS AT NOVEMBER 3, 2018(IN THOUSANDS OF CANADIAN DOLLARS, UNLESS OTHERWISE INDICATED)
Property, plant and equipment are tested for impairment by the Cooperative if there is an indication that the carrying amount maynot be recovered. To establish the recoverable amount, the Cooperative determines the higher of the value in use usingdiscounted future cash flows and the fair value less costs to sell. For impairment testing purposes, property, plant andequipment are grouped at the lowest level for which there are identifiable cash flows.
Property, plant and equipment under construction are not amortized.
INTANGIBLE ASSETS
Intangible assets mainly consist of customer relationships, trademarks and software. These assets are accounted for under thecost method less accumulated depreciation and impairment losses.
Intangible assets with indefinite useful lives are not amortized; they are subject to an annual impairment test. Intangible assetswith definite useful lives are amortized, mainly using the following methods and rates:
• Customer relationships Straight-line 4 to 12 years• Software Straight-line 5 to 15 years• Other rights Straight-line 5 to 40 years
Intangible assets with definite useful lives are tested for impairment if there is an indication that the carrying amount may not berecovered. To establish the recoverable amount, the Cooperative determines the higher of the value in use using discountedfuture cash flows and the fair value less costs to sell. For impairment testing purposes, intangible assets are grouped at thelowest level for which there are identifiable cash flows.
Intangible assets under construction are not amortized.
BORROWING COSTS
Borrowing costs that are directly attributable to the acquisition, construction, or production of a qualifying asset are part of the costof that asset. The Cooperative ceases to capitalize borrowing costs when substantially all the activities necessary to prepare thequalifying asset for its intended use or sale are completed. Other borrowing costs are recognized as an expense in the periodin which they are incurred.
GOODWILL
Goodwill is initially recognized as the excess of the fair value of the consideration transferred over the fair value of the identifiedassets and liabilities.
Goodwill is not amortized. Goodwill is tested annually for impairment by reporting business units in order to determine if there isan impairment loss. An impairment test is also performed when there is an indication that the carrying amount may not berecovered. Reporting business units are determined according to the smallest identifiable group of assets that generates cashinflows. To evaluate if there is a goodwill impairment loss, the Cooperative compares the recoverable amount of the reportingbusiness units to their carrying amount. The recoverable amount is the higher of the fair value less costs to sell and the value inuse. If the carrying amount exceeds the recoverable amount, an impairment loss is recorded.
For every reporting business unit, the recoverable amount was measured using cash flow projections before income taxes frombusiness plans approved by management. Budgeted gross margins calculated by management are based on previous resultsand forecasts of market development. This calculation is based on key assumptions made by management. A change in a keyassumption could cause an important impact on the recoverable amount.
OTHER ASSETS
Deferred charges for procurement contracts related to customers are amortized on a straight-line basis over the term of the contract or based on the volume specified in the contract.
CO
NS
OL
IDA
TE
D F
INA
NC
IAL
ST
AT
EM
EN
TS

61
NOTES TO THE FINANCIAL STATEMENTS AS AT NOVEMBER 3, 2018(IN THOUSANDS OF CANADIAN DOLLARS, UNLESS OTHERWISE INDICATED)
BUSINESS COMBINATIONS
The Cooperative uses the acquisition method to account for business combinations. Under this method, the Cooperativedetermines the fair value of the assets combined, the liabilities assumed, and the consideration transferred. The excess of thefair value of the consideration transferred over the fair value of the assets combined and the liabilities assumed is recorded ingoodwill. If the excess is negative, it is recorded in earnings. Business combination costs are recognized in earnings during theyear in which they are incurred.
REVENUE RECOGNITION
Revenues are recognized when the significant risks and rewards of ownership of the goods are transferred to the buyer.Revenues are recognized net of annual amortization of procurement contracts.
EMPLOYEE FUTURE BENEFITS
The Cooperative accounts for its obligations arising from employee benefit plans and related costs, net of the plan's assets. The discount rate used to measure the accrued benefit obligation is determined according to the return of high quality corporatebonds on the market as at the valuation date. The cost of pension and other retirement benefits earned by employees iscalculated according to the projected benefit method, prorated on years of service, based on management's best estimateassumptions about the salary projections and the retirement ages of employees. The fair value of assets is determined usingmarket value. Actuarial gains (losses) are recorded in other comprehensive income. The cost of past services resulting fromchanges to the plans is recognized in earnings when the plan amendment occurs or on the date when the related costs arerecognized.
INCOME TAXES
Income tax expenses include current income tax and deferred income tax expenses. Current income tax expenses are calculatedusing enacted or substantively enacted income tax rates as at the balance sheet date. Deferred income taxes are measuredfrom the difference between tax bases and carrying amounts of assets and liabilities. However, deferred tax is not recognized onthe initial recognition of goodwill and the initial recognition of assets and liabilities when the related transaction is not a businesscombination and does not affect accounting nor tax earnings. Deferred income tax assets and liabilities are measured using thetax rates that are expected to be in effect in the years when these temporary differences are expected to reverse. Income taxassets are recognized when it is more likely than not that the asset will be realized.
TRANSLATION OF FOREIGN CURRENCIES
Foreign currency transactionsMonetary assets and liabilities denominated in foreign currencies are translated at the exchange rate prevailing as at the balancesheet date, while transactions denominated in foreign currencies are translated at the average monthly exchange rates duringthe year. Non-monetary assets and liabilities denominated in foreign currencies are translated at historical exchange rates. Theresulting foreign currency translation gains or losses, net of hedging operations, are included in earnings.
Foreign operationsAll assets and liabilities of foreign operations are translated into Canadian dollars at the exchange rate prevailing as at thebalance sheet date. Unrealized foreign currency gains and losses resulting from this translation are included as a component of accumulated other comprehensive income in equity. Foreign currency gains or losses are reduced by hedging operations using a bank loan in US dollars. Revenues and expenses are translated at the average exchange rate for the month.
CO
NS
OL
IDA
TE
D F
INA
NC
IAL
ST
AT
EM
EN
TS

62
NOTES TO THE FINANCIAL STATEMENTS AS AT NOVEMBER 3, 2018(IN THOUSANDS OF CANADIAN DOLLARS, UNLESS OTHERWISE INDICATED)
FINANCIAL INSTRUMENTS
Recognition or derecognition of financial assets and liabilitiesThe Cooperative initially recognizes the financial assets and liabilities at the trade date at which the Cooperative becomes a partyto the contractual provisions of the instrument. The Cooperative derecognizes a financial asset when the contractual rights to thecash flows from the asset expire or when the contractual rights to the cash flows are transferred to a third party, especially in thecase of a factoring program. The financial liabilities are derecognized when the Cooperative's contractual obligations aredischarged, cancelled or expired.
The following financial assets and liabilities are accounted for at their initial transaction value, which approximates theirfair value as at the balance sheet date, considering their nature and their short-term maturity, and variable interest rate forlong-term debt.
Subsequently, the Cooperative accounts for these financial instruments under the prescribed method of the category in which thefinancial instrument was classified at initial recognition:
Loans and receivables Other liabilities
Financial instruments Exchange contracts Cash Bank overdrafts and lines of credit Commodity futures Accounts receivable Accounts payable and accrued contracts Subordinated loan liabilities Interest rate swaps Long-term debt
Subsequent Fair value1 Amortized cost using the Amortized cost using theaccounting effective interest method effective interest method
1 Gains and losses arising from changes in fair value are included in net earnings, unless the financial instrument is designated as a hedginginstrument.
In the event of a material impairment of any of the financial assets, such impairment loss is recorded in earnings.
HEDGING OPERATIONS
Cash flow hedgeThe Cooperative documents the risk management strategy used to apply hedge accounting. At the signing of the hedgingcontract, management documents the hedged item as an asset, a liability, or an anticipated transaction, details of the hedginginstruments used and the method of assessing effectiveness. Realized gains and losses on hedges are consequently deferreduntil realization of the hedged item in order to match the designations to earnings.
The portion of the gain or loss on the hedging instrument that is considered to be an effective hedge is recorded in othercomprehensive income. The ineffective portion of the gain or loss on the hedging instrument is recorded in earnings. Upon cessation of hedge accounting, the cumulative gain or loss that has been recorded in other comprehensive income is reclassifiedin earnings.
Hedge of net investmentCurrency exchange differences resulting from the translation of a financial liability designated as a hedge of a net investment in a foreign operation are recorded in other comprehensive income and are presented in equity as long as the hedge is effective. If the hedge is ineffective, these currency exchange differences are recorded in earnings. At the disposal of a hedged foreign investment, the accumulated exchange differences recorded in equity shall be reclassified in earnings and shall be recognized as a gain or loss arising from the disposal.
Assets and liabilitiesheld for trading
CO
NS
OL
IDA
TE
D F
INA
NC
IAL
ST
AT
EM
EN
TS

63
NOTES TO THE FINANCIAL STATEMENTS AS AT NOVEMBER 3, 2018(IN THOUSANDS OF CANADIAN DOLLARS, UNLESS OTHERWISE INDICATED)
NEW ACCOUNTING STANDARD ADOPTED DURING THE YEAR
Statement of cash flowsOn January 29, 2016, the IASB issued amendments to IAS 7, "Statement of Cash Flows", to improve information provided tousers of financial statements about financing activities.
The application of this amended standard in the first quarter of 2018 had no significant impact on the consolidated financialstatements. A reconciliation of long-term debt is presented in note 15.
FUTURE ACCOUNTING POLICIES
The IASB issued new standards that are not yet effective for the year ended November 3, 2018.
Financial instrumentsOn July 24, 2014, the IASB issued the final version of IFRS 9, "Financial Instruments", which replaces IAS 39, "Financial Instruments: Recognition and Measurement". At the same time, the IASB modified IFRS 7, "Financial Instruments: Disclosures" to include disclosure items in the financial statements as part of the initial IFRS 9 adoption.
The Cooperative will adopt this new standard as at the first quarter of its 2019 fiscal year.
The Cooperative has completed its assessment of the impact of these changes on its 2019 consolidated financial statements,and believes that the impact of the adoption of this standard will not be significant. Among others:
• The Cooperative did not identified any changes to the classification and measurement of the existing financial instrumentsupon applying IFRS 9, other than a change in the classification, without impact of the valuation, of a portion of the accountsreceivable under agreements to sell its rights to a financial institution valued at $61.5 million as at November 3, 2018. Theseaccounts receivable classified as "loans and receivables" will be classified as "at faire value through earnings" as a result ofthe transition to IFRS 9.
• In accordance with transition provisions on hedge accounting provided in IFRS 9,the Cooperative will continue to apply thehedge accounting requirements of IAS 39 instead of adopting the guidance of IFRS 9.
Revenue from contracts with customersOn May 28, 2014, the IASB issued IFRS 15, "Revenue from Contracts with Customers", a new standard on revenue recognition,superseding IAS 18, "Revenue" and IAS 11, "Construction Contracts and Related Interpretations".
The standard defines the requirements for revenue recognition. It introduces more prescriptive guidelines than those includedin previous standards, and will result in additional notes disclosures.
The Cooperative will adopt this new standard as at the first quarter of its 2019 fiscal year, and believes that this standard will haveno significant impact on its 2019 consolidated financial statements.
LeasesOn January 13, 2016, the IASB issued IFRS 16, "Leases", which replaces IAS 17, "Leases". The new standard introduces asingle on-balance sheet recognition and measurement model for lessees and will eliminate the distinction between operatingand finance leases.
This new standard is effective for the years beginning on or after January 1, 2019.
The Cooperative will adopt this new standard as at the first quarter of its 2020 fiscal year and has not completed its assessmentof the impact of these changes on its consolidated financial statements.
CO
NS
OL
IDA
TE
D F
INA
NC
IAL
ST
AT
EM
EN
TS

64
NOTES TO THE FINANCIAL STATEMENTS AS AT NOVEMBER 3, 2018(IN THOUSANDS OF CANADIAN DOLLARS, UNLESS OTHERWISE INDICATED)
Uncertainty over income tax treatmentsOn June 7, 2017, the IASB issued IFRIC 23, "Uncertainty over Income Tax Treatments", which clarifies the accounting foruncertainty in income taxes prescribed by IAS 12 "Income Taxes".
This new standard is effective for the years beginning on or after January 1, 2019.
The Cooperative will adopt this new standard as at the first quarter of its 2020 fiscal year and has not completed its assessmentof the impact of these changes on its consolidated financial statements.
Income taxesOn December 12, 2017, the IASB issued "Annual Improvements to IFRS Standards 2015-2017 Cycle", amending, among others,IAS 12 "Income Taxes" to clarify the income tax consequences of dividends on financial instruments classified as equity.
These amendments are effective for fiscal years beginning on or after January 1, 2019, and early application is permitted.
The Cooperative will adopt this new standard as at the first quarter of its 2020 fiscal year, and believes that this standard will haveno significant impact on its 2020 consolidated financial statements.
3. BUSINESS COMBINATIONS
On October 29, 2017, the Cooperative acquired all shares of Ultima Foods joint venture. Ultima Foods, which was ownedequally by Agropur cooperative and Agrifoods International Cooperative Ltd., became the exclusive property of the Cooperative.Ultima Foods operates in the field of manufacturing and commercialization of yogurts and fresh dairy desserts, and runs twoplants in Canada, one located in Quebec, and one in British Columbia.
The 50% interest already held at the time of the transaction was deemed to be disposed at a fair value of $47,878, which gaverise to a gain of $47,660 net of a reversal of $218 from other comprehensive income. This gain was recorded in earnings as anaccounting gain as a result of a business combination.
The consideration transferred totalled $95,756.
The fair value of net assets combined is detailed as follows:
2018
Current assets 50,891 Property, plant and equipment 134,245 Property, plant and equipment 134,245 Property, plant and equipment 134,245 Intangible assets 59,691 Goodwill 38,449 Other assets 943 Bank overdraft (3,059) Accounts payable and accrued liabilities (52,142) Accounts payable and accrued liabilities (52,142) Accounts payable and accrued liabilities (52,142) Deferred income taxes (15,033) Subordinated loan (34,244) Long-term debt (81,907) Employee future benefits obligation (2,078) Employee future benefits obligation (2,078) Employee future benefits obligation (2,078)
Fair value of net assets combined 95,756
The current assets include accounts receivable with a fair value of $38,321, including accounts receivable under contracts whichrepresent a gross amount of $31,053. At the acquisition date, the best estimate of the contractual cash flows for which collectionis not expected is $45.
CO
NS
OL
IDA
TE
D F
INA
NC
IAL
ST
AT
EM
EN
TS

65
NOTES TO THE FINANCIAL STATEMENTS AS AT NOVEMBER 3, 2018(IN THOUSANDS OF CANADIAN DOLLARS, UNLESS OTHERWISE INDICATED)
The fair value of the consideration transferred is detailed as follows:
Acquisition ofthe year
Cash 47,878 Fair value of the initial 50% interest in the shares of the joint venture 47,878 Fair value of the initial 50% interest in the shares of the joint venture 47,878 Fair value of the initial 50% interest in the shares of the joint venture 47,878
Fair value of the consideration 95,756
Cash flows from combination:
2018
Bank overdraft assumed 3,059 Cash consideration 47,878 Redemption of subordinated loan from Agrifoods International Ltd. 17,122
Cash flows from business combination 68,059
BUSINESS COMBINATIONS IN 2017
On January 31, 2017, the Cooperative acquired frozen dairy product assets from Scotsburn Co-operative Services Limited("Scotsburn"), a dairy cooperative established in Nova Scotia.
The consideration transferred for this acquisition totalled $73,651.
As a result of this acquisition, the Cooperative now owns 100% of the shares of Reliant Transport Ltd. ("Reliant"), previously a jointventure.
Fair values that have been allocated to the combined assets and liabilities of Scotsburn and Reliant are based on acombination of independent valuations and internal estimates. Fair values of the consolidated net assets total $87,622 and,since they are higher than the price paid, this results in negative goodwill amounts. These differences, which amount to $13,971,were recorded in earnings as accounting gains as a result of business combinations. These gains are attributable to thesynergies, so the Cooperative will be able to further optimize the use of the combined assets.
The fair value of net assets combined is detailed as follows:
2017
Cash 2,655 Current assets 39,142 Investments 12,977 Property, plant and equipment 40,985 Property, plant and equipment 40,985 Property, plant and equipment 40,985 Intangible assets 14,741 Accounts payable and accrued liabilities (17,502) Accounts payable and accrued liabilities (17,502) Accounts payable and accrued liabilities (17,502) Deferred income taxes (4,750) Employee future benefits obligation (626) Employee future benefits obligation (626) Employee future benefits obligation (626)
Fair value of net assets combined 87,622
Current assets include accounts receivable with a fair value of $10,365, including accounts receivable under contracts whichrepresent a gross amount of $7,544. At the acquisition date, the best estimate of the contractual cash flows for which collectionis not expected is $175.
CO
NS
OL
IDA
TE
D F
INA
NC
IAL
ST
AT
EM
EN
TS

66
NOTES TO THE FINANCIAL STATEMENTS AS AT NOVEMBER 3, 2018(IN THOUSANDS OF CANADIAN DOLLARS, UNLESS OTHERWISE INDICATED)
The fair value of the consideration transferred is detailed as follows:
Acquisition ofthe year
Cash 57,470 Shares and certificates of indebtedness 16,056 Shares and certificates of indebtedness 16,056 Shares and certificates of indebtedness 16,056 Investment 125
Fair value of the consideration transferred 73,651
The business acquisition costs recognized in earnings during the year 2017 amounted to $653.
Cash flows from combinations:
2017
Cash acquired (2,655) Cash consideration 57,470
Cash flows from business combinations 54,815
4. EARNINGS
The following items are included in the consolidated earnings:
2018 2017 (53 weeks) (52 weeks)
Raw materials and other inputs 4,178,457 4,146,061 Salaries and employee benefits 745,574 682,212 Interest on long-term debt 44,674 32,554
The following items are included in the restructuring costs, integration and other non-recurring costs :
2018 2017 (53 weeks) (52 weeks)
Restructuring and severance costs 11,446 3,860 Integration and start-up costs 21,119 2,844 Other non-recurring costs 6,501 4,331
39,066 11,035
5. INCOME TAXES
The income tax expense is detailed as follows:
2018 2017 (53 weeks) (52 weeks)
Current income taxes (466) 2,900 Deferred income taxes 3,083 55,114
2,617 58,014
Comprised of:The Cooperative's income taxes (4,669) 8,972 Income taxes of subsidiaries 7,286 49,042
2,617 58,014
CO
NS
OL
IDA
TE
D F
INA
NC
IAL
ST
AT
EM
EN
TS

67
NOTES TO THE FINANCIAL STATEMENTS AS AT NOVEMBER 3, 2018(IN THOUSANDS OF CANADIAN DOLLARS, UNLESS OTHERWISE INDICATED)
Reconciliation of income taxes:
2018 2017 (53 weeks) (52 weeks)
Income taxes, calculated at Canadian statutory rates of 26.63% (2017 – 26.65%) 18,718 62,068 Differences attributable to the following:
Difference in tax rates of foreign subsidiaries (1,240) (1,080) Accounting gain as a result of a business combination (12,690) (3,689) Impact of change in deferred tax rates (1,130) - Changes in tax rates and provincial allocation (43) 45 Others (998) 670
Income taxes 2,617 58,014
The income tax consequences of temporary differences that result in deferred tax assets and liabilities are as follows:
Comprehensive October 29 income Business October 28 Earnings and Others combinations 2017 2016 Earnings and Others combinations 2017 2016 Earnings and Others combinations 2017 Earnings and Others combinations 2017
Deferred tax assetsGoodwill (30,114) - Goodwill (30,114) - Goodwill (30,114) 30,114 - 30,114 - - 30,114 - 30,114 - - - Tax losses carry forward 111,554 - Tax losses carry forward 111,554 - Tax losses carry forward 111,554 (111,554) - (111,554) - - (111,554) - (111,554) - - - Property, plant and equipment (68,444) - Property, plant and equipment (68,444) - Property, plant and equipment (68,444) 68,444 - 68,444 - - 68,444 - 68,444 - - - Intangible assets and other assets 14,334 - Intangible assets and other assets 14,334 - Intangible assets and other assets 14,334 (14,334) - (14,334) - - (14,334) - (14,334) - - - Accounts payable, accrued liabilitiesand others 9,844 - and others 9,844 - and others 9,844 (9,844) - (9,844) - - (9,844) - (9,844) - - -
37,174 - 37,174 - 37,174 (37,174) - (37,174) - - (37,174) - (37,174) - - - - - -
Deferred tax liabilitiesGoodwill 2,652 (23,133) Goodwill 2,652 (23,133) Goodwill 2,652 (28,409) (23,133) (28,409) (23,133) 663 (28,409) 663 (28,409) 663 663 (48,227) Tax losses carry forward 1,219 (22,082) Tax losses carry forward 1,219 (22,082) Tax losses carry forward 1,219 118,712 (22,082) 118,712 (22,082) - 118,712 - 118,712 - - 97,849 Employee future benefits obligation 9,812 33 Employee future benefits obligation 9,812 33 Employee future benefits obligation 9,812 (5,229) 33 (5,229) 33 166 (5,229) 166 (5,229) 166 166 4,782 Property, plant and equipment (22,907) (6,726) Property, plant and equipment (22,907) (6,726) Property, plant and equipment (22,907) (65,472) (6,726) (65,472) (6,726) (1,665) (65,472) (1,665) (65,472) (1,665) (1,665) (96,770) Intangible assets and other assets (48,816) (1,361) Intangible assets and other assets (48,816) (1,361) Intangible assets and other assets (48,816) 13,768 (1,361) 13,768 (1,361) (3,914) 13,768 (3,914) 13,768 (3,914) (3,914) (40,323) Outside basis difference on investmentin subsidiaries (1,219) (469) in subsidiaries (1,219) (469) in subsidiaries (1,219) - (469) - (469) - - - - - - (1,688) Accounts payable, accrued liabilitiesand others 10,611 (1,376) and others 10,611 (1,376) and others 10,611 9,912 (1,376) 9,912 (1,376) - 9,912 - 9,912 - - 19,147
(55,114) (48,648) (55,114) (48,648) 43,282 (55,114) 43,282 (55,114) (4,750) 43,282 (4,750) 43,282 (65,230) (4,750) (65,230) (4,750) (65,230) (65,230)
Total deferred tax assets (liabilities) (11,474) (55,114) (liabilities) (11,474) (55,114) (liabilities) (11,474) 6,108 (55,114) 6,108 (55,114) (4,750) 6,108 (4,750) 6,108 (65,230) (4,750) (65,230) (4,750) (65,230) (65,230)
CO
NS
OL
IDA
TE
D F
INA
NC
IAL
ST
AT
EM
EN
TS

68
NOTES TO THE FINANCIAL STATEMENTS AS AT NOVEMBER 3, 2018(IN THOUSANDS OF CANADIAN DOLLARS, UNLESS OTHERWISE INDICATED)
Comprehensive October 28 income Business November 3 Earnings and Others combinations 2018 2017 Earnings and Others combinations 2018 2017
Deferred tax assetsGoodwill - - - - -Tax losses carry forward - - - - -Property, plant and equipment - - - - -Intangible assets and other assets - - - - -Accounts payable, accrued liabilitiesand others - - - - -
- - - - -
Deferred tax liabilitiesGoodwill (48,227) (2,318) (205) - (50,750) Tax losses carry forward 97,849 (45,225) 13,515 18,609 84,748 Employee future benefits obligation 4,782 184 (196) 555 5,325 Property, plant and equipment (96,770) 50,898 (43) (21,538) (67,453) Intangible assets and other assets (40,323) (746) 24 (14,568) (55,613) Outside basis difference on investmentin subsidiaries (1,688) 1,341 - - (347) Accounts payable, accrued liabilitiesand others 19,147 (7,217) (6,086) 1,909 7,753
(65,230) (3,083) 7,009 (15,033) (76,337)
Total deferred tax assets (liabilities) (65,230) (3,083) 7,009 (15,033) (76,337)
On December 22, 2017, the US tax authorities enacted the "Tax Cuts and Jobs Act", which has been commonly referred to asthe US tax reform. Effective January 1, 2018, the US statutory federal income tax rate was reduced from 35% to 21%. The impactof this change in tax rate resulted in a reduction in the deferred tax liabilities and in the income tax expense of subsidiaries of$1,130.
The Cooperative has non capital loss carryforwards of $100,535 as well as other deductible temporary differences in capitalnature of $115,775 for which no deferred income tax asset is recognized. The non-capital losses have no expiry day.
No deferred income tax liabilities is recognized on unremitted earnings of $224,087 as at November 3, 2018 (2017 - $185,226)related to the investments in subsidiaries. Such unremitted earnings are reinvested in the subsidiaries and will not berepatriated in a foreseeable future.
6. PATRONAGE DIVIDENDS
Patronage dividends are paid out to members as follows: $16,150 (2017 – $16,178) in cash and $49,069 (2017 – $49,058) through the issuance of investment shares.
7. INVESTMENTS AND LOAN
2018 2017
Subordinated loan to a joint venture, bearing interest at a rate of 7.00% - 17,122 Others 9,014 158
9,014 17,280
CO
NS
OL
IDA
TE
D F
INA
NC
IAL
ST
AT
EM
EN
TS

69
NOTES TO THE FINANCIAL STATEMENTS AS AT NOVEMBER 3, 2018(IN THOUSANDS OF CANADIAN DOLLARS, UNLESS OTHERWISE INDICATED)
8. CASH FLOWS
Cash flows related to non-cash items have increased (decreased) as follows:
2018 2017 (53 weeks) (52 weeks)
Accounts receivable 130,903 (17,813) Inventories 46,771 (67,483) Income taxes (9,327) (19,866) Prepaid expenses 1,105 (4,604) Accounts payable and accrued liabilities (128,504) 130,676 Other assets (9,989) (14,246)
30,959 6,664
Income taxes paid are detailed as follows:
2018 2017 (53 weeks) (52 weeks)
Income taxes paid 8,686 23,342
The cash position is detailed as follows:
2018 2017
Cash 35,709 89,614 Bank overdrafts and lines of credit (26,535) (5,083)
9,174 84,531
9. INVENTORIES
2018 2017
Finished goods 598,249 649,091 Raw materials, goods in process and supplies 178,985 157,641
777,234 806,732
The cost of goods sold amounting to $5,838,863 (2017 – $5,488,917) is mainly composed of the amount of inventoriesaccounted for in expenses, including an impairment loss of $42,795.
CO
NS
OL
IDA
TE
D F
INA
NC
IAL
ST
AT
EM
EN
TS
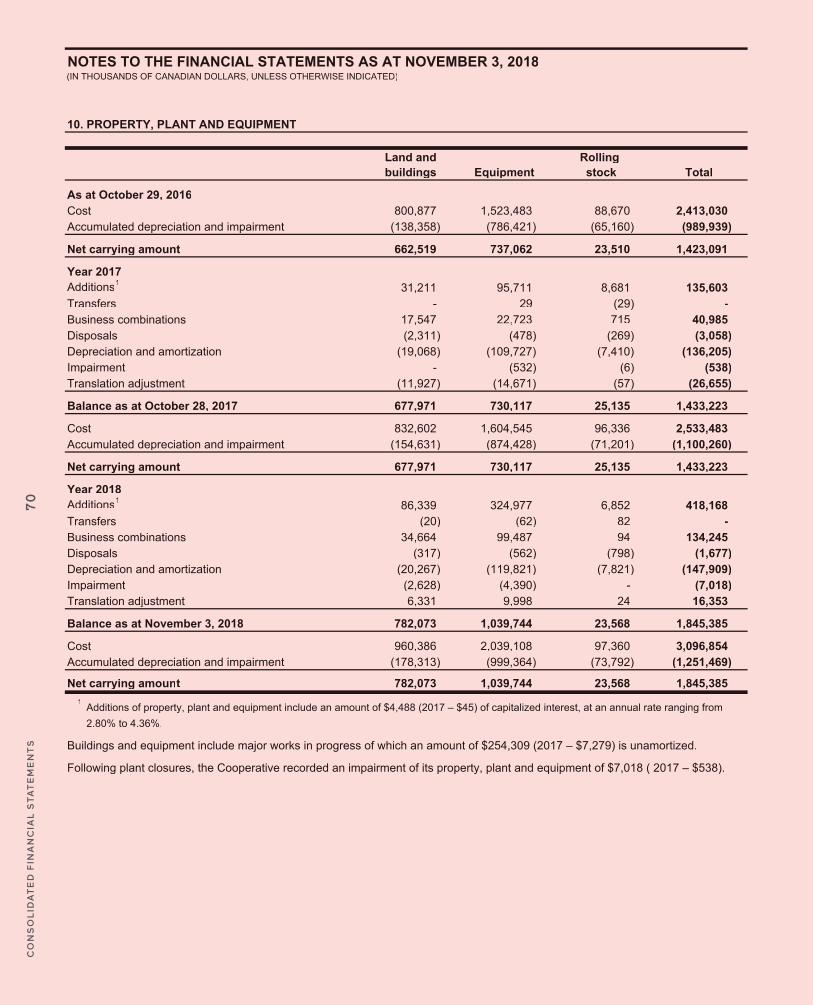
70
NOTES TO THE FINANCIAL STATEMENTS AS AT NOVEMBER 3, 2018(IN THOUSANDS OF CANADIAN DOLLARS, UNLESS OTHERWISE INDICATED)
10. PROPERTY, PLANT AND EQUIPMENT
Land and Rolling buildings Equipment stock Total
As at October 29, 2016Cost 800,877 1,523,483 Cost 800,877 1,523,483 Cost 800,877 88,670 1,523,483 88,670 1,523,483 88,670 88,670 2,413,030 Accumulated depreciation and impairment (138,358) (786,421) Accumulated depreciation and impairment (138,358) (786,421) Accumulated depreciation and impairment (138,358) (65,160) (786,421) (65,160) (786,421) (65,160) (65,160) (989,939)
Net carrying amount 662,519 737,062 Net carrying amount 662,519 737,062 Net carrying amount 662,519 23,510 737,062 23,510 737,062 1,423,091 23,510 1,423,091 23,510 1,423,091 1,423,091
Year 2017Additions1 95,711 31,211 95,711 31,211 8,681 95,711 8,681 95,711 8,681 8,681 135,603 Transfers - 29 Transfers - 29 Transfers - (29) 29 (29) 29 (29) (29) - Business combinations 17,547 22,723 Business combinations 17,547 22,723 Business combinations 17,547 715 22,723 715 22,723 715 715 40,985 Disposals (2,311) (478) Disposals (2,311) (478) Disposals (2,311) (269) (478) (269) (478) (269) (269) (3,058) Depreciation and amortization (19,068) (109,727) Depreciation and amortization (19,068) (109,727) Depreciation and amortization (19,068) (7,410) (109,727) (7,410) (109,727) (7,410) (7,410) (136,205) Impairment - (532) Impairment - (532) Impairment - (6) (532) (6) (532) (6) (6) (538) Translation adjustment (11,927) (14,671) Translation adjustment (11,927) (14,671) Translation adjustment (11,927) (57) (14,671) (57) (14,671) (57) (57) (26,655)
Balance as at October 28, 2017 677,971 730,117 Balance as at October 28, 2017 677,971 730,117 Balance as at October 28, 2017 677,971 25,135 730,117 25,135 730,117 1,433,223 25,135 1,433,223 25,135 1,433,223 1,433,223
Cost 832,602 1,604,545 Cost 832,602 1,604,545 Cost 832,602 96,336 1,604,545 96,336 1,604,545 96,336 96,336 2,533,483 Accumulated depreciation and impairment (154,631) (874,428) Accumulated depreciation and impairment (154,631) (874,428) Accumulated depreciation and impairment (154,631) (71,201) (874,428) (71,201) (874,428) (71,201) (71,201) (1,100,260)
Net carrying amount 677,971 730,117 Net carrying amount 677,971 730,117 Net carrying amount 677,971 25,135 730,117 25,135 730,117 1,433,223 25,135 1,433,223 25,135 1,433,223 1,433,223
Year 2018Additions1 324,977 86,339 324,977 86,339 6,852 324,977 6,852 324,977 6,852 6,852 418,168 Transfers (20) (62) Transfers (20) (62) Transfers (20) 82 (62) 82 (62) 82 82 - Business combinations 34,664 99,487 Business combinations 34,664 99,487 Business combinations 34,664 94 99,487 94 99,487 94 94 134,245 Disposals (317) (562) Disposals (317) (562) Disposals (317) (798) (562) (798) (562) (798) (798) (1,677) Depreciation and amortization (20,267) (119,821) Depreciation and amortization (20,267) (119,821) Depreciation and amortization (20,267) (7,821) (119,821) (7,821) (119,821) (7,821) (7,821) (147,909) Impairment (2,628) (4,390) Impairment (2,628) (4,390) Impairment (2,628) - (4,390) - (4,390) - - (7,018) Translation adjustment 6,331 9,998 Translation adjustment 6,331 9,998 Translation adjustment 6,331 24 9,998 24 9,998 24 24 16,353
Balance as at November 3, 2018 782,073 1,039,744 Balance as at November 3, 2018 782,073 1,039,744 Balance as at November 3, 2018 782,073 23,568 1,039,744 23,568 1,039,744 1,845,385 23,568 1,845,385 23,568 1,845,385 1,845,385
Cost 960,386 2,039,108 Cost 960,386 2,039,108 Cost 960,386 97,360 2,039,108 97,360 2,039,108 97,360 97,360 3,096,854 Accumulated depreciation and impairment (178,313) (999,364) Accumulated depreciation and impairment (178,313) (999,364) Accumulated depreciation and impairment (178,313) (73,792) (999,364) (73,792) (999,364) (73,792) (73,792) (1,251,469)
Net carrying amount 1,039,744 782,073 1,039,744 782,073 23,568 1,039,744 23,568 1,039,744 1,845,385 23,568 1,845,385 23,568 1,845,385 1,845,385 1 Additions of property, plant and equipment include an amount of $4,488 (2017 – $45) of capitalized interest, at an annual rate ranging from
2.80% to 4.36%.
Buildings and equipment include major works in progress of which an amount of $254,309 (2017 – $7,279) is unamortized.
Following plant closures, the Cooperative recorded an impairment of its property, plant and equipment of $7,018 ( 2017 – $538).
CO
NS
OL
IDA
TE
D F
INA
NC
IAL
ST
AT
EM
EN
TS

71
NOTES TO THE FINANCIAL STATEMENTS AS AT NOVEMBER 3, 2018(IN THOUSANDS OF CANADIAN DOLLARS, UNLESS OTHERWISE INDICATED)
11. INTANGIBLE ASSETS AND GOODWILL
Trademarks, Total Customer software and intangible
relationships other rights assets Goodwill
As at October 29, 2016Cost 140,223 311,461 Cost 140,223 311,461 Cost 140,223 311,461 311,461 1,065,463 451,684 1,065,463 451,684 1,065,463 1,065,463 Accumulated depreciation and impairment (63,867) (68,767) Accumulated depreciation and impairment (63,867) (68,767) Accumulated depreciation and impairment (63,867) (68,767) (68,767) (31,372) (132,634) (31,372) (132,634) (31,372) (31,372)
Net carrying amount 76,356 242,694 Net carrying amount 76,356 242,694 Net carrying amount 76,356 319,050 242,694 319,050 242,694 1,034,091 319,050 1,034,091 319,050 1,034,091 1,034,091
Year 2017Additions1 38,682 - 38,682 - 38,682 38,682 38,682 - 38,682 - 38,682 - - Business combinations 8,207 6,534 Business combinations 8,207 6,534 Business combinations 8,207 6,534 6,534 14,741 - 14,741 - 14,741 - - Depreciation and amortization (13,270) (19,087) Depreciation and amortization (13,270) (19,087) Depreciation and amortization (13,270) (19,087) (19,087) (32,357) - (32,357) - (32,357) - - Translation adjustment (2,516) (454) Translation adjustment (2,516) (454) Translation adjustment (2,516) (454) (454) (28,933) (2,970) (28,933) (2,970) (28,933) (28,933)
Balance as at October 28, 2017 68,777 268,369 Balance as at October 28, 2017 68,777 268,369 Balance as at October 28, 2017 68,777 337,146 268,369 337,146 268,369 1,005,158 337,146 1,005,158 337,146 1,005,158 1,005,158
Cost 142,472 343,626 Cost 142,472 343,626 Cost 142,472 343,626 343,626 1,035,335 486,098 1,035,335 486,098 1,035,335 1,035,335 Accumulated depreciation and impairment (73,695) (75,257) Accumulated depreciation and impairment (73,695) (75,257) Accumulated depreciation and impairment (73,695) (75,257) (75,257) (30,177) (148,952) (30,177) (148,952) (30,177) (30,177)
Net carrying amount 68,777 268,369 Net carrying amount 68,777 268,369 Net carrying amount 68,777 337,146 268,369 337,146 268,369 1,005,158 337,146 1,005,158 337,146 1,005,158 1,005,158
Year 2018Additions1 46,153 - 46,153 - 46,153 46,153 46,153 - 46,153 - 46,153 - - Business combinations 2,141 57,550 Business combinations 2,141 57,550 Business combinations 2,141 57,550 57,550 38,449 59,691 38,449 59,691 38,449 38,449 Depreciation and amortization (12,887) (22,874) Depreciation and amortization (12,887) (22,874) Depreciation and amortization (12,887) (22,874) (22,874) (35,761) - (35,761) - (35,761) - - Impairment - (364) Impairment - (364) Impairment - (364) (364) (364) - (364) - (364) - - Translation adjustment 810 266 Translation adjustment 810 266 Translation adjustment 810 266 266 13,105 1,076 13,105 1,076 13,105 13,105
Balance as at November 3, 2018 58,841 349,100 Balance as at November 3, 2018 58,841 349,100 Balance as at November 3, 2018 58,841 407,941 349,100 407,941 349,100 1,056,712 407,941 1,056,712 407,941 1,056,712 1,056,712
Cost 146,907 447,832 Cost 146,907 447,832 Cost 146,907 447,832 447,832 1,087,430 594,739 1,087,430 594,739 1,087,430 1,087,430 Accumulated depreciation and impairment (88,066) (98,732) Accumulated depreciation and impairment (88,066) (98,732) Accumulated depreciation and impairment (88,066) (98,732) (98,732) (30,718) (186,798) (30,718) (186,798) (30,718) (30,718)
Net carrying amount 349,100 58,841 349,100 58,841 407,941 349,100 407,941 349,100 1,056,712 407,941 1,056,712 407,941 1,056,712 1,056,712 1 Additions of intangible assets include an amount of $915 (2017 – $547) of capitalized interest at an annual rate ranging from 2.80% to 4.36%.
Software includes a major work in progress of which an amount of $20,181 (2017 – $40,944) is unamortized.
Following plant closures, the Cooperative recorded an impairment of its intangible assets of $364 (2017 – $0).
The carrying amount of goodwill is allocated to the reporting business units as follows:
2018 2017
Business sector – Canada Operations 318,185 279,649 Business sector – United States Operations 687,261 675,147 Business sector – Natrel United States 51,266 50,362
1,056,712 1,005,158
The impairment tests performed as at July 28, 2018 and July 29, 2017 did not result in the recognition of any impairment loss.
CO
NS
OL
IDA
TE
D F
INA
NC
IAL
ST
AT
EM
EN
TS

72
NOTES TO THE FINANCIAL STATEMENTS AS AT NOVEMBER 3, 2018(IN THOUSANDS OF CANADIAN DOLLARS, UNLESS OTHERWISE INDICATED)
12. OTHER ASSETS
2018 2017
Procurement agreements and others 65,133 35,304 Income tax credits receivable 18,442 14,947
83,575 50,251
13. BANK OVERDRAFTS AND LINES OF CREDIT
Bank overdrafts and lines of credit are detailed as follows:
2017 2018 2017 2018 2017 2017
Bank overdrafts 2,112 - Lines of credit 24,423 5,083
26,535 5,083
The Cooperative and its subsidiaries have lines of credit of a maximum of $59,884, bearing interest at variable rates generallynot exceeding the prime rate plus 1.50%. No assets of the Cooperative are pledged. In general, the Cooperative's lines of creditare renewable annually.
14. ACCOUNTS PAYABLE AND ACCRUED LIABILITIES
2018 2017
Members 92,313 140,182 Third parties 624,842 648,593 Joint ventures - 2,440
717,155 791,215
The decrease of the accounts payable to members as at November 3, 2018 compared to the previous year is mainly attributableto the milk payment calendar.
CO
NS
OL
IDA
TE
D F
INA
NC
IAL
ST
AT
EM
EN
TS

73
NOTES TO THE FINANCIAL STATEMENTS AS AT NOVEMBER 3, 2018(IN THOUSANDS OF CANADIAN DOLLARS, UNLESS OTHERWISE INDICATED)
15. LONG-TERM DEBT
2018 2017
Term loan (2018 – US$652,686 and 2017 – US$696,786) 1 849,104 889,602 Revolving term loan2 505,733 176,772 Revolving term loan (2018 – US$65,000 and 2017 – US$0) 2 85,182 - Obligation under finance lease3 300 368
1,440,319 1,066,742 Current portion 44,540 43,836
1,395,779 1,022,906
1 US dollar term loan bearing interest at an average variable rate of 4.36% and refundable at 5% per year on average until maturity inAugust 2022. The term loan is not secured by any of the Cooperative's assets and the Cooperative must meet certain financial ratioswhich are respected as at November 3, 2018.
As at November 3, 2018, the term loan was designated as hedge of a net investment in a foreign operation.2 Revolving term loan of $850,000, of which $590,915 is used as at November 3, 2018, bearing interest at a rate of 3.99% and repayable in
August 2022 if no request for an extension is submitted to the lenders and accepted by them. Should the remaining amount of the revolving term loan be used, the interest rate would not generally exceed the prime rate plus 1.50% or the US base rate plus 1.50%. The unusedportion of this loan is subject to standby fees. The revolving term loan is not secured by any of the Cooperative's assets.
As at November 3, 2018, an amount of US$65,000 (2017 – US$0) of the revolving loan was designated as hedge of a net investment in aforeign operation.
3 Obligation under finance lease, bearing interest at a rate of 3.85% and maturing in May 2022.
Principal repayments of the long-term debt to be made over the next years are as follows:
2019 46,314 2019 46,314 2019 46,314 2020 46,319 2020 46,319 2020 46,319 2021 46,325 2021 46,325 2021 46,325 2022 1,307,602 2022 1,307,602 2022 1,307,602
Reconciliation of long-term debt for the year:
2018
Long-term debt as at October 28, 2017 1,066,742 Long-term debt as at October 28, 2017 1,066,742 Long-term debt as at October 28, 2017 1,066,742
Long-term debt repayments1 (56,658) Variation of the revolving term loan 328,572 Variation of the revolving term loan 328,572 Variation of the revolving term loan 328,572 Long-term debt issuance expenses (507) Long-term debt issuance expenses (507) Long-term debt issuance expenses (507)
Total cash flow from long-term debt financing activities 271,407 Total cash flow from long-term debt financing activities 271,407 Total cash flow from long-term debt financing activities 271,407
Long-term debt acquired in a business combination 81,907 Long-term debt acquired in a business combination 81,907 Long-term debt acquired in a business combination 81,907 Amortization of long-term debt issuance expenses 1,706 Amortization of long-term debt issuance expenses 1,706 Amortization of long-term debt issuance expenses 1,706 Translation adjustment 18,557
Total non-cash long-term debt activity 102,170 Total non-cash long-term debt activity 102,170 Total non-cash long-term debt activity 102,170
Long-term debt as at November 3, 20182 1,440,319 1 Long-term debt repayments other than the revolving term loan.2 Net of capitalized issuance expenses of $6,241 (2017 – $7,740).
CO
NS
OL
IDA
TE
D F
INA
NC
IAL
ST
AT
EM
EN
TS

74
NOTES TO THE FINANCIAL STATEMENTS AS AT NOVEMBER 3, 2018(IN THOUSANDS OF CANADIAN DOLLARS, UNLESS OTHERWISE INDICATED)
16. OTHER LONG-TERM LIABILITIES
2018 2017
Deferred income tax credits 4,035 4,127
17. SHARE CAPITAL (in dollars)
The following constitutes a summary of certain privileges, rights and conditions related to the Cooperative's shares. Referencecan be made to the statutes of the Cooperative for the full text.
Voting rights are restricted to one vote per member. Each member subscribes to one member share, for a par value of $100.Furthermore, each member subscribes to 10 Class M investment shares, whether Series 1 for a par value of $20 each or Series 2 for a par value of $1,000, according to the membership application date. Other Class M investment shares series could be issued later, further to a resolution by the Board of Directors.
Class A investment shares are issued in consideration of patronage dividends. Should a minimum threshold of capital perhectolitre of produced milk fail to be reached, deductions shall be made from the cash payment of patronage dividends, from the redemption of capital, and from milk deliveries, where necessary. The minimum threshold of capital per member varies from $5 to $10 per hectolitre, according to the application date and can be modified by the Board of Directors on the same basis. The Class A investment shares can be transferred to auxiliary members and are also eligible, under certain conditions, for the Registered Retirement Savings Plan, the Cooperative Investment Plan, and tax deferral.
In the Cooperative's recent combinations with Farmers Co-operative Dairy Limited, Dairytown Products Ltd. andScotsburn Co-operative Services Limited, certificates of indebtedness were issued to former members of Farmers Co-operativeDairy Limited, Dairytown Products Ltd. and Scotsburn Co-operative Services Limited. Certificates of indebtedness, presented asan item of members' equity, can be transferred to auxiliary members and are not eligible for the Registered Retirement SavingsPlan, the Cooperative Investment Plan, and tax deferral.
Share capital is variable and unlimited as to the number of shares in each class, except for Classes B, C and D investmentshares, which are limited to 10 shares each. Member shares, Class A investment shares, as well as certificates of indebtednessare redeemable under certain conditions at their par value further to a resolution by the Board of Directors, depending onshort and long-term treasury needs.
On December 17, 2014, the Cooperative issued 4,700,000 first preferred shares, Series 1, for a par value of $100 each, for acash consideration of $470,000,000. These shares are entitled to an annual cumulative minimum dividend of 5.9% of the parvalue and payable semi-annually when declared by the Board of Directors. They do not have a maturity date and can beredeemed, in whole or in part, further to a resolution by the Board of Directors, under certain conditions, with effect since April 1, 2017.
On December 16, 2015, the Cooperative issued 3,000,000 first preferred shares, Series 2, for a par value of $100 each, for acash consideration of $300,000,000. These shares are entitled to an annual cumulative minimum dividend of 6.55% of the parvalue and payable semi-annually when declared by the Board of Directors. They do not have a maturity date and can beredeemed, in whole or in part, further to a resolution by the Board of Directors, under certain conditions, with effect from April 1, 2019.
CO
NS
OL
IDA
TE
D F
INA
NC
IAL
ST
AT
EM
EN
TS
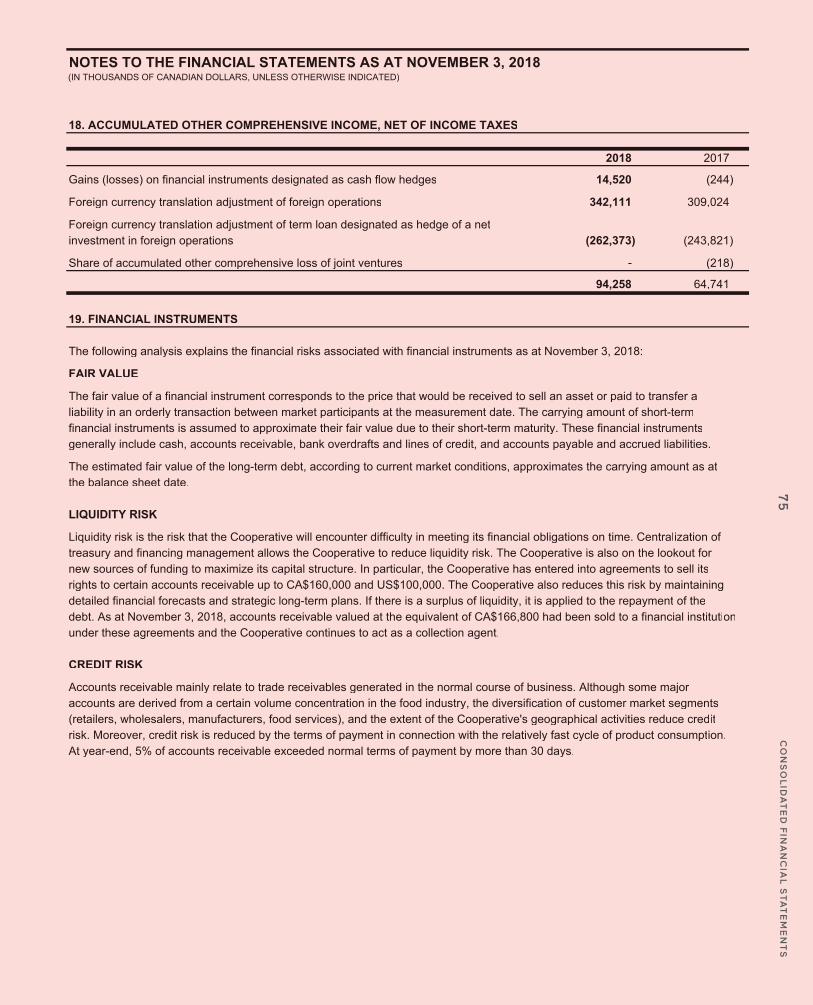
75
NOTES TO THE FINANCIAL STATEMENTS AS AT NOVEMBER 3, 2018(IN THOUSANDS OF CANADIAN DOLLARS, UNLESS OTHERWISE INDICATED)
18. ACCUMULATED OTHER COMPREHENSIVE INCOME, NET OF INCOME TAXES
2018 2017
Gains (losses) on financial instruments designated as cash flow hedges 14,520 (244)
Foreign currency translation adjustment of foreign operations 342,111 309,024
Foreign currency translation adjustment of term loan designated as hedge of a netinvestment in foreign operations (262,373) (243,821)
Share of accumulated other comprehensive loss of joint ventures - (218)
94,258 64,741
19. FINANCIAL INSTRUMENTS
The following analysis explains the financial risks associated with financial instruments as at November 3, 2018:
FAIR VALUE
The fair value of a financial instrument corresponds to the price that would be received to sell an asset or paid to transfer aliability in an orderly transaction between market participants at the measurement date. The carrying amount of short-termfinancial instruments is assumed to approximate their fair value due to their short-term maturity. These financial instrumentsgenerally include cash, accounts receivable, bank overdrafts and lines of credit, and accounts payable and accrued liabilities.
The estimated fair value of the long-term debt, according to current market conditions, approximates the carrying amount as atthe balance sheet date.
LIQUIDITY RISK
Liquidity risk is the risk that the Cooperative will encounter difficulty in meeting its financial obligations on time. Centralization oftreasury and financing management allows the Cooperative to reduce liquidity risk. The Cooperative is also on the lookout fornew sources of funding to maximize its capital structure. In particular, the Cooperative has entered into agreements to sell itsrights to certain accounts receivable up to CA$160,000 and US$100,000. The Cooperative also reduces this risk by maintaining detailed financial forecasts and strategic long-term plans. If there is a surplus of liquidity, it is applied to the repayment of thedebt. As at November 3, 2018, accounts receivable valued at the equivalent of CA$166,800 had been sold to a financial institutionunder these agreements and the Cooperative continues to act as a collection agent.
CREDIT RISK
Accounts receivable mainly relate to trade receivables generated in the normal course of business. Although some majoraccounts are derived from a certain volume concentration in the food industry, the diversification of customer market segments(retailers, wholesalers, manufacturers, food services), and the extent of the Cooperative's geographical activities reduce creditrisk. Moreover, credit risk is reduced by the terms of payment in connection with the relatively fast cycle of product consumption.At year-end, 5% of accounts receivable exceeded normal terms of payment by more than 30 days.
CO
NS
OL
IDA
TE
D F
INA
NC
IAL
ST
AT
EM
EN
TS

76
NOTES TO THE FINANCIAL STATEMENTS AS AT NOVEMBER 3, 2018(IN THOUSANDS OF CANADIAN DOLLARS, UNLESS OTHERWISE INDICATED)
INTEREST RATE RISK
Financial assets and financial liabilities do not bear interest, except for cash, bank overdrafts, lines of credit, and long-termdebt.
The Cooperative is exposed to cash flow risk associated with interest payments due to interest rate fluctuations on financialinstruments bearing interest at variable rates. With respect to long-term debt, an increase in the benchmark rate and preferentialrates could have a negative effect on cash flows; the impact would be positive with respect to its cash balances. In the case of adecrease in interest rates, the impact would be the opposite. The use of long-term debt is primarily related to businesscombinations.
To guard against the impact of interest rate fluctuations on a portion of the term loan, the Cooperative entered into interest rate swaps on July 10, 2017, for a term of 10 years. The notional amount of the swaps corresponds to US$275,000, and under theseinterest rate swaps, the Cooperative has agreed to exchange variable interest payments against fixed rate payments at specifiedintervals. In accordance with its risk management strategy, the Cooperative has designated these swaps as cash flow hedge ofinterest rate risk on the term loan.
As at November 3, 2018, the cash flow hedge of interest rate risk was assessed to be effective. An unrealized gain of $16,244(net of income taxes of $5,902) was recorded in other comprehensive income.
Sensitivity analysis for interest rate riskThe term loan is subject to market interest rate fluctuation risk. If the average interest rate had been higher by 1%, and assumingall other variables remained constant, earnings before patronage dividends and the Cooperative's income taxes would havedecreased by $12,596.
FOREIGN EXCHANGE RISK
The Cooperative carries on activities outside of Canada, mainly in the United States, via subsidiaries. Consequently, theCooperative is exposed to risks due to exchange rate fluctuations affecting its net investment in foreign subsidiaries.
As at November 3, 2018, if the US dollar had increased by $0.01 compared to the Canadian dollar, and assuming all othervariables remained constant, the impact of this increase on earnings before income taxes would have been marginal, and theimpact on comprehensive income would have resulted in an increase of $5,006.
The Cooperative also carries on certain purchasing and selling activities in foreign currencies. The Cooperative hedges againstforeign exchange risks for projected future transactions by means of currency forward contracts, mainly in US dollars and euros.Unrealized foreign exchange gains and losses are recorded initially in comprehensive income and reversed in earnings at the expiry of the contracts. As at the reporting date, the foreign exchange contracts, spread out over periods not exceeding one year,are as follows:
Purchases of US$19,128 against CA$Sales of US$2,266 against CA$Purchases of 8,005 euros against CA$Sales of 425 euros against CA$
US MARKET RISK
Milk prices as well as whey product and cheese prices in the United States depend on fluctuations in market supply and demand,influenced, among other things, by global economic conditions.
CO
NS
OL
IDA
TE
D F
INA
NC
IAL
ST
AT
EM
EN
TS

77
NOTES TO THE FINANCIAL STATEMENTS AS AT NOVEMBER 3, 2018(IN THOUSANDS OF CANADIAN DOLLARS, UNLESS OTHERWISE INDICATED)
MEASUREMENT RISK
Financial instruments recognized at fair value are classified according to the following hierarchy:
a) Level 1: Fair value based on quoted prices in active markets for identical assets.
b) Level 2: Fair value based on data observable either directly or indirectly, other than the quoted prices in Level 1.
c) Level 3: Fair value not based on observable market data.
Level 1 Level 2 Level 3 2018 Level 1 Level 2 Level 3 2018 Level 1 Level 2 Level 3 2018 2017
Interest rate swaps - 22,146 Interest rate swaps - 22,146 Interest rate swaps - - 22,146 - 22,146 - - 22,146 836 Foreign exchange contracts - 194 Foreign exchange contracts - 194 Foreign exchange contracts - - 194 - 194 - - 194 65 Commodity futures contracts (2,035) - Commodity futures contracts (2,035) - Commodity futures contracts (2,035) - - - - - - (2,035) (1,294)
The commodity futures contracts, mainly cheese futures contracts, designated as fair value hedges are of a nominal value of $39,858, and their maturities do not exceed 14 months.
20. COMMITMENTS AND CONTINGENCIES
a) Commitments relating to operating leases are as follows: $21,759 for the following year, $49,431 for 2020 to 2023,and $30,222 thereafter.
b) The Cooperative is committed for an amount of $89,033 to purchase property, plant and equipment and intangible assets aspart of major projects.
c) The Cooperative is party to litigations in the normal course of business. Even if the outcome of these litigations cannot beexpressed with certainty, the related liability is recorded when it is likely that it will result in a loss and the amount can beestimated. Furthermore, management estimates that the losses that could result from these litigations are negligible.
21. EMPLOYEE FUTURE BENEFITS
Employee future benefits relate mainly to pension plans. The obligations of the defined benefit plans are based on theemployee's length of service and salary of the last employment years. The pension benefits can be adjusted according to aformula based on the return on plan assets and the consumer price index. Actuarial valuations of the plans are performed everythree years. The most recent valuations were performed in December 2017.
The Cooperative also offers to certain employees other long-term benefits that provide for the payment of life insuranceand health insurance premiums for retirees. The Cooperative also has a deferred compensation plan covering a few employees.Other long-term benefits are not capitalized and are presented under other plans.
CO
NS
OL
IDA
TE
D F
INA
NC
IAL
ST
AT
EM
EN
TS

78
NOTES TO THE FINANCIAL STATEMENTS AS AT NOVEMBER 3, 2018(IN THOUSANDS OF CANADIAN DOLLARS, UNLESS OTHERWISE INDICATED)
The net expense is as follows:
2018 2017 (53 weeks) (52 weeks)
Defined contribution plansNet expense 26,296 23,049
Defined benefit plansCurrent service cost 5,486 6,625 Administrative costs 726 700 Past service cost (1,629) 573 Interest cost on accrued benefit obligation 10,364 9,267 Interest on asset ceiling impact 315 17 Projected return on plan assets (9,968) (8,101)
Net expense 5,294 9,081
The information on defined benefit plans is as follows:
2018 2017
Plan assetsFair value – Beginning of year 265,955 248,245 Business combination 14,792 - Administrative costs (726) (700) Projected return on plan assets 9,968 8,101 Employer contributions 4,010 9,047 Employee contributions 1,524 1,647 Benefits paid (14,429) (12,675) Actuarial gains (losses) (10,255) 12,290
Fair value – End of year 270,839 265,955
Equity securities represented 36% (2017 – 54%), obligations represented 25% (2017 – 34%) and buy-in annuities represented20% (2017 – 2%) of total plan assets invested mainly in Canada. The fair value is based on inputs other than quoted prices.
2018 2017
Accrued benefit obligationBalance – Beginning of year 272,994 283,120 Business combination 16,890 - Current service cost 5,486 6,625 Interest cost 10,364 9,267 Past service cost (1,629) 573 Employee contributions 1,524 1,647 Benefits paid (14,429) (12,675) Actuarial losses (gains) (13,262) (15,563)
Balance – End of year 277,938 272,994
CO
NS
OL
IDA
TE
D F
INA
NC
IAL
ST
AT
EM
EN
TS

79
NOTES TO THE FINANCIAL STATEMENTS AS AT NOVEMBER 3, 2018(IN THOUSANDS OF CANADIAN DOLLARS, UNLESS OTHERWISE INDICATED)
2018 2017
Pension plan obligationFunding status – Plan assets net of obligation (deficit) (7,099) (7,039) Impact of asset ceiling test (11,449) (8,749)
Pension plan obligation (18,548) (15,788)
Other plans (6,506) (7,639)
Employee future benefits obligation (25,054) Employee future benefits obligation (25,054) Employee future benefits obligation (25,054) (23,427)
For pension plans with an accrued benefit obligation that is in excess of the asset, the accrued benefit obligation is $137,299(2017 – $129,936) and the asset is $118,128 (2017 – $112,149).
Actuarial gains (losses) are accounted for in other comprehensive income and are as follows:
2018 2017
Actuarial gains for the year 3,118 27,853 Impact of asset ceiling test (2,385) (8,207)
Amount accounted for in other comprehensive income 733 19,646
Balance – Beginning of year (9,894) (29,540)
Balance – End of year (9,161) (9,894)
2018 2017
Weighted average assumptionsAccrued benefit obligation Discount rate (closing rate) 3.90% 3.60%Long-term inflation rate of salary expense 4.00% 4.00%Net benefit expense for the yearDiscount rate (opening rate) 3.60% 3.25%Long-term inflation rate of salary expense 4.00% 4.00%
The Cooperative participates in multi-employer defined benefit plans for certain unionized employee groups. Based on availableinformation, these plans are accounted for as defined contribution plans. Contributions for the year amounted to $5,783.
The Cooperative expects to make contributions of $6,932 to defined benefit plans in the next financial year.
SENSITIVITY ANALYSIS
The significant actuarial assumptions for the determination of the defined benefit obligation are the discount rate and the rate offuture compensation increase. The following table summarizes the effect of a change in these actuarial assumptions on thevalue of the defined benefit obligation as at November 3, 2018.
Change in Increase inassumption obligation
Decrease in discount rate 0.25% 10,585 0.25% 10,585 0.25% 10,585 Increase in long-term inflation rate of salary expense 0.25% 900 Increase in long-term inflation rate of salary expense 0.25% 900 Increase in long-term inflation rate of salary expense 0.25% 900
CO
NS
OL
IDA
TE
D F
INA
NC
IAL
ST
AT
EM
EN
TS

80
NOTES TO THE FINANCIAL STATEMENTS AS AT NOVEMBER 3, 2018(IN THOUSANDS OF CANADIAN DOLLARS, UNLESS OTHERWISE INDICATED)
22. RELATED PARTIES
SUBSIDIARIES AND JOINT VENTURES
The main subsidiaries and joint ventures of the Cooperative are as follows:
% ownedCountry of incorporation 2018 Country of incorporation 2018 Country of incorporation 2018 2017
Agropur inc. United States 100% 100%Agropur Export Group Inc. Canada 100% 100%Ultima Foods Inc. Canada 100% 50%
The main activities of these subsidiaries and joint ventures are milk processing and exportation of dairy products and foodingredients.
KEY MANAGEMENT PERSONNEL COMPENSATION
Key management personnel of Agropur cooperative are the members of the Board of Directors (15 seats) as well as the SeniorManagement Committee (12 positions). Key management personnel compensation is established by the Board of Directors,which is supported by a Human Resources Committee. This committee is composed of four members of the Board of Directors,namely the President, the Vice-President, the First and the Second Member of the Executive as well as the Guest member. Inaddition, the Chief Executive Officer and the Senior Vice-President, Human Capital attend the meetings. As well, an external firmoffering compensation consulting services, assists the committee in its work. The Human Resources Committee met four timesduring the year ended November 3, 2018. The purpose of the committee is to establish competitive total compensationto attract, motivate and retain employees the Cooperative needs to achieve its goals. To establish compensation for theBoard of Directors, a benchmarking exercise is conducted periodically with consumer goods companies with sales of morethan $1 billion. The remuneration of the Board of Directors is also periodically reviewed as to the amounts and method of compensation to reflect the responsibilities and risks associated with the Cooperative's role as a director.
2018 2017 (53 weeks) (52 weeks)
Board of DirectorsSalaries 1,117 1,098 Attendance fees 865 724
1,982 1,822
Senior Management CommitteeSalaries 6,939 6,573 Short-term and long-term incentive compensation 1,414 9,909 Post-employment benefits 1,434 1,602 Other benefits 182 130
9,969 18,214
Other benefits related to departures 922 Other benefits related to departures 922 Other benefits related to departures 922 6,001
12,873 26,037
Management compensation consists of base compensation, certain benefits and variable incentive compensation dependingon the financial performance of the Cooperative.
Variable incentive compensation has two components. The first part, which is short-term, is based on certain criteria relating tothe performance of the current year compared to the previous year as well as financial targets. A second part, which is long-term,is based on the value growth of the Cooperative over five-year cycles.
CO
NS
OL
IDA
TE
D F
INA
NC
IAL
ST
AT
EM
EN
TS

Agropur
Cooperative
HEAD OFFICE AND CANADA OPERATIONS
4600 Armand-Frappier Street Saint-Hubert, QC J3Z 1G5 Canada Tel.: 450-878-2333 Toll free: 1-844-878-2333
US OPERATIONS
3500 East Destination Drive Appleton, WI 54915 USA Tel.: 920-944-0990
agropur.com
Graphic design: Sid Lee Graphic production: M&H Production: Sid Lee Studio Photographer: Gaëlle Leroyer Writing: Exergue Communications and Larouche Consultant Translation: Analogos Printed in Canada
