the business case for reducing food … business case for reducing food loss and waste: catering a...
TRANSCRIPT

THE BUSINESS CASE FOR REDUCING FOOD LOSS AND WASTE: CATERINGA Report on Behalf of Champions 12.3
ABOUT THIS PUBLICATIONThis publication focuses on the financial business case for reducing food loss and waste in the catering sector. It is a supplement to The Business Case for Reducing Food Loss and Waste and provides additional sector-specific data and analyses. The Business Case for Reducing Food Loss and Waste was published in March 2017 and is available at www.champions123.org/the-business-case-for-reducing-food-loss-and-waste/.
AUTHORSAustin Clowes (WRI), Peter Mitchell (Head of Economics, WRAP), and Craig Hanson (WRI)
The authors thank Champions 12.3 and their associates for reviewing and providing helpful input on draft versions of this publication (see Acknowledgments).
THE BUSINESS CASE FOR REDUCING FOOD LOSS AND WASTE: CATERING | June 2018 | 1
S U M M A R Y F I N D I N G SWe analyzed data of preconsumer waste from 86 catering sites, located across 6 countries, and calculated the following results:
• The average benefit-cost ratio for food waste reduction was more than 6:1 over a three-year time frame.
• Within the first year of implementing a food waste-reduction program, 64 percent of the sites recouped their investment. Within two years of implementing a program, 80 percent of the sites recouped their investment.
• By reducing food waste, the average site saved more than 5 cents on every dollar of cost of goods sold (COGS).
• There appears to be no clear correlation between benefit-cost ratios and a site’s geography.
• Key strategies for achieving food waste reduction were to measure the food waste, engage staff, start small, reduce food overproduction, and repurpose excess food.
D I V I N G I N TO A S E C TO RContextAccording to available estimates, approximately one-third of all food produced in the world intended for human consumption is lost or wasted (FAO 2011). This level of inefficiency in the global food system has significant economic, social, and environmental impacts. It amounts to economic losses of $940 billion per year (FAO 2015). It means that more than a billion tons of food never get consumed each year, while one in nine people remain undernourished (WFP 2018). In addition, food loss and waste is responsible for an estimated 8 percent of annual greenhouse gas emissions; if it were a country, food loss and waste would be the third largest emitter after China and the United States (CAIT 2018; FAO 2015).
2 | CHAMPIONS 12.3
Reducing food loss and waste can generate a triple win: for the economy, for food security, and for the environment. But why is food loss and waste reduction not already being implemented at sufficient scale? Interviews with private-sector decision-makers indicate that one reason is that many managers may not be aware—or may not believe—that there is a solid business case for reducing food loss and waste. For instance, the associated costs of food loss and waste may be buried in operational budgets, accepted as the cost of doing business, or considered not worth the investment needed to achieve reductions.
According to The Business Case for Reducing Food Loss and Waste (Hanson and Mitchell 2017), there is a robust business case for companies to reduce food loss and waste. That publication analyzed historical data from nearly 1,200 business sites across 17 countries and more than 700 companies. These companies represented a range of sectors, including food manufacturing, food retail (for example, grocery stores), hospitality (for example, hotels), and food service (for example, canteens, restaurants). The analysis found that the median benefit-cost ratio was 14:1. Thus, for every $1 (or other relevant currency) invested in food loss and waste reduction, half of the surveyed company sites realized a $14 or greater return.
There is also a nonfinancial business case for reducing food loss and waste. Interviews with business leaders indicated that there are a number of strategic yet nonfinancial motivators. These relate to waste regulations, environmental sustainability, food security, stakeholder relationships, brand recognition, and a sense of ethical responsibility. Although these benefits may be hard to quantify in monetary terms, interviewees indicated that these nonfinancial reasons are an important part of the business case for action.
Since the launch of The Business Case for Reducing Food Loss and Waste, some private-sector managers have asked the authors what the financial business case looks like for specific sectors. “The 2017 publication gave a good overview across industry sectors, but we want to know what our sector looks like alone,” is a request periodically heard. This publication continues our effort to address this request, focusing on the catering sector. A publication focusing on hotels was published in April 2018, and additional future publications will focus on other sectors.
Methodology In this publication, we analyzed new data from catering operations with a level of granularity not available to the authors a year ago. This dataset includes catering operations
that include commercial corporate facilities, restaurants, hospitality, schools and universities, and government facilities. In total, we have data about food waste-reduction efforts from 86 catering sites across six countries. Based on these data, we calculated the benefit-cost ratios, cost reductions, payback periods, and investments made. We then conducted interviews with managers, including managers of the data providers from these catering sites, to identify what actions the sites took to reduce their food waste. We have illustrated real-world experiences via case studies, although it is not possible to guarantee that case study sites are included in the dataset for reasons of anonymity.
This publication is intended to supplement The Business Case for Reducing Food Loss and Waste. We encourage audiences to read that publication as well in order to have a holistic picture of business reasons for tackling this important issue.
BE N E F I T-C O S T R AT I O SBased on the suite of real-world, historical examples for which we could obtain both financial benefit and cost data, we estimated the benefit-cost ratios of taking action to reduce food loss and waste for caterers. A benefit-cost ratio is the ratio of financial benefits to financial costs attributable to the food loss and waste actions or program. Box 1 summarizes the methodology and dataset for the benefit-cost ratio analysis in this publication. While the analysis includes all catering sites for which data could be accessed, it is not possible to guarantee that these results are applicable to the entire catering sector or to any particular caterer. What we could access is a small dataset relative to all catering operations in the world. Therefore, be cautious when applying our results to other instances.
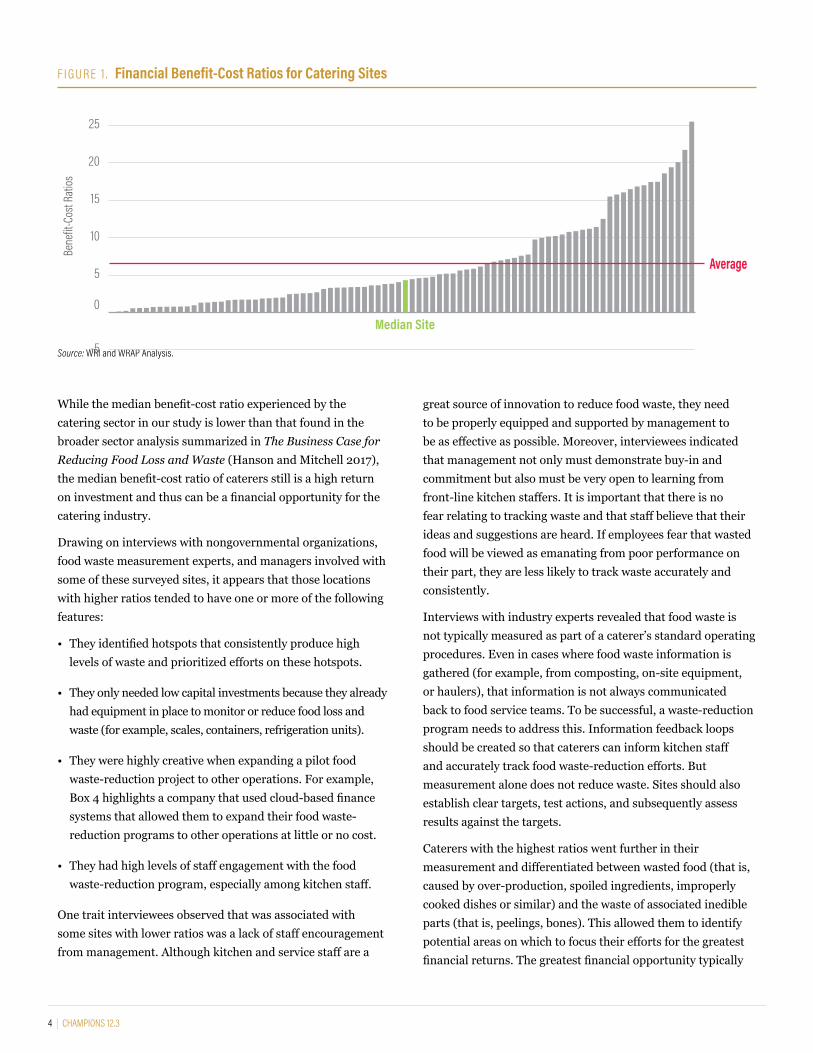
From the pool of data we could access, 85 percent of the sites analyzed had a net positive financial return; that is, a benefit-cost ratio greater than one-to-one (1:1). The median benefit-cost ratio—where half of the sites achieved a higher ratio while half achieved a lower ratio—was over 4:1 (Figure 1). Thus, for every $1 (or other relevant currency) invested in food waste reduction, half of the sites realized a $4 return or greater. Expressed in terms of return on investment (ROI), this is a greater than 300 percent return on investment.1 The average benefit-cost ratio was over 6:1.
Across the company sites analyzed, the ratios vary widely, from 0:1 to 25:1. There appears to be no clear correlation between benefit-cost ratios and geography.

THE BUSINESS CASE FOR REDUCING FOOD LOSS AND WASTE: CATERING | June 2018 | 3
The analyses of benefit-cost ratios have the following parameters:
• Benefits and costs. Our analyses factor in both the benefits and the costs of reducing food loss and waste. Costs include how much an entity pays to quantify where and how much food is being lost and wasted, identifying which actions it will take, and implementing those actions. This includes expenditures on consultants, equipment, staff training, and more. The benefits are the financial gains (that is, lower costs, additional revenue) from reducing food loss and waste. This includes optimizing food or raw material purchases (since more of what is purchased is consumed or used in a salable product), lowering waste collection and management costs, adding revenue by selling food that otherwise would have been unsold, and more.
To illustrate how we calculate a benefit-cost ratio, assume the following scenario: A caterer has baseline annual food sales of $3 million and food costs of $900,000. After one year of implementing a food waste-reduction program, annual food sales are still $3 million, but food costs are reduced by $27,000. When calculating the benefit-cost ratio for this time frame, the numerator (that is, benefit) would be $27,000. Suppose the caterer spent $5,400 on the food waste-reduction program. This amount is the denominator (that is, cost). The resulting benefit-cost ratio for this caterer would be 5:1.
• Individual entities. The benefit-cost ratios we developed are for individual business sites. We were able to access historical financial cost and benefit data for food waste-reduction efforts of 86 catering sites located across 6 countries: China, Ireland, Norway, Singapore, Sweden, and United Kingdom. Benefit and cost data in local currencies have been converted to current year U.S. dollars. Except where noted, the sources of the data points are treated anonymously to preserve commercial confidentiality.
• Historical data. Our analyses are based on actual field data, not pro forma calculations.
• Time period. For each site for which a benefit-cost ratio is calculated, we standardized the data provided to us by calculating the financial costs and the financial benefits cumulated over a three-year period. The three-year period for each site begins at implementation of a food waste-reduction program. Using a three-year time period enables us to capture the fact that for many sites, the majority of the costs occur in the first year and decline thereafter, while the financial savings start in the first year and continue each year thereafter. Usually there is a fixed investment cost occurring in the first year, followed by a smaller amount of annual recurring costs to maintain the program and monitor program implementation. Nonetheless, a three-year time horizon is conservative to the degree
that cost savings continue after year three with continued investment. For sites with less than three years of data, we assumed that the pattern of actual results from the most recent weeks for which data are available would continue. This assumption is based on historical data of benefit and cost cash flow patterns from sites with three or more years of data collection.
• Discount rate. The benefit-cost ratio is the ratio of the three-year cumulated discounted flow of financial benefits to the three-year cumulated discounted flow of financial costs. We apply a conservative 10 percent per annum discount rate.a
• Food waste measured. In this analysis, we assessed food waste generated in a site’s kitchen. This includes food and the associated inedible parts remaining from preparation, storage, and any leftovers thrown away by kitchen staff. The analysis includes neither food rescued (for example, given to charity) nor plate waste from customers (that is, any food that a customer does not finish from his or her plate). If food was diverted to another organization to feed people in need, it is outside the scope of this analysis because it is not food waste.
B O X 1 . Methodology for Quantifying Benefit-Cost Ratios
Notes: a. Ten percent is a conservative discount rate when compared with the average cost of capital for market sectors covered by the business sites in our dataset (see Appendix).
4 | CHAMPIONS 12.3
While the median benefit-cost ratio experienced by the catering sector in our study is lower than that found in the broader sector analysis summarized in The Business Case for Reducing Food Loss and Waste (Hanson and Mitchell 2017), the median benefit-cost ratio of caterers still is a high return on investment and thus can be a financial opportunity for the catering industry.
Drawing on interviews with nongovernmental organizations, food waste measurement experts, and managers involved with some of these surveyed sites, it appears that those locations with higher ratios tended to have one or more of the following features:
• They identified hotspots that consistently produce high levels of waste and prioritized efforts on these hotspots.
• They only needed low capital investments because they already had equipment in place to monitor or reduce food loss and waste (for example, scales, containers, refrigeration units).
• They were highly creative when expanding a pilot food waste-reduction project to other operations. For example, Box 4 highlights a company that used cloud-based finance systems that allowed them to expand their food waste-reduction programs to other operations at little or no cost.
• They had high levels of staff engagement with the food waste-reduction program, especially among kitchen staff.
One trait interviewees observed that was associated with some sites with lower ratios was a lack of staff encouragement from management. Although kitchen and service staff are a
great source of innovation to reduce food waste, they need to be properly equipped and supported by management to be as effective as possible. Moreover, interviewees indicated that management not only must demonstrate buy-in and commitment but also must be very open to learning from front-line kitchen staffers. It is important that there is no fear relating to tracking waste and that staff believe that their ideas and suggestions are heard. If employees fear that wasted food will be viewed as emanating from poor performance on their part, they are less likely to track waste accurately and consistently.
Interviews with industry experts revealed that food waste is not typically measured as part of a caterer’s standard operating procedures. Even in cases where food waste information is gathered (for example, from composting, on-site equipment, or haulers), that information is not always communicated back to food service teams. To be successful, a waste-reduction program needs to address this. Information feedback loops should be created so that caterers can inform kitchen staff and accurately track food waste-reduction efforts. But measurement alone does not reduce waste. Sites should also establish clear targets, test actions, and subsequently assess results against the targets.
Caterers with the highest ratios went further in their measurement and differentiated between wasted food (that is, caused by over-production, spoiled ingredients, improperly cooked dishes or similar) and the waste of associated inedible parts (that is, peelings, bones). This allowed them to identify potential areas on which to focus their efforts for the greatest financial returns. The greatest financial opportunity typically
Source: WRI and WRAP Analysis.
F I G U R E 1 . Financial Benefit-Cost Ratios for Catering Sites
-5
0
5
10
15
20
25
30
Average
Median Site
Bene
fit-C
ost R
atios

THE BUSINESS CASE FOR REDUCING FOOD LOSS AND WASTE: CATERING | June 2018 | 5
lies in reducing the amount of wasted food, but repurposing what may be considered inedible parts (for example, peelings) may provide an opportunity to capture further financial and nutritional value.
C O S T R E D U C T I O NOverall, food waste-reduction efforts in the surveyed sites were successful in lowering the amount of food waste. Caterers achieved an average 36 percent reduction of food waste by weight over a 12-month time frame. Over three years the average site reduced food waste by weight by 44 percent. In addition, many site managers prioritized reduction efforts on the basis of the likely economic gain from the reduction (versus an interest in reducing the total weight of waste). Put simply, the economic loss is greater when throwing away products that cost more per kilogram (for example, beef versus potatoes), and many managers prioritized reduction efforts accordingly.
According to interviewees, one way that site managers evaluate the financial effectiveness of their food waste-reduction efforts is to calculate how much the cost of food waste changed as a percentage of COGS (cost of goods sold), also referred to as “food spend.” To illustrate, suppose a caterer spends $100 procuring the food (for example, whole food, ingredients) it sells to customers, and the cost of what was thrown away in the kitchen is $5. Food waste therefore represents 5 percent of COGS. If the caterer implements a food waste-reduction
program that lowers the cost to $3, then the caterer achieves a 40 percent reduction in food waste in terms of monetary value, assuming its food spend is still $100. This equates to a 2 percentage point drop in the cost of food waste as a percent of COGS (that is, from 5 to 3 percent of COGS).
Figure 2 and Figure 3 summarize the results from the surveyed sites over the three-year implementation period for which this data is available. The average site saw a 56 percent reduction in the cost of food waste (Figure 2). Those sites with increases in the cost of food waste grew in size (that is, increased the total amount of food purchased and sold) enough to exceed any relative reduction in food waste. In other words, these sites may be wasting relatively less at the end of their implementation period, but the absolute value of waste may have increased due to business growth. The average site saw a more than 5 percentage point drop in food waste as a share of COGS (Figure 3). The median site saw a more than 4 percentage point drop. In other words, half of the sites saved more than 4 cents on every dollar of COGS.
PAYB A C K P E R I O D SWhen implementing food waste-reduction programs, most surveyed sites experienced the bulk of financial costs up front, followed by a steady stream of financial benefits over time. Costs included conducting food waste inventories, training staff on new food handling and storage procedures,
Source: WRI and WRAP Analysis.
F I G U R E 2 . Percentage Reduction in Food Waste (Monetary Value) over the Three-Year Implementation Period
-100%
-80%
-60%
-40%
-20%
0
20%
40%
60%
80%
Average
Median Site
Perc
enta
ge R
educ
tion
in Fo
od W
aste
(Mon
etar
y Valu
e)

6 | CHAMPIONS 12.3
Source: WRI and WRAP Analysis.
F I G U R E 3 . Percentage Point Drop in Cost of Food Waste as a Percentage of Cost of Goods Sold (COGS) over the Three-Year Implementation Period
-25%
-20%
-15%
-10%
-5%
0
Average
Median Site
Perc
enta
ge Po
int D
rop o
f Foo
d Was
te as
Shar
e of C
OGS
and redesigning menus. Benefits included reduced food costs (for example, buying less food due to reduced waste levels), increased revenue from new menu items (for example, turning leftovers or repurposing food which was previously discarded into new salable dishes), and lower waste management costs (for example, sending less food to a landfill via a waste management company).
With this timing of financial flows in mind, we calculated the payback period for each site, assuming a linear flow of financial benefits over three years (Figure 4). The payback period indicates how long a food waste-reduction program must operate before surpassing a 1:1 benefit-cost ratio. Within the first year of implementing a food waste-reduction program, 64 percent of the sites recouped their investment. Within two years, 80 percent of the sites surpassed a 1:1 benefit-cost ratio.
I N V E S T M E N T S M A D EThe food waste-reduction programs implemented by the surveyed sites were relatively inexpensive in terms of absolute dollars spent. Seventy-nine percent of sites were
able to keep their total investment in food waste reduction below $10,000 over the three-year period. Ninety-eight percent of sites were able to keep their total investment in food waste reduction below $15,000 over the three-year period (Figure 5). These costs consisted of purchasing smart scales or similar measurement technology and training staff in measurement and techniques to reduce waste. Many sites were able to keep their total investment low by embedding food waste measurement into their existing operating systems. Smart scales are tools installed in the kitchen that record the amount, composition, and value of food waste with an easy-to-use, customizable user interface. Examples of smart scales are tools sold or leased by the firms LeanPath and Winnow.
The waste reduction programs were inexpensive relative to annual food sales, as well. The average cost to invest in food waste reduction was only 1.6 percent of annual food sales. For context, these sites ranged from $40,000 to $3,100,000 in annual food sales. The average site in this subset had $900,000 in annual food sales (Table 1).
TA BL E 1 . Annual Food Sales per Site
Source: WRI and WRAP Analysis.
ANNUAL FOOD SALES
Number of Sites Low Median Average High
86 $40,000 $664,000 $881,000 $3,117,000

THE BUSINESS CASE FOR REDUCING FOOD LOSS AND WASTE: CATERING | June 2018 | 7
0
10
20
30
40
50
≥ 1510 to <155 to <100 to < 5
Num
ber o
f Site
s
Investment (US$ Thousand)
Source: WRI and WRAP Analysis.
F I G U R E 4 . Distribution of Payback Periods
0
10
20
30
40
50
60
≥3624 to <3612 to <240 to <12
Num
ber o
f Site
s
Payback (Months)
Source: WRI and WRAP Analysis.
F I G U R E 5 . Investment in Food Waste Reduction per Site

8 | CHAMPIONS 12.3
staff and to establish clear action plans to reduce waste. Gradually expanding the scope of the program allows adequate time for peer learning and can demonstrate its financial benefits over time. Even in companies that have widened the breadth of their food waste-reduction program to all or nearly all of their sites, innovative solutions to food waste can be piloted in a few key sites and later expanded. According to interviews, on-site kitchen staff often developed some of the most creative and effective strategies to combat waste, and management should encourage collaboration among sites via pilot programs and cross-site peer learning opportunities. Managers should also build rewards into a food waste-reduction program to drive desired behavior change and engagement among staff.
Management also needs to be creative when expanding the scope of a food waste-reduction program beyond its pilot phase and should adjust its speed and method of expansion to fit the company. Rolling out a program too quickly or slowly, with the wrong messaging to staff, or by assuming that all sites are the same can significantly reduce the financial benefits that a company sees from such a program. Box 3 and Box 4 provide examples of best practice when moving beyond the pilot phase.
4. Reduce overproduction. Many sites had at least one menu item that was consistently under-consumed. By simply producing smaller quantities of such items, sites were able to prevent waste without negatively affecting the customer experience. For example, if staff notice that very few customers eat a certain roasted vegetable dish and it is discarded at the end of shift, the site could reduce the amount of that dish that is produced. This would reduce waste without any change in consumer behavior. Many sites also became more diligent about a meal’s potential head count, which allowed kitchen staff and management to better forecast needs and reduce unnecessary overproduction. While head count accuracy may already be a goal for many sites, placing food waste reduction higher on the agenda of staff resulted in added emphasis on more accurate head counts, especially in a sector like catering that is susceptible to chronic over ordering.
5. Repurpose excess food. Because forecasting customer demand is not a perfect science, catering kitchens will find themselves with leftovers and potential wasted food. In these cases, having a Plan B for how to safely repurpose leftovers can allow the kitchen to generate revenue from
S T R AT E G I E S E M P LOYE DAlthough specifics varied among sites, interviewees pointed consistently to five types of actions they pursued to achieve successful food waste reduction:
1. Measure. Conducting a quantification of food waste generates a food waste inventory that enabled sites to identify how much and where food was being wasted. Such an inventory then helped managers prioritize hotspots to tackle and to monitor progress over time. All of the surveyed sites used smart scales and measurement systems. Box 2, Box 3, and Box 4 provide case examples of hotspot prioritization based on measurement. We cannot independently verify the figures in these case studies, which were provided by the featured sites themselves. Based on our interviews with food waste measurement experts, we recommend that sites use digital tools to measure their food waste. Manual measurement systems tend to underreport waste and thus may not capture all opportunities to reduce waste.
2. Engage staff. According to interviewees, staff engagement was a key variable that determined the success of a food waste-reduction program among the surveyed sites. Kitchen and service staff often want to help prevent food waste at work but need more definition and guidance from leadership. This guidance, for example, could come in the form of daily staff meetings, casual conversations, formal training, or even establishing peer learning opportunities. Management should also work to remove any perception of blaming staff for causing waste. If staff fear they will be blamed for wasting food, rather than rewarded for measuring it, staff engagement will quickly decline. Factors that make the efficacy or efficiency of staff engagement more difficult are menus that change frequently and high rates of staff turnover. Such factors can lead to cyclical patterns of waste wherein the reduction program works as intended for a period of time, but thereafter waste levels drift upward. To combat this, interviewees recommend that managers embed the importance of food waste prevention and tactics to achieve it into their standard training and operating procedures.
3. Start small and get creative. Pilot projects provided sites with an opportunity to test a food waste-reduction program on a small scale before rolling it out to other operations. Through a pilot phase, caterers were able to work through any potential issues with a small number of

THE BUSINESS CASE FOR REDUCING FOOD LOSS AND WASTE: CATERING | June 2018 | 9
B O X 2 . Sodexo Group B O X 3 . Compass Group UK & Ireland
Sodexo is the worldwide leader in Quality of Life services, with 427,000 employees in more than 80 countries. Sodexo has committed to eliminating avoidable waste to landfill by focusing on food waste prevention through its “WasteWatch powered by LeanPath” program. The WasteWatch program reduces site food waste by 50 percent, on average, and is planned to be rolled out across all client sites.
Achieving these results included the following key actions:
1. Measure. Management of food waste started with measurement. Waste management programs that measure waste have enabled client sites to reduce food waste significantly through better portion control and improved meal forecasting.
2. Increase employee and consumer awareness. Sodexo has tailored its messaging to its hourly employees. For example, educating hourly employees that the average family of four spends $1,500 a year on food that is never consumed is more relevant than talking about the water and energy that were used to produce that food. Tailored messaging improves staff engagement. WasteLESS Week is a Sodexo annual consumer engagement campaign around food waste prevention. Around 50 countries participate in the campaign every year to reduce consumer plate waste.
3. Collaborate with nonprofits. In the United States, Sodexo has collaborated with Food Recovery Network, Feeding America, and Campus Kitchens to connect surplus food to those in need. While this collaboration does not provide direct financial benefits from sales, it contributes to Sodexo’s goal of eliminating avoidable waste to landfill.
Compass Group UK & Ireland is the UK’s number one catering and support services provider. The company employs more than 60,000 people across staff restaurants, universities, schools, sports and leisure, defense, and offshore sites.
Compass Group UK & Ireland has been using Winnow’s digital tools since 2013 to measure and reduce food waste. Shifting from manually weighing waste, which was time consuming and inaccurate, the system has been rolled out to more than 250 sites. On average, sites have been able to reduce food waste by 50 percent by value over 12 months.
Achieving these results included the following key actions:
1. Measure. Compass sites track their waste with Winnow smart scales, which produce a daily report for chefs and managers. By comparing data across sites, Compass is also able to identify best practices and opportunities for peer learning. Digital measurement tools make measurement accurate and timely, enabling chefs to adjust production in order to reduce waste.
2. Engage staff. Compass focused on internal communications to help chefs and staff understand the rationale behind the food waste-reduction program and its associated benefits. This internal communications effort consisted of a series of webinars, case studies, and videos.
3. Start small. Compass started small. They trialed a food waste-reduction program in a few key sites and gradually expanded it. This gave necessary time to see the potential benefit for staff as well as the bottom line, and the program has greater staff engagement in new sites that have seen success from their peers. The Wellcome Trust, a global charitable foundation supporting scientists and researchers, was one of the first trial sites to start using a smart scale tool. Since the start of its food waste-reduction program in 2014, Wellcome Trust has reduced its total food waste by more than 70 percent. This represents a cumulative savings of 4.4 tons of food waste and 19 metric tons of CO2 emissions.

10 | CHAMPIONS 12.3
B O X 4 . BaxterStorey
BaxterStorey is a UK and Ireland–based catering company that provides food for a range of sectors. In 2014, BaxterStorey began implementing a food waste-reduction program that weighs, reports, and classifies food waste through its proprietary online accounting system. A total of 910 sites are now acting to reduce food waste.
To date, BaxterStorey has achieved a nearly 40 percent total reduction of food waste by value. This represents more than 4,700 tons of food waste saved from disposal. In addition to the direct financial benefits from wasting less and selling more food, this reduction has also saved sites nearly £2.5 million in disposal costs and more than £236,000 in energy costs.
Achieving these results included the following key actions:
1. Measure. BaxterStorey uses an innovative, proprietary measurement method that keeps its costs to a bare minimum. By building on its proprietary cloud-based accounting system to include food waste data, BaxterStorey measures food waste and its associated value across all of its sites. The company differentiates between wasted food and what is typically considered “prep” waste (for example, trimmings such as peels and rinds) to prioritize reduction efforts on the food component, which it considers more easily avoidable. Prior to project implementation, BaxterStorey wasted between 7 and 10 percent of food purchase volume, at a cost of between £5 million and £8 million per year. The company set a target of 3 percent waste (which is based on the UK industry average for unavoidable food waste like pits, seeds, and bones) and tracked progress via weekly food waste reports.
2. Start small and get creative. BaxterStorey first launched pilot projects across a selection of client locations to see how the program would work in its own operations. One large central London site reduced the cost of food waste by 82 percent in only six weeks, and the larger pilot increased profit margins by 6 percent and sales by 8 percent. BaxterStorey then leveraged its cloud-based accounting system to expand the food waste-reduction program to all sites. As a result of its pilot project, BaxterStorey found that categorizing its waste as either plate waste (that is, resulting from ineffective portion control), production waste (that is, resulting from overproduction), or spoilage waste (that is, resulting from incorrect storage or ordering) made the problem clear and actionable for staff. This categorization process that came from the pilot projects helped make the larger implementation period go smoothly.
3. Engage staff. BaxterStorey started by launching Green Flash, a series of short, interactive, peer-led training sessions each focusing on a specific aspect of food waste. This raised awareness among staff of the impacts of food waste while also providing best practice guidance on minimizing food waste across the business. When rolling out its program to all sites, BaxterStorey decided that autonomy should be given to the chef teams for how they would collect and measure the waste. This ensured that the teams were actively engaged in the project and that the project fit seamlessly into everyday kitchen operations without affecting cost or resources.
this potential waste. For example, unsold or leftover meat from breakfast may be a potential ingredient for a lunch or dinner dish. Sites that incorporated previously unused food (for example, peels, seeds, skins, bones) into dishes were able to produce value from items that typically go straight to the waste bin. For example, making soup stock from such items can cut down on costs if soup stocks were previously purchased and can create added value through
new soups and other dishes. While this analysis does not include any potential financial benefit from food donation, the authors urge caterers to offer edible, unsalable food to organizations that can distribute it to people in need, rather than throwing it away. Interviews indicate that donations also display corporate values and can increase employee participation in a food waste-reduction strategy.

THE BUSINESS CASE FOR REDUCING FOOD LOSS AND WASTE: CATERING | June 2018 | 11
A C A L L TO A C T I O NOur analyses find that there can be a strong financial business case for companies in the catering sector to reduce food waste within their operations. These findings should encourage managers in this sector to start seriously exploring what they can do to reduce food waste and reap the benefits. What then are next steps? We recommend that catering companies follow a three-step approach:
• Target. Targets set ambition, and ambition motivates action. Caterers should adopt a voluntary reduction target of 50 percent by 2030, which is aligned with Target 12.3 of the Sustainable Development Goals.
• Measure. What gets measured gets managed. Caterers should start to measure their food loss and waste and
monitor progress toward achieving the target over time. The Food Loss and Waste Accounting and Reporting Standard (FLW Protocol 2016) can help entities proceed with measurement. Leading companies are publicly reporting their food waste data, and we recommend that caterers begin to do so as well.
• Act. Action is what ultimately matters. Caterers—working alone and together—should take measures like those described in this publication to reduce food waste. A key success factor for action, as we discussed, is management engagement.
Target, measure, and act. If enough companies do this, the world will take a big step toward a future that improves financial performance, food security, environmental protection, and prosperity for all.

12 | CHAMPIONS 12.3
Source: Authors’ calculations for listed private-sector companies based on five-year financial performance data from NYU Stern Business School’s international data, accessible at: http://people.stern.nyu.edu/adamodar/New_Home_Page/data.html.
GLOBAL
Sector Number of businesses Average cost of equity Average cost of debt Average cost of capital
Beverage (Alcoholic) 212 8.6% 4.6% 7.8%
Beverage (Soft) 104 10.2% 4.6% 9.1%
Food Processing 1228 8.4% 4.6% 7.6%
Food Wholesalers 119 7.5% 4.6% 6.9%
Retail (Grocery and Food) 172 8.2% 4.6% 7.5%
Hotel/Gaming 651 9.2% 4.6% 8.3%
USA
Sector Number of businesses Average cost of equity Average cost of debt Average cost of capital
Beverage (Alcoholic) 22 7.9% 4.0% 7.1%
Beverage (Soft) 43 9.2% 4.0% 8.2%
Food Processing 89 7.6% 3.5% 6.8%
Food Wholesalers 14 6.6% 4.0% 6.1%
Retail (Grocery and Food) 17 8.5% 4.0% 7.6%
Hotel/Gaming 73 8.1% 3.5% 7.2%
EUROPE
Sector Number of businesses Average cost of equity Average cost of debt Average cost of capital
Beverage (Alcoholic) 51 7.2% 4.4% 6.6%
Beverage (Soft) 18 7.3% 4.4% 6.7%
Food Processing 156 8.2% 4.4% 7.4%
Food Wholesalers 13 6.4% 4.4% 6.0%
Retail (Grocery and Food) 31 10.8% 4.4% 9.6%
Hotel/Gaming 122 9.3% 4.9% 8.4%
EMERGING
Sector Number of businesses Average cost of equity Average cost of debt Average cost of capital
Beverage (Alcoholic) 117 10.3% 5.3% 9.3%
Beverage (Soft) 33 12.7% 5.3% 11.2%
Food Processing 815 96.0% 5.3% 8.7%
Food Wholesalers 53 8.7% 5.3% 8.0%
Retail (Grocery and Food) 61 9.6% 5.3% 8.8%
Hotel/Gaming 399 10.0% 5.3% 9.1%
A P P E N D I X

THE BUSINESS CASE FOR REDUCING FOOD LOSS AND WASTE: CATERING | June 2018 | 13
E N D N OT E S1 A benefit-cost ratio of 2:1 is equivalent to a 100 percent
return on investment (not a 200 percent return on investment as may be mistakenly believed). With a ratio of 2:1, the entity expends $1 of costs and receives $2 worth of benefits. The ratio is the same as a 100 percent return on investment. The investor invests $1 and receives $2 in return. The pure profit is $1 while the investment itself is another $1, thus the profit is 100 percent more than the investment.
R E F E R E N C E SCAIT (Climate Analysis Indicators Tool). 2018. “Historical Emissions.” http://cait.wri.org/historical. Accessed February 6.
FAO (Food and Agriculture Organization of the United Nations). 2011. Global Food Losses and Food Waste – Extent, Causes and Prevention. Rome: FAO.
FAO. 2015. Food Wastage Footprint & Climate Change. Rome: FAO.
FLW Protocol. 2016. Food Loss and Waste Accounting and Reporting Standard. Washington, DC: FLW Protocol.
Hanson, C., and P. Mitchell. 2017. The Business Case for Reducing Food Loss and Waste. Washington, DC: World Resources Institute.
WFP (World Food Programme). 2018. “Hunger Statistics.” https://www.wfp.org/hunger/stats. Accessed February 6.

ACKNOWLEDGMENTSThe authors thank selected Champions 12.3, their colleagues, and others not directly affiliated with Champions 12.3 for reviewing and providing helpful input on draft versions of this publication. The authors acknowledge in particular the following individuals for their thorough comments: Juan Carlos Altamirano (WRI), Neil Barrett (Sodexo), JoAnne Berkenkamp (NRDC), Helen Ding (WRI), Steven Finn (LeanPath), Katie Flanagan (WRI), Erika Galland (Sodexo), Mike Hanson (BaxterStorey), David Jackson (Winnow), JP Leous (WRI), Clemence Ollivier (Winnow), Kai Robertson (FLW Protocol), Andrew Shakman (LeanPath), Richard Swannell (WRAP), and Marc Zornes (Winnow).
The authors thank the public- and private-sector decision-makers and managers that they interviewed for this publication. In addition, the authors thank the companies that provided financial data on the benefits and costs of reducing food loss and waste from business operations. To the best of the authors’ knowledge, the corporate data compiled in this publication constitute a first-of-its-kind collection. The authors are very thankful to those providing this material; otherwise, the analysis would not have been possible. Much of the corporate material was made available under nondisclosure agreements, so in most cases the authors do not reveal the names of the companies.
The authors thank Caroline Taylor for copyediting, LSF Editorial for proofreading, and Romain Warnault for publication layout and design.
This publication represents the views of the authors alone.
Note: All tons are metric tons and all dollars are U.S. dollars, unless otherwise noted.
ABOUT CHAMPIONS 12.3Champions 12.3 is a unique coalition of more than three dozen leaders from around the world dedicated to inspiring ambition, mobilizing action, and accelerating progress toward achieving SDG Target 12.3.
Visit www.champions123.org for more information.
Copyright 2018 Champions 12.3. This work is licensed under the Creative Commons Attribution 4.0 International License. To view a copy of the license, visit http://creativecommons.org/licenses/by/4.0/.