the bullitt center experience: the light dynamic - measured performance ... meek.paper_.pdf · the...
TRANSCRIPT

THE BULLITT CENTER EXPERIENCE: THE LIGHT DYNAMIC – MEASURED PERFORMANCE OF LIGHTING AND DAYLIGHT SYSTEMS Christopher Meek1; Michael Gilbride1; Heli Ojaama1; Weston Norwood1
University of Washington1, Seattle, WA, USA ABSTRACT This paper presents measured daylighting, electric lighting, and lighting controls system performance data collected at the Bullitt Center, a 5016 m² (54,000 ft²) six-story office building in Seattle, WA (Bullitt, 2014). Bullitt Center is the largest urban office building to attempt to meet the Living Building Challenge (ILFI, 2014) which prescribes operating at net-zero energy performance. To meet this goal, the lighting system is designed to consume 67% less energy than a current similar-sized code-compliant Seattle office building. To achieve this goal while maintaining a high-quality luminous environment, the building is designed to use daylight as the primary source of illumination. For this to occur four critical goals must be met: (1) delivery of sufficient ambient daylight for effective luminous distribution and intensity to meet visual comfort criteria during daylight hours; (2) persistent control of direct sunlight and glare without substantially diminishing diffuse daylight performance; (3) electric lighting system capable of meeting minimum night-time illuminance criteria at a lighting power density (LPD) of less than 4.3 W/m² (0.4 W/ft²) (4) appropriate reduction of electric lighting system power consumption through manual and/or automated control. This paper aims to provide a comprehensive view of qualitative and quantitative daylight and electric lighting system performance to meet net-zero energy; and discusses design intent and measured outcomes in a range of sky conditions and times of year within a tenant suite.
Figure 1: Bullitt Center, Seattle, WA, 2013; Source: bullittcenter.org

BACKGROUND Since the year 2000, the University of Washington Integrated Design Lab (UW IDL) has partnered with regional energy efficiency organizations to support research and technical design assistance on new construction and major renovation projects in order to advance energy efficiency in the commercial building sector (Van Den Wymelenberg, et. al. 2013). Lighting in commercial buildings in the US consumes approximately 38% of site electricity and 20% of total site energy (EIA, 2009). For this reason, a substantial component of the UW IDL’s work has been in the areas of lighting, daylighting, glare control, and building envelope technology In this role, the UW IDL provided design and simulation assistance to the Bullitt project team with a focus on daylighting, solar control, and lighting power savings. Currently the UW IDL is located within the Bullitt Center and provides education and outreach regarding the building’s design, performance, and operations.
By April of 2013, most building tenants had moved into the Bullitt Center and completed most major interior tenant improvements. Since then the UW IDL has been actively documenting the performance of the building in meeting qualitative experiential objectives and quantitative energy performance goals. This includes detailed operational data collection for the daylighting system(s) and the electric lighting system(s) as part of monitoring net-zero energy performance. Given the total roof area available for photovoltaics, and the available solar resource, the annual energy use intensity (EUI) is limited to 57 kWh/m²-yr (18 kBtu/ft²-yr) (the annual expected production of the photovoltaic array) to meet net-zero energy use on an annual basis. Current whole building energy use data indicates an EUI of 28 kWh/m²-yr (9 kBtu/ft²-yr) with the building at approximately 85% occupied (Pena, 2014).
Figure 2: Energy Use of a typical (CBECS) office building compared to the predicted energy use of the Bullitt Center (UW Integrated Design Lab)
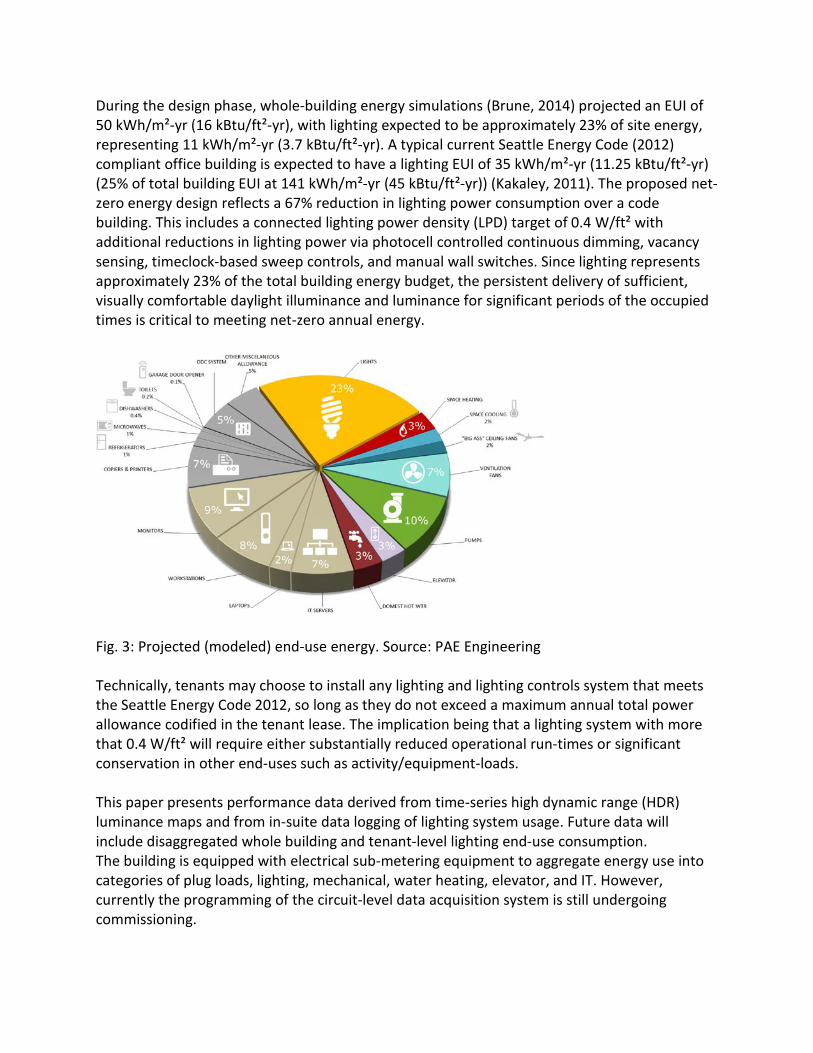
During the design phase, whole-building energy simulations (Brune, 2014) projected an EUI of 50 kWh/m²-yr (16 kBtu/ft²-yr), with lighting expected to be approximately 23% of site energy, representing 11 kWh/m²-yr (3.7 kBtu/ft²-yr). A typical current Seattle Energy Code (2012) compliant office building is expected to have a lighting EUI of 35 kWh/m²-yr (11.25 kBtu/ft²-yr) (25% of total building EUI at 141 kWh/m²-yr (45 kBtu/ft²-yr)) (Kakaley, 2011). The proposed net-zero energy design reflects a 67% reduction in lighting power consumption over a code building. This includes a connected lighting power density (LPD) target of 0.4 W/ft² with additional reductions in lighting power via photocell controlled continuous dimming, vacancy sensing, timeclock-based sweep controls, and manual wall switches. Since lighting represents approximately 23% of the total building energy budget, the persistent delivery of sufficient, visually comfortable daylight illuminance and luminance for significant periods of the occupied times is critical to meeting net-zero annual energy.
Fig. 3: Projected (modeled) end-use energy. Source: PAE Engineering Technically, tenants may choose to install any lighting and lighting controls system that meets the Seattle Energy Code 2012, so long as they do not exceed a maximum annual total power allowance codified in the tenant lease. The implication being that a lighting system with more that 0.4 W/ft² will require either substantially reduced operational run-times or significant conservation in other end-uses such as activity/equipment-loads. This paper presents performance data derived from time-series high dynamic range (HDR) luminance maps and from in-suite data logging of lighting system usage. Future data will include disaggregated whole building and tenant-level lighting end-use consumption. The building is equipped with electrical sub-metering equipment to aggregate energy use into categories of plug loads, lighting, mechanical, water heating, elevator, and IT. However, currently the programming of the circuit-level data acquisition system is still undergoing commissioning.

Figure 4: Tone mapped HDR image w/ false color luminance maps: day-time scene (only daylight)
Figure 5: Tone mapped HDR image w/ false color luminance maps: (b) Night-time scene (only ambient electric light w/ task lighting) 1. Daylighting Design The Bullitt Center was designed to provide sufficient ambient daylight illumination for general lighting requirements at the office suites and for unobstructed views to the exterior during the vast majority of operating hours. This is achieved through a combination of building massing,
window design and sizing, floor plate organization, and weather-responsive dynamic automated glare control. Creating daylight potential at all office areas was achieved through floor-to-floor heights of 4.4m (14’-6”) and through use of up-turned structural beams which allow glazing to reach the underside of the ceiling. The total window-to-wall ratio for the whole building is 40%, however, perimeter glazing at facades adjacent to critical visual task areas maintain an approximately 60% window-to-wall ratio (Source: Miller Hull Partnership, 2014). This ensures sufficient daylight illumination during overcast skies which are approximately 75% of operating hours in Seattle. Primary workstation areas are all within 7.3m (24’-0”) of the perimeter, or directly under a skylight (on the upper floor). High performance triple-pane (double low-e) mechanically operable windows allow for 51% visible light transmission (Tvis = 0.51) with a solar heat gain coefficient (SHGC) of 0.31 and an assembly U-value of 0.25. This configuration allows for daylight illuminance targets to be met throughout the building (Meek, 2012), though due to glazing/site orientation, glare potential from direct sunlight was found to be very likely throughout most of the year. This necessitated the inclusion of a robust glare control and shading system. 2. Shading and Glare Control System As indicated above, the significant inclusion of daylight in buildings holds tremendous potential to produce energy savings. However, lighting power savings are frequently under-realized, in large part due to building designs and patterns of occupant behavior that lead to blinds and roll-down fabric shades deployed in the “worst case scenario” position of blinds down and slats closed to maintain visual comfort. This essentially defeats the daylighting design intent. Manual systems of glare and solar shading can be very effective if properly used, however, they rely on continuous user adjustment to maintain glare control while achieving maximum daylight performance. A 2005 report on sidelighting (daylight illuminance from vertical windows) and photo controlled electric lighting systems produced by the Heschong Mahone Group (Heschong, 2005) identified blind use by building occupants as a significant contributor to low realized lighting power savings ratios relative to potential conservation from daylight. In overcast sky dominated climates such as Seattle, reductions in daylight performance from unnecessary blinds deployment can be particularly pronounced. This is because blinds, shades, and fixed shading devices can reduce daylight performance in the overcast by 80% or more. This is similarly the case when blinds are deployed when no direct beam sunlight is present (e.g. a west façade at 9am). For these reasons and for control of solar loads, an automated exterior venetian blind system was used that enables light diffusion, glare control, and solar shading; and, importantly, reverts to maximum unobstructed aperture area under overcast skies or during clear sky conditions on facades that are not receiving direct sunlight. Blind slat tilt-control and deployment schedules are pre-programmed based on annual solar exposure and triggered by a solar radiation sensor on the roof which deploys or retracts the shading system based on the sky condition. This system is intended to maximize daylighting performance in the overcast and unobstructed views to the exterior while providing complete sun control and diffuse daylight re-direction

during clear days (Meek, 2012). The exterior blind system was designed for floors 3 through 5, bud to an urban sidewalk condition with a zero-lot-line at floors 1 and 2, glare control is achieved with interior solar-powered venetian blinds with wirelessly controlled tilt motors and manual lift control. At floor 6, an interior roll-down fabric shade system was installed, since the upper floor is shaded by a 6m (20’-0”) overhang from the rooftop PV array. 3. Electric Lighting Design Daylight is intended to be the primary source of illumination during operating hours, and is therefore the central component of the daytime “scene.” However, a base level of illuminance must be maintained to facilitate visual comfort when the building is occupied after daylight hours, to provide supplementary illuminance where needed to perform visual tasks, and to provide focal points or other visual cues where desired. Since the building is a commercial office “shell and core” tenants are responsible for lighting design choices. Many tenants currently rely on electric lighting systems that deliver lower than conventional ambient illuminance (100-200 lux or less), with the inclusion of supplemental manually operated task lighting. This allows for some level of dark adaptation and perhaps reinforcement of the circadian cycle, providing a darker morning and evening experience, with daylight bringing ambient light levels to substantially higher illuminance levels (200-1000+ lux) during daylight hours.
Figure 6: Electric lighting control zones and operation within Suite 200.

4. Lighting Power Densities Lighting power densities are based on the proposed targets generated by the design team (Brune, 2014). The majority of the building is being built as core-and-shell for later tenant fit out. As such, the lighting power densities assumed represent lighting power budgets based on a feasible tenant lighting layout (Brune, 2014). Ambient lighting with proportional dimming is included for workstations within both the 4.5m (15’-0”) perimeter zone, and workstations within 9m (30’-0”) of the perimeter. In most suites, occupant controlled task lighting is provided. Task light energy is not included in the lighting power density allowance, though it is tracked via a plug-load management system. Fig. 7 summarizes the proposed lighting power densities and allowed ASHRAE 90.1-2004 densities. Figures 11 through 14 illustrate the assumed lighting schedules before daylight dimming, but with occupancy sensor control.
Space Type Lighting Power Density W/m2 (W/ft2)
Seattle Energy Code 2012*
ASHRAE 90.1 2010 Appendix G Bullitt Center Targets
Office 9.6 (0.9) (10.5) 0.98 4.3 (0.4)
Conference 9.6 (0.9) (13.2) 1.23 9.6 (0.9)
Restroom 9.6 (0.9) (10.5) 0.98 4.8 (0.45)
Mechanical Room 9.6 (0.9) (10.2) 0.95 7.4 (0.69)
Back of House MEP 9.6 (0.9) (10.2) 0.95 3.7 (0.34)
Parking 9.6 (0.9) (2.0) 0.19 3.0 (0.28)
Sun Room 9.6 (0.9) (7.9) 0.73 3.0 (0.28)
Stairs 9.6 (0.9) (7.4) 0.69 3.0 (0.29)
*SEC 2012 Building-area method for lighting power allowances Fig. 7: Lighting power densities: (a) Seattle Energy Code 2012, ASHRAE 90.1 2010, proposed at Bullitt Center. Source: PAE Engineering 5. Photo-Responsive and Other Lighting Controls Photo-responsive lighting control is required by the Seattle energy code subject to the following stipulations (SEC, 2012): “The area adjacent to vertical fenestration which receives daylight through the fenestration. For purposes of this definition and unless more detailed analysis is provided, the primary daylight zone depth is assumed to extend into the space a distance equal to the window head height and the secondary daylighted zone extends from the edge of the primary zone to a distance equal to two times the window head height or to the nearest ceiling height opaque partition, or to a partition that is more than 50% opaque, whichever is less. The daylight zone width is assumed to be the width of the window plus 2 feet (610 mm) on each side, or the window width plus the distance to an opaque partition, or the window width plus one-half the distance to adjacent skylight or vertical fenestration, whichever is least.” At the Bullet Center, most tenants have chosen to include all ambient lighting within a control zone, generally by façade orientation.

Figure 8: Expected lighting power consumption proposed at Bullitt Center: perimeter zones (within) 15’-0” of windows and core zones. Source: UW IDL All hard-wired electric lighting is subject to time-clock based sweep control. Electric lights that remain energized at 7pm are automatically de-energized unless the sweep is over-ridden by an occupant. Enclosed offices and conference rooms in tenant suites maintain vacancy sensing (manual ON/auto OFF). Common areas include comprehensive photo controls, with occupancy sensing (auto ON/Auto OFF). 6. Task Lighting Task lighting is provided at most workstations to provide targeted levels of higher horizontal illuminance based on user need or preference. Task lights are lamped with a single 6W LED screw-base lamp in a conventional adjustable arm task fixture, with manual ON and scheduled OFF (via programmable plug-strips) or OFF via vacancy-sensing controls. Furthermore, the task lights are used to signal to a digital plug-load management system that a workstation is occupied. To avoid “phantom” loads, the digital plug load management system has been programmed to de-energize all receptacles in a workstation when the total power draw of the workstation is less than 3W. By temporarily energizing the task light, the plug load management system is informed that a workstation is occupied. Therefore, task lighting is often briefly illuminated at the beginning of each work day. METHODS 1. HDR Time Series Luminance Data To capture and quantify changes in luminance distribution due to variable daylight illuminance, electric lighting, controls, and task lighting HDR images of a suite are captured at 15 minute intervals over one year. A digital single-lens reflex (SLR) camera with remote computer control and a 180 degree hemispherical lens was placed to capture a typical office scene, including

workstations, perimeter windows, skylights, venetian blinds, and the electric lighting system. The resulting images were processed into high dynamic range (HDR) images using Photosphere (Ward, 2013). Here, a standard luminance scale (10 – 2500 cd/m2) was set and false color luminance maps were generated. Images have been captured in approximately 10 stops for a 11 hour period, weekly at 15 minute intervals. This process has been partially automated through the use of DSLR Remote Pro, Python, HDR Gen (Ward, 2013), Apple Script, and Photoshop. This data collection is on-going. 2. Exterior Horizontal Radiation Daily weather data including solar radiation, temperature and relative humidity for period of study is downloaded from a rooftop weather station at the Bullitt Center (UW IDL, 2014). This data is used to identify periods of cloud cover, periods of direct sunlight is present, and relative intensity of outdoor illumination. This offers a proxy for daylight availability, and is the primary sensing point for control of the automated shading system which is programmed to eliminate all direct sunlight penetration while providing maximum duration of views to the exterior.
3. Electric Lighting System Usage (Ambient) To quantify lighting energy saved as a result of effective daylighting, photo-responsive dimming, and human behavior, a data logger capable of measuring illuminance has been placed adjacent to an ambient light fixture within the ambient lighting controls zone. The data logger was programmed to log illumination levels (foot-candles/lux) at 15 minute intervals to sense the activation and intensity of the electric lighting system. The illumination data was calibrated to measured minimum and maximum electric light output to maintain consistent results, and thereby documents photo-responsive dimming as well as manual activation and shut-off of the lighting system. 4. Task Lighting Task light usage data was collected in instantaneous watts using a comprehensive digital plug load management system which tracks all devices within the suite. Task lights are assigned to a dedicated receptacle allowing for tracking of task lighting use at the workstation and suite level. Data presented includes total task lighting wattage (in W/hr) at 15 minute intervals. 5. Workstation and Window Illuminance Data loggers were placed at workstations to collect horizontal illuminance data at 15 minute intervals. Further, a data logger measuring horizontal illuminance have been placed adjacent a typical window within the suite to measure exterior light levels. Data loggers placed at three workstations measure illuminance levels at varying distances from the window. Workstations 1 and 2 are within the perimeter zone, 1.8m (6’-0”) and 4.2m (14’-0”) feet from the window respectively, while Workstation 3 sits well within the interior zone, 10.3m (34’-0”) feet from the window. Note that Workstation 2 is located directly below a bank of skylights.

RESULTS We have identified four representative days that capture typical patterns of lighting system operation: (1) A winter clear day (4 Dec 2014); (2) a winter overcast day (18 Dec. 2014); (3) a summer clear day (1 July 2014); and (4) a summer overcast day (27 June 2014). For each day we provide data at 15 intervals for: (1) Horizontal maintained (target minimum) illumination at 300 lux; (2) horizontal exterior radiation in W/m2; (3) ambient light output. Furthermore, we have indicated fractional lighting power savings through automated dimming; and periods when ambient electric lights have been manually de-energized or were never energized at initial morning occupancy. This data is presented with hourly hemispherical false color luminance maps of a typical workstation to indicate the luminous intensity of the interior lighting scene within the suite showing all light sources through the course of the day. Concurrently, we present the cumulative wattage of all task lighting energized within the suite at each 15 minute interval.
Winter Clear Day (4 Dec 2014)
Winter Overcast Day (18 Dec 2014)
Summer Clear Day (1 July 2014)
Summer Overcast Day (27 June 2014) Figure 9: Comparative luminance ranges within Suite 200, summer and winter, overcast and clear sky conditions. 8am -5pm. Source: UW IDL

1. Winter Clear Day (4 Dec 2014) (Overcast from 9am-11am)
1.1 Ambient daylight and electric lighting On December 4th the sun rises at approximately 8:00am. The office is occupied at approximately 9:00am, and electric lighting is energized via manual wall switch at 9:00am. At 9:45am sufficient daylight illuminance is present to cause the photo-sensor to send a dimming signal to reduce ambient electric light output by approximately 40% in order to maintain 300 lux. At approximately 10:30am, the ambient electric lighting system is manually de-energized. This coincides with the transition from an overcast sky to a clear sky condition. Daylight provides all ambient illuminance from this point until approximately 4:00pm when electric lighting is manually re-energized via wall switch. This is likely due to ambient lighting falling below the 50 lux range. Electric lighting remains at full light output until 6:00pm when the office is unoccupied. Approximately 80% of ambient lighting power is saved relative to a continuously energized ambient lighting system on during all occupied times. 95% of the total savings are due to user behavior (manual OFF at the wall switch) and 5% are realized through automated daylight-responsive dimming.
1.2 Task Lighting Use Task lighting usage peaks during the morning overcast sky period, notable when the ambient electric lighting system is energized at full light output and drops off significantly after 10:00am as clear skies begin to prevail. Use of task lighting diminishes significantly during clear sky hours increasing slightly through approximately 5:00pm and trails off as occupants depart at the end of the work day.

2. Winter Overcast Day (18 Dec 2013)
2.1 Ambient daylight and electric lighting On December 18th at 7:30am, the office is occupied and the ambient lighting is energized via manual wall switch. The sky condition is overcast and the ambient lighting remains energized for the entirety of the day. Daylight illuminance reaches the minimum threshold to cause a photo-dimming sensor to activate, regulating the output of the ambient lighting system, reducing light output, and saving lighting power throughout the day. Approximately 30% of ambient lighting power is saved relative to a continuously energized ambient lighting system on during all occupied times. 100% of these savings are due to automated daylight-responsive dimming.
2.2 Task Lighting Use Task lights are used extensively throughout the day. The total task wattage is a proportional to the number of occupants using the space, which experiences peak occupancy from 9am-noon.

3. Summer Clear Day (1 Jul 2014)
3.1 Ambient daylight and electric lighting On July 1st the sun rises at 5:15am and the office is occupied at 9:00am. Daylighting is sufficient throughout the day, and as such, the ambient electric lighting system is never energized. Effective daylighting paired with human behavior results in 100% savings on ambient lighting energy. 100% of ambient lighting power is saved relative to a continuously energized ambient lighting system on during all occupied times. 100% of these savings are due user behavior (the lighting system is never energized).
3.2 Task Lighting Use Task lighting is turned on to activate the plug load management system and used minimally throughout the day. One particular occupant energizes his task light whenever he is in the space.

4. Summer Overcast Day (27 Jun 2013)
4.1 Ambient daylight and electric lighting On June 27th, the office is occupied and the ambient lighting is energized via manual wall switch at 7:00am. The sky condition is overcast and the ambient lighting remains energized for the entirety of the day. Daylight illuminance reaches the minimum threshold to cause a photo-dimming sensor to activate, regulating the output of the ambient lighting system, reducing light output, and saving lighting power throughout the day. Approximately 50% of ambient lighting power is saved relative to a continuously energized ambient lighting system on during all occupied times. 100% of these savings are due to automated daylight-responsive dimming.
4.2 Task Lighting Use Task lights are used extensively throughout the day. The total task wattage is a proportional to the number of occupants using the space, which experiences peak occupancy from 9am-noon.
DISCUSSION Operational energy savings from lighting stem from reduced lighting power density and robust lighting controls. In spaces that are continually occupied, the primary mechanism for reducing
lighting power consumption are manual switching to OFF, and automated daylight responsive dimming. Both of these methods require a robust and high-quality daylight contribution. In the suite we investigated, on clear days the primary savings were realized via occupant’s manual switching the lighting system OFF, or the lights never being energized during long summer days. During overcast days, the primary source of lighting power savings was automated daylight-responsive dimming. This may be because in Seattle during the summer (when most clear days tend to occur), the space is well daylit at the beginning of occupancy around 9am since the sun rises well before 6am. Conversely during the winter, the electric lights must be energized first thing in the morning since it is still dark at the beginning of the day- and lights remain on until dimmed by the automated dimming system, unless or until manually switched off buy occupants. In the space, the daylight illuminance provide a significantly greater contribution to the interior illuminance and luminance than the electric lighting system. In fact, the suite documented had no ambient lighting system from April 2013 through September 2013, with no disruption to operational performance. Building designers have an opportunity to fundamentally re-think the nature of light and lighting design for interior spaces. The Bullitt Center offers a model for indoor illuminance that is dynamically illuminated with daylight where very low power electric lighting provides a base-level of operating illuminance and daylight provides continuous variability and increased general illuminance in synch with the outdoor rhythm of light. At its core, this approach comprises the intentional development of distinct day-time and (lower light level) night-time scenes. A combination of sensing and control mediates a smooth transition between these states, while the inclusion of task lighting ensures sufficient illuminance per individual user preference and dynamic glare control provide persistent visual comfort without user input. In a sense, each source plays to its strength. Daylight and views promote health, and inherently support dark adaptation. Automated blind control promotes persistent daylight illuminance while maximizing views to the exterior. Electric light supports minimum visual performance requirements and provides consistent focal points where needed. Task lighting allows for localized high levels of illuminance when deemed necessary by occupants. The Bullitt Center is among the most energy efficient buildings in the world (WAN, 2014). It consumes 75% less lighting power than a current codes building in Seattle, yet it does so while providing a high-quality visual environment by using daylight as a primary source of illumination and providing continuous automated glare control and proportional daylight dimming combined with significant occupant control of the ambient and task lighting system. ACKNOWLEDGEMENTS Portions of this work were funded by the Northwest Energy Efficiency Alliance (NEEA). The authors would like to thank Dr. John Shaufelberger, Dean of the University of Washington College of Built Environments and Professor David Miller, Chair of the Department of Architecture for their ongoing support of this project. We would additionally like to thank Professor Joel Loveland and the University of Washington Integrated Design Lab for space and

operational support and the Miller Hull Partnership and PAE Consulting Engineers for their collaboration.
REFERENCES Brune, Marc (2015) “The Bullitt Center Experience: Modeling and Measuring Net Zero Energy,” Building
Enclosure Science and Technology Conference BEST4, St. Louis, MO, April 2015 (Draft) Bullitt Center. (2014) Seattle, WA. www.bullittcenter.org Retrieved December 15, 2014 Heschong, L., (2005). Sidelighting Photocontrols Field Study; Southern California Edison, Pacific Gas and
Electric, Northwest Energy Efficiency Alliance, Technical Report. Hanford, Jim (2015) “The Bullitt Center Experience: Building Enclosure Design in an Integrated High
Performance Building,” Building Enclosure Science and Technology Conference BEST4, St. Louis, MO, April 2015 (Draft)
International Living Future Institute (ILFI). (2010). Living Building Challenge Version 2.0.
https://ilbi.org/lbc/standard , Retrieved October 15, 2011 Kakaley, Alan., (2011) Report to Seattle City Light (SCL) on Expected Energy Performance of New
Construction Office Buildings under Seattle Energy Code 2010 Meek, C., Bruot, A., and Caldwell, L. (2012) “Simulation of Dynamic Daylighting and Glare Controls
Systems for a Six-Story Net-Zero Energy Office Buildings in Seattle, WA,” Building Enclosure Science and Technology Conference BEST3, Atlanta, GA, April 2012
The Miller Hull Partnership. Seattle, WA. www.millerhull.com
PAE Consulting Engineers (2010), Portland, OR. www.pae-engineers.com
Pena, Robert (2014) “Living Proof: Seattle’s Net Zero Energy Bullitt Center,” American Solar Energy Society conference, San Francisco, July 2014
U.S. Energy Information Administration (EIA). (2009). Lighting In Commercial Buildings; US DOE.
Retrieved October 6, 2011 from http://www.eia.gov/emeu/cbecs/cbecs2003/lighting/lighting1.html UW IDL (2014) IDL Weather Station:
http://www.wunderground.com/weatherstation/WXDailyHistory.asp?ID=KWASEATT182 Ward, G. (2003). The RADIANCE 3.5 Synthetic Imaging System. Retrieved February 22, 2010 from
http://radsite.lbl.gov/radiance/refer/ray.html K. G. Van Den Wymelenberg, G. Z. Brown, H. Burpee, E. Djunaedy, G. Gladics, J. Kline, J. Loveland, C.
Meek, and H. Thimmanna, (2013) “Evaluating direct energy savings and market transformation effects: A decade of technical design assistance in the northwestern USA,” Energy Policy, vol. 52, no. 0, pp. 342–353

http://www.bullittcenter.org http:/www.joelrogers.photoshelter.com http:/www.djc.om
www.idlseattle.com
© UW Integrated Design Lab, 2015
THE BULLITT CENTER EXPERIENCE: THE LIGHT DYNAMIC – MEASURED PERFORMANCE OF LIGHTING AND DAYLIGHT SYSTEMS Christopher Meek; Michael Gilbride1; Heli Ojaama1; Weston Norwood1 University of Washington1, Seattle, WA, USA
Christopher Meek, AIA, IES Integrated Design Lab Associate Professor and Director University of Washington Department of Architecture [email protected]

The Bullitt Center
- http://www.bullittcenter.org/ “The greenest commercial building in the world.”
© UW Integrated Design Lab, 2014
Image: Architectural Record

Modeled End-Use Energy Distribution
© UW Integrated Design Lab, 2014
Diagram: PAE Engineering

Lighting Energy in NW Buildings
Office Building: Seattle Energy Code 2009 EUI ~42 kBtu/ft²-yr Lighting alone = ~11.25 kBtu/ft²-yr
Lighting Consumes 20% of US Site Energy and 38% of Site Electricity (EIA, 2009)

Office Building: Seattle Energy Code 2009 EUI ~42 kBtu/ft²-yr Lighting alone = ~11.25 kBtu/ft²-yr
Bullitt Center EUI ~16 kBtu/ft²-yr Lighting alone = ~3.7 kBtu/ft²-yr- with P-Cell Control
If daylight performance is not persistent over time the project will not meet net-zero operation, nor meet qualitative experiential goals.
Lighting Energy in NW Buildings
Lighting Consumes 20% of US Site Energy and 38% of Site Electricity (EIA, 2009)

How to do this without losing space quality?

Daylighting!
Some Bullitt Images here…

•Dynamic Exterior Shading System •Super-Insulating Walls and Triple-Pane Double Low-e Glass •Automated Window Operation for Passive Cooling
High-Performance Building Envelope
© UW Integrated Design Lab, 2014
Image: High Performance Building s
Image: UW IDL

Integrated Lighting Design
•Daylight is the Primary Source of Ambient Illumination
•Automated Glare Control
•0.4 W/sf Connected Lighting Load
•Photo-responsive Dimming
•Comprehensive Vacancy Sensing
•Localized Task Lighting
Image: UW IDL

Image: Enmetric Plug Load Manager/UW IDL
Comprehensive Plug-Load/Task Lighting Management
Web-based Real Time Plug Load Data Collection, Scheduling, and Reporting at Each Receptacle.
© UW Integrated Design Lab, 2014

Blinds (3) delay the exterior heating of the windows and regulate interior temperatures.


Space Type
Lighting Power Density W/m2 (W/ft2) Seattle Energy Code 2012*
ASHRAE 90.1 2010 Appendix
G
Bullitt Center Targets
Office 9.6 (0.9) (10.5) 0.98 4.3 (0.4) Conference 9.6 (0.9) (13.2) 1.23 9.6 (0.9) Restroom 9.6 (0.9) (10.5) 0.98 4.8 (0.45) Mechanical Room 9.6 (0.9) (10.2) 0.95 7.4 (0.69)
Back of House MEP 9.6 (0.9) (10.2) 0.95 3.7 (0.34)
Parking 9.6 (0.9) (2.0) 0.19 3.0 (0.28) Sun Room 9.6 (0.9) (7.9) 0.73 3.0 (0.28) Stairs 9.6 (0.9) (7.4) 0.69 3.0 (0.29)
*SEC 2012 Building-area method for lighting power allowances


Suite 200 LPD = 0.39 W/sf

Winter Clear Day (4 Dec 2014)
Winter Overcast Day (18 Dec 2014)
Summer Clear Day (1 July 2014)
Summer Overcast Day (27 June 2014)
Example Day Types (8am – 5pm)

Clear Winter Day (4 Dec 2013)

Overcast Winter Day (18 Dec 2013)

Overcast Summer Day (27 June 2014)

Clear Summer Day (1 Jul 2014)

Operational Performance Range: SE Facade In
terio
r Illu
min
ance
Blinds retract at 11am Best Comfortable Performance and Maximized Views
Blinds always down “Comfortable” No Daylight/Obstructed Views
70% Delta In Lighting Savings + Visual Comfort
September 21st Clear Sky
Blinds Deployed for Morning Glare
Control
No Blinds Uncontrolled Direct Sunlight Glare and Discomfort!
Performance Potential Range

Dynamic Solar Shading
© UW Integrated Design Lab, 2014
Baseline Windows Automated Exterior Blinds

Architectural Record

Optimized per Sky Condition and Weather Image: Warema

DEPLOYED BLINDS
OPEN BLINDS
Pre-programmed for Solar Orientation and Overshadowing
Image: Warema

Dynamic Luminance Map: Dynamic Blinds Deployment

M&V and Occupant Feedback Occupant Feedback and Energy Performance Documentation

Thank you! Christopher Meek, AIA Integrated Design Lab Research Associate Professor University of Washington Department of Architecture [email protected] www.idlseattle.com