dynamic characterization testing of wind turbines - · pdf filedynamic characterization...
TRANSCRIPT
Dynamic CharacterizationTesting of Wind Turbines
May 2001 � NREL/TP-500-30070
Richard M. Osgood
National Renewable Energy Laboratory1617 Cole BoulevardGolden, Colorado 80401-3393NREL is a U.S. Department of Energy LaboratoryOperated by Midwest Research Institute •••• Battelle •••• Bechtel
Contract No. DE-AC36-99-GO10337
National Renewable Energy Laboratory1617 Cole BoulevardGolden, Colorado 80401-3393NREL is a U.S. Department of Energy LaboratoryOperated by Midwest Research Institute •••• Battelle •••• Bechtel
Contract No. DE-AC36-99-GO10337
May 2001 � NREL/TP-500-30070
Dynamic CharacterizationTesting of Wind Turbines
Richard M. OsgoodPrepared under Task No. WER1.2460

NOTICE
This report was prepared as an account of work sponsored by an agency of the United Statesgovernment. Neither the United States government nor any agency thereof, nor any of their employees,makes any warranty, express or implied, or assumes any legal liability or responsibility for the accuracy,completeness, or usefulness of any information, apparatus, product, or process disclosed, or representsthat its use would not infringe privately owned rights. Reference herein to any specific commercialproduct, process, or service by trade name, trademark, manufacturer, or otherwise does not necessarilyconstitute or imply its endorsement, recommendation, or favoring by the United States government or anyagency thereof. The views and opinions of authors expressed herein do not necessarily state or reflectthose of the United States government or any agency thereof.
Available electronically at http://www.doe.gov/bridge
Available for a processing fee to U.S. Department of Energyand its contractors, in paper, from:
U.S. Department of EnergyOffice of Scientific and Technical InformationP.O. Box 62Oak Ridge, TN 37831-0062phone: 865.576.8401fax: 865.576.5728email: [email protected]
Available for sale to the public, in paper, from:U.S. Department of CommerceNational Technical Information Service5285 Port Royal RoadSpringfield, VA 22161phone: 800.553.6847fax: 703.605.6900email: [email protected] ordering: http://www.ntis.gov/ordering.htm
Printed on paper containing at least 50% wastepaper, including 20% postconsumer waste
1
Abstract
The U.S. Department of Energy (DOE), in conjunction with the U.S. wind industry, is supporting thedevelopment and commercialization of utility-grade wind turbines. Under the Certification Program, theDOE, through the National Renewable Energy Laboratory (NREL) will assist the U.S. wind industry inobtaining American Association for Laboratory Accreditation (A2LA)-type certification for their class ofwind turbine. As part of the Certification Program, NREL is conducting a suite of certification tests thatare specified by the International Electro-technical Commission (IEC) standards.
One emerging certification requirement is to characterize the dynamic behavior of the wind turbine�soperation. Therefore, the purpose of the dynamic characterization tests is to document the fundamentaldynamic characteristics of the wind turbine under critical operational modes and fault conditions in lightof turbine design specifications. Some of the dynamic characteristics determined from testing include theconformation of natural system frequencies and the wind turbine�s dynamic response to typical rated andextreme modes of operation.
This paper discusses NREL�s approach in designing and implementing a dynamic characterization test forcommercial wind turbines. One important objective of the dynamic characterization test is to provide aCertification Agent with test data to show that the mechanical equipment of the wind turbine is operatingwithin design vibration limits. For NREL�s industry participant, the test results are an indication of thewind system�s overall quality of mechanical operation that can be used to compare with establishedindustry standards for a wind system�s response under typical and extreme operating conditions.
Background & Rationale
Dynamic characterization testing of wind turbines evolved from the need to predict maximum operatingloads due to design and off-design operating conditions. Typical turbine operating conditions can begrouped into three major modes of operation: (1) transient events such as start-up or emergency-stopoperations, (2) rated to extreme power production, and (3) parked or furled standby mode. Some of thelargest structural loads resisted by the turbine can occur during emergency-stop events and regulatingpeak power production through extreme wind gusts. In addition, the growing use of variable-speed windturbines highlights the need to identify a structural resonance and its critical rotor speed to avoidpotentially damaging dynamic loads during turbine operation (1).
Standards are being considered by national and international certification bodies for the dynamic behaviorof commercial wind turbines (2). The motivation is to adopt a standard that characterizes a wind turbinein terms of its dynamic behavior from rated to extreme operating conditions. Such a standard would helpinsure the safety of personnel and protection of the wind turbine system. We have developed a dynamiccharacterization test (DCT) that is designed to confirm predicted fundamental system and componentfrequencies and to measure operating vibration levels over a range of rated power conditions, includingfault and parked modes of operation (3). We have found four significant DCT results that are useful incharacterizing the dynamic behavior of a wind turbine system. These results include:
1) Operating vibration spectra collected for rated and extreme power production2) Component motion or peak acceleration levels due to transient events3) Natural system frequencies measured for parked rotor conditions4) Critical rotor speeds measured during variable-speed operation.

2
Our wind industry partners have used DCT results to help them evaluate the operation of differentprototype designs. A wind turbine control analysis, for example, uses DCT results taken during operationunder different control strategies to compare the structural acceleration fluctuations with differentcontroller algorithms. Another common use of DCT results is to validate maximum operatingaccelerations due to peak gust events that are predicted by a wind turbine simulation model. In this case,a dynamist will correlate peak operating accelerations predicted by his simulation model with a measuredtime series of accelerations collected during dynamic characterization tests of the turbine for differentoperating conditions (4). In addition, other wind turbine researchers routinely use measured naturalfrequency data to check their analytical estimates of fundamental system frequencies. Dynamic modelsthat are updated with actual natural frequencies provide better simulations of the turbine�s dynamicresponse to both steady state and transient operating conditions (5). We have recently expanded ourdynamic characterization test methods to help our industry partners diagnose operating problems anddelineate design tradeoffs between different prototype configurations.
Test Setup and Data Collected
Important fundamental vibrations of the wind turbine include natural bending modes of the tower androtor components. The tower, nacelle, and rotor vibration modes may also interact or couple undercertain conditions and cause an operational instability (6). Harmonic rotor loads that occur at multiples ofthe rotor speed can also excite the system�s natural vibration modes. A fundamental system frequencythat is driven by a harmonic rotor load is called a resonance condition. Potentially large structuraldisplacements can result from a resonance condition. Therefore, operating at a critical rotor speed couldbe particularly damaging to the wind turbine system (7). An experimental fan plot, which shows naturalsystem frequencies plotted against rotor speed, is an important DCT result (see Figure 1). The lines ofconstant slope (fanning out over the plot) are labeled from 1P (one-per-revolution) through 15P. Each fanline represents a harmonic order of the rotor speed. The measured natural system and componentfrequencies (F1 through F5) are shown on the ordinate axis of the fan plot. These natural frequenciesmay change with rotor speed.
The fan plot is used as a diagnostic tool. A resonance is observed in operating data as a large amplitudeacceleration or load peak in the response spectra of the turbine (see Figure 2). The fan plot is used tohighlight the rotor speeds at which harmonic rotor forces are likely to excite natural system frequencies,thereby causing large deflections known as a resonant condition. For example, the system frequency F1in Figure 1 crosses the 1P harmonic at a rotor speed of 42 revolutions per minute (rpm), crosses the 2Pharmonic at a rotor speed of 21 rpm, and crosses the 3P harmonic at a rotor speed of 14 rpm. Therefore, aresonant condition for frequency F1 could exist at a rotor speed of 42 rpm, forced by the rotor harmonic1P, or at a rotor speed of 21 rpm excited by the rotor harmonic of 2P, or at a rotor speed of 14 rpm drivenby the 3P rotor harmonic. On the other hand, whether a natural frequency is excited by a harmonic ofrotor speed depends on several factors, including the wind turbine design and the amount of dampingexhibited when the system is under load.
The rotor speed of a constant-speed wind turbine generator is usually chosen to avoid system frequenciesthat coincide with 1P and the first several per-revolution harmonics that are multiples of the number ofrotor blades. For example, given a two-bladed machine, 2P, 4P, 6P and 8P rotor harmonics may havesufficient energy to excite a lightly damped system mode that occurs at the rotational frequency of therotor. For a three-bladed rotor design, rotor harmonics of 3P, 6P, 9P, and 12P have the potential to excitea fundamental system mode that coalesces with the operating speed of the rotor. For example, Figure 1shows a vertical line representing the constant 36-rpm turbine operating speed. Given a two-bladeddesign and a moderately damped mode occurring at the frequency of F2 (1.25 Hertz [Hz]), the rotorharmonic 2P could have sufficient energy to force F2 even though Figure 1 indicates an interaction

3
occurring at an operating speed of 37.5 rpm. Figure 1 also shows that a two-bladed rotor operating at 36rpm could also experience an 8P rotor harmonic, forcing the system mode occurring at F5 (4.54 Hz). Fora three-bladed design running at 36 rpm, Figure 1 indicates that the rotor harmonic of 3P could drive thesystem mode occurring at F3 (1.83 Hz).
We can readily appreciate that incorporating variable-speed technology presents a formidable challengefor the wind turbine designer. Because all rotors have some inherent imbalance, the 1P rotor harmoniccan easily sweep through fundamental tower-bending frequencies of large wind turbine systems that usevariable-speed technology. Looking at Figure 1, we see that over a typical rotor speed range of 15 to 45rpm, there are many opportunities for the rotor harmonics to interact with fundamental systemfrequencies. For a two-bladed, variable-speed turbine in particular, the 2P-rotor harmonic could exciteseveral natural system frequencies; the 3P-rotor harmonic could also excite several system frequencies ofa three-bladed, variable-speed turbine design. Advanced variable-speed controller designs use themeasured system frequencies in a fan plot to identify critical rotor speeds that are likely to excitesignificant structural vibrations. These can be avoided by properly programming the wind turbine speedcontroller.
To identify a wind system�s natural vibration frequencies and damping values, we conducted a series ofparked rotor measurements. If the average ambient wind speed is low (less than ~5 m/s), we madedriving-point measurements on important structural components to obtain frequency response functions(FRF) (see Figure 3). A driving-point measurement is the collocation of a measured excitation force witha measured structural response. We can extract natural bending frequencies and damping values fromFRF that are acquired from measurements made on the tower, drivetrain, and rotor blade. Figure 4 is aschematic of the instrumentation and shows the measurement locations we used to find the static (non-rotating) natural system frequencies of a typical three-bladed wind machine. We typically employ twodifferent transient excitation techniques to measure frequency response functions. The first technique is astep-relaxation method developed by Carne (8) to test vertical-axis wind turbines. The fundamentalbending frequencies of the wind turbine tower and drivetrain are fully excited and observed for the step-relaxation excitation method applied to the tower in low ambient wind conditions (see Figure 5). Thesecond excitation technique involves applying an impulsive load to a wind turbine component with aninstrumented impact hammer (9). Again under low ambient wind-speed conditions, impact testing is aconvenient method to use on structural components that are lightly damped and have widely spacedmodal frequencies, as shown in the FRF of Figure 3. We have found that impact testing is most useful indetermining the flap and lag bending frequencies of the rotor blade as shown in Figure 6.
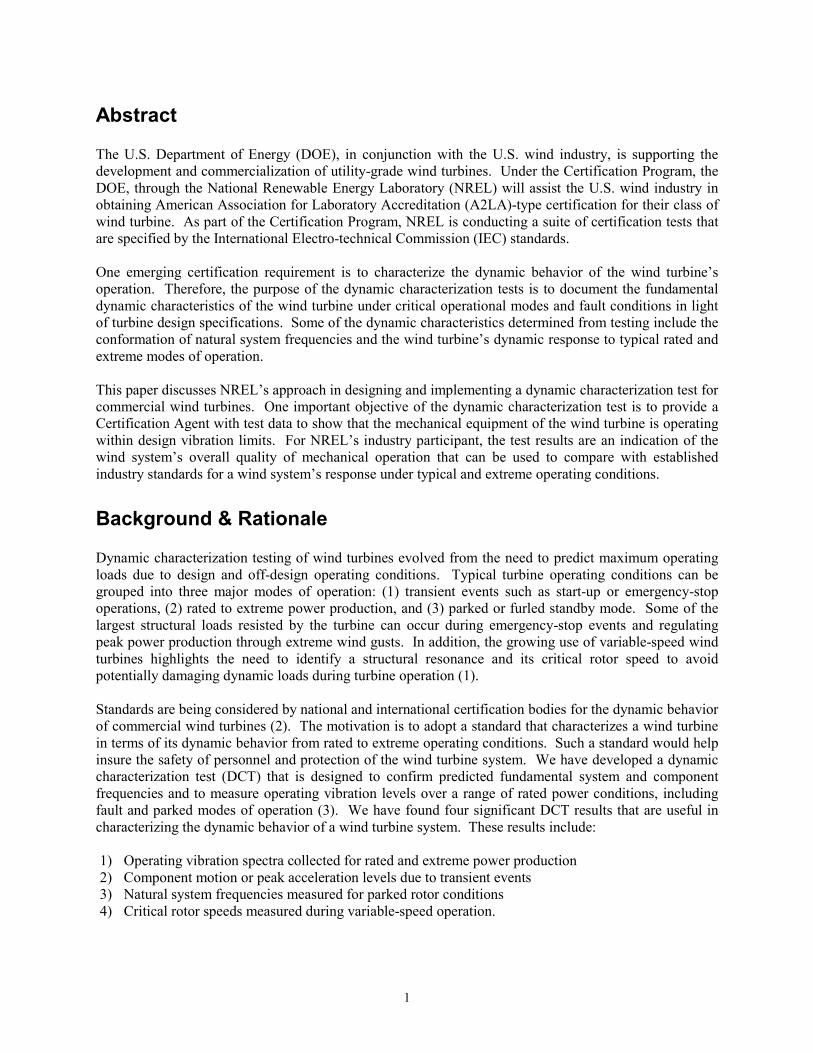
Higher ambient wind-speed conditions degrade driving point measurements due to unmeasured windforces. Fortunately, the random wind forces that act on the wind turbine structure also excite the parkedsystem modes of vibration (10). In addition, wind excitation has excellent low-frequency energy content,which is required to drive the low-frequency fundamental bending modes of the wind turbine tower androtor blades. Figure 7 shows a power spectrum of fore-aft tower motion caused by wind excitation. Thepower spectrum was computed for the rotor-parked condition so the peaks in the spectra represent naturalfrequencies of the system. However, we cannot directly extract damping values and other scaled modalproperties of the wind turbine structure from wind excitation spectra alone, as we can with the FRFmeasurements. The ability to measure fundamental system frequencies using the methods mentionedabove gives us the flexibility to work with uncontrollable ambient wind conditions. Therefore, undermost field test situations, we can at least obtain the fundamental component and natural systemfrequencies of a parked wind turbine.
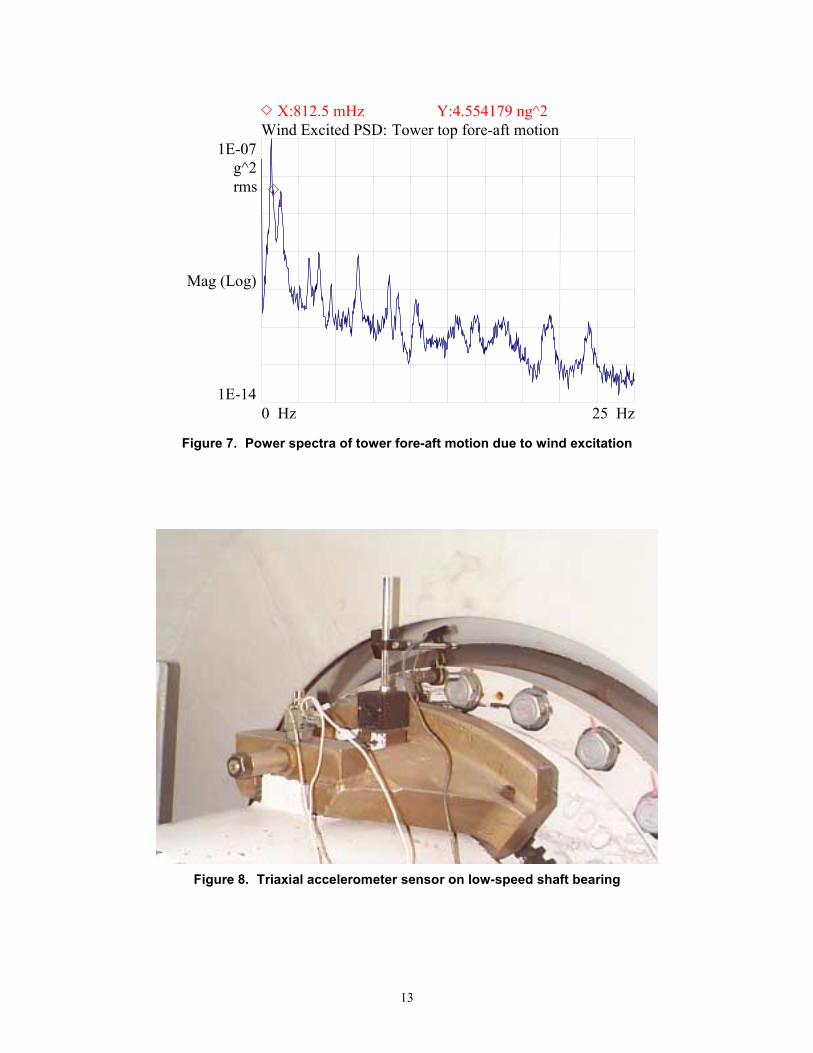
To measure natural vibrations of the drivetrain at the low-speed shaft, we used piezo-resistive, three-axis(triaxial) accelerometers (see Figure 8). One axis of the triaxial accelerometer is aligned along the low-speed shaft (LSS) to measure motion along the thrust axis of the turbine. The second axis is

4
perpendicular to the LSS and measures the motion of the drivetrain in the nacelle�s yaw direction. Thethird axis of the triaxial accelerometer is also aligned perpendicular to the LSS and measures motions ofthe drivetrain that represent pitching of the nacelle. To measure the natural bending motion of the tower,we used high quality, inertial-grade, dual-axis (biaxial) accelerometers (see Figure 9). One axis of thebiaxial accelerometer is aligned to measure fore-aft motion of the tower; the second axis is aligned tomeasure side-to-side tower motion. Both types of transducers have the high sensitivity and good low-frequency characteristics that are necessary to discriminate between the tower�s fundamental bendingmodes and the rotor�s natural bending frequencies.
We measured the wind system�s operating steady-state dynamic response in terms of the motions oraccelerations that the structure experienced over a 10-minute period while running at rated or aboveconditions. The wind turbine�s steady-state response is described by computing the power spectra of thedrivetrain�s accelerations measured at the hub bearing (shown in Figure 2). We also characterized steady-state operation by calculating the power spectra of tower motions measured below the yaw bearing (seeFigure 10). Other measurement locations of interest include tower or drivetrain components that exhibitexcessive vibration during normal operation.
The steady-state vibration spectra are correlated with the turbine�s power-performance data that issimultaneously collected during each 10-minute record. Table 1 is a list of typical test signals that arecollected during a dynamic characterization test. Table 1 includes the turbine�s power-performanceparameters and additional tower response signals that were collected to help an industry partner comparetower designs. When possible, we obtain the wind turbine�s power-performance parameters, such aswind speed and electrical power generated directly from the wind turbine�s controller or power-performance metering instrumentation. Figure 11 shows a schematic of the data acquisition system weuse to collect dynamic response and power-performance signals for a typical dynamic characterizationtest. In some instances, the system�s performance signals are not readily available from the windturbine�s controller. In that case, we install a standard suite of performance instrumentation that we usefor power and performance certification testing (11). The table includes some additional drivetrain andtower acceleration signals that were collected for a particular field test with an industry partner.
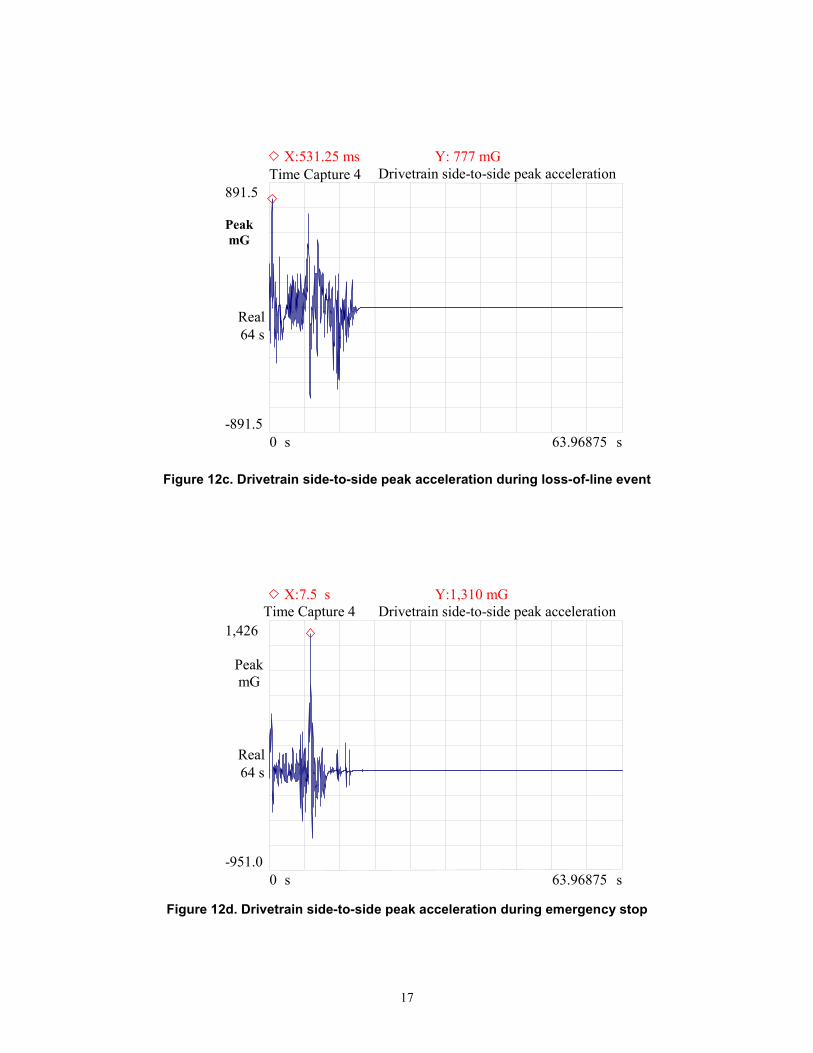
We collect time series of peak accelerations during operational events such as startup (Figure 12a),normal shutdown (Figure 12b), loss of line fault (Figure 12c), and emergency shutdown (Figure 12d) todescribe of the wind system�s transient response. The structural degrees of freedom we choose to makeacceleration measurements for both steady-state and transient dynamic response are located oncomponents that transfer load from the rotor to the drivetrain and between the nacelle and tower. Wemeasure operating accelerations parallel and perpendicular to the thrust axis of the rotor with the sametriaxial accelerometer on the low-speed shaft bearing (Figure 8) that was used to measure the naturalfrequencies of the parked rotor system. We also measure operating fore-aft and side-to-side towermotions with the same biaxial accelerometer (Figure 9) that was used to measure the parked-rotorfundamental tower bending frequencies.
We can identify system modes, such as tower bending coupling with rigid-body drivetrain motion, bycomputing cross spectra of acceleration signals and analyzing the relative phase between the signals.Using cross-power analysis of relative motion between components also helps us understand the forcedresponse or operating deflections experienced by the system under load. For example, by comparing thephase between hub and generator motion for frequency peaks in the component�s cross spectra, we candetermine which component is leading (or lagging) and is thereby responsible for the forced motion (seeFigures 13a and 13b). We have also measured the relative flexibility between rotor and tower bendingmodes to help researchers find better stiffness values for input into a dynamic wind-system simulationmodel (12). Accurately modeling the rotor modes that couple with tower bending modes through the

5
drivetrain is important to help us understand how some operating instabilities can cause premature fatigueof the drivetrain and of its attachment hardware to the tower top.
We correlate the acceleration measurements from the nacelle and tower with critical speeds of the rotor toidentify resonant conditions. This is accomplished by collecting operating accelerations simultaneouslywith the azimuth position and rotor speed. A combination of Hall-effect switch and magnetic pickup areused to measure the azimuth position and speed of the LSS (see Figure 14). Component vibration dataplotted against changing rotor speed is called a waterfall diagram. A waterfall diagram is shown in Figure15 for a turbine coasting down from a rated rotor speed of 35 rpm to 9 rpm. Peaks in the waterfalldiagram are system frequencies excited by harmonic forces as the speed of the rotor changes. In Figure15, four driven-system frequencies are highlighted as slices of the waterfall diagram. The first two slicesof 0.6875 and 0.7817 Hz are fundamental bending modes of the tower. The second two slices of 1.688and 1.781 Hz are rotor-nacelle modes of vibration, possibly coupling with higher bending modes of thetower. Looking at the upper plot of Figure 15, we see that the system mode occurring at 1.781 Hzachieves a peak acceleration of 16 milli-G�s (mG). In addition, the system modes occurring at 1.688,0.7813, and 0.6875 Hz attain peak accelerations of 12 mG. Initially, these may seem to be lowacceleration levels for the system modes excited by harmonics rotor forces. However, the accelerationdata should be analyzed in terms of peak displacement for each of the system frequencies excited. Forsinusoidal response, the peak displacement is proportional to the peak acceleration divided by the squareof the frequency at which it occurs. Table 2 lists computed peak displacement values for the systemmodes highlighted in Figure 15. From Table 2, we can see that the fundamental tower mode of vibrationhas nearly five times the displacement occurring at 0.6875 Hz as does the rotor-nacelle mode occurring at1.781 Hz for nearly the same acceleration level.
Future Work
As mentioned earlier, we collect a 10-minute time series record of operating accelerations for the windmachine running at rated or above conditions. The 10-minute record is used to characterize the windsystem�s steady-state response. However, a recent study has identified diurnal variation as an importantfactor in evaluating turbulence-induced wind turbine loads (13). Therefore, the time of day during whichthe 10-minute time series record is collected must be considered when characterizing peak operatingconditions of the wind machine. So far, we have collected operating data that were available duringintensive field test programs that have lasted little more than a week. The data acquisition system (DAS)shown in Figure 11 is capable of collecting several hours to a couple of days worth of operating data,depending on the sample rate. However, the DAS in Figure 11 is not automated and is dependent on anoperator who decides when, what, and how many data are to be collected.
To better characterize the overall operating dynamics of a wind machine, long-term data are needed overa full wind season. Our next generation DAS has been designed such that the wind system�s powerperformance information is logged with the turbine�s structural response data. Specifically, the long termdata collection system looks like the DAS in Figure 11 with the HP front-end, PC-controller, and massstorage systems replaced with a multi-channel data logger. The data logger is programmed to collectdynamic response data in conjunction with the wind machine�s power performance data. The data arevibration statistics stored in a test matrix that is programmed into the data logger. The independentportion of the of the test matrix is partitioned into inflow conditions (14) that reflect the time of day ordiurnal variations of the turbine�s operating environment. The dependent portion of the test matrix ispartitioned in terms of the wind machine�s performance, including power production level for a constant-speed turbine or as a function of operating speed for a variable-speed wind turbine. The informationcollected with the long-term DAS supplements the fundamental natural frequencies and transientoperating data collected during the intensive data-collection portion of a dynamic characterization test.

6
Acknowledgements
The author thanks Grant McFarland of Mountain Valley Energy for helping design and fabricate the dataacquisition system that we used in the dynamic characterization tests. Grant was also instrumental insupporting the field tests by installing the vibration sensors and maintaining the DAS. The author alsothanks Eric Jacobson of NREL�s Certification Team for providing his expertise in setting up the suite ofinstrumentation used to make the power-performance measurements on the turbines tested. Eric�s supportin helping us to set up the dynamic characterization tests was also invaluable in our effort to complete allthe tests in a timely manner.
References
1. Vachon, W.A. Control Algorithms for Effective Operation of Variable Speed Wind Turbines.SAND90-7112, UC-261, October 1993.
2. Draft IEC 61400-22. Wind Turbine Generator Systems Section 8: Type Certification. TC88, 1998-12-18.
3. NWTC Certification Team. General Quality Manual. GP01-98268.
4. Osgood, R.M. Zond Z-40M Dynamic Effects Test. Internal Contractor Report, October 1998.
5. Wright A.D. Validation of a Model for a Two-Bladed Flexible Rotor System. NREL/CP-500-25514,November 1998.
6. Bir, G.S. �Modal Dynamics of Next Generation Flexible-Rotor and Soft-Tower Wind Turbine,�Fifteenth International Modal Analysis Conference, Orlando FL, 1997.
7. Osgood, R.M. Modal Testing of Advanced Wind Turbine Systems. NREL/CP-500-7387, November1998.
8. Carne, T.G. Modal Testing in the Design Evaluation of Wind Turbines. SAND87-2461, UC-60, April1988.
9. Brown, D.L. �Impulse Technique for Structural Frequency Response Testing," Sound and Vibration.November 1977, pp. 8-21.
10. James, G.H. �Extraction of Modal Parameters from Operating HAWT using the Natural ExcitationTechnique (NeXT).� Proceedings of the 1994 ASME Wind Energy Symposium, Wind Energy �1994.SED-Vol. 15, New York, ASME, 1994; pp. 227-232.
11. Wright, A.D., Osgood, R.M., Malcolm, D.J. �Analysis of a Two-bladed, Teetering-Hub TurbineUsing the ADAMS Software.� Prepared for Windpower �94, Minneapolis, MN, May 1994.
12. IEC. Wind Turbine Generator Systems Part 12: Wind Turbine Power Performance Testing. IEC61400-12, 1998-02.
13. Kelley, N.D. �A Case for Including Atmospheric Thermodynamic Variables in Wind TurbineFatigue Loading Parameter Identification.� NREL/CP-500-26829, July 1999. Prepared for theSecond Symposium on Wind Conditions for Wind Turbine Design, IEA Annex XI, Roskilde,Denmark, April 12-13, 1999.
14. Kelley, N.D. Identification of Inflow Fluid Dynamics Parameters That Can Be Used to Scale FatigueLoading Spectra of Wind Turbine Structural Components. Musial, W.D.; Hock, S.M.; Berg, D.E.,

7
eds. Wind Energy 1994: Proceedings of the Energy-Sources Technology Conference, 23-26 January1994, New Orleans, Louisiana. SED-Vol. 15. New York: American Society of Mechanical Engineers,1994; pp. 181-188. Acc No. 14967.

8
Table 1. Typical Signals Collected for a Dynamic Characterization Test
DAS Data Channel Descriptor Sensor Serial SignalChnl Measured Parameter Type # Sensitivity
1 LSS Azimuth position (1 per-rev pulse) Mag-pickup MSC427 0 to 5v-peak2 Generator speed (rpm) Controller Sensor N/A 2mV/rpm3 Generator Power (kW) Controller Sensor N/A 3.79mV/kW4 Wind Speed (m/s) Climatronix Cup 3546 1.726mV/m/s5 Hub-bearing fore-aft acceleration (G) Endevco 2262A L11955 3.45V/G6 Hub-bearing lateral (yaw) acceleration (G) Endevco 2262A L12050 2.733V/G7 Hub-bearing pitch acceleration (G) Endevco 2262A L11778 3.365V/G8 Generator fore-aft acceleration Endevco 2262C HD86H 1.637V/G9 Generator lateral (yaw) acceleration (G) Endevco 2262C GF73G 1.615V/G
10 Generator pitch acceleration (G) Endevco 2262C GT58H 2.037V/G11 Tower top corner #1 fore-aft acceleration (G) Force Balance 45895 1000mV/G12 Tower top corner #1 lateral acceleration (G) Force Balance 47914 1000mV/G13 Tower X-brace fore-aft acceleration (G) Force Balance 47890 1000mV/G14 Tower X-brace lateral acceleration (G) Force Balance 45886 1000mV/G15 Tower leg #1 fore-aft acceleration (G) Force Balance 45896 500mV/G16 Tower leg #1 lateral acceleration (G) Force Balance 47915 500mV/G
Table 2. Peak Displacements for Frequency Slices of Waterfall Diagram
Frequency Slice, f Acceleration, A Radial Frequency, Displacement, DHz mG rad/sec mm
0.6875 12 4.32 6.310.7813 12 4.91 4.881.688 12 10.61 1.051.781 16 11.19 1.25

9
0 20 40 605 10 15 25 30 35 45 50 55
Rotor Speed (rpm)
0
4
8
12
16
1
2
3
5
6
7
9
10
11
13
14
15
Syst
em F
requ
enci
es (H
z)
1P
2P
3P
4P
5P
6P
7P
8P
9P
10P
11P
12P
13P
14P
15P
F1= 0.703
F2= 1.25
F3= 1.83
F4= 2.85
F5= 4.54
F6= 7.47
F7= 11.2
36 rpm Operating Speed
Figure 1. Typical fan plot of wind turbine natural frequencies

10
0.015g
Peak
0.00015
Magnitude
Hz250 Hz
Power Spectrum 5 Operating Response SpectraX:570.3125 mHz Y:11.91098 mg
Figure 2. Operating spectra of hub bearing fore-aft acceleration
2g/lbf
0.00016
Mag (Log)
Hz50 0 Hz
Freq Response 5:1 ROTOR BLADE DRIVING POINT
Figure 3. Rotor blade driving point frequency response function

11
X
Z
Y
Drivetrain triaxialaccelerometer location:inboard of hub on lowspeed shaft bearing
Door
TypicalWind
DirectionLadder
X
Y
Tower-top biaxialaccelerometer location: just below yaw bearing
TAyTAx ,
PiezoelectricSignal
conditioning
Force BalanceAccelerometer
SignalConditioning
Low Pass Filters HP 3565ADAS
LaptopPC
LoadSensor
ForceBalance
AccelRotor
Biax-Accel
ImpactHammer
Prime Mover
NAx N Ay NAz,,
YX
Y
YX
X
Lightweight high-strengthcomposite rope
Quick ReleaseMechanism
Figure 4. Equipment schematic and sensor locations used to measure non-rotating naturalsystem frequencies.

12
Figure 5. Step-relaxation load method applied to tower
Figure 6. Driving point measurement using impact excitation technique
13
1E-07g^2rms
1E-14
Mag (Log)
Hz250 Hz
Wind Excited PSD: Tower top fore-aft motionX:812.5 mHz Y:4.554179 ng^2
Figure 7. Power spectra of tower fore-aft motion due to wind excitation
Figure 8. Triaxial accelerometer sensor on low-speed shaft bearing

14
Figure 9. Biaxial accelerometer mounted inside tower below yaw bearing
0.012g
Peak
0
Magnitude
Hz250 Hz
Power Spectrum 12 Tower side-to-side operating PSDX:23.32813 Hz Y:10.46287 mgX:1.71875 Hz Y:4.788487 mgX:718.75 mHz Y:3.936083 mg
Figure 10. Operating spectra of tower side-to-side motion

15
16 ChannelBurr-Brown
IsolationAmplifier
PiezoelectricForce Xducer
PiezoelectricStrain Gauge
PiezoelectricAccelerometers
PiezoresistiveAccelerometers
Force BalanceAccelerometers
Wind TurbinePower
InflowWind Speed
LSS RPMN/Rev
LSS Angle1/Rev
Programmable16 Channel
PeizoelectricSignal
ConditioningW/ 8 PoleLow Pass
Filter
MatchedProgrammable
Analog8 Pole
Low PassFilter
BridgeSig. Cond.
CurrentLoop
Sig. Cond
CurrentLoop
Sig. Cond.
F-to-VPulse
Sig.Cond.
PulseSig.Cond.
F-to-VPulse
Sig.Cond.
HP3566ADAS Front-End
WithGPIB Interface
DASComputer
DATTape
Recorder
DAT/PCInterface
Box
GPIB
Printer
SCSI
SCSI
RS2
32
RS2
32
4-20 mA
4-20 mA
Channels
1 Rotor Speed2 Wind Turbine Power3 Inflow Wind Speed4 Nacelle Ax5 Nacelle Ay6 Nacelle Az7 Tower Ax8 Tower Az
Filtered Analog SignalUnfiltered Analog Signal Pulse Signal Signal Conditioned Pulse Signal
Intensive Data Collection Equipment Block Diagram for Dynamic Characterization Testing.
ExternalData
Storage(Zip Drive)
SCSI
Figure 11. Data acquisition system used to collect dynamic response and power performancesignals

16
6.241
Peak mG
-.00027
Real
s63.968750 s
Time Capture 4 Drivetrain side-to-side peak acceleration
0 s
X:46.34375 s Y: 4.9 mG
Figure 12a. Drivetrain side-to-side peak acceleration during start-up
891.5
Peak mG
-594.4
Real
s63.968750 s
Time Capture 4 Drivetrain side-to-side peak acceleration
64 s
X:19.84375 s Y: 791 mG
Figure 12b. Drivetrain side-to-side peak acceleration during normal shutdown
17
891.5
Peak mG
-891.5
Real
s63.968750 s
Time Capture 4 Drivetrain side-to-side peak acceleration
64 s
X:531.25 ms Y: 777 mG
Figure 12c. Drivetrain side-to-side peak acceleration during loss-of-line event
1,426
Peak mG
-951.0
Real
s63.968750 s
Time Capture 4 Drivetrain side-to-side peak acceleration
64 s
X:7.5 s Y:1,310 mG
Figure 12d. Drivetrain side-to-side peak acceleration during emergency stop

18
0.012g
Peak
0
Magnitude
Hz250 Hz
Cross Power 10:7 LSS hub & generator pitching motionX:23.32813 Hz Y:11.4348 mgX:1.726563 Hz Y:3.096623 mg
Figure 13a. Magnitude cross spectra between LSS hub and generator pitch motion
180deg
-180
Phase
Hz250 Hz
Cross Power 10:7 LSS hub & generator pitching motionX:23.32813 Hz Y:-67.06605 degX:1.726563 Hz Y:80.87039 deg
Figure 13b. Phase cross spectra between LSS hub and generator pitch motion

19
Figure 14. Rotor azimuth position and low-speed shaft sensors
Ch 6 :-nac elle x.TIM
0
0.016
g
0 2.761Hertz
9.574
35.0
RPM
Hertz1:0.68752:0.78133:1.6884:1.781
9.57 35.0
0
0.016
RPM
g :Slic e-0.6875 Hertz:Slic e-0.7813 Hertz:Slic e-1.688 Hertz:Slic e-1.781 Hertz
X1:0Y1:0.006548
Figure 15. Waterfall diagram of wind turbine during coast down

REPORT DOCUMENTATION PAGE Form ApprovedOMB NO. 0704-0188
Public reporting burden for this collection of information is estimated to average 1 hour per response, including the time for reviewing instructions, searching existing data sources,gathering and maintaining the data needed, and completing and reviewing the collection of information. Send comments regarding this burden estimate or any other aspect of thiscollection of information, including suggestions for reducing this burden, to Washington Headquarters Services, Directorate for Information Operations and Reports, 1215 JeffersonDavis Highway, Suite 1204, Arlington, VA 22202-4302, and to the Office of Management and Budget, Paperwork Reduction Project (0704-0188), Washington, DC 20503.
1. AGENCY USE ONLY (Leave blank) 2. REPORT DATEMay 2001
3. REPORT TYPE AND DATES COVEREDTechnical Report
4. TITLE AND SUBTITLEDynamic Characterization Testing of Wind Turbines
6. AUTHOR(S)Richard M. Osgood
5. FUNDING NUMBERS
WER1.3010
7. PERFORMING ORGANIZATION NAME(S) AND ADDRESS(ES) 8. PERFORMING ORGANIZATIONREPORT NUMBERNREL/TP-500-30070
9. SPONSORING/MONITORING AGENCY NAME(S) AND ADDRESS(ES)National Renewable Energy Laboratory1617 Cole Blvd.Golden, CO 80401-3393
10. SPONSORING/MONITORINGAGENCY REPORT NUMBER
11. SUPPLEMENTARY NOTES
NREL Technical Monitor: NA12a. DISTRIBUTION/AVAILABILITY STATEMENT
National Technical Information ServiceU.S. Department of Commerce5285 Port Royal RoadSpringfield, VA 22161
12b. DISTRIBUTION CODE
13. ABSTRACT (Maximum 200 words)The U.S. Department of Energy (DOE), in conjunction with the U.S. wind industry, is supporting the development and commercialization of utility-gradewind turbines. Under the Certification Program, the DOE, through the National Renewable Energy Laboratory (NREL) will assist the U.S. industry inobtaining American Association for Laboratory Accreditation (A2LA)-type certification for their class of wind turbine. As part of the Certification Program,NREL is conducting a suite of certification tests that are specified by the International Electro-technical Commission standards.
One emerging certification requirement is to characterize the dynamic behavior of the wind turbine�s operation. Therefore, the purpose of the dynamiccharacterization tests is to document the wind turbine�s fundamental dynamic characteristics under critical operational modes and fault conditions in lightof turbine design specifications. Some of the dynamic characteristics that we determine from testing include the conformation of fundamental structuralvibration frequencies and the system�s dynamic response to typical rated and extreme modes of operation.
This paper discusses NREL�s approach in designing and implementing a dynamic characterization test for commercial wind turbines. One importantobjective of the dynamic characterization test is to provide a Certification Agent with test data to show that the wind turbine�s mechanical equipment isoperating within design vibration limits. For NREL�s industry participant, the test results are an indication of the wind system�s overall quality ofmechanical operation that can be used to compare with established industry standards for a wind system�s response under typical and extreme operatingconditions.
15. NUMBER OF PAGES14. SUBJECT TERMS
wind turbines; testing; characterization; certification 16. PRICE CODE
17. SECURITY CLASSIFICATIONOF REPORTUnclassified
18. SECURITY CLASSIFICATIONOF THIS PAGEUnclassified
19. SECURITY CLASSIFICATIONOF ABSTRACTUnclassified
20. LIMITATION OF ABSTRACT
UL
NSN 7540-01-280-5500 Standard Form 298 (Rev. 2-89)Prescribed by ANSI Std. Z39-18
298-102