the bonus-driven “rainmaker” financial firm: how these ... · that rainmaker compensation has...
TRANSCRIPT

PO
LIT
ICA
L E
CO
NO
MY
R
ESEA
RC
H IN
ST
ITU
TE
The Bonus-Driven “Rainmaker” Financial Firm:
How These Firms Enrich Top Employees,
Destroy Shareholder Value and Create
Systemic Financial Instability
James Crotty
Revised & expanded April 2010
WORKINGPAPER SERIES
Number 209
Gordon Hall
418 North Pleasant Street
Amherst, MA 01002
Phone: 413.545.6355
Fax: 413.577.0261
www.umass.edu/peri/
1
The Bonus-Driven “Rainmaker” Financial Firm:
How These Firms Enrich Top Employees, Destroy Shareholder Value and Create
Systemic Financial Instability
James Crotty
University of Massachusetts, Amherst
April 2010
First Draft: October 2009
I am grateful to Derek Jaskulski, Iren Levina, Jennifer Taub and especially Jerry Epstein and Rob Parenteau for helpful comments, to Iren Levina for outstanding research assistance, and to the Economics Department’s Sheridan Scholars program for research support.

2
Abstract We recently experienced a global financial crisis so severe that only massive rescue operations by governments around the world prevented a total financial market meltdown and perhaps another global Great Depression. One precondition for the crisis was the perverse, bonus-driven compensation structure employed in important financial institutions such as investment banks. This structure provided the rational incentive for key decision makers in these firms (who I call “rainmakers”) to take the excessive risk and employ excessive leverage in the bubble that helped create the bubble and make the crisis so severe. This paper presents and evaluates extensive data on compensation practices in investment banks and other important financial institutions. These data show that rainmaker compensation has been rising rapidly, is very large, and has asymmetric properties that induce reckless risk-taking. Since boom-period bonuses do not have to be returned if rainmaker decisions eventually lead to losses for their firms, since large bonuses continue to be paid even when firms in fact suffer large losses, and since governments can be counted on to bail out the largest financial firms in a crisis, it is rational for rainmakers to use unsustainable leverage to invest in recklessly risky assets in the bubble. A review of the modest literature on financial firm compensation practices in general and those of investment banks in particular demonstrates that the giant bonuses of the recent past are not appropriate returns to human capital – they are unjustified rents. The paper discusses possible answers to the challenging questions: what is the source of rainmaker rents and how are they sustained over time? Answers to these questions can help guide debates over the appropriate regulation of financial markets. They are also necessary inputs to the development of an adequate theory of the “rainmaker” financial firm that can help us understand how these firms were able to maximize the compensation of their key employees through policies that destroyed shareholder value and created systemic financial fragility. To my knowledge, no such theory currently exists. Key Words: bonuses; investment banks; leverage; financial crisis; perverse incentives JEL Codes: G01; G24; G10

3
I. Introduction
It is now universally agreed that the US and global economies have experienced
their worst financial crisis since the 1930s, one that contributed to a severe global
downturn. This financial crisis has led to massive government bailouts around the world.
There is debate about the respective roles of the real and financial sectors in the creation
of this crisis, but it is undeniable that financial markets were at least a major contributor
to the crash. From a US-centric perspective, it is clear that the evolution of financial
markets since the end of the 1970s led almost inevitably to a crisis moment such as this.
In response to economic problems and political pressure in the 1970s and very early
1980s, the US government began to accelerate an ongoing process of financial market
deregulation. A combination of deregulation and fast-paced financial innovation led to a
series of financial crises both in the US and elsewhere. These crises were met by
government bailouts, which restored vitality to financial markets, but also created severe
moral hazard – an increasingly assured belief among leaders of financial institutions that
the government would always intervene to limit the depth and duration of any financial
downturn. Thus, it was safe for them to take increasing risk and use increasing leverage
to increase profit and maximize the compensation of their key people – hereafter known
as “rainmakers” – during periods of financial market booms. As a result, crises became
more threatening, bailouts bigger, and subsequent financial booms more vigorous. The
term rainmaker is usually taken to mean those who can generate high sales for the firm. I
use it here to denote all key people in financial firms who are responsible for generating
high revenue and profit.1
More important, these cycles were imbedded in a long term trend in which
financial markets grew ever larger relative to the real economy, and global financial
markets became increasingly integrated. Financial profits as a share of total corporate
profits, which was about 10% in the early 1980s reached 40% in the mid 2000s. In 1981,
US private debt was 123 per cent of gross domestic product; by the third quarter of 2008,
It thus includes top executives, traders and sales people, wealth
managers, and M&A and IPO teams.
1 Standard and Poor’s made the following comment in a report on investment banking: “The competitive environment also is such that the various firms are always competing for the most talented employees: the “rainmakers”” (Standard and Poor’s 2009, p. 28).

4
it was 290 per cent. In 1981, household debt was 48 per cent of GDP; in 2007, it was 100
per cent.
The biggest rise in indebtedness took place in the financial sector itself. The
gross debt of the financial sector rose from 22 per cent of GDP in 1981 to 117 per cent in
the third quarter of 2008. This rapid rise in financial firm borrowing fueled the financial
boom. Borrowed funds were used to bid up asset prices, creating higher collateral values
that in turn enlarged the borrowing capacity of speculators. This paper focuses special
attention on the giant investment banks, whether independent or part of financial
conglomerates, because they were the main source of the financial innovations that were
at the center of the recent global financial crisis and because they were the most powerful
financial institutions whose destructive behavior was shaped by the perverse
compensation systems discussed at length in the paper. According to the Fed’s flow of
funds data, the liabilities of the investment banking sector rose from $548 billion in 1995
to $3 trillion in 2007, an annual growth rate of 16%. Between 2002 and 2007 alone,
liabilities grew by 138%. (In the midst of the crisis in the first quarter of 2009, liabilities
fell to $1.8 trillion.) Fast growth in borrowing led to increased leverage ratios and thus
greater financial firm risk. But it also led to rising revenues and profit. Given the
compensation schemes used in many large financial firms, rising revenues and profit lead
to even more rapid rises in rainmaker bonuses. Rising leverage thus provided a major
source of funding for the spectacular increase in the compensation of top bank.
The rising relative size of financial markets created structural systemic financial
fragility in which the financial claims on real-sector cash flows became ever larger
relative to the cash flows themselves. Financial claims also became more complex.
Mortgages were rolled into mortgage backed securities, which were sliced and diced into
collateralized debt obligations. Credit default swaps were then written on collateralized
debt obligation tranches. The extreme complexity of structured financial products made
them non-transparent or opaque, which made it easy for markets to substantially
underestimate their risk in the bubble. Before 2008 it was not clear when this process
would end, or what the end game would look like. But it was clear, at least to some, that
5
the entire process had become unsustainable.2
As this paper will show, rainmakers received huge bonuses by taking excessive
risk and using dangerous levels of leverage, and they did not have to return these bonuses
when their risk-seeking caused their firms and the entire financial system to crash.
Indeed, they continued to receive exorbitant bonuses even in the downturn. The
asymmetry in rainmaker compensation schemes combined with deregulation and
destructive financial innovation made the outbreak of a serious crisis almost inevitable.
(For an analysis of the financial causes of the recent crisis, see Crotty 2009.)
By the fall of 2008 it was apparent to
everyone that the global financial system was on the verge of collapse.
3
Financial institutions infected by perverse incentives include independent
investment banks, large commercial-bank centered financial conglomerates (that include
in-house investment banks, hedge and private equity funds), hedge funds, private equity
funds, institutional investors such as mutual funds, general and monoline insurance
companies and ratings agencies. Perverse compensation incentives led ratings agencies to
hide the buildup of excessive risk throughout the system by giving safe ratings to
extremely dangerous financial products.
4
Among the financial institutions with perverse incentives, investment banks –
whether independent or part of financial conglomerates - played a crucial role in creating
recent boom-bust cycles and the secular expansion of financial markets in our era. They
were the source of most of the financial innovations - such as mortgage backed securities,
collaterized debt obligations of various kinds and credit default swaps - that helped create
the crisis. Investment banks were also at the center of the leverage creation process. Half
of the spectacular rise in US investment bank’s return on equity in the four years leading
2 See for example Crotty 2007. Sitglitz 2010b includes himself along with Noriel Rubini, George Soros, Stephen Roach, Robert Shiller and Robert Wescott as economists who warned of an impending financial crisis. 3 Paul Krugman argued that “there was nothing accidental about the crisis.”
From the late 1970s on, the American financial system, freed by deregulation and a political climate in which greed was presumed to be good, spun ever further out of control. There were ever-greater rewards — bonuses beyond the dreams of avarice — for bankers who could generate big short-term profits. And the way to raise those profits was to pile up ever more debt, both by pushing loans on the public and by taking on ever-higher leverage within the financial industry. (Krugman 2010)
4 In April 2007, one analyst at Standard and Poor’s said their ratings model “did not capture “half” of a deal’s risk… We should not be rating it.” A colleague responded: “We rate every deal. It could be structured by cows and we would rate it” (Moran 2009, p. 94).

6
up to the crisis was generated by higher leverage rather than smart investing, efficient
innovation or even boom-induced capital gains on trading assets.5
Compensation practices differ across financial market segments, but they all share
the characteristic that their rainmakers can maximize their compensation over time by
taking excessive risk in the boom.
6
By paying huge bonuses on the basis of short-term performance when negative bonuses are impossible, banks create huge incentives to disguise risk-taking as value creation. Moreover, if bankers are rewarded for pursuing risky strategies that appear highly profitable for an extended period and then blow up, it is others who pay the costs. Given the extreme difficulty for outsiders, even top management, of monitoring the true risks being run, the result is a disaster just waiting to happen. But, of course, top management is itself part of the problem: it, too, has huge incentives to bet the bank. (“Curbing the excess of bankers’ pay,” March 7 2008)
A Financial Times editorial put the problem as
follows:
A Wall Street Journal article expressed a similar understanding of the dangers of
perverse incentives.
Bankers' pay must be regulated. The industry's one-way incentive structures have led bankers to run amok with other people's money -- contributing to the chaos in financial markets. When their bets pay off, bankers and traders carry home massive bonuses. When the bets crater, they don't hand those bonuses back. If bankers aren't forced to face the full consequences of their folly, the current mess will be repeated. (“Why Banks Need Pay Fix Compensation Practices Lack Teeth to Penalize Traders Who Lose Big,” March 11, 2008).
Alan Blinder stated the problem this way: “From the point of view of the
companies’ shareholders [the rainmaker compensation scheme]… is madness.” Using a
coin flip analogy in which heads represents a risky decision that pays off and tails one
that leads to losses, he says that from the shareholders’ perspective:
the gamble looks like: Heads, we get a share of the winnings; tails, we absorb almost all the losses. The conclusion is clear: Traders and managers both want to flip more coins – and at higher stakes than shareholders would if they had any control, which they don’t. The source of the problem is quite simple: Give smart
5 “Higher leverage fully accounts for the rise in UK banks’ returns on equity up until 2007” (Alessandri and Haldane 2009, p. 8). 6 A detailed description of perverse incentive practices in different financial markets is provided in Crotty 2008.

7
people go-for-broke incentives and they will go for broke. Duh. (Wall Street Journal, "Crazy Compensation and the Crisis” May 28, 2009)7
Diamond and Rajan argue that bonus driven compensation schemes:
gave traders an incentive to take risks that were not recognized by the system, so that they could generate income that appeared to stem from their superior abilities, even though it was in fact only a market-risk premium. The classic case of such behavior is to write insurance on infrequent events, taking on what is termed “tail” risk. If traders are allowed to boost their bonuses by treating the entire insurance premium as income instead of setting aside a significant fraction as reserve for an eventual payout, then will have an excessive incentive to engage in this sort of trade. (Cited in Rajan 2009b, p. 3)
Nobel laureate George Akerlof and Rachel Kranton note that in recent decades
economists have argued that employees would “work harder and make better decisions
under a ‘pay-for-performance’ system,” a theory that “became popular in boardrooms -
especially since it was an influential argument for increasing the pay of the chief
executive and top officers.” They suggest several reasons why the argument is specious.
First, top management does not know what impact employee decisions will have on the
long-term performance of the firm: “superiors do not hold the same information [as
rainmakers] and the results play out years later.” Second, the risk-return profile of the
firm is not independent of its compensation system: a bonus system will “attract precisely
those who are willing to take on more risk.” Third, “to get their [bonuses], employees
may manipulate the system, against the interests of those who set up the incentives”
(Financial Times, “It is time to treat Wall Street like Main Street, February 25, 2010).8
Though almost everyone now acknowledges that perverse compensation
incentives were a major cause of the financial crisis, there has been surprisingly little
serious academic analysis of the existence and reproduction of dysfunctional
compensation practices in financial institutions. Why and how did these practices evolve?
What explains the premiums paid to top financial employees relative to those working in
other industries? Are rainmaker compensation practices consistent with the reproduction
of financial firms over the long run? Are they compatible with the interests of
7 As explained below, there are good reasons to believe that shareholders would not restrain risk-taking in the boom even if they could. 8 The last point makes the dubious assumption that rainmakers’ superiors want to maximize long-term return.

8
shareholders? Are they justified by exceptional long-term creation of shareholder value?
Can it be shown that rainmakers have superior human capital as compared to top earners
in other industries who make much less than they do? Or are rainmaker premiums rents,
achieved not as a just reward for exceptional productivity but because rainmakers have
the power to extract pay far in excess of their long-term contributions to shareholder
value? If so, what is the source of this power?
The answers to these questions have important implications for the theory of
financial firms and of financial markets, as well as for the debate over whether financial
markets are “efficient” with respect to the setting of financial security prices and the
allocation of real resources across competing uses. Answers to these questions can also
help us better understand whether the rapid rise in inequality experienced over the past
two decades has been driven by widening efficiency and productivity gaps among
employees or, rather, has been primarily determined by relative power relations.
We need answers in order to inform the current debate about government regulation of
financial firm compensation. (Not surprisingly, rainmakers do not think tighter regulation
a good idea.) Strong regulation of large financial institution compensation schemes is a
necessary component of effective regulation, but, by itself, it cannot force financial
markets to operate in the public interest. A more complete set of proposals for regulatory
reform is suggested in Crotty and Epstein 2009.
We know both the origin of, and the justification for, bonus-dominated
compensation schemes in investment banking. Most investment banks began as limited
partnerships. As such, the firm was solely devoted to maximizing the income of their
rainmakers – the bank’s partners. Financial markets tend to be more volatile than most
nonfinancial markets. The bonus system - in which a modest base salary is supplemented
by a large but variable bonus whose size depends upon bank and individual performance
has the distinct advantage that, if adequately elastic in the downturn, it can quickly and
substantially cut compensation costs in down markets to protect the integrity of the firm
and shareholder profit. This is the primary justification used to defend the bonus-based
compensation scheme used in financial markets. Though bonuses would rise substantially

9
in financial market booms, they were supposed to also fall dramatically when markets
crashed.9
The next section demonstrates that the bonus system actually used by large
financial firms was qualitatively different than the ideal bonus system just described.
Moreover, in recent years the practice of granting investment bank rainmakers multiple
year guaranteed bonuses and retention bonuses (ostensibly designed to prevent top
rainmakers from moving to other firms) has blossomed. Guaranteed and retention
bonuses also demonstrate that modern bonus-based compensation schemes are typically
not used for their original purpose because they do not decline with revenue and they are
paid without regard to employee or firm performance. “A guaranteed bonus might strike
many people as a contradiction in terms. But on Wall Street, banks have become so eager
to lure and keep top deal makers and traders that they are reviving the practice of offering
ironclad, multimillion-dollar payouts guaranteed, no matter how an employee performs.”
Even firms kept on life support by government funds continue to engage in this practice.
In early 2009, Citigroup, which was on government life-support after its disastrous
collapse, lured senior derivatives traders, a category of employee responsible for
excessive risk taking in the boom, with multimillion dollar, multiyear guaranteed
bonuses. Government-owned AIG will pay $281 million in guaranteed retention bonuses
to key members of its sales force in 2008 (Dash 2009).
10
The structure of the paper is as follows. Section II presents and evaluates data on
rainmaker compensation in giant investment banks. The data show that rainmaker
compensation is very large, and that its asymmetric properties generate strong incentives
for excessive risk taking in financial booms. Section III reviews the modest literature on
compensation in financial firms in general and investment banks in particular. It
demonstrates that rainmaker premiums have been quite large in recent decades and that
they can not be explained as returns to human capital – they are rents. Section IV
discusses possible answers to the difficult question: where do the rainmaker rents come
9 It was also believed that a bonus system would induce partners to work as hard as they could, since each would get a piece of the extra revenue she generated, and that it would induce cooperation among partners because each partner shared in the fruits of every other partner’s labor. 10 In announcing plans to regulate bonuses, French President Sarkozy stated that “guaranteed bonuses are to be banned” (Financial Times, Sarkozy tightens bonus rules,” August 26, 2009).

10
from and how are they sustained? The final section summarizes conclusions from this
analysis.
II. Rainmaker Compensation Schemes: The Primacy of Bonuses
Bonuses in Boom and Bust
The most authoritative data on bank compensation practices in the recent boom
and crisis were collected by New York State Attorney General Andrew Cuomo, who
published a report on the subject aptly titled “No Rhyme or Reason: The ‘Heads I Win,
Tails You Lose’ Bank Bonus Culture” (Cuomo 2009). His summary of the report’s
findings is so important that I quote from it extensively.
Bonuses are supposed to rise when revenues rise, but then fall quickly when
revenue declines sharply in downturns in order to sustain profit and protect shareholder
interests in a very volatile business. That is the rationale for paying top employees such a
high percent of their compensation in bonuses rather than as fixed salaries. Top
employees on Wall Street “typically make 90% or more of their compensation in year-
end bonuses (Wall Street Journal, “Bank Bonus Tab: $33 Billion Nine Lenders That Got
U.S. Aid Paid at Least $1 Million Each to 5,000 Employees,” July 31, 2009). And since,
in the years leading up the crisis, “most bankers could expect to receive anywhere from
60-90 per cent of their bonuses in cash,” the bonus system created powerful incentives to
take risk now and not worry about what problems this might cause for the firm later
(Financial Times, “Bonus culture remains strong,” February 10, 2010). But Cuomo
concludes that “even a cursory examination of the data suggests that in these challenging
economic times, compensation for bank employees has become unmoored from the
banks' financial performance. Thus, when the banks did well, their employees were paid
well. When the banks did poorly, their employees were paid well. And when the banks
did very poorly, they were bailed out by taxpayers and their employees were still paid
well.” He continues:
Bonuses and overall compensation did not vary significantly as profits diminished. An analysis of the 2008 bonuses and earnings at the original nine TARP recipients [of $125 billion in government bailouts] illustrates the point. Two firms, Citigroup and Merrill Lynch suffered massive losses of more than $27 billion at each firm. Nevertheless, Citigroup paid out $5.33 billion in bonuses and Merrill paid $3.6 billion in bonuses. Together, they lost $54 billion, paid out

11
nearly $9 billion in bonuses and then received TARP bailouts totaling $55 billion. For three other firms - Goldman Sachs, Morgan Stanley, and JP. Morgan Chase -2008 bonus payments were substantially greater than the banks' net income. Goldman earned $2.3 billion, paid out $4.8 billion in bonuses, and received $10 billion in TARP funding. Morgan Stanley earned $1.7 billion, paid $4.475 billion in bonuses, and received $10 billion in TARP funding. JP. Morgan Chase earned $5.6 billion, paid $8.69 bil1ion in bonuses, and received $25 billion in TARP funding. Combined, these three firms earned $9.6 billion, paid bonuses of nearly $18 billion, and received TARP taxpayer funds worth $45 bil1ion (Cuomo 2009, pp. 1-2, emphasis added).11
Losses reported by Merrill totaled $35.8 billion in 2007 and 2008, enough to wipe
out 11 years of earnings previously reported by the company. Yet for the 11-year period
from 1997 to 2008, Merrill’s board gave its chief executives alone more than $240
million in performance-based compensation (New York Times, “After losses, a move to
reclaim executives’ pay,” February 22, 2009). John Thain took over as Merrill’s CEO
after Stanley O’Neil had been relieved of his command (with a $161 million golden
handshake). Though he worked only one month in 2007, his total compensation that year
was valued at $83 million (Prins 2009, p. 84).12
Taking a full-cycle view, Cuomo shows that while compensation did accelerate in
the boom, it failed to shrink in line with revenue in the crash. Indeed, as earnings at key
banks collapsed, it increased.
For instance, at Bank of America, compensation and benefit payments increased from more than $10 billion to more than $18 billion between 2003 and 2006. Yet, in 2008, when Bank of America's net income fell from $14 billion to $4 billion, Bank of America's compensation payments remained at the $18 billion level … even though 2008 performance was dismal when compared to the 2003-2006 bull market. Similar patterns are clear at Citigroup, where bull-market compensation payments increased from $20 billion to $30 billion. When the recession hit in 2007, Citigroup's compensation payouts remained at bull-market levels –well over $30 billion, even though the firm faced a significant financial crisis. (Cuomo 2009, p. 2)
11 A major source of public frustration with the TARP program was the perception that banks who received government funds used them primarily to pay bonuses and dividends rather than to expand credit to the public as intended. 12 After Merrill was rescued from potential collapse by a takeover by Bank of America, its CEO John Thain requested a $10 million dollar bonus from the Board. An “icy-worded” letter from Cuomo reinforced by negative public opinion forced Thain to rescind his request (Prins 2009, p. 24).

12
The collapse of Lehman Brothers destroyed $22 billion of shareholder value as
measured by the decline in the book value of equity. Yet compensation in 2008 was
larger than in 2004 when the firm was profitable. “Lehman paid out $55 billion to
employees in the decade to the end of 2008. Shareholders earned cumulative profits of
zero, including the loss of all of their capital when the firm failed” (The Economist, July
18, 2009 p 72, “Are investment banks run for employees or shareholders?”).
Merrill Lynch defended bonuses for its rainmakers as good for shareholders
because they helped create record revenues and profit in the boom and would evaporate if
markets turned down. Yet when revenues plummeted in 2007, Merrill Lynch simply
switched its stated compensation philosophy so it did not have to slash bonuses.
For example, as Merrill Lynch's performance plummeted, Merrill severed the tie between paying based on performance and set its bonus pool based on what it expected its competitors would do. Accordingly, Merrill paid out close to $16 billion in 2007 while losing more than $7 billion and paid close to $15 billion in 2008 while facing near collapse. Moreover, Merrill's losses in 2007 and 2008 more than erased Merrill's earnings between 2003 and 2006. Clearly, the compensation structures in the boom years did not account for long-term risk, and huge paydays continued while the firm faced extinction (Cuomo 2009, p. 2).
Note that if all investment banks pay their rainmakers whatever competitors are expected
to pay their rainmakers, there is no effective restraint on rainmaker compensation.
Cuomo concludes that the “repeated explanation from bank executives that
bonuses are tied to performance in a manner designed to promote [long-term] growth
does not appear to be accurate. Indeed, our investigation suggests a disconnect between
compensation and bank performance that resulted in a "heads I win, tails you lose" bonus
system” (Cuomo 2009, p. 2). Babchuk and Cohen examined compensation as a share of
“Earnings Before Compensation” (EBC) for Cuomo’s group of banks. This represents the
employees’ share of the pool of funds available to be divided between employees and
shareholders. From 2003-2006, this varied between 52% and 62%. In the difficult first
half of 2009, it shot up to 74%. Bebchuk asked: “Might financial firms be letting
employees eat part of the investors’ lunch?” (Bebchuk and Cohen 2009). Rather than
protect shareholders, the bonus system was enriching rainmakers at the expense of
shareholders.

13
In January 2010 the Wall Street Journal estimated that major US banks and
securities firms were “on a pace to pay their people about $145 billion for 2009, a record
sum that indicates how compensation is climbing despite fury over Wall Street’s pay
culture” (“Banks Set for Record Pay,” January 14, 2010). In fact, compensation totaled
$140 billion, which broke the previous high of $123 billion in 2007 (Wall Street Journal,
“Traders Beat Wall Street CEOs in Pay,” April 6, 2010). The Financial Times estimated
that the top five investment banks alone paid out $50 billion in bonuses in 2009 (“Don’t
bank on voters forgetting,” January 16-17, 2010). The case of Morgan Stanley is
especially egregious. In 2009 it suffered the first annual loss in its 74 year history, yet it
set aside $14.4 billion for bonuses and salaries - “62 cents of every dollar of revenue.”
Since perverse incentives were not been eliminated as a result of the crisis, the
inducement to risk-taking remains strong. Following Goldman’s recent demonstration
that greater risk-taking was the path to higher profit, Morgan Stanley’s CFO promised to
raise his firm’s profit by “increasing risk-taking its trading business.” (New York Times,
“Morgan Stanley’s Quarter is Weak. Unlike It’s Pay Pool,” January 21, 2010).
These data demonstrate that it is rational for top financial firm operatives to take
excessive risk in the bubble even if they understand that their decisions are likely to cause
a crash in the intermediate future. Since they do not have to return their bubble-year
bonuses when the inevitable crisis occurs, since they continue to receive substantial
bonuses even in the crisis, and since they can be reasonably assured that the government
will see to it that the crises they cause are as brief and as shallow as possible, rainmakers
have a powerful incentive to pursue high-risk, high-leverage strategies.13
Many commentators who work in financial markets, the business media and in
universities have claimed that the large losses suffered by rainmakers in the crash provide
evidence that the assertion that perverse incentives were an important cause of the crisis
is untrue. However, while many rainmakers did suffer substantial losses on their
The perverse
incentives of the bonus system were thus were a major cause of both boom and crash.
13 The fact that financial markets have become so large relative to real sector, so highly leveraged, and so systemically risky, enables rainmakers to be sure that governments have no choice but to bail them out when crises erupt. As Goldman Sachs SEO Lloyd Blankfein assured an interviewer: “If the financial system goes down, our business is going down and, trust me, yours and everyone else’s is going down too” (Arlidge 2009). Rainmakers gain enormous power by the structural blackmail built into modern financial markets.

14
shareholding in late 2008 and early 2009, their cash bonuses and cumulative realized
gains from stock sales in preceding years far exceeded their losses. (Moreover, most
financial stocks have risen substantially since early 2009.) Losses in the meltdown of
Bear Stearns and Lehman Brothers are the supposed trump cards in this debate. Their top
executives suffered very large losses in the value of their stock when their firms failed.
However, an excellent paper by Bebchuk, Cohen and Spamann (2009a) uses SEC
filings to demonstrate that the top executives at Bear Stearns and Lehman Brothers
received very large net compensation in the period from 2000 through -and therefore
including - their firms’ demise. From 2000 through 2007, the top five executives at Bear
Stearns pocketed $300 million (in 2009 dollars) in cash bonuses. In addition, from 2000
through 2008 they sold shares and options worth $1.1 billion. Their counterparts at
Lehman brothers received $150 million in cash bonuses and $850 million from the sale of
shares and options. As Bebchuk et.al. stress, the ability to cash out their equity positions
at any time exacerbated the perversity of their compensation schemes. Moreover, even if
they knew their company’s stock might crash sometime in the intermediate future, they
could hedge the personal cost of the crash by selling early or through the appropriate use
of derivatives. The compensation of the Bear executives over the period was 75% higher
than the value of their boom-inflated equity positions in 2000, while that of the Lehman
executives was 67% higher. The average compensation for these ten executives for the
period from 2000 through the collapse of their firms was about $250 million. Former
Bear CEO James Cayne and former Lehman CEO Richard Fuld came out way ahead of
the game even though they suffered very large losses when their firms’ shares collapsed.
Cayne netted $388 million for the period, while Fuld netted $541 million.14 Shareholders,
of course, suffered disastrous losses.15
14 Bear’s CEO received $88 million in cash and $289 million in equity sales over the period, while Lehman’s CEO received $71 million in cash and $471 million in equity sales (in 2009 dollars). Cayne sold $61 million in shares in 2008, an unusually large amount; perhaps he had a premonition of disaster.
15 Rainmaker losses may be exaggerated because they can hedge their stock options and restricted stock awards so that they do not suffer material losses when the company stock declines. In a study of 911 firms over 11 years Bettis, Bizjak and Kalpathy 2009 concluded: “Theory supports aligning executives’ personal wealth interest with that of shareholders by granting significant equity rights to executives via stock options and restricted stock awards. However, executives can easily delink their personal fortunes from those of the firm by entering into hedging contracts.” Moreover, they found “compelling empirical evidence that, on average, executives appear to use hedging instruments ‘opportunistically by entering into these transactions ahead of poor share-price performance and ‘bad news’ corporate events.”
15
The authors conclude that perverse incentives are indeed a serious problem.
“Repeatedly cashing in large amounts of performance-based compensation based on
short-term results did provide perverse incentives – incentives to improve short-term
results even at the cost of an excessive rise in the risk of large losses at some (uncertain)
point in the future.” “Given the structure of executive pay, the possibility that risk-taking
was influenced by these incentives should be taken seriously. The need to reform pay
structures is not, as many have claimed, simply a politically convenient sideshow”
(Bebchuk, Cohen and Spamann 2009b).
These executives would certainly have been better off if their firms did not fail,
but even given their firms’ failure – which their risk-taking caused, the trip as a whole
was richly rewarding to them.16 17
He had known for years that Lehman Brothers’ day of reckoning could come – and worse, that it might sneak up on him. Intellectually, he understood the risks associated with cheap credit and borrowing money to increase the wallop of your bets – what is known on the street as “leverage.” But, like everyone else on Wall Street, he couldn’t pass up the opportunities. The rewards of placing aggressively optimistic bets on the future were just too great. (Sorkin 2009, p. 14)
Andrew Ross Sorkin offered an interesting
interpretation of the dilemma facing top rainmakers in the heat of the boom in an analysis
of decision making by Lehman Brothers CEO Richard Fuld:
18
16 We cannot know the extent to which these executives were aware that their firms’ risk-taking was likely to threaten their solvency. It is possible they bought in, to some degree, to their own propaganda about the safety of the firms under their watch during the boom. And the fact that they held large amounts of stock when stock prices crashed indicates that they were not aware that their firms were on the verge of collapse, or they counted on a government bailout. The timing of the end-game is always uncertain. The point is that even if they were fully aware that their excessive risk-taking in pursuit of bonuses would be sure to endanger their firms, it was in their material interest to continue down this path. Moreover, the fact that they made so much money in the boom by taking excessive risk, and did not have to return it in the event of a crash, was likely to have subconsciously predisposed them not to focus on the possible dangers of their actions. 2009). 17 An article focused on the rise and fall of Erin Callan, former Lehman CFO, reinforces this point. It notes that most Lehman rainmakers landed on their feet after the firm’s collapse. “Today, 18 months after Lehman’s bankruptcy, most of Callan’s ex-colleagues are back in the game. Some, like Fuld, have started their own firms. Others have moved to private equity. Many have landed at Barclay’s, the British bank that bought the firm’s core out of bankruptcy” (Fortune Magazine, “The fall of a Wall Street highflier,” March 22, 2010, p. 143). 18 Warren Buffett described the dilemma facing rainmakers in the bubble: "The giddy participants all planned to leave just seconds before midnight. There's a problem, though: they're dancing in a room in which the clocks have no hands" (Financial Times, “Look back in anger at the spirit of the past age,” December 29, 2009).

16
Figure 1 allows us to take a longer view of the rainmaker-shareholder relation and
changes therein, utilizing pre-tax profit data for investment banks (or broker-dealers)
listed on the New York Stock Exchange (available from the Securities Industry and
Financial Markets Association (SIFMA)), as well as data on bonuses at Wall Street firms
(securities firms located in New York City) collected by the New York State
Comptroller’s Office.19
Figure 1 establishes two important facts about the growth of investment banks and
the effects of their compensation practices on the firm and its shareholders over the
period from 1985 to 2008. First, it shows the enormous growth of industry profits in this
era. Profit from 1985 to 1990 averaged about $2.5 billion annually. From 1991 to 1994 it
averaged $5.5 billion. In the first of the two recent financial booms, from 1995-2000,
annual profit averaged $13 billion – over five times the size of average profit in 1985-90.
There was a financial downturn in 2001-02 that cut profit, but at its nadir it was still
about $7 billion. The next boom began in 2003, and, according to SIFMA 2008, the total
revenue generated by New York Stock Exchange firms continued to rise to its peak in
2007. At $352 billion, total revenue was 44% higher in 2007 than it had been in 2000.
However, profit fell by $9.6 billion in 2007 as bonuses and total compensation rose
relentlessly. The high-risk, high-leverage strategies that drove the revenue boom finally
exploded on shareholders in 2007 and 2008, leaving large losses in their wake.
Note that while the firms in the two series are not identical, and
thus comparisons between them are imprecise, the general trends in both series and in the
relation between them should be reliable because both are dominated by the giant Wall
Street investment banks. Note also that the bonus data seriously underestimate the actual
bonuses received by Wall Street rainmakers because they do “not include stock options
that have not yet been realized or other forms of deferred compensation” that constitute a
substantial proportion of bonus money” (New York State Comptroller’s Office 2010).
Second, it shows that the relationship between bonuses and pre-tax profit
changed substantially over time. The dominance of rainmaker interests became stronger
toward the end of the period. Until the latest boom, bonuses were less than profit in years
when profit was rising, although the relative difference between them declined over time.
Starting in 2004, bonuses exceed profit every year. From 2004 through 2006, the gap
19 Unfortunately, SIFMA does not have after-tax data for its sample of firms.

17
between bonuses and profit became very large. In 2005, bonuses rose by $6.9 billion
while profit fell by $4.2 billion – a perverse elasticity. Bonuses were 170% larger than
profit that year. Compensation growth was now substantially eroding profit as the bonus
system was successfully used by rainmakers to capture revenue that would normally be
expected to go to shareholders. In 2006 profit rose by $11.4 billion while bonuses
increased by $8.7 billion, so the gap narrowed, but at $13.2 billion was still very large.
The data for 2007 and 2008 reflect the bizarre character of the evolving rainmaker
financial firm during the crash it helped create. In 2007 these firms collectively lost $11.3
billion. To reward themselves for generating these losses, rainmakers paid themselves
bonuses of $33 billion, an amount far greater than paid in any other year, with the
exception of 2006. At $33 billion, 2007 bonuses were only $1below the previous boom
year. The bonus system clearly was not working as advertised. If bonuses had declined in
2007 to their 2002 level, a year in which firms made almost $7 billion in profit, these
firms would have made $26 billion in profit in 2007.20
The massive bailout of Wall Street by the US government discussed below was,
from the perspective of the big banks and their rainmakers, if not for the taxpayer, a
smashing success. Though the financial system suffered a near-death experience in late
2008 and early 2009, a $12 trillion rescue effort by the government triggered a
miraculous recovery. According to the New York State Comptroller’s Office:
In 2008, the full force of the
meltdown caused Wall Street to lose a record-high $42.6 billion dollars. Bonuses fell
substantially, but at $17.4 billion they were about equal to the 2004 bonus total (when
profit was $13.7 billion). Rainmakers, especially at dominant firms, were endangering
their firms and short-changing shareholders so they could maximize their own
compensation. This is a marvelous example of the unconstrained power of rainmaker-
dominated Wall Street firms.
Wall Street bonuses paid to New York City securities industry employees rose by 17 percent to $20.3 billion in 2009… Total compensation at the largest securities firms grew even faster and industry profits could exceed an unprecedented $55 billion in 2009, nearly three times greater than the previous all-time record. (New York State Comptroller’s Office 2010)
20 While, as noted, these series are not fully consistent, the general conclusion stated here is correct. If bonuses had been set at 2002 levels in 2007, investment banks would collectively have generated large profits instead of suffering substantial losses.

18
The profit estimate for 2009 is astounding - perhaps too high to be credible. But
the bonus figure of $20.3 billion is clearly far too low. The fact that the bonus series used
here underestimates actual bonuses because it does not count unrealized gains on stock
options and other forms of deferred bonuses was noted above. However, the degree of
under-estimation was especially pronounced in 2009 because, under pressure from the
public and some regulators, many financial firms increased the proportion of rainmaker
pay that comes in the form of deferred compensation. In 2009, “many financial firms
delayed payments and paid a greater share in stock or other forms of deferred
compensation” (New York State Comptroller’s Office 2010). It is likely that 2009 set a
record for rainmaker compensation as well as for profits. We know that the total
compensation paid to employees at “leading Wall Street firms” in 2009 was a record high
(Wall Street Journal, “Traders Beat Wall Street CEOs in Pay,” April 6, 2010). 2009
compensation data demonstrate yet again that it is rational for rainmakers to take
excessive risks in the boom that help cause financial crises. Even when the system
crashed in 2008, their bonuses were substantial, and the severe threat to the economy
caused by the crash forced the government into a rescue operation so large that it pushed
profit and bonuses to record highs just one year later. In the current regime, there is no
downside to excessive risk-taking by rainmakers.
Figure 2 compares estimated bonuses with net earnings (or profit) for the big five
independent investment banks. (Financial conglomerates Citigroup and JPMorgan Chase
also have giant investment banks. These seven firms dominated the US investment
banking industry.) The information is taken from the Compustat data base. Since income
statement filings with the SEC do not contain bonus information, bonuses are estimated
to be 60% of total compensation, a standard industry assumption. Two of the firms
essentially failed in the midst of the crisis and were taken over by other banks with
government assistance. Merrill Lynch was absorbed by Bank of America after the
government offered to pay up for to $29 billion of possible future losses associated with
the takeover, and Bear Stearns was taken over by JPMorgan Chase.21
21 As discussed below, this reorganization of the dominant section of the US investment banking industry has increased the market power of the remaining firms, with Goldman Sachs and Morgan Stanley now more powerful than ever.
The government
19
permitted Lehman Brothers to collapse without arranging its takeover, a decision
generally believed to have severely worsened the global crisis. For this reason, there is no
available data on bonuses and profit for these three banks in 2008 in the Compustat data
base. Cuomo 2009, however, shows that Merrill Lynch paid $16 billion in compensation
and benefits in 2008 while suffering a loss of $27.6 billion dollars. The Economist
estimated that Lehman Brother’s net income was minus $22.5 billion in 2008 while total
compensation was $6 billion, higher than in the boom year of 2004 (July 18, 2009 p 72
“Are investment banks run for employees or shareholders?”).
Growth in earnings and bonuses since the early 1990s is impressive. Bonuses are
always larger than net earnings, often by a substantial amount. Bonuses are especially
large in the recent boom. More important, the data show that the bonus system failed to
protect the firm and its shareholders in recent downturns. Bonuses generally fell by less
than net earnings in the down years of 2001 and 2002. For Bear Stearns and Merrill
Lynch, 2007 was a very bad year; the former saw net income drop by over 85%, while
the latter suffered an $8 billion loss. Yet bonuses at Bear Stearns fell by only about 20%,
while bonuses at Merrill Lynch declined marginally, exceeding every previous year but
2006. In 2008 both firms self-destructed. Net earnings at Morgan Stanley fell by more
than half in 2007, yet bonuses rose. Goldman’s net earning fell by about 80% in 2008
while bonuses declined by less than half and are on pace to hit record levels in 2009.22
Davis 2003 quotes an investment banker’s take on the industry’s compensation
system: “The big issue in investment banking is that the lunatics have taken over the
asylum; they have hijacked the income stream” (p. 72). The bonus-based compensation
system worked marvelously for investment bank rainmakers, but proved to be
2008 bonuses were higher than in 2004 and almost as high as in 2005, years in which net
earnings were substantially greater than in 2008. Morgan Stanley’s 2008 net earnings
were significantly lower than in every year since 1997 – for example, about 60% below
2006 – yet bonuses were larger than in any year from 1997 through 2005.
22Goldman defends its high bonuses in 2009 on the basis of good performance, but, as discussed below, in the absence of massive government intervention it too would have failed, so this defense is vapid.

20
dysfunctional for their shareholders, for their firms, for taxpayers and for the domestic
and global financial system.23
Rainmakers versus Shareholders
It is possible to compare the effects of the rainmaker compensation system on
both the shareholders and the rainmakers of the big five investment banks. Collective
rainmaker bonuses can be obtained by adding up the bonus values in Figure 2 over time.
They obviously get very large in the late 1990s boom and much larger in the boom that
followed. Bonuses stayed high in 2007, fell slightly in 2008, and rebounded in 2009. The
lion’s share of the bonuses went to the top employees I refer to as rainmakers. Cuomo
2009 estimates that in the disaster year of 2008, Merrill Lynch paid bonuses over one
million dollars to 696 employees (the top four recipients’ average bonus was over $30
billion), Morgan Stanley gave million-plus bonuses to 428 employees (with a top four
average of $18 billion), while 953 Goldman Sachs’ employees received over $1 million
bonuses (with a top four average of over $11 million). But gigantic or merely very large,
the key point about rainmakers’ bonuses is that they never have to give them back no
matter how badly the firm performs – even if it fails. Each year’s bonus gets added to
those in previous years.
What about shareholders? They receive capital gains in periods when the stock
price is rising, as well as dividends each year. Their returns are thus very high in years of
23 An interesting example of the conflict between rainmakers and their firms created by the bonus system came to light in reporting about a hedge fund called Magnetar. In 2006, Magnetar began to buy the riskiest ‘equity’ positions in CDOs. Since they were the equity owners, they were the CDO’s sponsor and, as such, could pressure the managers of the CDO, which is a separate legal entity, into putting especially risky MBSs into the CDOs, substantially increasing the likelihood that the CDO would fail. “Then Magnetar bought credit default swaps on the debt issued by the CDOs. If the CDOs collapsed, as many did, their equity would become worthless, but their credit default swaps would repay them many times over”(Kwak 2010). Magnetar made a lot of money using this strategy. This story shows how bizarre and inefficient modern financial markets had become. No one would have sold Magnetar inexpensive insurance against loss in the value of bonds in a risk-laden CDO if they knew how risky it was, or if credit ratings agencies weren’t systematically providing risky CDOs with high credit ratings. But it also sheds light on the effects of the bonus system. The banks that sold Magnetar CDS insurance at under-priced fees lost a lot of money. In one deal, Magnetar put $10 million into an equity position in a CDO, “then turned and shorted $1 billion of AAA-rated bonds issued by the CDO.” The investment bank JPMorgan Chase had insured the bonds in return for up-front fee of $20 million, but took an $880 million loss when the bonds failed, a serious blow to the bank’s profit. But since about $10 million of the fee money was used for compensation, the bank’s rainmakers “did just fine, despite having placed a ticking time bomb on their own bank’s balance sheet” (Kwak 2010).

21
financial exuberance such as we experienced from the mid 1990s to 2006. But they also
suffer large capital losses in financial downturns. In other words, while rainmakers keep
adding to their wealth in good years and in bad, shareholder have to subtract the bad-year
losses from the good-year gains. The standard way to measure shareholder gains over
time is by calculating what is called the “cumulative total return” (CTR) on the stock.
The total-returns calculation includes capital gains or losses over time (adjusted for stock
splits) and assumes dividends are used to buy more shares. CTR assumes you buy a stock
at one specific date and hold it until another specific date.
To estimate the effect of the financial boom and bust on shareholders we thus
have to select a terminal date for measurement. Should this be the low point for stock
prices in early 2009 or the most recent data available? I would argue that the most
relevant question in terms of evaluating the effect of perverse incentives on shareholders
is: what would have happened to shareholders if market forces alone had been left to
determine their fate? It thus seems reasonable to examine shareholder and rainmaker
returns along the path that their firms’ market activities brought them by March 2009,
prior to the rebound caused by radical government intervention in the market system.
Indeed, even this approach substantially under-estimates the damage to shareholder
returns that would have been done by the rainmaker compensation system because, left
only to market forces, returns would have continued to plummet after March, with no
obvious lower limit - other than zero.24
24 This is a general problem in assessing debates over strengths and weaknesses in financial markets since the late 1970s. In the absence of repeated government interventions to rescue or resuscitate crisis-ridden financial markets, the impressive secular growth of financial markets could not have occurred.
Most analysts agree the rise in stock prices after
their March nadir could not have taken place without the massive bailouts of financial
firms and the real-sector economic stimulus packages enacted both in the US and in most
of the rest of the world. Without an approximately $12 trillion dollar US financial market
bailout (that includes loan guarantees), accompanied by aggressive expansionary fiscal
policy, it is likely that all large US financial firms would have crashed (New York Times,
“Adding up the Government’s Total Bailout Tab,” February 4, 2009). The Center for
Media and Democracy estimated that federal agencies had directly disbursed $4.6 trillion
to financial firms: $700 billion through the Treasury’s TARP program and $3.8 trillion in

22
Fed loans (“CMD Releases Bailout Tally, $4.6 Trillion in Federal Funds Disbursed,”
April 1, 2010) http://www.prwatch.org/node/8987).25
Even the two strongest independent investment banks, Goldman Sachs and
Morgan Stanley, would not have survived in the absence of the bailout. In mid-
September 2008 Bernanke warned party leaders on capital hill that the “last two big
investment banks are under siege” (Moran 2009, p. 19). The claim that even the two
surviving independent investment banks would have failed had the government not
rushed to their rescue strongly reinforces our choice of March 2009 as the end date for
our CTR calculations. Therefore, we consider this matter in some detail before turning to
CTR data.
26
The Financial Times described the vigorous efforts of the Fed to prevent the
collapse of Goldman and Morgan Stanley.
The US Federal Reserve is attempting to shepherd Goldman Sachs and Morgan Stanley – the last two members of the dying breed of large US investment banks – to safety. It is throwing its arms around the two companies both as a supportive regulator and as a provider of liquidity on exceedingly flexible terms. Bankers say the Fed has also been making calls to banks telling them not to take advantage of the precarious position of Goldman and Morgan Stanley to poach business, and sharing its concerns with foreign central banks. Sunday night’s announcement that the Fed had approved their application to become bank holding companies and ensure they had full access to emergency loans during the transformation process was rushed out in time for the start of trading in Asia on Monday. The Fed is trying to help to shield them from the sudden collapse of their funding model – using short-term collateralised loans in the repo market – and help them to make the transition to another business structure. The US central bank has taken aggressive steps in recent days to backstop the repo market, which was traditionally funded in large part by money market mutual funds, which are now retreating to safe assets. Goldman and Morgan were probably the biggest single beneficiaries of these moves, including the easing of collateral rules on lending.
25 $2 trillion of these loans were was still outstanding as of April 2010. 26 Not only did the massive government bailout rescue the financial system from assured destruction, it provided an opportunity for clever firms to make money by betting that the rescue would take place. The top 25 hedge funds managers made a collective 25 billion dollars in 2009 - more than double what they made in 2008, much of it by engaging in heavily leveraged bets that the government would have to bail out the big banks. David Tepper made $4 billion by making a wager that “the government would not let the big banks fail, even as other investors fled financial shares amid fears that banks would collapse or be nationalized.” Tepper “loaded up on the preferred shares and bonds of the big banks in late 2008 and early 2009, correctly assuming that the government would not permit bigger institutions to fail.” He also made a killing by buying AIG bonds (New York Times, “Pay of Hedge Fund Managers Roared Back Last Year,” March 31, 2010). Note that these hedge fund overlords pay a 15% federal tax rate on their billions because they bribed Congress into treating their income as capital gains for tax purposes.

23
But the Fed wanted to ensure they had a credible new funding model – which will now include much greater use of deposits. … Analysts said the Fed moved to approve Goldman’s and Morgan’s application to become bank holding companies in record time. The US central bank – which will now be their chief regulator – has said it will allow them to phase in newly applicable regulations including those covering capital requirements rather than have to rush to comply with them immediately. By taking Goldman and Morgan into its embrace, the Fed appears to be making clear to the market that the two companies will be within the central bank’s safety net on a permanent basis and will have access for the foreseeable future to emergency liquidity. (Financial Times, “Fed moves to protect Goldman and Morgan Stanley,” September 22, 2008) 27 28
Rolling Stone's astute financial analyst Matt Taibbi argued that Goldman could not have survived without massive government assistance.
Less than a week after the AIG bailout, Goldman and another investment
bank, Morgan Stanley, applied for, and received, federal permission to become bank holding companies - a move that would make them eligible for much greater federal support. The stock prices of both firms were cratering, and there was talk that either or both might go the way of Lehman Brothers,
27 Nomi Prins emphasized how critical the Fed’s designation of both Morgan and Goldman as bank holding companies was to their survival. Two of the country’s most powerful investment banks, accustomed to making huge profits and
having limited government regulation, came to the Fed’s doorstep, hat in hand, and asked - nay begged! - for government help. They wanted the Fed to make them bank holding companies (BHCs). … The Fed determined that emergency conditions existed because of the prevailing market chaos and because the sky had fallen on Lehman Brothers, the banks’ competitor. Under “unusual and exigent circumstances,” as defined in a 1932 provision of the Federal Reserve Act, the Fed could grant the changeover and allow the investment banks access to the discount lending window, effectively ensuring Morgan Stanley and Goldman Sachs easy access to massive lines of credit. For those of you keeping score at home: change of status equaled river of free money. No one questioned the Fed’s actions.
Morgan Stanley also applied to become a financial holding company (FHC); Goldman Sachs gave notice of its intent to do the same. The BHC and FHC designations provided the best of both worlds - the investment banks got guarantees and cheap loans from the government as BHCs, plus freedom from many commercial bank regulations as FHCs. A BHC can only engage in classic commercial banking activities (such as taking deposits and extending loans), whereas an FHC has a broader mandate, in fact one nearly identical to everything both investment banks were already doing.
The Fed approved the investment banks’ BHC filings that September 21 night, bypassing the regular five-day antitrust waiting period and without time or apparent inclination for any meaningful debate. (Prins 2009, p. 66, emphasis in original)
28 William Cohen, an editor at Fortune Magazine, discussed the bonanza top bank executives received as a result of government bailouts. “What is not hard to argue is that the smorgasbord of government programs and initiatives have helped insure the survival of [America’s largest banks] by restoring investor confidence, in turn boosting their stock prices and the value of chief executives’ stock holdings.” He points out that Goldman’s CEO had company stock worth $168 million at their low point in 2008 but in late September 2009 their value had risen to $623 million. JPMorgan’s CEO saw his stock rise from $168 million to $503 million as the result of government support of financial markets. (Financial Times, “Bank chiefs owe a personal debt to taxpayers,” September 22, 2009).
24
another once-mighty investment bank that just a week earlier had disappeared from the face of the earth under the weight of its toxic assets. By law, a five-day waiting period was required for such a conversion - but the two banks got them overnight, with final approval actually coming only five days after the AIG bailout.
Why did they need those federal bank charters? [They] were, in reality, high-risk gambling houses that were allowed to masquerade as conservative commercial banks. As a result of this new designation, they were given access to a virtually endless tap of "free money" by unsuspecting taxpayers. The $10 billion that Goldman received under the better-known TARP bailout was chump change in comparison to the smorgasbord of direct and indirect aid it qualified for as a commercial bank. When Goldman Sachs and Morgan Stanley got their federal bank charters, they joined Bank of America, Citigroup, J.P. Morgan Chase and the other banking titans who could go to the Fed and borrow massive amounts of money at interest rates that, thanks to the aggressive rate-cutting policies of Fed chief Ben Bernanke during the crisis, soon sank to zero percent. The ability to go to the Fed and borrow big at next to no interest was what saved Goldman, Morgan Stanley and other banks from death in the fall of 2008. "They had no other way to raise capital at that moment, meaning they were on the brink of insolvency," says Nomi Prins, a former managing director at Goldman Sachs. "The Fed was the only shot." In fact, the Fed became not just a source of emergency borrowing that enabled Goldman and Morgan Stanley to stave off disaster - it became a source of long-term guaranteed income. Borrowing at zero percent interest, banks like Goldman now had virtually infinite ways to make money. (Taibbi 2010, pp. 4-5, italics added)29
29 Sorkin 2009 has a lengthy and detailed analysis of the convoluted evolution of Treasury and Fed thinking about what should be done about the emerging crisis, complete with key-player dialogue. It makes clear that Treasury Secretary (and former Goldman CEO) Paulson feared above all else that, after Lehman’s collapse, Morgan Stanley would fail, causing mighty Goldman to go down. He would do whatever was required to prevent this. “With Morgan Stanley on the ropes, Paulson had been growing increasingly worried about Goldman, and if Goldman were to topple, it would, he believed, represent a destruction of the system” (p. 423). A top executive at Morgan Stanley assured CEO John Mack that Paulson would not let their firm fail. “He’ll keep us alive… because if he doesn’t, then Goldman will go” (p. 445).
Paulson’s attitude toward the prospective failure of Lehman Brother was quite different. Though he made serious early efforts to keep it afloat, he aggressively pressured Lehman to declare bankruptcy just before he announced the decision to open the Fed’s discount window for the first time to investment banks. “Paulson had another reason for insisting that Lehman file [for bankruptcy]: If the Fed was going to open its discount window even wider to the remaining broker-dealers, he didn’t intend that Lehman be granted that access; doing so would represent another opportunity for moral hazard” (p. 355). Paulson’s concern with moral hazard seemed to have affected only his decision on Lehman; it did not prevent efforts to rescue Bear Stearns or AIG. Keep in mind that the entire bailout effort was a massive exercise in the creation of moral hazard in which every surviving large financial institution was officially declared to be too big to fail. Had Lehman been able to take advantage of this new source of funds, it would probably have survived. Paulson’s decision, reinforced by the accelerated process that made both Morgan Stanley and Goldman bank holding companies eligible for unlimited Fed cheap money, left the two firms in a dominant position in the investment banking market. Current Goldman Sachs executives and former top Goldman employees currently serving in the Treasury Department were key players in determining how the government handled all facets of the bailout

25
Even former Goldman SEO Henry Paulson seems to agree with this perspective.
“I have never been a proponent of [government intervention]” he said, but “there’s no
way to stabilize the markets other than through government intervention” (Wall Street
Journal, “Rescue Plan Stirs Calls for Deeper Intervention,” September 24, 2008). John
Gapper, the respected Financial Times columnist, argues that Goldman is so politically
powerful that there was never doubt that the government would come to its rescue, a
situation which reinforced risk-taking.
A lot of people used to think that Goldman Sachs runs the US economy. Now we know it does. … Goldman has been one of the prime beneficiaries of recent interventions by the Treasure and the Federal Reserve. … Goldman got a helping hand from the government and stands to get another one while Lehman was – rightly in my view – allowed to fail and Bear Stearns’ shareholders were nearly wiped out. Would the Treasury and the Fed ever have allowed Goldman to follow and its partners to lose their wealth? I doubt it.” (Gapper 2008)
Government efforts to save giant financial corporations and in the process restore
high profit and giant bonuses succeeded. Total Wall Street compensation for 2009 was
the highest ever. In an article focused on the contribution made by the government to
financial firms and markets that enabled the resurgence of profits and bonuses at big
financial firms after the first quarter of 2009, Financial Times columnist Francesco
Guerrera explained:
Take debt guarantees. US banks (and General Electric) have issued a total of more than $280bn in top-rated bonds backed by the government since November, according to Dealogic. The programme will end at the end of October, but most of the debt has a three-year maturity, leaving financial groups to enjoy much lower funding costs until at least 2011. And if that was not enough, the state, through Fannie Mae and Freddie Mac, is still subsidising banks by backstopping most long-term mortgages. But the biggest form of state support for the US banking sector is arguably its simplest. Near-zero interest rates allow banks to make a killing the old-fashioned way: borrowing at low rates and lending at much higher ones. Judging by the Federal Reserve's utterances and the sickly state of the real economy, that giant prop will remain in place for the foreseeable future. Capital markets have also roared back thanks to (yes, you've guessed it) massive government help. … In this golden era, it is almost impossible for banks not to rake in profits. (Guerrera 2009)
process, including those that affected Goldman. In the midst of one discussion concerning a decision that would help Goldman, a former Goldman executive serving in the Treasury Department warned: “Look at all the connections you’ve got: Treasury and [former Goldman executive] Steel and me. Goldman is everywhere. We have got to be careful” (p. 477).

26
Since we have selected and defended an end-date, we can turn to CTR
calculations. The top graph in Figure 3 presents nominal total cumulative return for the
big independent investment bank shareholders measured using an end point of March 25,
2009. It shows that if you bought their stock in the early 1990s and held it until March 25,
2009, you would have done very well indeed. However, if you bought the stock after
1996, you would have lost money on your investment. For example, if you purchased the
stock in 1998, by early 2009 you would have lost 66% of your original investment, while
the rainmakers in these firms were accumulating tens and even hundreds of millions of
dollars of bonus. The lower graph presents real or inflation-adjusted total cumulative
returns. If you bought stock in the big five after 1994 you would have lost wealth. Buying
in 1998 would result in a 77% loss of investment value.
Thus, over the period of the two recent financial market booms when the new
compensation system became strongly entrenched in the big investment banks,
rainmakers became phenomenally wealthy by following high-risk high-leverage
strategies, while their stockholders were financially destroyed. “All this has reinforced
the idea that banking is simply a gravy train for employees” (The Economist, “The bonus
racket,” Jan 29, 2009). Even Alan Greenspan, the most influential cheer leader for
unregulated, free-market ‘shareholder’ capitalism, eventually acknowledged that the
system he championed left shareholders at the mercy of rainmakers. “I made a mistake in
presuming that the self-interest of banks and others was such that they were best capable
of protecting their own shareholders” (quoted in Mason 2009, pp. 118-19).
Joseph Stiglitz reflected on the compensation practices in financial markets in the current era.
There used to be a social contract about the reasonable division of the gains that arise from acting together within the economy. Within corporations, the pay of the leader might be 10 or 20 times that of the average worker. But something happened 30 years ago, as the era of Thatcher/Reagan was ushered in. There ceased to be any sense of fairness; it was simply how much the executive could appropriate for himself. It became perfectly respectable to call it incentive pay, even when there was little relationship between pay and performance. In the finance sector, when performance is high, pay is high; but when performance is low, pay is still high. The bankers knew-or should have known-that while high leverage might generate high returns in good years, it also exposed the banks to large downside risks. But they also knew that under their contracts, this would not affect their bonuses. (Stiglitz 2010a)

27
III. Do Rainmaker Premiums Exist: If So, Are They Rent?
A Brief Survey of a Sparse Literature
Given the vital importance of financial firm compensation practices to both rising
inequality and the creation of financial instability in the current era, it is surprising that
the academic literature on this topic is so sparse. However, there are a few articles that
together show that the compensation received by rainmakers in investment banks and
other financial firms is higher than the compensation of seemingly equivalent workers in
nonfinancial firms, and that this premium is a form of unearned rent.
Sum and Tobar 2008 mine the Quarterly Census of Employment and Wages
(QCEW) data set, a joint statistical program of the US Bureau of Labor Statistics and
each of the fifty states, to demonstrate that the pay gap between elite Wall Street
personnel and everyone else is very large and grew rapidly in the years leading up to the
crisis. This data source is useful because it includes bonuses, stock options, commissions
and profit sharing. Unfortunately, it only generates estimates of average earnings and thus
sheds light on rainmaker compensation only indirectly.
The bulk of bonuses received by investment bankers appear in the first quarter of
the year in the QCEW data. In the first quarter of 2007, average weekly earnings for
employees in the investment banking and securities industry in Manhattan was $16,918,
which was 19.1 times higher than the average weekly earnings for the country as a whole.
Price-adjusted average weekly earnings grew by 21.5% between the first quarter of 2006
and the first quarter of 2007 for Wall Street employees, compared to 2.5% for all US
workers. The absolute increase in earnings was 136 times larger for investment banking.
The authors show that between the first quarters of 2002 and 2007, Wall Street, which
employed 2.4% of all New York State payroll workers, accounted for 58% of the total
state increase in earnings. Finally, they estimate that total Wall Street bonuses in 2006
and 2007 combined exceeded the total increase in the annual wage of the 109 million
production and nonsupervisory workers in the country between 2002 and 2007.
Paul Oyer 2006 provides important empirical support for the claim that highly
educated employees of investment banks get paid substantially more than equally
qualified people who work in other industries. His data base is several thousand graduates
of Stanford’s MBA program. He assumes these MBAs have broadly equivalent human
28
capital attributes. “The pool of potential investment bankers in a typical Stanford MBA
[class] is relatively homogeneous…” (p. 23). Since investment banking is an extremely
popular field among Stanford MBAs, Oyer argues that the percentage of new graduates
who enter investment banking is chronically constrained by job availability or the
demand side of the market. That is, he sees a chronic excess supply of potential
investment bank rainmakers, a finding that conflicts with the conventional justification of
high premium discussed in section IV- the assumption that there is a chronic excess
demand for rainmakers. During stock market booms, demand rises, so the percentage that
enters Wall Street rises as well. “The data are consistent with a labor market where a
large percentage of Stanford MBAs could be successful investment bankers [and] Wall
Street demands more people when the stock market is doing well” (p.23). In spite of
what appears to be a chronic excess supply of Stanford MBAs who wish to be investment
bankers, Oyer documents that those who do get Wall Street jobs get much higher salaries
than those who enter other fields. The investment banking premium is stunning.
It is clear that investment bankers earn a substantial premium relative to other GBS alumni. The [annual] premium varies from about 60% for a new MBA on Wall Street relative to one in management consulting to over 300% for investment bankers fifteen years after leaving Stanford relative to an average alumnus with the same amount of experience in any other industry. … I estimate that a new MBA that goes to Wall Street can expect to earn between $2 million and $6 million in discounted lifetime income (in $1996) relative to what he would earn if he took a job elsewhere” (p. 2).
The first year premium over those who enter consulting, a prestigious and much
sought job, is $71,000, while it is $115,000 over entrepreneurs and $98,000 over the
catch-all ‘other’ category.30
30 The curious thing about high starting premium for investment bankers is that competition to get jobs at banks such as Goldman Sachs, Morgan Stanley and JPMorgan Chase is so intense that these firms could pay starting compensation well below other employers and still get their pick of the crop. There is no rational justification for paying such huge premiums.
The curious thing about such high starting pay premiums for
investment bank hires is that competition to get jobs at banks such as Goldman Sachs,
Morgan Stanley and JPMorgan Chase is so intense that these firms could pay starting
compensation well below other employers and still get their pick of the crop. There is no
rational justification for paying such huge premiums. In the fifteenth year the
corresponding annual differences are $578,000, $1 million and $937,000 respectively.

29
Oyer notes that these are likely to be under-estimates of the Wall Street premium.
“However, if anything, I would expect …that the income premium for investment
bankers in Table 7 is biased downward because so much investment banking income
comes through bonuses” whereas the income measure is salaries (p. 29). Since bonuses
are the main form of rainmaker compensation often hitting 90% of compensation, this
under-estimation must be extremely large.
What is the nature or character of these premiums? In spite of his insistence that
that the number of investment banking jobs to Stanford MBA students is chronically
demand-constrained, Oyer implicitly assumes these premiums are competitive
equilibrium phenomena. He thus draws the only logical conclusion consistent with his
assumption: “the wage difference is a compensating differential that roughly offsets the
unpleasant parts of being an investment banker” (p. 23). Though he suggests that there is
always an excess supply of Stanford MBAs willing to work on Wall Street, investment
banking nevertheless must be much more unpleasant than deep-pit mining since it takes a
fifteenth year annual premium of from $578,000 to $1 million to get anyone to do it.
There are two important empirical papers that document the existence of large
compensation premiums received by top employees of financial firms and provide
persuasive evidence that these premiums are rents rather than returns to human capital:
Philippon and Reshef 2009 and Goldin and Katz 2008.
The Philippon and Reshef paper has been widely cited in the press (a Google
search turned up 950 references) both because the topic of excessive financial rainmaker
compensation has received so much public attention and because academics have
provided little help in understanding this phenomenon. We therefore review their work in
some detail.
A number of important empirical trends are unearthed in the paper. It utilizes
average industry wages provided by the BLS Industry Accounts of the U.S. (These
accounts thus provide no direct information on the pay of top earners.) The authors show
that the ratio of the average wage of financial market employees relative to the average
wage in other industries was high in the 1920s through the early 1930s, when it peaked at
over 1.6. The late 20s was an era like our own, with light regulation, rapid financial
innovation and a vigorous financial bubble. It then collapsed through the early 1950s

30
under the much stricter regulatory regime of the period, and continued to decline
modestly through the late 1970s, where it approached 1.0. At this point, there was no
premium. The ratio rose again through 1990 to near 1.2 as the previous regulatory regime
was deconstructed. It then skyrocketed through 2006, where, at 1.7, it exceeded the peak
reached after the bubble of the 1920s. The authors conclude that the relative wages of
financial sector workers exhibit a long-term U-shape that needs to be explained. It is the
U-shaped relative wage profile that captured the interest of many financial
commentators.31
The paper separates financial employees into three sub-categories: credit
intermediation, insurance and ‘other finance.’ ‘Other finance’ includes commodity
traders, investment funds and trusts, venture capital, hedge and private equity funds, and
investment banks. It thus comes closest to the financial firms and rainmakers we are
interested it.
32
The authors address the question of how to explain this U-shaped long-term trend.
Using Current Population Survey data, they estimate wage regressions that include as
All three relative wage indices behave as the aggregate relative wage did
through 1980, though the ‘other finance’ index actually was below 1.0 for much of the
1950s and 1960s. After 1980, the indices for credit intermediation and insurance rise
above 1.0, and eventually hit 1.5 in 2006; there were highly paid rainmakers in these
sectors. But as Figure 4, taken from Philippon and Reshef, shows, the relative wage for
“other finance” accelerates to near 4.0 by 2006 – a ratio almost four times its 1980
value, two and one-half time higher its early 1930s peak, and almost three times higher
than compensation for credit intermediation and insurance. From 1980 to 2006,
compensation in ‘other finance’ ran away not only from compensation in nonfinancial
industries, but from the rest of financial services as well. ‘Other finance’ clearly
contained a disproportionate share of the rainmakers who gained most from the financial
innovation and deregulation of secular financial boom.
31 Though the share of GDP represented by financial firm compensation increased after 1980, rising from just over 4% that year to just under 8% in 2005, the share of employment, which grew at about the same pace as compensation through the late 1970s, peaked in 1987 at 4.6% and remained relatively constant through 2005. The rapidly rising industry wage bill combined with slow rising employment led to the rise in the relative wage ratio. See Philippon and Reshef 2009, p. 5 and Figure 1. 32 In 2006, the proportion of workers with at least a college degree was 54% in “other finance’ and 32% and 26% in insurance and banking respectively (p. 9).

31
control variables education, race, gender, marital status, urban residence, and experience.
These regressions show that “individuals working in finance indeed earn more than
observationally equivalent workers” in other industries (p. 24) by a percent that peaked in
2005 at 20% - about four times its value in the years from 1967 to 1980. Given the
pronounced differences among the relative wages in credit intermediation, insurance and
‘other finance,’ it would be reasonable to assume that the ‘other finance’ premium is
very much larger than 20%.33
The authors also construct a “benchmark relative wage series” for the financial
sector relative to the nonfinancial sector that is based on a number of empirical factors
that should influence the movement of this series over time, and compare it to the actual
relative wage series discussed above. The difference between the actual and benchmark
series is called the historical excess wage series. This series shows that the historical
excess wage series peaks at about 33% in the late 1920s and early 1930s, cycles around
zero in the late 1950s through 1990, they explode upward to a 2006 peak of over 40%.
The use of CPS data creates a very strong downward bias
in these estimates because CPS incomes are top-coded – incomes above an arbitrary level
are recorded as if they were equal to that level. CPS data “is not appropriate for the study
of very high incomes” (Philippon and Reshef 2007, p. 3). The authors note that there are
more top coded individuals in finance than in nonfinancial industries: twice as many in
credit intermediation, 2.4 times as many in insurance, and 13 times as many in ‘other
finance.’ Though they make a standard, modest ad hoc adjustment for this bias that is the
same for all subsectors, it cannot eliminate the bias problem, especially for the top
earners in ‘other finance.’
They conclude that relative wages rose in the post-1980s in large part because of
deregulation: “the evidence points clearly towards a causal role for regulation.” An index
of deregulation tightly tracks the relative wage series. ‘Anything goes’ deregulation
unleashed innovation that led to the creation and trading of extraordinarily complex
financial products such as mortgage backed securities, collateralized debt and loan
obligations, and credit default swaps. These in turn required highly educated and highly
skilled employees who could command very high compensation. “Deregulation increases
creativity and innovation and increases the demand for skilled workers” (p. 4). Since
33 The wage premium controlling for education alone is 40%.

32
these products were concentrated in ‘other finance,’ it is not surprising that this was the
sector with by far the highest relative wage growth. But they also show that rainmaker-
driven compensation growth was far greater than can be justified by the increased
demand for human capital in finance. “We find that 30% to 50% of the excess wage can
be explained by factors other than individual ability,” and “conclude that a large part of
the excess wages in [historical excess wage series] is due to rent” (p. 29). The Economist
states their conclusion this way: “30-50% of the wage gap between financial and non-
financial workers between the mid-1990s and 2006 was the fruit of what they judge to be
rent-seeking rather than genuine wealth-creation” (“Surviving the slump,” May 30, 2009,
p. 17).
The authors note that large rents “explain the large flow of talent into the
industry,” but they do not explain what caused or sustained the rents (p.31). Since they
find that “financial creativity” has been over compensated and believe that regulation is
likely to be more restrictive in the future, they argue that the excess relative wage of the
recent past is not sustainable.
From the mid-1920s to the mid-1930s, and from the mid-1990s to 2006, however, the compensation of employees in the financial industry appears to be too high to be consistent with labor market equilibrium. Moreover, in the recent period, we show that this result remains even if we control for unobserved individual heterogeneity. This finding is prima facie evidence that the financial sector is not in a sustainable labor market equilibrium, and that short term rents area likely to diminish. (p. 5)
Thus, the academic study most relevant to the questions we have asked
demonstrates that financial workers get paid much more than equivalent non-financial
workers and that much of outsize rainmaker compensation is rent. But the source of these
rents remains a mystery.
Since the data used by Philippon and Reshef are average compensation from the
BLS Industry Accounts of the U.S. and CPS data that is top coded, they do not permit a
direct examination of the compensation of Wall Street rainmakers. To get information
about the top earners in finance, they advise the reader to consult Kaplan and Rauh 2007,
who examine compensation for investment bank ‘managing directors’ and other Wall
Street rainmakers. Kaplan and Rauh estimate that there are about 10,000 managing
directors in the US, of which 6000 work for the top ten investment banks. They estimate

33
that the minimum compensation inclusive of bonuses for managing directors was
$500,000 in 2004 and that the distribution of compensation is highly unequal. Total
managing director compensation is between $19 billion and $28 billion, generating an
average compensation in 2004 between $1.9 million and $2.8 million. We know that top
traders were making up to $50 million in 2006 and that some CEOs of the big firms at
times made more than that. They conclude “that the managing directors and top
executives of the top investment firms comprise a larger percentage of those individuals
in the top 0.01% [of AGI or adjusted gross income] … than the top executives of non-
financial public companies” (p. 2).
Kaplan and Rauh 2007 show that the top earners in hedge and private equity
funds make even more then their counter parts in investment banks. These firms had the
same ability to ride the bubble as investment banks, and did not have to share the gains
from this ride with shareholders. For example, the top 25 hedge fund managers received a
cumulative $9 billion in 2005, an astonishing $360 million apiece. (The top 25 hedge
fund managers received $25 billion in 2009 in the wake of the crisis.) Stephen
Schartzman, the major partner at Blackstone private equity fund, made $785 million in
2003 and 2004 combined. The highest paid people in investment banks, venture capital,
hedge and private equity funds constitute “at least 9.1% of those in the top 0.5% AGI
bracket, about 20% of those in the top 0.01% bracket, and approximately 26.5% of those
in the very top 0.0001% of the AGI distribution.” This represents a higher percent of the
0.01% bracket, a similar fraction of the 0.001% bracket and “a substantially greater
fraction of the top 0.0001% bracket than the top main street individuals” that control non-
financial companies (p. 33). Using less conservative assumptions, the authors estimate
that financial rainmakers could comprise up to 40% of the top category. I assume that
date from the peak of the financial bubble in 2006 would yield even higher estimates.
This means that financial firm rainmaker compensation policy was a significant cause of
the spectacular rise in inequality that occurred in this era because most of this increase
involves the very top of the income distribution running away from the rest of society.
What makes this quite remarkable is that, as we show below, in the period from the
middle 1990s until early 2009, financial firm rainmakers actually destroyed shareholder
value.

34
Goldin and Katz 2008 provide information on the careers of groups of Harvard
graduates with Bachelor’s degrees organized into three cohorts: those who graduated
around 1970, 1980 and 1990. Their data show a striking increase in the percent of
graduates who took jobs in finance. While just 5% of the 1970 cohort entered finance,
15% of the 1990 cohort did. Additional work by the authors show that the percent of
graduates who entered finance hit “23% or so in recent years” (Lohr 2009). Perhaps the
most interesting results of this study for our purposes is that it presents additional
evidence that a substantial portion of the ultra high compensation of rainmakers in
finance is not a return to any identifiable human capital. The authors regress the annual
earnings of 6,207 Harvard graduates in 2005 against an impressively large set of
variables. Control variables include grade point average, SAT math and verbal scores,
college major, dummy variables for a number of advanced degrees, three full-time full-
year work-status dummies, and 19 different occupation dummies. They find the “the
highest earnings by occupation are garnered by those in finance, for which the earnings
premium relative to all other occupations is an astounding 1.08 log points, or 195
percent” (p. 367, emphasis added). Highly educated employees working in finance
receive a huge compensation premium relative to seemingly identical employees working
elsewhere. The near 200% premium certainly appears to be rent.34
A related paper, Bertrand, Goldin and Katz 2009, examines the careers of
University of Chicago MBAs who graduated between 1990 and 2006. The data are from
a web-based survey done in late 2006 to mid 2007. Mean starting compensation (in 2006
dollars, inclusive of bonuses) for all survey respondents (including investment bankers)
was $126,356, but for those who started in investment banking it was $173,740. After
five years, mean compensation was $500,979 for investment bankers and $307,451 for all
The Financial Times’
John Kay observed that you can become wealthy by creating wealth or appropriating
wealth created by others. When the appropriation is legal, “economists call it rent-
seeking.” He identifies investment bankers as members of “a new generation of rent-
seekers” in America (Kay 2009).
34 Barry Bosworth and Aaron Flaaen of the Brookings Institution argue that the huge payouts on Wall Street are “tremendous rents” (Bosworth and Flaaen 2009). http://www.brookings.edu/~/media/Files/rc/papers/2009/0414_financial_crisis_bosworth/0414_financial_crisis_bosworth.pdf).
35
respondents - including investment bankers. Ten year or more after graduation, it was
$815,914 for investment bankers and $400,715 for all respondents – a premium in excess
of 100% (Table 2, p. 31). This estimate may be biased downward because everyone who
began their career in investment banking was treated as if they stayed in that category
even though many were no longer in this field when the survey was done.35
Are Bonuses High Because Rainmakers Are the ‘Best and the Brightest’?
If we combine the fact that some 10,000 investment bankers receive average
compensation of more than $2 million annually with information about the pool of
investment bank recruits, we can gain substantial insight into the character of their
bonuses that reinforces the econometric work that concludes that bonuses are mostly rent.
Both contacts on Wall Street and acquaintances who teach at elite colleges that send large
portions of their graduate to Wall Street tell me that investment banks do not generally
recruit those students with the most impressive academic credentials. Rather, they look
for students with acceptable grade point averages (perhaps B or better) who have
demonstrated exceptional aggressiveness or competitiveness. They want dominating
type-A people, not exceptionally smart or well-informed people who are not hyper-
aggressive. For example, they frequently recruit lacrosse or hockey players.36
Andrew Ross Sorkin says of the legendary investor Warren Buffet: “he despised
the trader ethos and the lucrative paydays that enriched people he thought were neither
At the
AEA annual meetings in January 2009, Nobel Laureate Joseph Stiglitz attacked the
“myth that Wall Street is populated by the best and the brightest, who deserve their big
paydays. ‘When I look at the salaries some of our B students got [on Wall Street], it
doesn’t correspond to their innate ability” (Wall Street Journal, “Overheard,” January 4,
2010, p. C8).
35 The survey also showed that investment bankers reported an average work week of 74 hours, whereas those in other occupations reported hours in the high 50s to low 60s (Table A4, p. 49). This suggests that a part of their premium might legitimately be considered a compensating differential. However, given the enormity of the premiums, the implied cost of inducing the extra hours of work is far too large to be primarily a compensation differential. Since this was a voluntary internet survey and since investment bankers are known to be unusually competitive individuals, it may be that, perhaps without being conscious of their motivation, they exaggerated the length of their workweek to show how hard-driving they are. 36 When the top investment banks were crumbling in the fall of 2008, the New York Times ran a story that asked whether the ultra-competitive investment bank lacrosse teams that played against each other on a regular basis might be forced to disband.

36
particularly intelligent or created much value.”37
Unconscionable bonuses and ethics abound because [Wall Street’s] titans are also addicted to winning. They possess a hyper-competitive instinct that propels them to lead their firms to become ever bigger – in profits, and in sheer size. This notion of manifest pecking order on the Street spurs irresponsible actions. Big bonuses for certain CEO’s mean they’re beating other CEOs. (Prins 2009, p. 4)
Sorkin observes that investment bank
trading is “like a sport, something that required skill, but not necessarily brains or
creativity.” He quotes Lehman CEO Richard Fuld using martial metaphors to describe
this work: “Every day is a battle… you have to kill the enemy,” and says that when John
Mack, the current CEO and board chairman of Morgan Stanley was a trader, he would
“stride through the trading floor and, seeing a chance to make big profits, would yell
“There’s blood in the water, let’s go kill someone!”(Sorkin 2009, pp. 24, 28, 55 and 186).
Nomi Prins, a former Managing Director at Goldman Sachs, emphasizes the competitive
nature of rainmakers.
Though such people may work hard and for long hours and compete aggressively,
there is nothing in mainstream labor market theory that would lead one to expect that
there would be at least10,000 of them in US investment banks alone who averaged over
$2 million a year in compensation in 2004 – far more than those with equivalent and even
superior human capital endowments who did not work on Wall Street and thus were not
able to create asset bubbles. This situation thus cannot be fully explained by the
“Pavarotti effect” discussed in the “economics of super stars” or “winner take all”
literature. This literature tries to understand professions in which a few super talented
people earn huge salaries while everyone else is paid poorly. But though there are ‘stars’
in investment banking who receive tens of millions annually in good years, tens of
thousands of investment bankers receive very high compensation – at least a half million
37 Andrew Lahde, a successful hedge fund operator, announced his retirement in a letter published in the Financial Times. He explained (in rather stark terms) that a major source of his earnings was the unimpressive capabilities of the rainmakers he did business with.
I was in the game for the money. The low-hanging fruit, i.e., idiots whose parents paid for prep school, Yale and then the Harvard MBA, was there for the taking. These people who were (often) truly not worthy of the education they received (or supposedly received) rose to the top of companies such as AIG, Bear Stearns and Lehman Brothers… All of this behavior supporting the American aristocracy only ended up making it easier for me to find people stupid enough to take the other sides of my trades. (Lahde 2008)
37
dollars annually. These premiums do seem to be primarily rents, associated more with the
positions themselves rather than the individuals who occupy them.
IV. How Are Rainmaker Rents Created and Sustained Over Time
Part 1: “False Value” and Oligopoly Power
How can such high rents for rainmakers in investment banks and other financial
corporations be sustained over long periods? This important question for theory and
regulatory policy has not been adequately addressed in the academic literature. This
section presents some preliminary thoughts about the issue.
To answer the key question of how rainmaker rents can exist, be so large and
sustain themselves over time, we have to address two sub-questions. First, why are
investment bank and other financial firm revenues per employee so large in booms?
Second, why are rainmakers able to capture such an exceptionally large share of
revenues in good times and bad? The second question will be discussed in section V.
IV-1 a: Rents and ‘False Value’ in the Boom
The standard mainstream answer to the first question is that bonuses are not rents
at all. At least in financial booms, employee productivity is exceptionally high and since
rainmakers are the most productive workers, their huge bonuses are justified by the
revenue they generate. Since the market capitalization, value added and profits of most
financial institutions rose spectacularly after the early 1990s, while employment grew
much more slowly, employee productivity as typically measured did rise dramatically.
The spectacular rise over several decades in the absolute and relative size of financial
markets, financial asset values and financial market profit were seen as macro evidence
that supported this position.
The answer to the first question offered here is that the increase in financial firm
revenues over the past few decades have been generated primarily by speculative asset
bubbles and bubble-driven fees rather than by long-term value creation, and secondarily
by oligopoly pricing power. Compensation based on revenues generated by short-term
speculative bubbles should be considered unearned rent.

38
Francois Meunier stated the problem associated with the standard explanation of
investment bank compensation. Defenders of financial compensation practices claim that:
Employees are handsomely paid because they are extremely qualified and operate in a sector of the economy that is both rapidly growing and indispensable to the economy. Employees receive compensation equal to their productivity, which is extremely high. But this explanation does not hold. Other sectors beside finance show equally strong growth, are big consumers of technology and technical know-how, but their employees are not as highly paid as investment bankers. Pharmaceutical laboratories, aeronautics and the automobile and electronic sectors are examples… (Meunier 2007, pp. 53-54).38
There are several major weaknesses in the mainstream justification of rainmaker
compensation. One is that in spite of the fact that almost everyone now acknowledges
that rainmakers took excessive risk with their firms’ capital in the boom, their
contributions to revenue or profit were not reduced by an appropriate risk-adjusted cost
of capital before setting their bonuses. Indeed, most rainmakers were charged no capital
cost at all for purposes of bonus determination. "The overwhelming majority of banks
used fairly basic profit numbers and did not adjust for risk at all” (Hughes and Masters
2008). The Economist noted that compensation in “the securities industry was based on
revenue, not risk-adjusted returns.” This practice continued even as the crisis unfolded:
“According to a survey of industry practices published by the Institute of International
Finance [a trade association of large global banks] in March [2009], many banks still fail
to use risk-adjusted measures either to calculate the size of the bonus pool or to allocate it
(The Economist, “Rebuilding the banks,” May 14, 2009, pp. 19 and 23).
One of the central planks in French President Sarkozy’s model for the regulation
of compensation in banking is: “the cost of risk must be included” in the determination of
bonuses (Financial Times, “Sarkozy tightens bonus rules,” August 26, 2009).39
38 I am grateful to Grace Chang for translating Meunier’s article from French to English.
The Wall
Street Journal reports that “the Financial Stability Forum has set out new principles,
already adopted by the U.K. and France, requiring banks to base bonuses on risk-adjusted
39President Sarkozy admitted that his proposals to regulate rainmaker compensation would be unsustainable if other important countries declined to follow his example because this would trigger a regulatory race to the bottom - “an exodus of bankers.” The reaction of US financial economists was predictable. A finance professor at Dartmouth said the proposals were nonstarters, because they are “so fundamentally antithetical to the Anglo-American notion that compensation has to be a function of failure and profit” (Wall Street Journal, “France Will Police Pay, Bonuses of Traders,” August 26, 2009. Perhaps the professor was not familiar with the data on rainmaker bonuses in the crisis.
39
profits rather than revenue, defer awards for up to three years and allow for clawbacks”
(“A Capital Idea for Bank Bonuses, August 28, 2009). Note that these principles not only
require risk-adjustment, but also demand that profits, not revenues, be the foundation on
which bonuses are determined. Had this principle been in place during the recent crash,
Merrill Lynch could not have paid $16 billion in bonuses in 2007 while the firm lost $7
billion. Matthew Richardson, France’s Minister for the economy, industry and
employment argued that: “We should scrap this system for financial institutions and
make it more risk-based - consider illiquidity risk, credit risk, funding risk, market risk. If
these risks were taken into account, these trades would not show profits, putting an end to
unjust bonuses” (Financial Times, “A curb on bank bonuses misses the point,” September
9, 2009). Even the Fed agrees. It:
“proposed that pay of traders be linked to the risks taken to achieve returns. So if two people generate $1 million in revenues each, the one who took more chances would be paid less. Analysts noted that one sure-fire sign of risk – bets that use a lot of borrowed money - could stay out of style if the Fed uses risk-adjusted returns to assess how employees should get paid. (Wall Street Journal, “Fed Hits Banks With Sweeping Pay Limits,” October 23, 2009)40
Since rainmakers used large amounts of their firms’ capital as well as massive
leverage to support their operations in an exceptionally high-risk era, an appropriate risk-
adjusted capital charge would have been substantial, sharply lowering bonuses. No
acceptable theory of appropriate compensation policies would justify this practice; it is a
license to loot the shareholders.
However, the main problem with the proposition that rainmakers deserve or earn
their large bonuses in boom years because they create high value in those years is that it
fails to take into account the ephemeral character of these revenues. The excessive risk
and rising leverage in the boom create tremendous momentum for the asset price bubbles
that generate the capital gains that fuel financial market profits and bonuses.41
40 The credit default swap market is an excellent example of the system of reward without regard to risk. This market grew from less than one trillion dollars in 2000 to 60 trillion at its peak. Firms that provided insurance against default generated large bonuses for the rainmakers who dealt with CDSs prior to the outbreak of the crisis. The bonuses were made on the basis of fees and current income, with no account taken of the enormous risk involved in insuring against defaults in shaky markets. Most of AIG’s losses came from its ocean of credit default swaps.
But such
41 I do not mean to suggest that in the absence of perverse incentives for rainmakers we would not experience financial market bubbles and the ‘false value’ and ‘false revenue’ that accompany them. Even
40
risk-taking inevitably causes a financial crisis and subsequent collapse of financial asset
prices along with financial firms’ revenue, profit and market capitalization. Value created
in the boom thus inevitably evaporates along with shareholder wealth, but the claims on
real goods and services embodied in these bonuses are eternal. They constitute not a
reward for productivity, but an unearned redistribution of wealth from the rest of society
to financial rainmakers. As Thomas Hoenig, President of the Federal Reserve Bank of
Kansas City put the matter in a recent speech, financial market “bonuses will far exceed
the economic value provided, because the bonus is what we economists call an economic
rent. It is not earned, it is only received” (Hoenig 2010, p. 1).
There are, of course, important sources of revenues and profit in the boom other
than realized and unrealized capital gains. These income streams are also based on
temporary, short-term market-value creation. In addition to the oligopoly-generated
profits discussed in the next section, investment banks and other financial firms
benefitted from enormous fees involved in the creation and servicing of the risky asset-
backed securities that helped create the crash. These were payments for what turned out
to be value-destruction on a massive scale. They also gained revenue and profit from
asymmetric information and bargaining power in the over-the-counter sale of complex,
opaque structured financial products such as CDOs and credit default swaps. These were
private deals in which the seller understood the risk-return properties of the securities to a
much greater degree than did the buyer.42
without perverse incentives, rainmakers would make decisions in the general euphoria of the boom that would be revealed in the subsequent crash to have been excessively risky. But if their compensation system either did not contain large boom-induced pay increases or had a reasonable degree of symmetry (in which income losses in the crash balanced income gains in the boom), the ‘false value’ created would not be anywhere near as large as it was in recent times.
With no competitive bidding, investment banks
garnered exceptionally high profit margins on these toxic products. Revenues and profits
were inflated by excessively optimistic risk-evaluations of complex securities by ratings
agencies that determined risk through black-box computer simulations constructed to
underestimate it. The higher the ratings given to these securities, the higher the revenues
the agencies received. Profits were also swollen by excessive leverage. Crotty 2009
contains an extensive analysis of the contribution of these and other problems to the onset
of the recent financial crisis. Nevertheless, the focus in this paper is on the asset price
42 This is a matter of degree, since even the creators of these products had no firm idea of the risk they entailed.

41
bubble itself. Though the revenue and profit sources mentioned here helped sustain the
bubble, their growth would have been impossible in the absence of a strong upward trend
in important security prices and the optimistic expectations generated by this trend.
I do not dispute the assertion that rainmakers create market value during the
bubble. They are paid to initiate, identify, exploit and reinforce serial financial asset
bubbles that produce the escalating capital gains that are a major source of their firm’s
revenue and profit, and thus a major source of their bonuses. They do these jobs
brilliantly. Indeed, the fact that rainmakers help create the revenues that are the source of
their bonuses requires us to distinguish the definition of ‘rent’ used in this paper from the
standard definition typically used in economic discourse. The concept of rent normally
refers to a situation in which agents use illegitimate economic or political power to
extract income they did not create and thus do not deserve. Consider the market for a
manufactured product, and assume that demand conditions in this market are exogenous.
If a firm possesses monopoly power, it can extract larger profits than would be available
to firms operating under conditions assumed in theories of perfect competition. If
workers in this market formed a union, they might be able to extract wages that exceed
the value of their marginal product. The extra profit and wages would be seen as
undeserved rent.
But the revenues in modern financial markets that are the source of rainmaker
bonuses are not independent of their activities. Were it not for excessive risk-taking by
rainmakers induced by perverse incentives, the revenues flowing to their firms would not
be nearly as large as they in fact have been in recent years.43 To a substantial degree, they
create the revenues from which their bonuses are derived, and thus their rents are
different from the standard cases discussed in economic theory. They are still rents,
however, because they are payments not justified by long-term value creation.44
43 As the Bank of England’s Andrew Haldane put it: financial sector risk “is not exogenous, but endogenous,” it is “created, not endowed” (Haldane 2010). Perverse incentives are a crucial source of endogeneity.
44 In his book Capitalism, Socialism and Democracy, Joseph Schumpeter argued that because of extensive economies of scale and scope and rapid innovation, the giant oligopolies that dominated American industry generated revenue and profit that far exceeded the revenue and profit that would have been earned if the industry was forced to be organized by the numerous small firms assumed in theories of perfect competition. Since, unlike the case in modern financial firms, the extra revenue and profit reflected long-term efficiency gains, he did not consider them to be rent.

42
In order for rainmaker bonuses to be considered as earned and not as rent, one
must assume that the value of financial assets and the market capitalization of financial
firms during the boom accurately measure the discounted future cash flows associated
with them, or that the value rainmakers create is long-term rather than transitory value.
But history demonstrates that financial markets move through time in boom-bust cycles
around some variable trend. Financial assets are grossly over-valued in the late boom, as
demonstrated by the subsequent bust, and under-valued in the worst part of the crash, as
demonstrated by the subsequent recovery.
So except when the cycle passes through the trend in one direction or the other,
financial asset values and market capitalizations are not consistent with long-term trends
in cash flows. Thus, the only reasonable way to measure the long-term value creation
that should be the determinant of bonuses in speculative financial booms is ex post, after
the excesses of the boom have been eliminated. Note that since the government has
consistently bailed out financial markets in recent downturns, even measuring value
creation by rainmakers via longer term trends grossly exaggerates their contribution to
the economy. Without such interventions, modern financial markets would have been
shown to be long-term value destroying on a massive scale.
We have already examined the total returns to shareholders in the big investment
banks over this period. Floyd Norris, a financial market columnist for the New York
Times showed that an investor who held the stocks in the S&P 500 stock market index
and reinvested all dividends received would have earned a nominal average annual return
over a 10 year period ending in January 2009 of minus 2.6%. Adjusted for inflation, the
average annual return was minus 5.1% (Norris 2009). These data suggest that investment
banks and other financial firms were crucial parts of an economic system that destroyed
shareholder value over the past decade or more. There was thus no financial or non-
financial long-term value creation that could possibly justify the huge bonuses and stock
options of the era. Compustat calculates a five year cumulative annual growth rate
(CAGR) for its S&P 500 stock price index and key component sectors of that index. For
the five years ending in early March 2009, the broad index has a CAGR of minus 9.5%,
while the financials sub-section has a CAGR of minus 27.1%. In this period at least,

43
owners of financial firm stock did much worse than owners of other sectors or of the
broad index.
The belief that financial rainmakers destroyed value is widely shared. Paul
Krugman wrote: “The financial services industry has claimed an ever-growing share of
the nation’s income over the past generation, making the people who run the industry
incredibly rich. Yet, at this point, it looks as if much of the industry has been destroying
value, not creating it” (Krugman 2008). Fellow Nobel Prize winner Joseph Stiglitz made
a similar observation.
Even in the heyday of finance, there was a huge gap between private rewards and social returns. The bank managers have taken home huge paychecks, even though, over the past five years, the net profits of many of the banks have (in total) been negative. And the social returns have even been less - the financial sector is supposed to allocate capital and manage risk, and it did neither well. Our economy is paying the price for these failures - to the tune of hundreds of billions of dollars” (Stiglitz 2009).
Veteran Financial Times columnist John Plender noted that “it is hard to argue with the
proposition that the manic pursuit of … personal profit by bankers operating within
flawed incentive structures has been extraordinarily damaging for the economy and
society at large” (Plender 2009).45
The recognition that the bonus system led to excessive risk-taking that was value
destroying is the main reason why so many commentators, including the influential
Financial Stability Forum, have called for annual bonuses to be held for long periods in
escrow accounts, and reduced over time if the firm losses value in subsequent years as a
In a recent speech, Lawrence Summers, President
Obama’s chief economic noted that “roughly every three years for the last generation a
financial system that was intended to manage, distribute and control risk has, in fact, been
the source of risk – with devastating consequences for workers, consumers, and
taxpayers” (Financial Times, “How to manage the gigantic financial cuckoo in our nest,”
October 21, 2009).
45 McKinsey consultants agree. A recent report notes that: “The world’s equities lost almost half their value in 2008, declining by $28 trillion.” “Much of the rise in assets in mature markets did not reflect capital being channeled into economically productive activities; rather, it reflected growing asset bubbles.” (McKinsey 2009, pp. 10 and 21).

44
result of excess risk seeking (Financial Stability Forum 2009, p. 12).46
An individual’s performance should be evaluated over time so as to avoid excessive risk-taking. To ensure this, all equity awards need to be subject to future delivery and/or deferred exercise. Senior executives should be required to retain most of the equity they receive at least until they retire… (Blankfein 2009, emphasis added)
Even Goldman
Sachs’ CEO Lloyd Blankfein acknowledged that bonuses based on short-term value
creation are undeserved and dangerous to the firm and the system. To prevent this
problem, he suggests that:
47
The theory that best explains why it is that boom-bust cycles inevitably take place
in capitalist financial markets can be found in the work of Keynes, Minsky and Marx.48
Keynes’s theory is built on the core assumption of radical or fundamental
uncertainty: the future is not knowable in the present because it does not yet exist and it
has not yet been determined. Agents can only guess where markets will go in the future
and make choices accordingly. But these choices, made in ignorance, affect the system’s
future trajectory in a dynamic path-dependent process. So-called “rational expectations”-
or correct expectations about the future - on which modern financial economics is based,
are not possible because the “fundamentals” of future economic states do not yet exist
and thus cannot be known.
It
should be noted, however, that there is no major role for perverse incentives in the
theories of financial cycles associated with these great theorists.
In a Keynesian world, expectations are formed “conventionally,” normally via
extrapolation from the recent past. The longer these expectations lead to decisions that
generate satisfactory outcomes, as they do in booms, the greater the confidence - a
subjective sense of certainty that expectations are realistic - that agents place in them.
When a financial boom lasts for some time, agents begin to project its continuance. Given
46 Rob Parenteau suggested that such escrow accounts could be used to bail out these firms when crises threaten their solvency. 47 If governments of major financial centers continue to do whatever is necessary to bail out financial markets when crises appear, it is not clear that even requiring that rainmakers hold equity bonuses for very long periods can solve the perverse incentive problem. If rainmakers know that crises will be relatively short and shallow, they also know that stock price declines will be eliminated in the intermediate run and that they will continue to receive substantial bonuses during the down period. 48 See Crotty 1994 for a careful explanation of Keynes’s theory of financial volatility. For a defense of the proposition that Marx’s theory of financial market behavior has a great deal in common with the financial market theories of Keynes and Minsky, see Crotty 1985.
45
optimistic expectations of future prices, buying securities previously seen as risky now
seems like a reasonable decision. As the boom proceeds and optimistic expectations are
shown to be justified, buying securities with borrowed money also seems like a
reasonable decision. This drives the financial boom forward, raising leverage while
raining capital gains on investors. The heaviest rain falls on the most aggressive
investors. Objectively risky strategies are eventually considered safe. Former IMF chief
economist Raghurum Rajan argued that the underlying cause of the recent financial crisis
was “cyclical euphoria” (Rajan 2009a). Since every long-term financial boom is
accompanied by the widespread belief that we have entered a “new era” in which the
forces that ended all previous booms are no longer operative, the current boom comes to
be seen as permanent. Eventually there is a near-universal belief that high yields
previously achievable only by accepting high risk can now be gained safely.49
Amromin and Sharpe analyze data on consumer financial market expectations to
demonstrate that the description of the Keynesian process of conventional expectation
and confidence formation is the way investors in fact behave. “In forming expectations of
future returns, household investors appear to extrapolate from recent-years’ realized
returns. … [E]xpected returns appear to be procycylical” (Amromin and Sharpe 2009, p.
28). Boldrin and Peralta-Alva show that forecasting future dividends using past data as
input to a distributed lag forecast – a forecasting method consistent with Keynes’s theory
but incompatible with mainstream financial economics – is far more accurate in
predicting future stock price movement than using mainstream financial economics
assumptions. “This assumption… can go along way in accounting for the secular trends
of the U.S. stock market” (Boldrin and Peralta-Alta 2009).
The system eventually becomes, to use Minsky’s famous phrase, “financially
fragile.” Expected future cash flows are increasingly contractually committed by
household and financial and nonfinancial firms to financial institutions, while increased
reliance on short-term financing makes financial firms especially vulnerable when crisis
conditions erupt. Financial booms end when real-sector cash flows, whose growth is
constrained by resource availability and technology, can no longer sustain boom-elevated
49 The importance of the “new era” syndrome in the generation of recurrent financial crises is stressed in Reinhart and Rogoff 2009.

46
security prices and dangerous leverage positions and/or when intra-financial-sector
commitments cannot be met. The crisis can be triggered by any disappointing outcome in
the real or financial sector.
The central point is that from the perspective of the most realistic theories of
financial market dynamics, the value created by boom euphoria, excessive leverage and
dangerous risk-taking is “false value.” It cannot be permanently sustained by real sector
cash flows and must disappear after the boom ends. As Martin Wolf put it: financial
markets “rotate around fair value. Bandwagon effects may push them a long way away
from fair value. But, in the end, powerful forces will bring them back” (Financial Times,
“How mistaken ideas helped to bring the economy down,’ October 28, 2009). Since the
‘false value’ that rainmakers help create is, through its direct and indirect effects, the
main source of their excessive bonuses, they cannot be justified as payment for
contributions to increased economic efficiency and/or long-term economic growth. They
are rents.
Britain’s Financial Services Authority makes a similar point in its overall
assessment of the causes of the crisis and appropriate regulatory responses to it. It argues
that the increase in the relative size of financial markets relative to the rest of the
economy “over the last ten to fifteen years, has also been driven by unnecessary and
undesirable factors.” One is “illusory and the other harmful.”50
The illusory affect can arise from mark-to-market profits in a rising market. … If irrational exuberance pushes the prices of assets to irrationally high levels, mark-to-market accounting will swell declared profit in an unsustainable way. A significant element of trading book profits recorded in the years running up to the crisis proved in retrospect illusory. These illusory profits were however used as the basis for bonus decisions, and created incentives for traders and management to take further risk. … The possible harmful effect is rent extractions. For it seems that some and perhaps much of the structuring and trading activity involved in the complex version of securitized credit, was not required to deliver credit intermediation efficiently. … Wholesale financial services, and in particular that element devoted to securitized credit intermediation and the trading of securitized
50 Bebchuck and Spamann used the same word to describe the ephemeral value of the revenues that were used to justify large bonuses. Executives “took money off the table before it turned out that gains to earnings and stock prices were illusory” (Bebchuck and Spamann 2009, p. 1). The Financial Times’ John Plender states that: “We now know that much of the profit on which bank bonuses were based before the crisis was fictional” (Financial Times, “To avoid the backlash, executives need to act on pay,” April 3/4, 2010).

47
instruments, grew to a size unjustified by the value of its services to the real sector. (Financial Services Authority 2009, pp. 47 and 49, emphasis added)51
Perverse accounting practices made a contribution to the creation of the false
value on which bonuses were based. Martin Taylor, former CEO of Barclays, stressed the
fact that much of the accounting profit used to justify bonuses and serve as the source of
bonus money was itself fictitious or imaginary. In many cases, there was no actual cash
flow coming into the firm to fund bonuses. In such cases, bonuses were taken from what
should have been shareholder money.
Observers of financial services saw unbelievable prosperity and apparently immense value added. Yet two years later the whole industry was bankrupt. A simple reason underlies this: any industry that pays out in cash colossal accounting profits that are largely imaginary will go bust quickly. Not only has the industry - and by extension societies that depend on it - been spending money that is no longer there, it has been giving away money that it only imagined it had in the first place. Worse, it seems to want to do it all again. What were the sources of this imaginary wealth? First, spreads on credit that took no account of default probabilities (bankers have been doing this for centuries, but not on this scale). Second, unrealised mark-to-market profits on the trading book, especially in illiquid instruments. Third, profits conjured up by taking the net present value of streams of income stretching into the future, on derivative issuance for example. In the last two of these the bank was not receiving any income, merely "booking revenues". How could they pay this non-existent wealth out in cash to their employees? Because they had no measure of cash flow to tell them they were idiots, and because everyone else was doing it. Paying out 50 per cent of revenues to staff had become the rule, even when the "revenues" did not actually consist of money. (Taylor 2009, emphasis added)
A letter to the editor following Taylor’s article traced this problem to a change in
accounting procedures for estimating profit.
The fundamental purpose of accounting is to ensure that businesses account for transactions properly and transparently so that they do not pay out more than they are ultimately getting in as cash. Remarkably, International Accounting Standards
51 Nomi Prins, who worked at Goldman, also stresses the ephemeral nature of value-added in Wall Street firms. [I] say this as a former bonus recipient, Wall Street doesn’t produce anything of lasting value.
Transactions are fleeting and revenues are booked up front, regardless of how transactions turn out down the line. If a merger fails, so what? Investment banks collect fees when mergers are initiated and they keep their millions if the mergers turn out to be a terrible idea. The goal is not to promote growth and economic welfare throughout the land. People get paid for creating an illusion of value that is based on some ill-defined notion or demand for a particular product, on assumptions, on internal evaluations, and on sheer spin. … Wall Street always needs to create something new or to leverage or package something to the hilt to keep the money flowing. (Prins 2009, p. 152)
48
introduced in 2005, do not do that. The bad debt provisioning model left out a cost of lending, indeed the biggest risk to a bank, the expected loss of its bad debts. This omission inflated profits, hence inflated bonuses, and what then appeared to be capital wasn't anything of the sort. International Financial Reporting Standards also required booking unrealised profits from merely holding assets in markets that happened to be rising. This imprudent approach actually created a cost, where any compensation was linked to these phantom “profits”, but hard cash-based revenues did not actually materialise. In short, businesses that were going to be the most dysfunctional in the long-run could look the most profitable in the short-run with IFRS-based numbers. There is no difference, in principle, between the phantom profits that arose with IFRS and those of any Ponzi scheme, and because capital will logically flow towards what looks like a profit, any accounting model that is literally making up profits is lethal. (Financial Times, “Accounting takes over from regulation as the prime suspect,” December 29, 2009)
As this article notes, an important way in which profits were inflated by
misleading accounting procedures was through inadequate provision for potential loss on
income statements during the bubble, when risk - and thus likely future losses - was
rising. According to the FDIC, 2006 loss provisions by commercial banks as a percent of
loans and leases were substantially lower than at the end of the mid-1990s bubble, and at
their lowest level since 1979. Under-provisioning for loss raised profit estimates, which
in turn raised bonuses.
Sorkin notes that in some cases, accounting rules “allowed banks to treat a
securitization as a sale” even though the firm gained no revenue unless and until it sold
the product. Yet, as the bubble rolled along banks kept an increasing portion of mortgage-
backed securities either on their balance sheets or, more often, in off-balance-sheet
special investment vehicles, and as the boom petered out, the value of these securities
plummeted. Huge bonuses were paid in response to the generation of imaginary revenue
created by this legal but deceptive accounting practice. Sorkin discusses another “dubious
accounting maneuver” used by investment banks that allowed them to record any decline
in the price of their bonds as revenue on the grounds that, if it wanted to, the firm could
buy back its debt more cheaply. Thus, if investors believed a bank was in trouble, and the
demand for its bonds fell as result, the bank would book this as an increase in revenue
and “literally they pay bonuses off this” (Sorkin 2009, p. 103). The Financial Times
made the same point. Financial analysts say “that many bonuses were built on sand –

49
funded by accounting revenues that did not exist in real cash-flow terms, such as
unrealized trading book profits and the net present value of future derivatives flows” (“Of
greed and creed,” December 24, 2009). Of course, a classic example of this problem is
the payment of insurance premiums to institutions that sell protection against loss through
credit default swaps. This is booked as revenue, with no deduction for the risk of future
claims on these CDSs. The extra revenue and profit derived from this procedure is used
to raise bonuses.
IV 1-b Rents and Oligopoly Power
There has been a substantial increase in the market share held by a small number
of the largest firms in important financial markets in the last quarter century that has
enabled these firms to use substantial market power to increase revenue, profit and
rainmaker bonuses. While speculative “false value” is the main source of money for
bonuses, oligopoly-based market power is also a significant contributor to the money
pool that feeds excessive rainmaker compensation.
The system-shaking problems in US commercial banking in the 1980s and early
1990s drove many firms out of that industry. From the end of WWII through 1979 there
were only a few years in which the number of failures exceeded single digits. But
between 1984 and 2003, 2700 banks failed. As shown in Figure 5, as late as 1995, the top
3 commercial banks owned about 12% of industry assets. A frantic merger process raised
that figure to over 20% by 1998. By 2008, the top-3 banks owned about 36% of industry
assets. The share of assets held by the top 4 banks rose from 13% in 1992 to about 42%
in 2009 (Nersisyan and Wray 2010, p. 11). In 1995, the largest seven commercial banks
in the US had about 22% of industry assets; their share exceeded 45% by 2008. The
Office of the Comptroller of the Currency 2009 reports that the five largest commercial
banks - JPMorgan Chase, Bank of America, Goldman, Citibank and Wells Fargo -
controlled 96.9% of commercial bank derivative activity. US banks were estimated to
have generated revenues of $28 billion in 2009. Oligopoly pricing power and the non-
transparency of this market - “opacity allows dealers to keep the spreads high” - enabled
the big five banks were able to generate high profit and large bonuses from this business
in 2009 (Litan 2010).

50
The economies of scale and scope that underlie the oligopoly market power of the
big firms in many financial markets constitute barriers to entry that insulate the dominant
firms from competition from new entrants. “There is little price competition in
investment banking. The large global firms charge similar amounts for underwriting and
M&A services. Such discipline is only possible if the barriers to entry are high.
Circumstantially, this seems to be the case. There have been few new entrants, and those
there are have done so through acquisition” (Financial Times editorial, “Fat fees, few
banks,” March 22, 2010). Investment banks need a large capital base, access to massive
quantities of borrowed funds at low interest rates, and established networks of satisfied
clients to operate in the biggest and most profitable traditional market segments such as
M&As, IPOs, and market-making, and in newer segments such as the creation and
trading over-the-counter derivates, constructing and warehousing arcane structured
products such as CDOs, engaging in automated computerized trading, and gambling with
the firm’s money. The newer segments generated most of the firms’ profits in the recent
boom. All these activities require enormous investment in the hardware and human
capital associated with information technology. “No industry spends more on information
technology than financial services: about $500 billion globally, more than a fifth of the
total. Many of the world’s computers, networking and storage systems live in the huge
data centres run by banks” (The Economist, “Silo but deadly,” December 5, 2009). To
take just one example, consider the high-speed stock trading done by super computers.
“Although precise figures are elusive, stock exchanges say that a handful of high-
frequency traders now account for more than half of all trades and collected about $21
billion in profits last year” (New York Times, “Senator Wants Restrictions on High-Speed
Trading, “July 25, 2009). Only the largest players can compete in this market and in most
of the other highly profitable segments of the business.
Figure 6 shows that in 2001, the top five investment banks held an impressive
50% of the assets of US brokers and dealers. By 2007 this ratio had risen to about 67%.52
52 The size of the investment bank industry is taken from SIFMA, but this data base may not contain investment banks that are subsidiaries of financial holding companies. Thus, these concentration ratios may be biased upward. This should not materially affect the concentration trends.
The share in total industry revenue of the top ten investment banks stayed within a range
of 48 to 59 percent from 1980 to 2003, but hits 74% in 2007 (SIFMA 2008, p. 36) (The
51
rise in concentration that took place in the aftermath of the crisis and subsequent
government bailout is discussed below.)
The US Census Bureau publishes information on industry concentration every
five years. Consider four firm revenue - not asset - concentration ratios for 1992 and
2002. (The results of the 2007 survey are not yet available.) For savings institutions it
was 12% in 1992, but rose to 31% by 2002. For investment banking and securities
dealing, it was 32% in 1992 and 41% in 2002. Several life insurance categories showed
similarly high concentration. Concentration ratios in wholesale commercial banking and
in important segments of investment banking are higher yet. Such high concentration
ratios clearly make corespective or collusive behavior in key financial markets possible.
Inter-firm relations in these concentrated markets vary, with intense competition
in some products and services, but corespective behavior in others. For example, there is
fierce competition among investment banks for brokerage business narrowly defined –
the buying and selling of financial assets for clients. Fees were fixed at a high level by
agreement among large investment banks in the US prior to 1974, but thereafter
conditions became more competitive and profit margins declined secularly. By 2006 it
was widely claimed that investment banks were breaking even or losing money on their
narrowly defined brokerage business.53
Conversely, the opulent fee structures of hedge and private equity funds suggest
the absence of price competition. The general partners in private equity funds normally
charge an annual management fee of about two percent of assets under management and
receive a 20 percent share of the profits of the fund. They also charge firms they own
considerable ‘fees.’ In a Financial Times article written to defend the efficiency of
private equity funds, a former president and CEO of Morgan Stanley notes that “private
equity’s notoriously high “friction costs” increase the spread between the rate of return
on the fund’s assets and the return investors receive at 11 percent a year – a huge margin
Other competitive markets include exchange
traded derivatives and, in the recent boom, bank loans to hedge and private equity funds.
53 Even though even large investment banks apparently do not make money on simple brokerage, none of them will exit the business. They do make lots of money in ways that require brokerage. For example, they earn money in their role as market makers. More important, running a large trading “book” allows banks to to make money gambling for clients and on their own account. Constant trading of large positions gives bank traders crucial ‘inside’ information. When they get large orders to buy, they can buy on their own account before executing client trades, and vice-versa. This is called “front running” and it is alleged to be extremely profitable.
52
(“Private equity’s halcyon days are not yet threatened,” March 8, 2007, p. 11). According
to Froud and Williams 2007, there is “little evidence of any competition on fee levels,” a
view that seems widely accepted (p. 10). Such consistently high fees that earn fund
general partners fabulous fortunes (that are taxed at low capital gains rate in the US) are
simply incompatible with the assumption of intense competition. An identical argument
can be made about lucrative fee structures in the hedge fund industry – also normally 2
percent of assets and 20 percent of profits.
In 2007, the top three commercial banks in the syndicated corporate loan market
controlled at least half the business. JPMorgan Chase had 29%, Bank of America had
18%, and Citibank had 15%. (Berlin 2007, p. 2). In early 2009, the largest seven
commercial banks wrote 98% of commercial bank originated derivates (FDIC 2009).54
“Bounced-check and ATM fees are setting records. Consumers are paying higher service charges on interest-bearing accounts, Bankrate.com says. And banks that issue credit cards are increasing fees for late payments and over-the-limit charges to as much as $39 per violations. Make this mistake once or twice and your interest rate could hit 30%. ‘These are not things that are subject to price competition,” says Greg McBride of Bankrate.com.’” (USA Today, “Rising bank fees hit customers,” October 4, 2005).
It
is also clear that the sustained existence of numerous shockingly high ‘fees’ to
commercial bank customers reflects corespective behavior. Service charges on deposit
accounts are the largest single source of identified non-interest income for commercial
banks, while non-interest income now generates more than half of bank revenue.
Big investment banks do not use price competition in traditionally lucrative
investment banking businesses like M&As and IPOs, where fee structures are well
established. They can sustain profit margins because the three firm concentration ratio in
global IPOs is 41% and the five firm ratio is 65%. Concentration is also high in the global
M&A market (S&P Industry Surveys 2009). In 2008, 89 of the top 100 hedge funds in the
world traded through the investment bank Morgan Stanley (Sorkin 2009, p. 411). US
investment banks face less intense competition than their European counterparts. The
54 The Financial Times reports that “the five biggest bank derivatives dealers in the US held 97 per cent of the more than $200,000bn in notional derivatives held by US banks at the end of the second quarter [of 2009]. This translates into billions of dollars in trading revenue each year – revenue that is generated from the dealers’ privileged position as credit intermediaries with implied government guarantees and from a level of opacity not seen in any market of comparable size” (“We must overturn the status quo in derivatives,” October 27, 2009).
53
Financial Times reported that M&A activity in Europe exceeded that in the US for 2006,
yet cumulative fees for M&A work were almost twice as high in the US. “Despite the
fragmentation of the European market, pricing pressures actually appear to be fiercer than
in the US… In the US market, indigenous banks have held on to high fees, partly be
fending off foreign interlopers… Higher fee rates mean American deals remain more
lucrative.” (“Land of the Fee,” December 21, 2006, p. 14). Moreover, the lack of
transparency in the lucrative over-the-counter derivative market as well as the extreme
asymmetry of information between banks that create and sell these instruments and the
institutions that purchase them enabled banks to set very high profit margins on these
products.
Pricing power based on oligopolistic financial market structures and practices has
added substantially to the pool of funds created by boom-induced ‘false value’ that are
the main source of rainmaker compensation. One Financial Times editorial argued that:
“inadequate competition failed to whittle away large profits – as enormous returns on
equity showed – and therefore [failed to reduce] outsize compensation, unlike in other
industries” (“Public needs more bank for its bucks,” October 16, 2009). Another
supported two key claims made in this paper. “Banks are rent extractors - and
uncompetitive ones at that. Even after paying high bonuses, the banks’ return on equity is
extremely high” (Financial Times, “Editorial Counsel of Despair,” April 22, 2010).
IV. How Are Rainmaker Rents Created and Sustained Over Time
Part 2: How rainmakers are able to capture an exceptionally large share of revenues
in good times and bad.
The key question to be answered in this section is this: given that the
compensation system was a serious threat to the interests of shareholders, taxpayers, the
reproduction of the financial system, and the survival of the big investment banks, why
were rainmakers allowed to maintain it? We first ask why neither shareholders, top
executives, boards of directors, capital markets, government regulators nor market
competition forced a more efficient and less risky compensation system on rainmaker
financial firms. The section concludes by asking why the chronic excess supply of
qualified candidates for rainmaker jobs failed to eliminate rainmaker rents.

54
In the rainmaker financial firm, compensation is at least 50% of net revenue
(gross revenue minus interest costs) in the bubble and often much higher in the downturn.
For example, compensation at Morgan Stanley was 72% of net revenue in the second
quarter of 2009, as revenues plummeted while bonuses did not fall by much (Barker
2009).
One can easily understand how a partnership culture in which rainmakers believe
that the goal of the firm should be the maximization of rainmaker compensation might
carry over when the partnership goes public. But there is a crucial difference in the way
pursuit of this goal affects performance in partnerships and public investment banks.
Private investment banks have an incentive to limit risk and leverage even in the boom,
because when risky decisions lead to large losses, it is the partners themselves who
absorb all the losses. Before it went public in 1999, Goldman Sachs was a private
partnership. Most of the partners’ money “was tied up in the firm until they retired.” Not
surprisingly, this restrained risk-taking; partners “took good care of their pot of gold”
(Financial Times, “Goldman should be allowed to fail,” October 23, 2009).55 But when
risk-seeking in pursuit of large bonuses in large public investment firms eventuates in a
collapse in revenue, rainmakers can deflect revenue losses onto shareholders because
they control firm compensation policy and onto taxpayers because the government will
rescue them in the event of a crisis.56
The new asymmetry in rainmaker compensation led to a substantial increase in
the portion of bank revenues and profits that came from gambling with the firm’s own
capital as opposed to fee generation for the provision of client services, even though fees
rose as well. Goldman Sachs is a good example of this transformation. From 1996 to
1998, traditional investment banking activity generated about 40% of the firm’s revenue,
but in 2007, its best year, this source was responsible for just 16%, while gambling –
A Financial Times article captured the essence of
the situation: “the crisis is a timely reminder that investment banking is a business where
investors are engaged in a joint venture with employees. Shareholders should never
forget that they are very much the junior partners” (Larson 2008, p 19).
55 The article notes that risky trading operations generated only a third of Goldman’s revenue in 1999, but this increased to two-thirds in 2006-07 and 78% in the first three-quarters of 2009. 56Even in cases in which bonuses were paid in company stock with time restrictions on resale, financial innovation created transactions such as total returns swaps that allowed rainmakers to effectively convert these shares into other assets without actually selling them.
55
trading and principal investing – generated 68% of revenue (New York Times, “Wall
Street, R.I.P.; The End of an Era, Even at Goldman,” September 28, 2008). This shift to
gambling substantially raised the risk associated with the firm’s revenue flow. Indeed,
one of the main reasons banks went public in this era was to be able to maximize the
capital available for proprietary risk-taking.
We consider five sets of agents and one market process that had the potential
ability to force a more appropriate compensation system on the firm: shareholders, top
executives, boards of directors, capital markets, government regulators and market
competition. Yet none of them did so. Why not?
Shareholders: Why didn’t shareholders prevent the use of a compensation scheme that
threatened their interests? Mainstream financial market theory cannot explain the
reproduction over a long period of time of a compensation system structured to allow
rainmakers to loot shareholders and threaten the existence of the firm itself. Of course,
there are many papers that discuss principal-agent conflict in financial firms. But they
conclude that these lead only to minor imperfections that prevent financial markets from
fully attaining perfect efficiency. I know of no paper in a respected mainstream journal
that concludes that the rainmaker-shareholder conflict is so severe that it destroys any
claim to financial market efficiency, and thereby negates the core claim of canonical
neoclassical theories of financial markets such as the capital asset pricing model and
options pricing theory. A rainmaker-run system will generate lower risk-adjusted long-
term shareholder returns and higher systemic risk than in idealized mainstream models of
financial markets because it will use too much leverage, misallocate credit, create rising
inequality, cause excessive financial market volatility and utilize more resources in
financial markets than can be justified on efficiency grounds. Yet even the behavioral
financial theory critics of efficient financial market theory fail to acknowledge the
severity of these problems. “The behavioral finance literature… simply adopts the
neoclassical view with biases added (e.g., overshooting, undershooting, framing, etc.”
(Findlay and Williams 2008-09, p. 224).
Keynesian theory can help solve the puzzle represented by the sustained existence
of the rainmaker financial firm because it has no paradigmatic commitment to
demonstrate that financial markets are efficient. Though the data clearly show that

56
existing compensation schemes induce behavior that is inconsistent with objective
shareholder interests, Keynesian theory suggests that in financial booms, shareholders
are likely to believe that rainmaker compensation practice are compatible with their
perceived or subjective interests. During the boom, most shareholders, relying on
conventionally-determined optimistic expectations, believe that the spectacular capital
gains of the period are realistic reflections of buoyant future economic conditions. They
therefore may be perfectly happy with investment bank risk-taking practices even though
these practices are objectively counter to their longer term interests. In the midst of boom
euphoria most people fail to understand that their banks are taking excessive risk. Thus,
from a Keynesian perspective, the question of why and how rainmaker financial
corporations are able to act against objective shareholder interests for years or even
decades need not arise: shareholders are usually happy with their banks in the bubble. If
you bought Merrill Lynch stock at $6.50 at the end of 1994, or even at its cycle-peak
price of $14 at the end of 2000, you would have been thrilled in late 2006 when the stock
reached $47
(http://finance.yahoo.com/q/hp?s=BAC&a=04&b=29&c=1986&d=07&e=11&f=2009&g
=m&z=66&y=66).57
The overwhelming majority of shareholders probably did not want the firm to
change compensation or any other policies in 2006. And the near universal belief of the
business press, financial advisors, government regulators, and economists at the time was
that the boom was based on sound fundamentals. Of course, a Keynesian perspective also
implies that free financial markets are inherently unstable and dangerous to the economy
and society. They therefore need to be tightly regulated by the government at all times, a
decidedly non-mainstream conclusion.
A complete answer to the question of why shareholders did not restrain rainmaker
greed must include the fact that most of the equity in US firms is held by financial
intermediaries assumed to be acting in the interest of individual investors. In the
immediate post WWII era, households owned most stock and were long-term owners
concerned with long-term returns. In the 1950s households owned 90% of stocks and
57 The price is adjusted for stock splits and dividends. It thus shows how much the value of an initial stock purchase changes over time.

57
held their stock for about a decade. Moreover “up until the mid-1960s, when the mutual
fund business first exploded, [even] the average holding period in a professionally
managed fund was seven years” (Fox 2009, p. 280). As recently as 1996, the household
share was 50% (SIFMA 2008, p. 72). By 2007, financial institutions held 75% of US
stock. The Wall Street Journal reports that 18 of the top 20 shareholders at Morgan
Stanley and Bank of America and 19 of the top 20 at Goldman Sachs are mutual funds.
“That clout has given fund firms a central, if sometimes overlooked, role in overseeing
public companies and policing corporate practices” (“Critics Say Funds Should Do More
to Police Corporate Pay,” April 5, 2010).58
The turnover rate on the New York Stock Exchange exceeded 100% in five of the
six years between 2002 and 2007, hitting 123% in the final year (SIFMA 2008, p. 49).
This implies that the time horizon of intermediaries is very short. As long as they believe
that a boom may last for awhile, institutions will keep buying stock or at least not sell off
much of what they have. Hedge funds in particular are notoriously short-term traders. It
was recently reported that “high-frequency trading” – computer executed trades that are
usually reversed in milliseconds - “accounts for as much as 73 per cent of US daily equity
volume, up from 30 per cent in 2005” (Mackenzie 2009). Yet objective shareholder
interests and economic efficiency require that financial firms have a long-term planning
horizon.
Crotty 2008 explains that key decision makers in institutional investors such as
mutual funds have perverse incentives similar to those of investment bank rainmakers
that lead them to buy and hold rainmaker financial firm stock in booms - whether their
own expectations are optimistic or pessimistic. They are not only short-term
shareholders, but risk-loving shareholders as well, at least in boom periods.
Compensation for those who run institutional investment companies rises with assets
under management. This encourages firms to seek maximum growth, which in turn
requires that they seek a maximum rate of return on assets. Since high returns induce
investors to put their money in the firm, which increases the size of assets under
management, there are strong reasons to pursue high-risk high-return assets in the boom. 58 The article argues that mutual fund portfolio managers’ careers, “much like those of Wall Street traders, hinge on their skills in valuing various securities. If anyone is likely to think this skill is worth millions of dollars a year, it is people whose own livelihood also depends on it.”
58
This is especially the case in periods in which financial asset prices have been rising for
some time, because the longer the boom, the more likely it is that investors will believe
that high-return-chasing is not a risky strategy. Their own incentive structure thus leads
institutional investors to buy rather than sell stock in rainmaker financial corporations in
the boom, reinforcing the risk-taking embedded in the rainmaker bonus system. Money
market managers “chase whatever’s hot and shun whatever’s not. Those who are the best
at this game attract more money in rising markets and lose fewer clients in falling
markets…” (Wall Street Journal, “Inefficient Markets are Still Hard to Beat,” July 9-10,
2009).
The positive incentives for intuitional investors to support rainmaker policies are
reinforced by competitive pressures facing these firms, one form of the “destructive
competition” that operates in many important markets.59
We conclude that shareholders cannot restrain the excesses of rainmaker
compensation schemes. There is, however, an additional problem. The relatively short
time horizon of the typical rainmaker, who can maximize expected discounted
Institutional investment
management is a very competitive business. Contracts to manage pension fund assets are
awarded to those firms with above-average returns on assets. Contracts may be
withdrawn from any firm whose returns are below average for a period as short as six to
nine months. Thus, even if the top management of a mutual fund understood that holding
shares of rainmaker financial corporations in the boom was likely to lead to large losses
in the intermediate run, it would be rational to hold these shares anyway in order to
protect against the loss of large contracts. When financial markets crash and all such
firms lose money, no individual firm will see their contracts removed as long as their
losses are not substantially above the industry average. Rajan 2005 cites empirical
evidence that mutual firms gain more from above-average returns in the boom, then they
lose from below-average returns in the bust. Eric Tymoigne argues that institutional
investors “behave rationally in the sense that stiff competition and short-term incentives
to reach money-return targets push them to do whatever is legally (and sometimes
illegally) possible to maintain market share” (Tymoigne 2009, p. 16, emphasis in
original).
59 The concept of “destructive competition” is discussed in detail in Crotty 1993.

59
compensation by riding the boom even if this crashes the firm, combined with the very
short time horizon of the ‘average’ shareholder, minimizes the probability that the firm
will reproduce itself over time. Short-term owners will support short term speculative
investment decisions that would – in the absence of recurrent government rescue efforts -
threaten the survival of the firm over the long term. They will also oppose investments
that only bear fruit in the intermediate and long run – investments that are crucial for
long-term economic efficiency. Alex Edmans and Xavier Gabaix 2009 put the problem of
short-term rainmaker horizons this way:
[S]tock and options typically have short vesting periods, allowing executives to “cash out” early. For example, Angelo Mozilo, the former CEO of Countrywide Financial, made $129 million from stock sales in the twelve months prior to the start of the subprime crisis. This encourages managers to pump up the short-term stock price at the expense of long-run value – for instance by originating risky loans, scrapping investment projects, or manipulating earnings – because they can liquidate their holdings before the long-run damage appears.
Top Executives: In textbook descriptions of firm governance, the CEO and other top
executives are supposed to make sure that the interests of the owners are paramount,
though sources of principal-agent conflict may lead them astray.60
The compensation practices of rainmaker financial firms align the material
interests of top executives with those of rainmakers. It was noted above that Lehman
Brothers CEO Richard Fuld received almost half a billion dollars in compensation in the
long financial expansion from1993 to 2007. Even if they run their firms into the ground
and are fired, top CEOs often get huge payoffs. Stan O’Neill at Merrill Lynch received
$166 million as a going away present, Charles Prince, the CEO of Citigroup, was paid
Anyone who paid
attention to the accounting scandals of the late 1990s understands that the main textbook
story is a fable. Top executives in firms such as Enron, Tyco and WorldCom made
decisions that enriched them, but led to the destruction of their firms and the collapse in
the value of their stock. Aided and abetted by their bankers (who created nontransparent
special purpose entities to hide risk) and accountants (who lied about their financial
health), these executives deliberately kept information needed to anticipate the coming
disaster from their shareholders.
60 It is not clear whether top management is supposed to pursue shareholders’ objective or subjective interests because mainstream theory assumes the two are identical.

60
$68 million upon his release after the firm’s collapse, and CountryWide offered CEO
Angelo Mozilo $115 million after the firm failed and was taken over by Bank of
America.61
Indeed, it has been argued persuasively that the main job of a CEO is to keep the
firm’s rainmakers, not its shareholders, happy.
Mozilo had been paid $471 million in his five year reign as CountryWide
CEO. Kerry Killinger, CEO of Washington Mutual, whose 2008 collapse was the biggest
in American banking history, “was paid $103 billion from 2003 to 2008. In WaMu’s final
year of existence, he received $25.1 million, including a $13.3 million severance
payment.” According to documents released by a Senate panel, WaMu was “entrenched
in fraudulent and risky lending” (New York Times, “Memos Show Risky Lending at
WaMu,” April 12, 2010). Rajan tells us that financial firm CEOs take excessive risk to
boost performance, arguing that “even if managers recognize that this type of strategy is
not truly value creating, a desire to pump up their bank’s stock prices and their own
reputations may nevertheless make it their most attractive option” (Rajan 2009, p. 399).
62
The Wall Street CEO must possess an extraordinary ability to be paid huge sums of money each year without losing composure. This isn't as easy as it sounds, especially when the firm is losing billions. … The Wall Street CEO must quickly see where his interests, and those of his most ambitious underlings, differ from those of his shareholders. He must then navigate a tricky course: maximizing his own interests, and the interests of his most ambitious -- and thus to him most dangerous -- underlings, without attracting shareholders' attention. … [CEOs must gamble] big time with shareholders' capital. If the gamble pays off, the CEO and his underlings take home giant bonuses at the end of the year. If the gamble fails, the CEO takes home his nine-figure severance package and five years use of the corporate jet. His underlings move up in the firm, or get reassigned, or leave and join other firms -- where, if they're working for a CEO who knows the game, they get to make the gamble all over again. Sooner or later, it's going to pay. (Lewis 2007)
Michael Lewis, an insightful critic of
Wall Street with a great sense of humor, offered the following qualifications for a Wall
Street CEO.
The CEOs of giant financial firms generally have no detailed knowledge of how
their employees make money and most have no knowledge at all about the complex
61 Mozilo’s payoff was lowered due to pressure from Congress. 62 It is true that when individual bonuses are being determined, most rainmakers fight with top executives and each other over the size of individual bonuses. Nevertheless, top executives have to keep their key rainmakers happy to achieve their own goals.

61
products such as mortgage-backed securities, collateralized debt obligations and credit
default swaps that generated much of the firm’s revenue in the recent boom.63 As a result,
decisions about the best ways to make money for the firm and its rainmakers are made
well below the CEO level. Davis 2003 notes that “because of the complexity of the
business and the speed with which it changes, strategy is formulated largely below the
most senior level through a grass roots of bottom up process” (p. 58). They also do not
know how the company’s statistical risk management techniques operate and normally
have little if any contact with corporate risk-management officers. Their investment
positions change so rapidly and the financial instruments they hold are so complex and
opaque that not even the best Chief Financial Officers have more than a vague
assessment of risk at any point in time.64
There is, of course, a reason that the market doesn't understand Wall Street firms: The people who run Wall Street firms, and who convey news of their inner workings to the outside world, don't understand them either. Jimmy Cayne [CEO of Bear Stearns] plays bridge, and Stan O’Neill [CEO of Merrill Lynch] golfs while their firms collapse, not because they don't care their firms are collapsing, but because they don't know that their firms are collapsing. Across Wall Street, CEOs have made this little leap of faith about the manner in which their traders are making money, because they don't fully understand what their traders are doing. Late last November, in a superb account of the demise of Citigroup CEO Charles Prince, Carol Loomis of Fortune magazine revealed that Prince resigned after he was informed of the consequences of liquidity puts -- options that allowed buyers of complex and presumably safe mortgage securities to hand them back to Citigroup at par if they became hard to finance.
Michael Lewis made this point forcefully.
65
63 A Wall Street Journal article observed that in the years before the crisis, managers “with a healthy fear of risk lost power struggles to men more likely to ignore it.” It noted that “Stanley O’Neil, who climbed to the top at Merrill Lynch … never found the time to learn about his firm’s multi-billion-dollar “warehouse” of collateralized debt obligations” (“The Road To Ruin,” November 3, 2009).
Liquidity puts that were about
64 Sorkin explains the situation at Lehman Brothers as follows. “Banks were creating increasingly complex products many levels removed from the underlying assets. This entailed a much greater degree of risk, a reality that neither [CEO Fuld nor his first lieutenant] totally grasped and showed remarkably little interest in learning more about.” It was clear that the “firm was making bigger bets than it would ever be good for and nobody in the executive office seemed to understand or care. To criticize the firm’s directions was to be branded a traitor and tossed out the door.” No one would be allowed to stop the risk-driven process that was raining wealth down on all Lehman Brothers rainmakers (Sorkin 2009, p. 122-23). 65 Liquidity puts are an excellent example of the perverse nature of the bonus system. When markets for structured financial products such as CDOs first came under pressure, buyers of these securities became concerned that their short-term financing sources might dry up, leaving them holding illiquid securities they could not finance. To maintain sales, the originating investment banks offered to buy them back in the event this happened. This allowed the banks to sell the CDOs even in difficult times. The bank rainmakers received their bonuses for selling the CDOs even as the likelihood they would have to take them back at a loss increased. When this happened, the rainmakers kept the bonuses even though there was no revenue gain for the firm.

62
to make Citigroup the new owner of $25 billion of crappy mortgage securities at par, cost Prince his job, and put the company into the hands of Robert Rubin. Rubin is an extremely smart man with keen instincts of self- preservation, and he sat closer to Prince than anyone else at Citigroup. Rubin said he had never heard of liquidity puts. To both their investors and their bosses, Wall Street firms have become shockingly opaque. (Lewis 2009, emphasis added)
Lewis then argues that the inability of CEOs to understand what their
rainmakers do, even though their own compensation depends on the success of how well
rainmakers perform, began in the dawn of the new era on banking.
But the problem isn't new. It dates back at least to the early 1980s when one firm, Salomon Brothers, suddenly began to make more money than all the other firms combined. (Go look at the numbers: They're incredible.) The profits came from financial innovation -- mainly in mortgage securities and interest-rate arbitrage. But its CEO, John Gutfreund, had only a vague idea what the bright young things dreaming up clever new securities were doing. Some of it was very smart, some of it was not so smart, but all of it was beyond his capacity to understand. Ever since then, when extremely smart people have found extremely complicated ways to make huge sums of money, the typical Wall Street boss has seldom bothered to fully understand the matter, to challenge and question and argue. This isn't because Wall Street CEOs are lazy, or stupid. It's because they are trapped. The Wall Street CEO can't interfere with the new new thing on Wall Street because the new new thing is the profit center, and the people who create it are mobile. Anything he does to slow them down increases the risk that his most lucrative employees will quit and join another big firm, or start their own hedge fund. He isn't a boss in the conventional sense. He's a hostage of his cleverest employees.” (Lewis 2009)
Moreover, it is not clear the CEO could reform the bonus system even if, for some
idiosyncratic reason, he wanted to. Warren Buffet became a major investor in Salomon
Brothers in the early 1990s and tried to reform the existing compensation scheme. He
wanted to institute a change in bonus system so that bonuses would not wipe out
shareholder returns in a difficult year. “Faced with the prospect of not receiving what
they regarded as a fair share of the revenues in a bad year for the firm, key traders in the
firm revolted, and the plan was put aside. Mr. Buffett later sold his interest in Salomon”
(Davis 2003, p. 76).
Thus, the only way CEOs can keep the revenue and profit flowing in the boom,
thereby maximizing their own compensation, is by giving the firm’s rainmakers, the
people who do know how to make money, large enough bonuses to retain their loyalty.

63
Banks do have risk managers whose job is to measure risk and warn top
management whenever rainmakers are making decisions that involve what the manager
believes to be excessive risk. However, if risk managers repeatedly warn of excessive
risk in the heat of the boom, threatening to kill the geese laying Golden Eggs, they are
sure to be ignored and likely to be demoted or fired. Former IMF chief economist Simon
Johnson and a colleague put the matter this way. “Imagine the situation of the chief risk
manager of a bank in, say, 2004.” If he “tried to reduce his bank’s exposure to structured
securities such as collateralized debt obligations, he would be out of a job” (Simon
Johnson and James Kwak, “Seduced by a Model,” New York Times, October 1, 2009).
Rajan pointed out that “internal risk managers, who repeatedly pointed to risks that never
materialized during the upswing, have little credibility and influence – that is, if they still
have their jobs” (Rajan 2009, p. 400). Business Week cites the case of the man who ran
Lehman Brothers’ real estate division. He “warned Lehman CEO Dick Fuld about the
real estate bubble in 2006. “Fuld promptly fired the misfit, and two years later, Lehman
went bankrupt"" (Blinded by Optimism – From 9/11 to Subprime,” October 26, 2009, p.
76).66
In 2008, The Economist published an article called “Confessions of a risk
manager” in which a risk manager at a major financial institution explained why those in
his position were unable to restrain excessive risk-taking by their firm’s rainmakers
during the bubble. Some of the problems seemed to result from a combination of
incompetence, naiveté and disingenuousness. “Our risk-management response [to
Sorkin explained that Lehman had a qualified chief risk officer with a Ph. D in
economics and experience at Goldman. However, "her input was virtually nil. She was
often asked to leave the room when issues concerning risk came up at executive
committee meetings, and in late 2007, she was removed from the committee altogether"
(Sorkin 2009, p. 122). The Wall Street Journal reported that a senior partner at Lehman
raised concern with the firm’s auditor in 2008 that Lehman “was temporarily moving $50
billion in assets off its balance sheet … to mask the risks Lehman was taking amid
scrutiny by investors and regulators about the health of Wall Street firms.” The firm fired
him shortly thereafter (“Lehman’s Whistle-Blower’s Fate:: Fired,” March 15, 2010).
66 The internal quotation is from Barbara Ehrenreich 2009. Stanley O’Neil, Merrill Lynch’s CEO fired a top level executive in 2006 because he argued that Merrill should limit the amount of risky CDOs it created and held in the face of rising mortgage problems (Sorkin 2009, p. 145).

64
excessive risk-taking] was half-hearted,” he said. We “left the trading desks to their own
devices.” “We also trusted the ratings agencies. … It was assumed the ratings agencies
simply know best.” But the main problem was structural – tremendous pressure by the
firm’s rainmakers not to interfere with the risk-taking that generated the money for their
giant bonuses. “The pressure on the risk department to keep up and approve transactions
was immense.” In the eyes of the rainmakers:
we were not earning money for the bank. Worse, we had the power to say no and therefore prevent business from being done. Traders saw us as obstructive and a hindrance to their ability to earn higher bonuses. They did not take kindly to this. … Most of the time the business line would simply not take no for an answer, especially if the profits were big enough. (The Economist 2008)
Boards of Directors: The Board of Directors is the body legally obligated to ensure that
the corporation operates in the interests of its stockholders. Corporate law gives the
Board, not the CEO, the power to run the company, and the Board must be elected by
shareholders. But in practice, most Boards are controlled by top management. Harvard
Law School’s Lucien Bebchuk is an expert on the relationship between Boards and top
managers who has focused on the issue of executive compensation. A recent coauthored
book makes clear that CEOs control the Board, not the other way around (Bebchuk and
Fried 2004).
Directors have had various economic incentives to support, or at least go along with, various arrangements favorable to the company’s top executives. Various social and psychological factors - collegiality, team spirit, a natural desire to avoid conflict within the board team, and sometimes friendship and loyalty - have also pulled board members in that direction… [And] limitations on time and resources have made it difficult for even well-intentioned directors to do their pay-setting job properly. (p. 4)
Dissident shareholders contemplating putting forward their own director slate
have confronted substantial obstacles. As a result, the director slate proposed by the company has almost always been the only one on the ballot. … The key to a board position is, therefore, getting one’s name on the company slate. And, thus far at least, CEOs have had considerable, and sometimes decisive, influence over the nomination process. (p. 25)
CEOs have a great deal of power apart from their influence over board
nominations. They have substantial control over the firm’s resources, and their position sometimes gives them significant influence outside the firm. CEOs can use this power to benefit individual directors directly or indirectly. In the past,

65
CEOS have displayed considerable willingness to use their power to reward friendly directors in myriad of ways. (p. 27)67
As a company leader, usually as a board member, and often as board chair, the CEO has some say over director compensation. … The CEO can choose to either encourage or discourage director pay increases. (p. 30)
Board members responsible for overseeing top executive compensation normally
rely on outside consultants who are most likely to be rehired if they make compensation
awards that please the CEO.
Directors have economic incentives and psychological tendencies that would probably produce outcomes favorable to executives even if the information and advice provided to the directors came from individuals focusing solely on shareholder interests. But the providers of information and advice have their own incentives to favor executives. This has been true not only for firms’ human resources departments, which are subordinate to the CEO, but also for compensation consultants. Compensation consultants have faced strong incentives to please, or at least not to anger, the CEO. As Warren Buffet remarked, compensation consultants “had no trouble perceiving who buttered their bread.” … [T]he basic goal of compensation consultants is to justify whatever it is the CEO wants to make. After all, who’s going to recommend these consultants to other CEOs? (Bebchuk and Fried 2004, p. 38)68
Boards also failed to prevent the widespread practice of allowing top executives
to ‘backdate’ their stock options, changing the date at which they were originally granted
to a prior date when the stock price was substantially below the current price, putting
their options ‘in the money.’69
67 Keep in mind that director pay skyrocketed along with CEO pay in the long stock market boom that began in the early 1980s.
68 Moreover, it is always assumed that the firm has above-average top executives, so consultants typically suggest that the firm’s CEO receive above industry-average compensation, the effect of which is to constantly ratchet up average CEO compensation. 69 There is a substantial literature on dysfunctional compensation schemes for top executives of nonfinancial firms that induced them to maximize short-term stock price increases because pay was dominated by stock options. (See, for example, Bebchuk and Fried 2004.) This puts the long-term health of the firm at risk. CEOs are rewarded with opulent pay packages loaded with stock options when their firms generate high revenues and profit in expansions. Like rainmakers, they are still paid handsomely when markets crash. When stock prices fall, wiping out the value of recently granted stock options, top executives simply have the Board backdate their options to a time when stock prices were even lower, thus making their options valuable once again. See for example “Backdating Likely More Widespread,” Wall Street Journal, August 18, 2009. This article discusses a recent study that identified “141 companies with such advantageous options-granting practices that the researchers concluded they were highly likely to have been involved in backdating.” Of course, this is illegal.

66
As Lehman Brothers' stock plummeted in the crisis, the Board "was still loyally
Fuld's board." At a meeting, one member assured Fuld that "I know you guys have done a
good job. This was just bad luck. We're one hundred percent behind all of you" (Sorkin
2009, p. 294). In a September 2008 conference call, “Mr. Fuld followed his
announcement that the firm had lost $3.9 billion in the third quarter by declaring, “I must
say the board’s been wonderfully supportive.” Four days later Lehman filed for
bankruptcy, costing shareholders $45 billion.” GM Shareholders lost $52 billion during
the tenure of Rick Wagoner as GM chairman. In 2008 as his firm teetered on the edge of
bankruptcy, Wagoner said: “I get good support from the board. We say, ‘Here’s what
we’re going to do and here’s the time frame,’ and they say ‘Let us know how it comes
out.’” (New York Times, Taking Away Director’s Rubber Stamps,” January 17, 2010).
There is thus no realistic hope that Boards of Directors will be the agents who restrain
rainmaker compensation, thereby reducing their incentive to take excessive risk.
Capital Markets: We have seen that neither institutional nor individual holders of equity
capital restrained the compensation schemes of rainmaker financial firms. However, the
financial firms we have been analyzing are highly leveraged institutions. Thus, their
ability to grow over time is strongly influenced by those individuals and institutions that
provide debt capital to the firm and thereby codetermine the quantity of borrowed funds
available to the firm and the cost of these funds.
The main forms of borrowed funds that fueled the spectacular growth of
investment banks in the past two decades were ‘repos’ (sale and repurchase agreements)
and ‘security credit from households.’ These are both undependable, short-term credit
sources that should never have been used to finance very risky, long-term, potentially
illiquid assets such as MBSs and CDOs.70
As a result of increasingly generous pay schemes for top executive centered on stock options since the late 1980s, and the secular rise of stock prices over the past two decades, top executive pay has skyrocketed. The ratio of average CEO compensation to the pay of the average worker was in the mid-20s in the 1960s and increased the mid-30s by the late 1970s. It accelerated rapidly after 1980, hitting 299 in 1998 and was still 275 in 2006 (Bernstein, Mischel and Shierholz 2009, p. 221).
The McKinsey Global Institute estimated that
in 2006, 70 percent of total assets held by the top five US investment banks was funded
with short-term debt (McKinsey Global Institute 2010, p. 29). Diamond and Rajan argue
that investors preferred very short-term to long-term lending to big investment banks
70 Some CDOs have a thirty year maturity.

67
because of “the complexity of bank risk-taking and the potential breakdown in internal
control processes” (cited in Rajan 2009b).
A repo is a transaction in which the borrower sells a security to the lender with the
promise to repurchase it in the near future at a price above the sale price. This price
differential generates an interest yield on the loan. It is a collateralized loan, with the
security as the collateral. In 2007, according to Federal Reserve flow of funds data, net
repos were 38% of total investment bank liabilities. The big banks relied on repos to a
greater extent than did smaller brokers and dealers. “The former top US investment banks
funded roughly half of their assets using repo markets…” (Gorton and Metrick 2009, p.
10).
Lenders in the repo market are primarily institutional investors such as mutual
funds, pension funds, banks and large nonfinancial firms. They often have substantial
sums of money that they do not intend to invest in longer term assets in the immediate
future. Since there is a limit on the size of bank deposits that are insured by the
government, large institutions need a safe, short-term, interest-bearing form in which to
hold their money. In normal times, repos are safe because they are collateralized, and
often over-collateralized, with safe securities. A $40 million dollar repo loan may involve
$50 million worth of securities as collateral: the difference is called the “haircut.”
Lenders were quite content to get an attractive interest rate on the seemingly well-
collateralized use of their funds in the boom, and therefore happily provided large
investment banks presumed to be super-safe with huge amounts of relatively cheap short-
term financing.71 72
71 An attractive attribute of repos for lenders is that they can use the collateral given to them by the borrowers as collateral for loans of their own, for example as collateral against a derivative position. The reuse of collateral is referred to as “rehypothecation.”
According to the New York Federal Reserve Bank, the “primary
dealers” of Treasury securities, which recently included four of the five independent
investment banks and several of the large investment banks that were part of financial
conglomerates, had repo liabilities of $450 billion in 1994, and about $1.5 trillion in
72 In his book about the rise and fall of Long-Term Capital Management, a hedge fund organized by a set of the most prestigious academics, traders and former regulators on Wall Street, Lowenstein explains how the firm acquired $2 billion worth of Treasury bonds without putting up any of their own money through use of the repo market. "No sooner did Long-Term buy the off-the-run bonds than it loaned them to some other Wall Street firm, which then wired cash to Long-Term as collateral. Then Long-Term turned around and used this cash as collateral on the bonds that it had borrowed. … "Long-Term pulled off the entire $2 billion trade without using a dime of its own cash" (Lowenstein 2000, p. 45, emphasis in original).

68
2000.73 This rose dramatically to $4.5 trillion in 2008. Repo liabilities of large Wall
Street investment banks more than tripled to $1.6 trillion in 2008 from $500 billion in
2002, an annual rate of increase of more than 20%. (Wall Street Journal, “Fed Debates
New Role: Bubble Fighter,” December 3, 2009).74
From the late 1990s through 2003, about half the repos issued by primary dealers
were overnight loans, but this increased to almost two-thirds by mid-2008.
An added attraction of repo financing
as a source of funds for investment banks is that the SEC does not require them to be
counted as debt when determining whether the investment bank is within required
leverage ratios. Repo loans “are not included in a broker-dealer’s aggregate indebtedness
for purposes of calculating the minimum requirement [for capital]. This means that the
aggregate indebtedness standard does not limit the amount of assets the broker-dealer
could take on through financing transactions” (Sirri 2009).
75
The next largest source of investment bank borrowing, also short-term in nature,
is “security credit by households.” This source constituted about 28% of liabilities in
2007. They are customer cash-balances held in margin accounts at investment banks that
rapidly expand in booms and shrink in busts. Though labeled “household” accounts, they
include securities held by investment banks for hedge funds. Hedge fund data are not
included directly in the flow of funds; rather, their activity ends up in residual sectors. In
this case, the residual sector that includes hedge fund securities is “households.” It would
appear that rapidly rising hedge fund activity was responsible for much of the rapid
In addition,
while the most common forms of repo collateral are Treasury securities and agency
securities, in the recent boom investment banks increasingly used private mortgage-
backed securities as well. While less liquid securities that could lose their value rapidly in
a crisis were used as collateral for about 45% of large investment bank repos in 2005, this
rose to about 65% just before the crash.
73 Data in this paragraph are taken from Adrian, Burke and McAndrews 2009. 74 I am grateful to Jennifer Taub for calling this to my attention. 75 Rajan explains that in bubbles, short-term loans are attractive to banks because “they seem relatively cheap compared with long-term capital,” and are attractive to capital markets because “the costs of illiquidity appear remote” (Rajan 2009a, p. 399).
69
growth in “security credit by households” in the run up to the crisis, a source of funds that
would obviously evaporate in the event of a crisis.76
Lowenstein explains why large financial firms were enthusiastic financiers of
hedge fund speculation during the boom of the late 1990s. This explanation can be
applied as well to the financing of investment bank speculation in the recent boom. This
represents another form of the “destructive competition” discussed above.
Save for the Fed, the only ones who could restrain derivative lending were the banks. But Wall Street never polices itself in good times. The banks' own balance sheets were steadily ballooning; by the late 1990s, Wall Street was leveraged 25 to 1. Awash with liquidity if not quite drowning in it, the banks had to find an outlet for their capital. The most tempting targets were hedge funds. "People were looking at the good side of the world," noted Steve Friedman, a trader and hedge fund manager at Bankers Trust. "I could borrow any amount I wanted and the [interest] rates kept coming down. I'd get calls from banks saying, "Hey, we got another fifty million for you - we got a hundred million!" As banks relentlessly chased the fund business, they silently relaxed their standards, marking down the risk of possible negative news. (Lowenstein 2000, p. 106, emphasis in original)
Lowenstein notes that during booms, it takes "uncommon courage to refuse to lend, for it
would have meant squandering business to the competition." He quotes a top executive
from Merrill Lynch: "the whole market was pressuring us [to lend to hedge funds]. To
suffer the organization telling you that you are losing business - it takes a tremendous
amount of courage to stand up and say, 'I'm not going to do it" (Lowenstein 2000, p.
130).
It is obvious that creditors failed to restrain reckless investment bank expansion in
the boom. Rather, they provided these banks with an ever-increasing supply of cheap,
short-term, precarious credit that could evaporate overnight if trouble erupted in financial
markets. Capital markets did, however, punish investment banks severely in the crisis,
threatening their solvency. As the boom evolved, reliance on overnight finance increased
rapidly, while the collateral used in overnight repos became riskier.77
76 Information in this paragraph was provided by private correspondence with a flow-of-funds staff member.
This made
investment banks increasingly vulnerable to any deterioration in financial markets. “The
77 “Instead of pledging easy-to-trade Treasury securities, banks used highly rated but hard-to-value tranches of securitized pools of assets – including subprime mortgages. When investors lost faith in the ratings on these securities, their values plunged” (Financial Times, “Move to halt bank over-reliance on short-term funds,” September 28, 2009).
70
amount of funding that investment banks were doing through overnight repo agreements
surged between 2004 and 2007; they were rolling over one-quarter of their balance
sheets every day prior to the crisis, making them vulnerable to a sudden loss of
confidence” (The Economist, “Rebuilding the banks,” May 14, 2009, p.12, italics added).
As we have seen, an increasing percent of the collateral used in repo loans were shaky
securitized bonds issued by the bank-created special investment vehicles to finance,
among other things, residential mortgage backed securities. When fear that mortgage-
related securities such as CDOs were worth far less than their face value and that the
monoline insurance companies that guaranteed payment on the highest tranches of CDOs
would never be able to pay those they had insured began to spread, lenders refused to roll
over their repos.78
Government Regulators: The radical deregulation process that began in earnest in the
early 1980s under Ronald Regan in the US and Margaret Thatcher in the UK has been
well chronicled.
Investment banks lost access to up to 50% of their credit sources,
putting both liquidity and solvency at risk.
79
78 See Gorton and Metrick 2009.
Investment banks in particular ended up with extraordinarily loose
regulation. For example, from 1975 to 2003, the US Securities and Exchange
Commission (SEC) limited investment bank leverage to 12 times capital. However, in
2004, under pressure from Goldman Sachs chairman and later Treasury Secretary Henry
Paulson, the SEC, by unanimous vote, raised the acceptable leverage ratio to 40 times
capital and made compliance voluntary (Wall Street Watch, 2009, p. 17). This allowed
large investment banks to generate asset-to-equity ratios in the mid to upper 30s just
before the crisis: Merrill Lynch’s leverage ratio shot from 17 in 2004 to 33 in December
2007. The Chairman of the SEC later acknowledged that the program “was
fundamentally flawed from the beginning, because investment banks could opt in or out
of supervision voluntarily.” Moreover, “nearly one-third of the firms under supervision
had failed to file the required documents” under the voluntary system, and the SEC “had
not adequately reviewed many of the filings” of the firms who did submit documents
(New York Times, “S.E.C. Concedes Oversight Flaws Fueled Collapse,” September 27,
2008). It turned out that the large investment banks were subject to phantom regulation.
79 See, for example, D’Arista 1994 and Tymoigne 2009.
71
In the depths of the recent crisis, with massive government funds allocated to save
the global financial from total collapse, the conventional wisdom was that the
government would be forced to tightly regulate the system, including radically altering
bank compensation schemes, to avoid yet another catastrophe in the future. However, the
Obama administration has shown no inclination to significantly tighten the leash on
financial firms or to reign in the bizarre bonus system. See Crotty 2009 for more
discussion of this issue. It now looks as if the new financial regulatory regime that will
eventually emerge will be too weak to deal with the excesses built into financial markets
and the compensation schemes of the rainmaker financial firm. There is quite likely to be
new serious crises on the horizon.
Market Competition: The explosion of bonus payments coincided with an explosion in
the assets, net revenue and profit of large investment banks. Figure 7 shows that the total
assets of the top five independent investment banks grew from about one trillion dollars
to well over four trillion dollars from 1997 to 2007, while net revenue (gross revenue
minus interest payments) rose by 160% from 1997 to 2006. It seems reasonable to ask
why this period of high growth and of high profit (that would have been much higher if
rainmakers did not receive such large rents), did not trigger a wave of new entrants to the
business. New entrants, either from new firms or from smaller firms not currently in
competition with the giant investment banks that rule the industry, could have lowered
the revenues of the dominant firms, forcing them to lower rainmaker compensation. New
investment banks could take advantage of the chronic excess supply of highly qualified
university graduates who seek entry into the investment banking field but cannot find
jobs there. These potential rainmakers would have worked for lower compensation than
currently employed rainmakers receive, eventually giving the new firms a competitive
advantage. This could not happen overnight because of the apprentice system discussed
in the next section, but it might have taken place over the intermediate run if there were
no strong barriers to prevent it.
Section IV1 b discussed the economies of scale and scope that constrain
competition in many important financial markets. Ironically, the degree of competition in
markets dominated by the largest investment and commercial banks has actually
diminished as a result of the crisis they caused and the bailout that ensued, increasing

72
market control by the surviving giants. The crisis thinned out the ranks of powerful
commercial and investment banks, while increased government support for the remaining
giants solidified their market power. It is now even less likely than it was before the crisis
that the forces of market competition will force large banks to end their destructive
compensation policies.
Today the “top four banks have combined assets of $7.4 trillion, or 56% of the
U.S. banking sector's total. A decade ago, the top four's $2 trillion of assets accounted for
38% of the total” (Wall Street Journal, “Solving Everything but the Problem,” December
16, 2009). S&P predicts that Morgan Stanley and Goldman Sachs will now be more
dominant in investment banking. “While principal risk may decline, they should be able
to take market share in advice, underwriting, trading and prime brokerage owing to less
risk-taking by their peers and fewer competitors in the marketplace” (S&P Industry
Surveys 2009a, p. 3).80 JPMorgan has become Wall Street’s biggest derivative player. Its
contracts were recently 40% of the derivatives held by all banks.81 The top five banks
control 95 percent of the over-the-counter derivative market (Taibbi 2009). The credit
default swap market is now more tightly controlled by the top banks than it was just a
few years ago. Five banks now control half of the global credit default swap market. 82
A New York Times piece argued that “a new order is emerging on Wall Street
after the worst crisis since the Great Depression – one in which just a couple of victors
are starting to tower over the handful of titans that used to dominate the industry.” It
continues: “one may be forgiven for thinking little has changed in banking since 2007,
except a move toward state-sanctioned oligopoly” (Two Giants Emerge from Wall Street
Ruins,” July 16, 2009). A Financial Times article concludes: “The traumatic upheaval
that has roiled Wall Street during the past two years has produced – surprisingly quickly
“This concentration has increased since the beginning of the financial crisis, as several
counterparties have exited the market” (Financial Times, “A stronger infrastructure will
cut CDS vulnerability,” October 20, 2009). Four banks accounted for 60% of worldwide
M&A activity in the first three quarters of 2009 (S&P 2009b).
80 They are clearly wrong about principal risk: Goldman reported surprisingly high profits in the second quarter of 2009 based primarily on successful gambling with Goldman money. 81 Cited in Robert Reich’s blog of July 16, 2009, http://robertreich.blogspot.com/2009/07/goldman-and-jpmorgan-two-winners-when.html. 82 See Financial Times, “The ghosts of AIG prosper,” September 24, 2009.
73
– a widely acknowledged new pecking order in the world of high finance: Goldman
Sachs in trading and JPMorgan Chase in banking, have become the undisputed industry
leaders, with a hand in nearly every deal or trade. Clients can try to avoid these two, but
only at their own peril” (“A new battle looms on Wall Street.” August 4, 2009).
After Bear Stearns failed, Merrill Lynch was absorbed by Bank of America, and it
was clear that the Treasury and the Fed were going to force Lehman Brothers into
bankruptcy, John Mack, CEO of Morgan Stanley said the following:
all of the competitors have basically been eliminated. … Just think about this: Every one percent in equity market share we gain is billion dollars in revenues… I think that once this turmoil abates, and it will settle down, the opportunities going forward are unbelievable. … I believe with all my heart that this firm and our competitor, Goldman, have unique opportunities now.
His chief financial officer observed that: "There is Darwinism here… Weak people are
being taken out. Strong people, I believe, are going to do very, very well." (Sorkin 2009,
p. 377)
When Goldman announced third quarter 2009 profits that were four times larger
than in the preceding year, the Financial Times noted this “underscored its status as one
of the winners from a crisis that eliminated two rivals – Lehman Brothers and Bear
Stearns – and hobbled others such as Citi, Merrill Lynch and UBS” (“Goldman and Citi
highlight divide,” October 16, 2009). A Financial Times editorial warns of rising market
power in investment banking.
As with the wider banking market, the investment banking field has contracted thanks to the crisis. Two large players –Lehman and Bear Stearns- have disappeared, while others have been forced to contract. Fee levels are rising in some areas. The UK insurer Prudential is paying $1bn to underwrite its $20bn rights issue. A few years ago, underwriting fees were closer to 2 per cent than 5 per cent. (“Fat fees, fewer banks,” March 21, 2010)
Consumers also have to deal with banks that are armed with increased market
power. According to the Washington Post, the four largest banks now issue one of every
two mortgages and about two-thirds of credit cards (Banks “Too Big to Fail Have Grown
Even Bigger,” August 28, 2009). The Wall Street Journal reports that more than half of
US residential mortgages are being made by just three large banks. At 52%, their share
was “just over double these banks’ market share in 2005.” In servicing [mortgages], their

74
share is 49%, compared with 22% in 2005 (“Uncle Sam Bets the House on Mortgages,”
September 18, 2009). The rise in market power affects almost all important areas of
finance.83
The Financial Times capital markets editor Gillian Tett argues that “the system is
drifting into a pattern where the most dominant lenders are becoming more dominant
than ever” (Tett 2009). A Financial Times editorial concludes that “the real problem in
finance is a lack of competition, as the consistently high profit margins of banks suggest,”
margins fattened in part by an exceptionally low cost of borrowing by financial
institutions whose debt is guaranteed by the US government (“A mighty financial sector
is less troubling if banks can be allowed to fail safely,” August 28, 2009). Senior
Financial Times columnist Martin Wolf argues that “in some ways, the oligopolistic
banking system that has emerged from the crisis is riskier than the one that went into it”
(Financial Times, “The challenges of managing our post-crisis world,” December 30,
2009).
Moreover, the Fed has assured giant banks that “its benchmark overnight interest
rate would remain at virtually zero, its level for the last year,” and would continue to be
“exceptionally low” for “an extended period” (New York Times, “Fed Will Hold Down
Rates, Citing Tenuous Recovery,” December 16, 2009). In March 2010, the Fed again
made this announcement. This assurance guarantees that dominant firms in oligopolistic
markets will continue to reap exceptionally fat profit margins as the gap between
investment opportunities and their cost of debt capital will continue to remain large.84
83 It is difficult to get coherent up-to-date data on concentration in financial markets. Representative Maurice Hinchy (Democrat, New York) made the following assessment of the current situation.
This gap is helping fuel current bubbles – in commodities, emerging economies and
Asian real estate. “Hedge funds and Wall Street dealing desks view [the Fed’s
commitment to sustain near-zero interest rates] as an open invitation to borrow was much
"Today, just four huge financial institutions hold half the mortgages in America, issue nearly two-thirds of credit cards, and control about 40 percent of all bank deposits in the U.S. In addition, the face value of over-the-counter derivatives at commercial banks has grown to $290 trillion, 95 percent of which are held at just five financial institutions. We cannot allow the security of the American economy to rest in the hands of so few institutions." (in Scheer 2009)
84 The New York Times’s Gretchen Morgenson argued that the “Fed’s rock-bottom interest rate policy bestows huge benefits on banks because it allows them to earn fat profits on the spread between what they pay for their deposits and what they reap from their loans. These margins are especially rich on credit cards, give their current average rate of 14 percent and up” (“This Bailout is a Bargain? Think Again,” April 16, 2010).

75
as they can and invest it in risky assets” (Financial Times, “Is Ben Bernanke descended
from the Bourbons?,” January 8, 2010, p. 9). Firms such as Goldman Sachs that have
been the most aggressive in using cheap Fed money to gamble, have generated the largest
revenues, bonuses and profits since the financial rebound began. “Trading accounts for
more than half the recent revenue of Wall Street firms, according to analysts. This
suggests a continued dependence on volatile investment profits…” (Wall Street Journal,
“Much Talk, But Little Changed on Wall Street,” January 4, 2010). The Bank for
International Settlements has expressed fear that cheap and assured central bank credit is
leading banks into yet another round of dangerous gambling. According to the BIS, “The
prolonged assurance of very cheap and ample funding may encourage excessive risk
taking” (Financial Times, “Sense of unease awaits financiers in Basel,” January 9-10,
2010, p. 5).85
A second implication of the Fed’s commitment to keep rates extremely low is that
it forces investors who either desire or need high returns to shift to riskier, higher-yield
securities. Critics of this policy argue that it merely repeats the error committed by the
Fed after the recession of 2001.
By keeping rates low and, importantly, loudly promising to keep them low, the Greenspan-Bernanke strategy triggered a global search for higher yielding investments. Geniuses on Wall Street met that demand by turning subprime mortgages into ersatz safe short-term securities. The global demand was almost insatiable, and the fees irresistible to Wall Street and mortgage originators. When they ran out of worthy borrowers, these outfits made mortgages to anyone who could sign his or her name because Wall Street was eager for product to sell to
85 This is the latest episode in the Fed’s post early-1990s role as ‘serial bubble blower.’ The Fed kept short-term interest rates extremely low in the period following the recession of 2001. The federal funds rate fell below 2% late that year and remained at 1% in 2003 through the first half of 2004. The Fed committed itself to raising this rate only slowly and steadily whenever it decided to end its super-easy monetary policy, which it did. It began to tighten in mid-2004, but the federal funds rate only surpassed 4% in late 2005. This policy gave institutional speculators the assurance that they could continue to use cheap money to buy risky assets without fear that the Fed might boost rates rapidly and without warning. In its latest policy commitment the Fed has, in effect, promised not to repeat the policy move it made in 1994, when it sharply increased interest rates in an episode that led to large losses in bond markets. Referring to the Fed’s 1994 actions, Sorkin writes that “The chain of events caused Wall Street firms to rack up enormous trading losses, and the damage at Goldman was eventually so severe that it had to push back its plans to go public” (Sorkin 2009, p. 167). The 1994 policy taught an important lesson: if Wall Street speculates too aggressively it may get burned. The Fed’s recent policy, on the other hand, assures Wall Street that they can gamble profitably without fear that the Fed will pull the rug out from under them – a prime example of the creation of moral hazard by the Fed.

76
hungry investors. (Wall Street Journal, “Bernanke's Puzzling Bubble Logic,” January 14, 2010)
By 2009 the Fed was blowing bubbles yet again. Taibbi 2010 described the problem.
But by the end of 2009, the unimaginable was happening: The bubble was re-inflating. A bailout policy that was designed to help us get out from under the bursting of the largest asset bubble in history inadvertently produced exactly the opposite result, as all that government-fueled capital suddenly began flowing into the most dangerous and destructive investments all over again. Wall Street was going for the reload. A lot of this was the government's own fault, of course. By slashing interest rates to zero and flooding the market with money, the Fed was replicating the historic mistake that Alan Greenspan had made not once, but twice, before the tech bubble in the early 1990s and before the housing bubble in the early 2000s. By making sure that traditionally safe investments like CDs and savings accounts earned basically nothing, thanks to rock-bottom interest rates, investors were forced to go elsewhere to search for moneymaking opportunities. Now we're in the same situation all over again, only far worse. Wall Street is flooded with government money, and interest rates that are not just low but flat are pushing investors to seek out more "creative" opportunities. (It's "Greenspan times 10," jokes one hedge-fund trader.) (Taibbi, 2010)
An important conclusion follows from the general discussion in this section.
Rainmakers control investment banks and other important financial institutions and run
them in their own interests and against the interests of the firm and the objective interests
of its shareholders because in modern financial markets with current government
regulation nothing can prevent them from doing so.
Why Doesn’t the Chronic Potential Excess Supply of Rainmakers Eliminate Rents?
The basic answer is the same as that offered in the previous section. The current
bonus-based compensation system that gives rainmakers an exceptionally high percent of
revenue is optimal for them, so they pay themselves high rents it whether or not the firm
could cut compensation and still keep their rainmaker slots filled with talented people. No
one who could restrain them is willing to do so. Perhaps that is all that needs to be said
about it. However, rainmakers cannot publicly defend the system on the basis of naked
self-interest.
The most widely used justification of outsize bonuses by representatives of
financial firms is that there is a chronic excess demand for rainmakers that leads to

77
intense inter-bank competition for their talents. If Merrill Lynch won’t pay a top trader
$40 million a year, it is argued, he will go to another investment bank or to a hedge or
private equity fund who will meet his compensation demand. In 2009, Morgan Stanley
lost money but paid over $14 billion to its employees – a 17% increase over 2008, a year
in which the firm was profitable. Its CFO defended the firm’s rainmaker compensation
policy. “Morgan had to compete for talent: Do I think the industry is overpaid? Yes. Can
we jeopardize the franchise [by lowering compensation], being St Sebastian and getting
pierced by arrows. No. There is no point in being martyrs here” (New York Times,
“Morgan Stanley’s Quarter is Weak. Unlike It’s Pay Pool,” January 21, 2010). "The
market sets these rates, not us," says one head of investment banking in London. "If we
could pay people less, we would. We're all trying to pay as little as possible" (Financial
Times, “Tripped up,” January 25, 2010). In a book on investment banking, Davis 2003
argued that rainmakers are “well known for their ability to ‘walk’ if their perceived
financial needs are not met” (p. 2).
On the other hand, a recent cross-country analysis of top bank executive
compensation by Reuters showed that “the highest paid British, French or Swiss chief
executives… earned approximately 14 percent of what the highest-paid American chief
in the group made in 2008. Clearly, there’s not much risk of losing top executives to
lower-paying jobs abroad” (Lindblom and Shaffer 2010).
We first critically evaluate the chronic excess demand argument, then present an
exploratory alternative explanation of why a potential chronic excess supply of
rainmakers does not eliminate their generous rents.
The rainmakers’ ‘chronic excess demand’ defense of their compensation schemes.
One problem with this defense is that, as noted, the highest paid rainmakers are in
the hedge and private equity fund industries. Thus, any bonus, no matter how large, can
be justified by claiming that the rainmaker will quit and move to another bank or to a
fund if he – and it usually is a he – is not paid the bonus he demands. However, this
cannot be a general defense of high rents because the number of available top-pay
rainmaker jobs in hedge and private equity funds is modest compared to the army of
rainmakers in investment and commercial banks. Only a small percent of bank

78
rainmakers could possibly exercise this option, while a massive influx of rainmakers out
of investment banks could sharply lower hedge and private equity funds compensation
levels.
Another major problem is that the defense cannot explain the practice of paying
an outsize proportion of firm net revenues to rainmakers in periods when the industry is
shedding jobs. As we have seen, exorbitant bonuses were given to rainmakers from 2007
through the first half of 2009. Moreover, increasing shares of the bonuses were in the
form of retention or guaranteed bonuses rather than firm-based or individual performance
related bonuses, which is inconsistent with the justification for the bonus system. Yet we
know there was no excess demand for rainmakers because the financial sector, including
hedge and private equity funds, was shedding jobs, not hiring over most of this period.
“Analysts estimate that as many as 25,000 Wall Street traders lost their jobs in the year
ending March 31, 2009, or about 10% of the financial-services job losses reported by the
federal Bureau of Labor Statistics” (Wall Street Journal, “Wall Street's B-List Firms
Trade on Bigger Rivals' Woes,” August 11, 2009). “Over all, head counts at the 12
biggest global investment banks were cut, on average, by about a fifth in 2008,” so we
know there was an excess supply of rainmakers, yet the argument that we can’t cut
bonuses because other firms will steal our staff continued to be offered (New York Times,
April 12, 2009, “Crisis Altering Wall Street as Big Banks Lose Top Talent”). A Wall
Street Journal article summarized the problem with this defense nicely.
There is no amount of shame that will deter the bonus class from pressing their demand, no scandal that will put it off limits, no public outrage over AIG or Enron or really expensive Merrill Lynch trash cans that will silence the managers' monotonous warble: "Attract and retain top talent!" And there is no possible objection to inflated compensation you can make that will not be instantly maligned as senseless populism… It can't be that hard to "retain top talent" when New York is awash with unemployed bankers and traders who are no doubt anxious for a chance to prove their own brilliance. (“Let's Move Their Cheese,” May 6, 2009).
Ever resilient, supporters of current compensation schemes argue that large
bonuses are justified in bad years, when the industry is shedding rainmakers. First, they
argue that a new boom will inevitably develop when the crisis is over, and since no one
knows which future market segments will be most profitable - where are rational
expectations when you need them? - it is prudent to pay large bonuses to retain all

79
rainmakers to make sure the firm is well placed to profit when the boom arrives, no
matter what its form. This argument anticipates that there will be an excess demand for
some kinds of rainmakers in the next boom, but since its character is uncertain, a kind of
rainmaker portfolio diversification strategy is prudent. A Financial Times piece discussed
the argument.
Uncertainty over the economic outlook also makes it hard for banks to predict which business areas will be active this year, and therefore which staff they need to keep happy. … “The major risk to our business is people. For each vacant seat there are probably only five people out there who could do it. We’re hoping [rival] banks screw up and underpay this year, which would make it easier for us to hire,” says the head of commodities at one European investment bank. … [A senior executive argues] “It is a very competitive market and we don’t believe we can change the system.” This is scant consolation to shareholders in investment banks, who are effectively subsidizing the payout. (“Banks’ losses fail to damp bonus season goodwill,” January 15, 2008)
The uncertainty defense is illogical as well as self-serving. As a general decision-
making principle it would lead every firm – financial and nonfinancial - to invest in every
business and every product that might conceivably be profitable and employ every type
of worker who might or might not be needed in the future. It is as if no hard choices have
to be made in conditions of risk or uncertainty. This is not the way to maximize long-
term profits because it leads to expensive chronic overstocking of excess rainmakers
Another defense is the argument that in bad years, rainmakers working in market
segments that were profitable should not be punished by smaller bonuses for the low
profits or losses generated by those in other divisions. This would be more compelling
were it not for the fact that in high profit years bonuses generally rise for everyone in the
firm regardless of how their division performs. The same people who demand high
bonuses when the firm losses money because their unit performed well, demand high
bonuses when the firm makes lots of money regardless of how their unit did. For
example, in March 2008, when AIG’s directors’ Compensation Committee considered
how much to pay CEO Richard Sullivan, he “urged them to exclude the $5 billion in
losses, which were mostly from AIG’s Financial Products Division. You know, just
ignore them. The board agreed and rewarded Sullivan with a cool $5 billion in cash. Pay
for performance no longer applied” (Prins 2009, p. 161). This defense also suffers from
the problem that in many crises, including the current one, massive losses take place in
80
divisions with a small numbers of employees. Paying all the other rainmakers high
bonuses will greatly reduce profit or magnify losses. In fact, many investment bank sub-
divisions did well in 2007 and therefore demanded and received large bonuses.
“However, huge losses from a tiny number of staff – Merrill blew about $20 billion just
on mortgage-related products – more than offset the profits from other successes. …
[Banks] are unable to net that off by docking the vast salaries of the few who cause
havoc. So compensation costs soar as a percent of revenue and investors are left to pick
up the pieces” (Financial Times, “On Wall Street: Thorny subject of big bonuses in tough
times,” January 18, 2008).86
AIG is a wonderful example of the problem. Its Financial Products division,
which gambled on credit default swaps, had fewer than 400 employees in a firm with
120,000 workers. AIG Financial Products was a big contributor to AIG’s rising profits in
the boom, but in 2008 the unit lost $40.5 billion. Though the US government owns 80%
of AIG’s shares and invested $180 billion in the corporation, AIG nevertheless paid the
377 members of the division a total of $220 million in bonuses for 2008, an average of
over $500,000 per employee. Seven employees received more than $3 million each (Wall
Street Journal, “AIG Faces Growing Wrath Over Payments,” March 16, 2009). Many of
these were retention bonuses awarded to prevent key employees in the division that
destroyed the firm from quitting, a bizarre outcome that generated enormous popular
revulsion. Events such as these led the Financial Stability Forum to propose as a core
compensation principle that “compensation systems should link the size of the bonus pool
to the overall performance of the firm” (2009, p. 3, emphasis added).
87
While the ‘potential’ excess supply of rainmakers is huge, the ‘effective’ excess supply
may be too small to substantially reduce rents in the boom.
86 Bonus-setting practices differ to some degree across firms. Many rely heavily on the performance of the rainmaker's division and some emphasize firm performance as well. I know of no data that would allow us to be more specific about the industry's practice in this regard. 87 Joseph Cassano was the man who led AIG's FP division's conversion into a giant hedge fund that insured other firm's risky structured products against default through credit default swaps with virtually no collateral to compensate for the risk involved. When his empire began to show massive losses, AIG replaced him as division head, but retained him as a consultant with a fee of one million dollars a month (Sorkin 2009, p. 162).
81
As shown by Philippon and Reshef 2009, the rainmaker pay premium has been
rising since the early 1980s and the demand for financial firm rainmakers has certainly
risen rapidly over this period, so there would appear to be some empirical foundation for
the chronic excess demand thesis. However, at the same time generations of students
from the most prestigious as well as non-elite colleges and universities have tried to
obtain jobs with a career path leading to rainmaker status in big investment banks and
other financial firms. These students majored in economics, finance, business, math,
physics, engineering and the social sciences, and many had MBAs and Ph. Ds. The Katz-
Goldin study of Harvard graduates showed that the share entering banking and finance
rose from less than 4% in the 1960s to 23% in recent years. But competition for these
jobs in the long-term financial boom from the early 1980s through 2007 was fierce. The
percentage of Harvard graduates who wanted to become investment bankers but were
prevented from doing so by the chronic excess supply of candidates must have been
substantial. Oyer’s study shows the number of Stanford University MBAs who wanted to
became investment bankers was always far greater than the number of jobs on offer.
Kaplan and Rauh 2007 estimate there were about 10,000 rainmakers in large investment
banks in 2004, yet over the years of financial sector growth there must have been at least
hundreds of thousands of qualified students who aspired to be investment bank
rainmakers but could not obtain an appropriate starting position. How can it possibly be
that this exploding supply of job candidates with the desire and the qualifications to
become future rainmakers did not eliminate or at least sharply reduce the rents
associated with rainmaker positions?
The most important answer is that the people who run these firms have no interest
in lowering rainmaker pay even though a chronic potential excess supply would allow
them to do so because this would lower their own pay. Under current conditions, no one
can make them do it. However, above and beyond this, there are two barriers to entry that
can help preserve rainmaker rents in the face of a large potential excess supply of
rainmakers. I have not seen these barriers discussed in the literature.
First, there appears to be an “apprenticeship” process in investment banks.
Investment banks hire more new employees then they need whenever their business is
growing. After an initial trial period, those who do not impress their superiors are fired.

82
Morrison and Williams 2004 stress the “up-or-out” character of investment banking;
many are hired who fail to survive this trial period. Goldman Sachs is perhaps the most
vigorous practitioner of the up-or-out approach. Those who do well are retained by the
firm and assigned to work with more experienced employees. If their progress is
sufficiently impressive, they end up apprenticed to firm rainmakers.88
Morrison and Wilhelm 2004 emphasize the importance of tacit knowledge and
apprentice relations in investment banks during their partnership phase.
The ostensible
purpose of the long apprenticeship is not only to allow newer employees to learn their
trades, but also to convince current rainmakers that they can be trusted to accept
important responsibilities in which they can put large amounts of bank capital and
therefore rainmaker compensation at risk. For example, apprentice traders have to
demonstrate over a long period that they can be trusted to employ ever larger amounts of
the firm’s capital without generating large losses. Keep in mind that there is long list of
rogue traders who ended up severely injuring the firm and its rainmakers. Nick Leeson, a
derivatives trader for Barings Bank, the United Kingdom’s oldest investment bank, was
responsible for a loss of over 200 million pounds in 1994. This loss led to the collapse of
the bank. Aspiring M&A rainmakers have to work their way into a group or team of top
firm operatives, then convince the team members that they can eventually generate large
volumes of M&A fees while keeping the firm’s clients happy.
Tacit human capital…covers forms of knowledge and skills which do not easily lend themselves to codification or to arms-length exchange. Such skills include a wide range of talents such as advising clients, building relationships, reading market signals [a crucial skill for traders] and negotiating M&A deals which are essential to investment banking. The skills can only be learnt on the job. While an MBA program can furnish a student with technical skills, it cannot teach them how to become an investment banker. Tacit human capital is valuable to clients, but by its very nature it is hard to measure and virtually impossible to contract upon. This leads to a fundamental learning problem. Only a skilled agent can transfer his or her skills to a new hire, typically through a mentoring relationship” (p. 2)89
88 Nomi Prins says that when she was at Goldman “there was a ritualistic mentee-mentor part of the job. As a managing director, you were assigned someone to mentor” (Prins 2009, p. 85).
89 They also argue that the need for an apprenticeship system ended when the big wholesale investment banks went public in the 1980s and 1990s so they could raise vast amounts of capital. The new capital was needed to acquire the information processing technology required to support complex financial engineering and automated trading schemes, and to finance the huge proprietary trading operations that became their leading source of profit in the recent boom. The “increasing emphasis within wholesale investment banks

83
The conclusion from this line of argument is that the only rainmaker candidates
firms will consider fully qualified for these important jobs are those already working in
financial markets at rainmaker or near- rainmaker positions – no matter how many
hundreds of thousands of potential rainmakers may be available to them. An article
referenced above quotes an executive who said that “for each vacant seat there are
probably only five people out there who could do it” (Financial Times, Banks’ losses fail
to damp bonus season goodwill,” January 15, 2008). When markets are expanding
rapidly in a boom, there will therefore be substantial competition for these five. Thus, in
spite of the large chronic notional or potential excess supply of rainmakers, there may
never be a substantial effective excess supply of rainmakers available to bid away the
rents in the boom.
It is important to understand that this apprentice system, though a natural
institutional component of wholesale investment banking, is not a technologically
determined system. The peculiar properties of the rainmaker firm influence the way the
apprentice system works and help turn it into a means to regulate their compensation
pools. The firm’s current rainmakers will not want to allow more new people through the
apprenticeship process if that means their own bonuses will be reduced. Current
rainmakers have a material interest in defending their own ability to generate the revenue
that constitutes their claim on the firm’s bonus pool. New traders compete with existing
traders for access to the firm’s limited capital base. A new M&A team may erode the
revenues of one with greater seniority. Strategic considerations on the part of the existing
rainmakers will strongly influence the rate at which new members are accepted into and
rise within their ranks.
Conditions of rapid growth in the market are obviously most conducive to
expansion of the rainmaker ranks because the addition of new rainmakers may actually
improve the bonus prospects of existing rainmakers by protecting the firm’s competitive
upon financial engineering increased the codifiability of relevant human capital…”; the “codification and dissemination of what was previously tacit knowledge…” eliminated the need for mentoring (p. 28). This caused the costs of market making to fall and made “trading expertise replicable” (P. 28). The trouble with this argument is that it is incompatible with the existence of huge compensation premiums for traders. Why would an investment bank interested in maximizing profit pay bonuses of $50 million and more to traders if anyone with the right training could do the job once it was substantially mechanized or ‘codified’?

84
position. Since the apprentice system sharply constrains the supply of new rainmakers
available to the firm in an expansion, current rainmakers are able to demand higher
compensation under the believable threat that they will jump ship to a competitor.
Moreover, the addition of especially talented new rainmakers who will add more to the
bonus pool than they withdraw from it is likely to be acceptable to existing rainmakers,
unless they believe the added competition involved will significantly reduce their share of
the pool. (Competition for bonuses among rainmakers is cut-throat, with threats of
resignation common to reinforce claims on the pool.) And existing rainmakers may be
able to exploit new apprentices, then fire them before they attain full rainmaker status, or
appropriate their contributions to the compensation pool.
Seasoned rainmakers control the flow of apprentices into the firm. To slow it
down, they can simply refuse to pass on the tricks of the trade as quickly or effectively as
possible or slow the rate at which the firm’s capital is made available to new apprentices.
In other words, their bonuses have to be protected in order for the apprentice system to
function most effectively. A firm whose goal is to maximize shareholder returns might
seek to build up a larger group of rainmakers working for smaller bonuses than would a
rainmaker firm whose objective is to maximize bonuses per existing rainmaker.
The apprentice system would not necessarily constitute an insuperable barrier to
the reduction of rents in the long run if the top executives of large banks were determined
to lower bonuses. The formulas used to calculate bonuses for various rainmakers are
conventional; they could be changed if firms really wanted to change them. For example,
firms could use the large “reserve army” of unemployed rainmakers created by the crisis
to ratchet down bonus formulas to lower bonuses at any particular level of net revenues
or to make bonuses a reasonable percentage of profit rather than net revenue. This would
protect shareholders in the crisis and reduce bonuses and raise profit and over succeeding
cycles. But we have seen that even when markets crash, firms do not take advantage of
the substantial excess supply of rainmakers created through job loss to cut bonuses
aggressively. This is because these are not traditional neoclassical or Chandlerian firms
seeking, respectively, shareholder value or the reproduction and growth of the firm itself
in the long run. These firms are run by rainmakers for rainmakers: they seek maximum
rainmaker compensation, not minimum cost.
85
Second, an ‘old boy’ informal hiring policy constitutes a barrier to entry. As
Robert Frank and Philip Cook argue: “The nation’s elite educational institutions have
become, in effect, the gatekeepers for society’s most sought-after jobs” (cited in Folbre
2010, p. 86). Rainmakers at top financial firms focus their recruiting on a relatively small
set of prestigious private colleges and universities from which the current rainmakers
graduated and to which they typically remain loyal. A friend who was a rainmaker for
one of the country’s largest banks told me that he was the only public university graduate
among more than three hundred people with managing director status in his division. In
spite of the occasional token hire from a state school, rainmakers recruit primarily from
their alma maters or schools with equivalent prestige, a practice that substantially limits
the potential supply of fast-track rainmaker candidates. This sharply constrained pool
must then be funneled through the apprenticeship process described above, further
reducing the effective supply of potential rainmakers, thereby helping to sustain the size
of their rents.
How does the ‘theft’ of joint rainmaker-bank capital affect rainmaker compensation?
There is a source of high rainmaker compensation not yet discussed. Oyer
observes that Stanford MBAs who are employed by investment banks receive “invaluable
on-the-job training” and build “task-specific human capital” during their careers. The
idea that rainmakers accumulate large amounts of task-specific capital introduces the
question of who gets the benefits from the added psuedo-productivity associated with this
capital. A substantial part of the difference could end up with the rainmaker. Consider
the concept of the M&A ‘team.’ The team is usually led by a particularly successful
M&A operative with substantial experience. The leader and the team will have built up
an extensive network of outside business contacts who trust them enough to do large
deals with them. Since the winning of trust takes substantial time and cultivation, it is a
barrier to the entry of new teams. It used to be said that the leader’s greatest asset was his
‘rolodex’ or list of client phone numbers. An interesting question is: who ‘owns’ the
‘capital’ or assets represented by this client network - the firm or the team leader?
It is not possible to give a general answer, but a substantial part of this capital,
typically belongs to the team leader and his closest lieutenants. If they leave the firm,
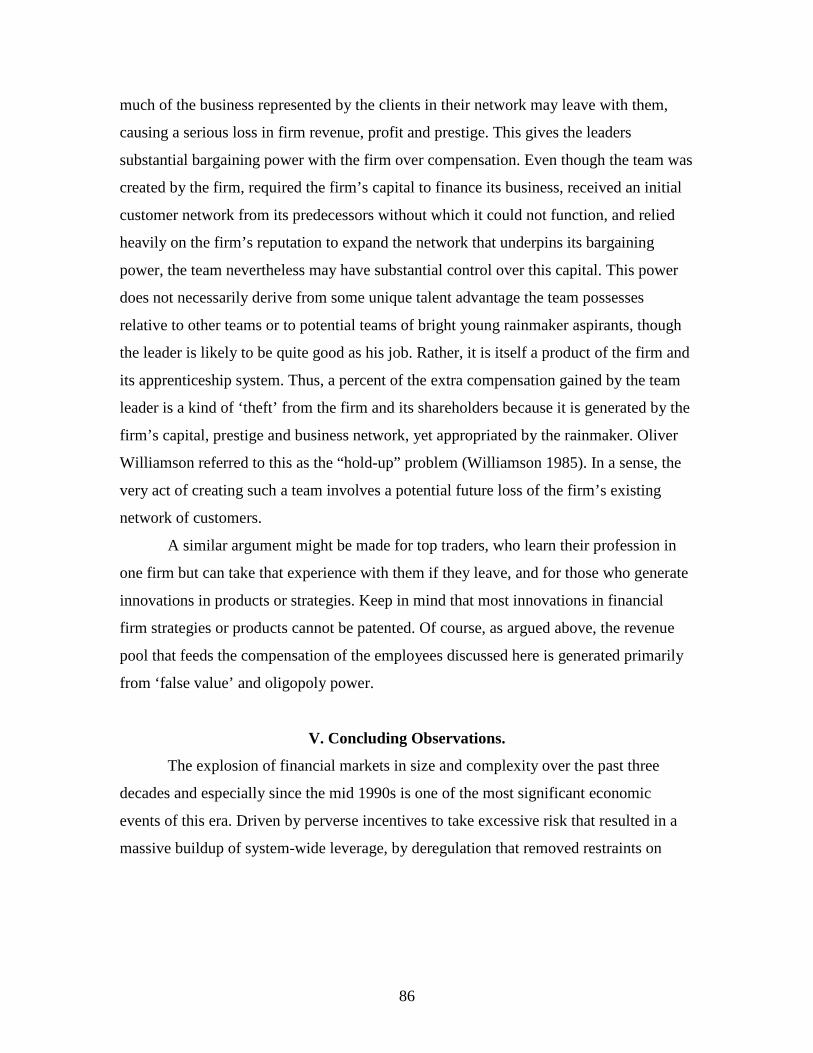
86
much of the business represented by the clients in their network may leave with them,
causing a serious loss in firm revenue, profit and prestige. This gives the leaders
substantial bargaining power with the firm over compensation. Even though the team was
created by the firm, required the firm’s capital to finance its business, received an initial
customer network from its predecessors without which it could not function, and relied
heavily on the firm’s reputation to expand the network that underpins its bargaining
power, the team nevertheless may have substantial control over this capital. This power
does not necessarily derive from some unique talent advantage the team possesses
relative to other teams or to potential teams of bright young rainmaker aspirants, though
the leader is likely to be quite good as his job. Rather, it is itself a product of the firm and
its apprenticeship system. Thus, a percent of the extra compensation gained by the team
leader is a kind of ‘theft’ from the firm and its shareholders because it is generated by the
firm’s capital, prestige and business network, yet appropriated by the rainmaker. Oliver
Williamson referred to this as the “hold-up” problem (Williamson 1985). In a sense, the
very act of creating such a team involves a potential future loss of the firm’s existing
network of customers.
A similar argument might be made for top traders, who learn their profession in
one firm but can take that experience with them if they leave, and for those who generate
innovations in products or strategies. Keep in mind that most innovations in financial
firm strategies or products cannot be patented. Of course, as argued above, the revenue
pool that feeds the compensation of the employees discussed here is generated primarily
from ‘false value’ and oligopoly power.
V. Concluding Observations.
The explosion of financial markets in size and complexity over the past three
decades and especially since the mid 1990s is one of the most significant economic
events of this era. Driven by perverse incentives to take excessive risk that resulted in a
massive buildup of system-wide leverage, by deregulation that removed restraints on

87
excessive risk-taking90
No doubt there were some positive contributions associated with some
dimensions of this long financial boom. However, on balance the economic and financial
effects of the accelerating expansion of financial markets appears to have been severely
negative. Jean-Claude Trichet, President of the European Central Bank, gave an overall
assessment in 2009 of the effects of the evolution of financial markets. “Over time, the
creation and assumption of financial risk become the core activity of financial markets.
… At some point, the financial system seemed to be no longer there to primarily to hedge
existing risks, but more and more to create its own” (Trichet 2009, emphasis in original).
The rise of finance-led capitalism led to excessive indebtedness among the poor and,
especially, the working and middle classes of most countries. This raised the rate of
economic growth for awhile, but will restrict aggregate demand in the intermediate future
because these debts have to be repaid in a slower growth era. It badly misallocated real
resources. Far too much credit was used to fund the technology and internet booms of the
late 1990s, the mortgage explosion of the 2000s, financial speculation and the financial
sector itself. The trillions of dollars in losses suffered by financial firms is evidence of
misallocation.
, by an impressive array of financial innovations (many of which
turned out to be dysfunctional and value destroying), and by the global integration of
national financial markets, the economic influence of financial activity and the political
influence of financial firms reached heights not seen at least since the 1920s.
91
90 The total abdication at all levels of government from its responsibility to keep the economy and society safe from powerful yet dysfunctional financial markets was shameful. Nomi Prins summed up this problem as follows:
Far too much income was funneled away from ordinary citizens to
If anyone in the Oval Office, in Congress, at the Federal Reserve, in the Treasury Department, or in the offices of any regulatory agency had done any serious preventative work, had exposed the murky Wall Street practices before they blew up in our collective faces, had contained the reckless trading and borrowing activities, or had rendered financial firms smaller and more transparent - if any of these people had cared - the crash could have been avoided, or at least would have been less severe. Millions of jobs and trillions of dollars would have been spared. Billions of dollars of bonuses wouldn’t have rewarded the mostly legal but ridiculously risky practices that had such devastating effects. (Prins 2009, p. 2)
91 Benjamin Friedman has stressed the inefficiency of our current financial system. “The discussion of the costs associated with our financial system has mostly focused on the paper value of its recent mistakes and what taxpayers have had to put up to supply first aid. The estimated $4,000bn of losses in US mortgage-related securities are just the surface of the story. Beneath those losses are real economic costs due to wasted resources: mortgage mis-pricing led the US to build far too many houses. Similar pricing errors in the telecoms bubble a decade ago led to millions of miles of unused fiber-optic cable being laid. The misused resources and the output foregone due to the recession are still part of the calculation of how

88
financial market rainmakers as well as to top executives at large nonfinancial firms who
received much of their income as stock options and built up impressive financial
portfolios. It was a major contributor to the rapid rise of inequality of the period. It drove
the global economy into a deep and prolonged recession costing many trillions of dollars.
Andrew Haldane, Executive Director for Financial Stability of the Bank of England,
estimates that the present value of expected future economic losses due to the crisis is
“between $60 trillion and $200 trillion for the world economy” (Haldane 2010, p. 4).92
Virtually all informed analysts who do not represent the interests of financial
firms – and even many who do - agree that the perverse incentive schemes under which
the most important employees of large financial institutions operated were a major
contributor to the financial crisis. I have presented evidence that rainmaker bonuses were
shockingly large, even after the markets crashed, and that there is good reason to believe
they are unearned rents rather than a reward for genuine contributions to long-term
economic growth. Not even the severe financial crisis or subsequent massive government
intervention to rescue these firms (and thus preserve the jobs of most of their rainmakers)
has affected the practice of paying gigantic bonuses to armies of rainmakers no matter
how their firms perform. Most experienced political observers see little chance that the
Government deficits caused by the crisis, caused by falling tax receipts and the need to
stimulate the economy to prevent economic collapse, are leading to massive increases in
public indebtedness that will restrict the ability of governments to pursue full
employment and operate in the public interest for many years or even decades to come. It
strongly influenced the activities of the IMF and World Bank in ways that hurt the
developing world. It gave excessive political influence to giant financial institutions who
are now using that influence to prevent the creation of an effective new regulatory regime
or of effective constraints on rainmaker pay. Former IMF chief economist Simon Johnson
and coauthor James Kwak argue that US government policy toward financial markets is
now dictated by a “financial oligarchy,” just as is the case in many Third World countries
(Johnson and Kwak 2010).
(in)efficient our financial system is” (Financial Times, Overmighty finance levels a tithe on growth, August 26, 2009). 92 Haldane argues that if “a crisis occurs every 20 years, the systemic levy [on financial firms] needed to recoup this cost would be in excess of $1.5 trillion per year” (Haldane 2010, p. 4).

89
perverse compensation schemes that helped cause the recent crisis will be curbed by
legislation. Standard and Poors stated this conclusion as follows:
We think regulators may talk a tough line, but will find it difficult to establish radical changes to current compensation structures. Too many firms lobbying with too much money will likely convince these regulators that it will be too difficult to attract and retain talent with such curbs, and US lawmakers will not want to put domestic firms on poor competitive footing with their global peers.” (S&P 2009b, p. 4)93
Many have written about the absurdity of rainmaker compensation schemes in the
business press. But I found only one academic paper (Meunier 2007) that even raises the
question of how it is that giant firms structured so that their top employees enrich
themselves while destroying shareholder value and inevitably endangering the very
existence of their firms are allowed to function without meaningful interference by any
individual, institution, market force or regulatory authority.
The paper offers tentative or preliminary answers to key questions about the
rainmaker financial firm. It argues that the huge revenues generated by rainmaker firms
in the boom that are the source of their bonuses are created primarily by ‘false value’ –
incomes generated by transitory boom euphoria and excessive risk-taking, not by long-
term contributions to market value - and secondarily by oligopolistic market power. It
provides reasoned criticism of self-serving arguments used to defend rainmaker
compensation schemes and suggests mechanisms through which the enormous potential
excess supply of rainmakers is prevented from creating effective downward pressure on
rainmaker rents. The goal of the paper is to make some initial progress toward answering
the crucial question of how the sole objective of most of the largest firms in what has
become the most powerful industry in the country and perhaps the world can be to enrich
their most influential employees with utter disregard for the disasters this policy entails
for shareholders, firms and the broader economy. Understanding the rainmaker firm is an
essential step in the process of turning financial firms and financial markets into
institutions that will help improve the economic life of the large majority of the
population.
93 Note the self-serving character of the final argument. As long as one nation involved in global finance refuses to radically alter perverse incentives, no country has to change.

90
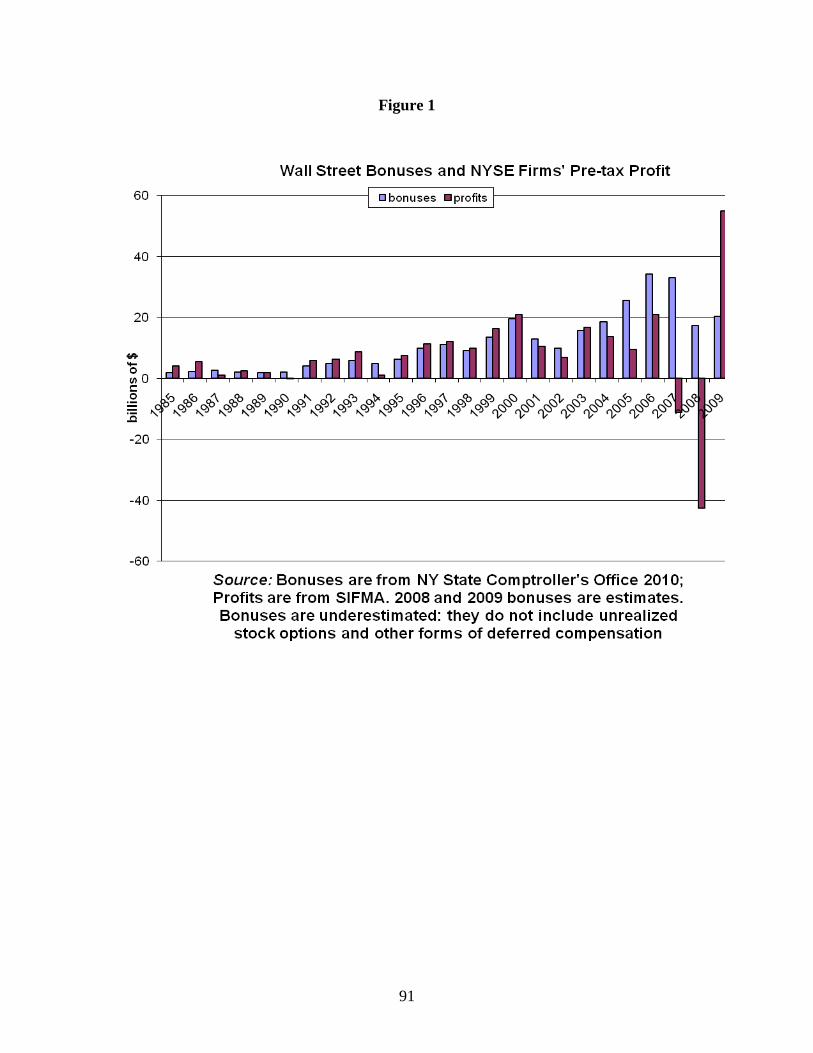
91
Figure 1

92
Figure 2
Bonuses and Net Earnings for the Big Five Independent Investment Banks
Bear Stearns estimated bonuses and net earnings
0
500
1,000
1,500
2,000
2,500
3,000
1985 1986 1987 1988 1989 1990 1991 1992 1993 1994 1995 1996 1997 1998 1999 2000 2001 2002 2003 2004 2005 2006 2007 2008
Source: calculations by author based on data from Compustat. Bonuses are assumed to be 60% of total compensation. Data for 1988 are not availible.
mill
ions
of $
Bonuses Net Earnings
Goldman Sachs estimated bonuses and net earnings
0
2,000
4,000
6,000
8,000
10,000
12,000
14,000
1997 1998 1999 2000 2001 2002 2003 2004 2005 2006 2007 2008
Source: calculations by author based on data from Compustat. Bonuses are assumed to be 60% of total compensation. Data are availible only since 1997.
mill
ions
of $
Bonuses Net Earnings
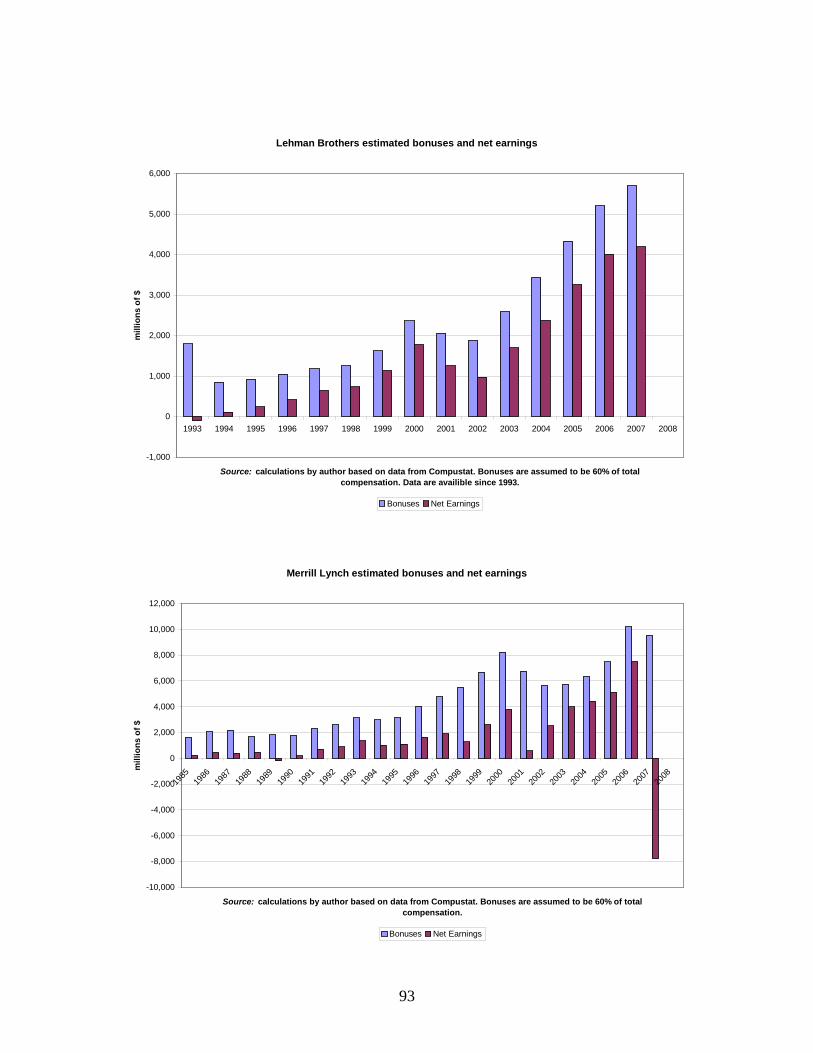
93
Lehman Brothers estimated bonuses and net earnings
-1,000
0
1,000
2,000
3,000
4,000
5,000
6,000
1993 1994 1995 1996 1997 1998 1999 2000 2001 2002 2003 2004 2005 2006 2007 2008
Source: calculations by author based on data from Compustat. Bonuses are assumed to be 60% of total compensation. Data are availible since 1993.
mill
ions
of $
Bonuses Net Earnings
Merrill Lynch estimated bonuses and net earnings
-10,000
-8,000
-6,000
-4,000
-2,000
0
2,000
4,000
6,000
8,000
10,000
12,000
1985
1986
1987
1988
1989
1990
1991
1992
1993
1994
1995
1996
1997
1998
1999
2000
2001
2002
2003
2004
2005
2006
2007
2008
Source: calculations by author based on data from Compustat. Bonuses are assumed to be 60% of total compensation.
mill
ions
of $
Bonuses Net Earnings

94
Morgan Stanley estimated bonuses and net earnings
0
2,000
4,000
6,000
8,000
10,000
12,000
1985 1986 1987 1988 1989 1990 1991 1992 1993 1994 1995 1996 1997 1998 1999 2000 2001 2002 2003 2004 2005 2006 2007 2008
Source: calculations by author based on data from Compustat. Bonuses are assumed to be 60% of total compensation.
mill
ions
of $
Bonuses Net Earnings

95
Figure 3
Top 5 Investment Banks: total cumulative NOMINAL returns, under the assumption of shares being bought in the year indicated and held untill 03/25/09
0
1
2
3
4
5
6
7
Source: calculations by author based on Compustat Database. Returns are calculated as a simple average of cumulative returns for individual investment banks. Monthly returns are averaged to obtain annual data.
mul
tiple
s of
val
ue o
f ini
tial i
nves
tmen
t
actual value 5.02 5.87 3.58 2.80 2.02 1.82 1.29 0.97 0.63 0.44 0.50 0.43 0.48 0.57 0.52 0.44 0.39 0.29 0.24 0.37
one 1 1 1 1 1 1 1 1 1 1 1 1 1 1 1 1 1 1 1 1
1989 1990 1991 1992 1993 1994 1995 1996 1997 1998 1999 2000 2001 2002 2003 2004 2005 2006 2007 2008
Top 5 Investment Banks: total cumulative REAL returns, under the assumption of shares being bought in the year indicated and held untill 03/25/09
0.0
0.5
1.0
1.5
2.0
2.5
3.0
3.5
4.0
Source: calculations by author based on Compustat Database. Returns are calculated as a simple average of cumulative returns for individual investment banks. Monthly returns are averaged to obtain annual data.
mul
tiple
s of
val
ue o
f ini
tial i
nves
tmen
t
actual value 2.89 3.56 2.26 1.82 1.36 1.26 0.92 0.71 0.47 0.33 0.39 0.34 0.40 0.47 0.45 0.38 0.35 0.27 0.23 0.37
one 1 1 1 1 1 1 1 1 1 1 1 1 1 1 1 1 1 1 1 1
1989 1990 1991 1992 1993 1994 1995 1996 1997 1998 1999 2000 2001 2002 2003 2004 2005 2006 2007 2008
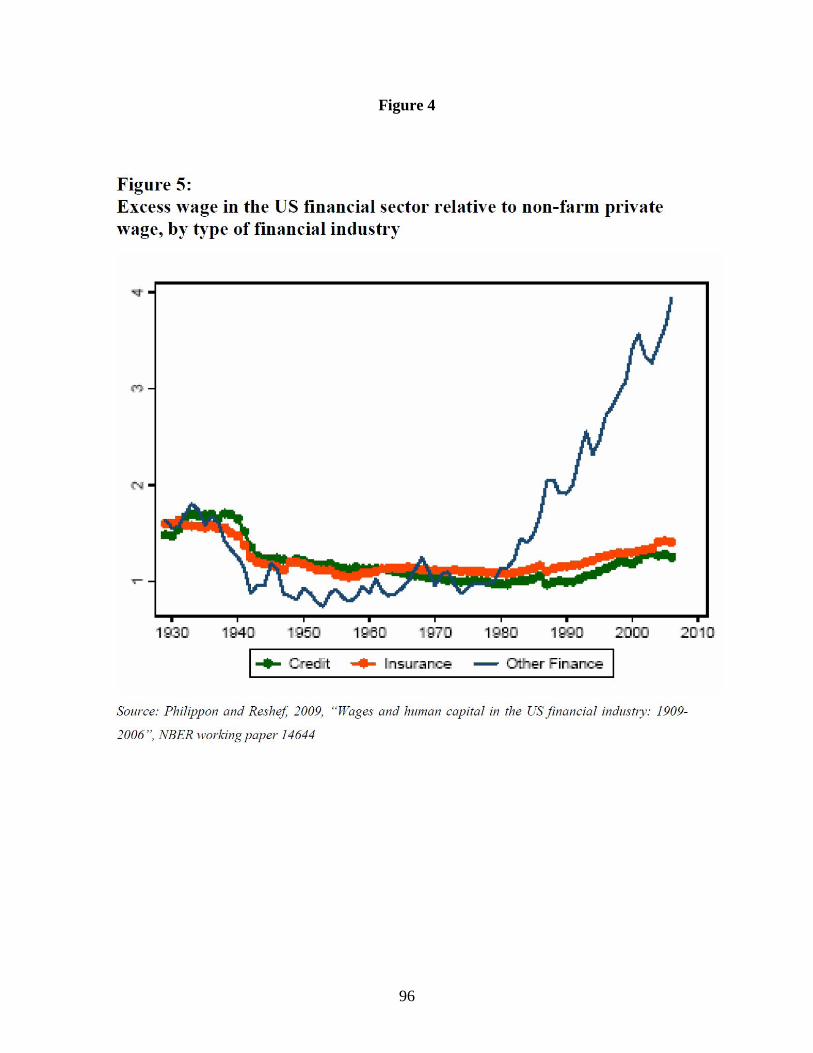
96
Figure 4

97
Figure 5
Share of total assets held by top 3, 5, and 7 commercial banks (USA, 1992-2009)
0
5
10
15
20
25
30
35
40
45
50
200920082007200620052004200320022001200019991998199719961995199419931992
Source: Calculations by author based on FDIC Statistics on Depository Institutions (SDI) (for data on individual institutions), Historical Statistics on Banking (for total assets and deposits), and Statistics on Banking (for
aggregate June 2009 data)
%
top 3 top 5 top 7 Share of total deposits held by top 3, 5, and 7 commercial banks (USA, 1992-2009)
0
5
10
15
20
25
30
35
40
45
50
200920082007200620052004200320022001200019991998199719961995199419931992
Source: Calculations by author based on FDIC Statistics on Depository Institutions (SDI) (for data on individual institutions), Historical Statistics on Banking (for total assets and deposits), and Statistics on Banking (for
aggregate June 2009 data).
%
top 3 top 5 top 7

98
Figure 6
Share of total assets held by top 5 US investment banks in total assets held by the US securities industry (2001-2007)
30
35
40
45
50
55
60
65
70
2001 2002 2003 2004 2005 2006 2007 Source: calculations by author based on Compustat Database (for individual banks) and U.S. Securities
Industry and Financial Markets Association (for total securities industry assets)
%

99
Figure 7
Total assets of top 5 investment banks, 1993-2007
0
500
1,000
1,500
2,000
2,500
3,000
3,500
4,000
4,500
1993 1994 1995 1996 1997 1998 1999 2000 2001 2002 2003 2004 2005 2006 2007
Source: Compustat Database.
billi
ons
of $
MER MS BSC.1 LEHMQ GS
Net revenue of top 5 investment banks, 1993-2007
0
20
40
60
80
100
120
140
1993 1994 1995 1996 1997 1998 1999 2000 2001 2002 2003 2004 2005 2006 2007
Source: calculations by author based on Compustat Database. Net revenue is calculated as a difference between total revenue and total interest and related expenses.
billi
ons
of $
MER MS LEHMQ BSC.1 GS

100
REFERENCES
Adrian, T., C. Burke and J. McAndrews (2009). “The Federal Reserve’s Primary Dealer Credit Facility,” Federal Reserve Bank of New York, “Current Issues in Economics and Finance," Vol. 15, No, 4, August. Alessandri, Piergiorgio and Andrew Haldane (2009). “Banking on the State.” Presented at the Federal Reserve Bank of Chicago conference on “The International Financil Crisis,” September 25. Amromin, Gene and Steven Sharpe (2008). “Expectations of Risk and Return Among Household Investors,” Federal Reserve Board of Governors, Finance and Economics Discussion Series No. 17. Arlidge, John (2009). Sunday Times, “I’m doing ‘God’s Work’. Meet Mr Goldman Sachs,” November 8. Available at: http://www.timesonline.co.uk/tol/news/world/us_and_americas/article6907681.ece. Barker, Thorold (2009). Wall Street Journal, “Morgan Stanley’s Pay Plight,” July 23. Bebchuk, Lucien and Jesse Fried (2004). Pay Without Performance: The Unfulfilled Promise of Executive Compensation. Cambridge Mass: Harvard University Press. Bebchuk, Lucian (2009). Fixing Incentives. Available at: http://works.bepress.com/cgi/viewcontent.cgi?article=1000&context=bebchuk. Bebchuck, Lucian and Holger Spamann (2009). “Regulating Bankers’ Pay,” Social Science Research Network, Discussion Paper 641, June. Bebchuk, Lucian and Alma Cohen (2009). “Guest Contribution: Back to the Good Times on Wall Street,” Wall Street Journal, July 31. Bebchuk, Lucian, Alma Cohen and Holger Spamann (2009a). “The Wages of Failure: Executive Compensation at Bear Stearns and Lehman 2000-2008,” Social Science Research Network, November 24. Bebchuk, Lucian, Alma Cohen and Holger Spamann (2009b). Financial Times, “Bankers had cashed in before the music stopped,” December 6. Berlin, Mitchell (2007). “Dancing with Wolves: Syndicated Loans and the Economics of Multiple Lenders,” Federal Reserve Bank of Philadelphia, Business Review, pp. 1-8. Bernstein, J., L. Mishel and H. Shierholz (2009). The State of Working America 2008/2009. Ithaca: Cornell University Press.

101
Bertrand, M., C. Goldin. and L. Katz (2009). “Dynamics of the Gender Gap for Young Professionals in the Corporate and Financial Sectors,” NBER Working Paper No. 14681, July. Bettis, J.Carr, John Bizjak and Swaminathan Kalpathy (2010). “Why Do Insiders Hedge Their Ownership and Options,” Social Science Research Network, March. Available at: http://ssrn.com/abstract=1364810. Blankfein, Lloyd (2009). Financial Times, “Do not destroy the essential catalyst of risk,” February 8. Boldrin, Michele and Adrian Peralta-Alta (2009). “What happened to the US stock market? Accounting for the last 50 years,” Federal Reserve Bank of St. Louis, Working Paper 2009-042A, August. Bosworth, Barry and Aaron Flaaen (2009). America’s Financial Crisis: the End of An Era,” Brookings Institution, available at: http://www.brookings.edu/~/media/Files/rc/papers/2009/0414_financial_crisis_bosworth/0414_financial_crisis_bosworth.pdf. Craig, Susanne and Deborah Solomon (2009). Wall Street Journal, “Bank Bonus Tab: $33 Billion Nine Lenders That Got U.S. Aid Paid at Least $1 Million Each to 5,000 Employees,” July 31. Crotty, J (1985). "The Centrality of Money, Credit and Financial Intermediation in Marx's Crisis Theory." In S. Resnick and R. Wolff, eds., Rethinking Marxism: Essays in Honor of Harry Magdoff and Paul Sweezy. New York: Autonomedia, 1985, pp. 45-82. Crotty, J. (1993). "Rethinking Marxian Investment Theory: Keynes-Minsky Instability, Competitive Regime Shifts and Coerced Investment," Review of Radical Political Economics, 25(1), March, pp. 1-26. Crotty, J. (1994). "Are Keynesian Uncertainty and Macrotheory Incompatible? Conventional Decision Making, Institutional Structures and Conditional Stability in Keynesian Macromodels." In G. Dymski and R. Pollin, eds., New Perspectives in Monetary Macroeconomics: Explorations in the Tradition of Hyman Minsky. Ann Arbor: Univ. of Michigan Press, pp. 105-142. Crotty J, (2007). “If Financial Market Competition is so Intense, Why are Financial Firm Profits so High?: Reflections on the Current ‘Golden Age of Finance,” University of Massachusetts, Political Economy Research Institute, Working Paper No. 134, April.

102
Crotty, J (2009). “Structural Causes of the Global Financial Crisis: A Critical Assessment of the ‘New Financial Architecture’,” Cambridge Journal of Economics, July 2009, Vol. 33, No. 4, pp. 563-80. Crotty, J. and G. Epstein (2009). “Avoiding Another Meltdown,” Challenge, Vol. 53, No. 1, January-February 2009, pp. 1- 26. Cuomo, Andrew (2009). “No Rhyme or Reason: The ‘Heads I Win, Tails You Lose’ Bank Bonus Culture”, available at: http://www.oag.state.ny.us/media_center/2009/july/pdfs/Bonus%20Report%20Final%207.30.09.pdf. D’Arista, Jane (1994). The Evolution of US Finance: Volumes I and II. Armonk New York: M.E. Sharpe. Dash, Eric (2009). Wall Street Journal, “Effort to Rain in Pay on Wall Street Hits New Hurdle,” August 10. Davis, Steven (2003). Investment Banking. New York, New York: Palgrave Macmillan. Edmans and Xavier Gabaix (2009). “Incentive accounts: A solution to executive compensation,” VOX website, June 24. Available at: http://www.voxeu.org/index.php?q=node/3689. Ehrenreich, Barbara (2009). Bright Sided. New York: Metropolitan Books. FDIC (2009). Quarterly Banking Profile, First Quarter. Financial Stability Forum (2009). “FSF Principles for Sound Compensation,” April 2. Financial Services Authority (2009), “The Turner Review: A regulatory response to the global banking crisis,” March. Findlay, M.C. and E.E. Williams. “Financial economics at 50: an oxymoronic tautology,” Journal of Post Keynesian Economics, Winter 2008-09, 31 (2), p. 224. Folbre, Nancy (2010). Saving State U. New York: The New Press. Fox, Justin (2009). The Myth of the Rational Market. New York: Harper Business. Froud, J. and K. Williams (2007). “Private equity and the culture of value extraction,” CRESC Working Paper No. 31, February. Gapper, John (2008). Financial Times, “Whatever is good for Goldman,” September 24, 2008.

103
Goldin, C. and L. Katz (2008). “Gender Differences in Careers, Education and Games,” American Economic Review, Vol. 98, No. 2, pp. 363-69, May. Gorton, Gary and Andrew Metrick (2009). “Securitized Banking and the Run on the Repo,” NBER Working Paper 15223, August. Guerrera, Francesco (2009). Financial Times, “Banks eye way out of hell to salvation (via the Treasury),” September 19/20, 2009. Haldane, Andrew (2010). “The $100 Billion Question,” Speech given at the Institute of Regulation and Risk, Hong Kong, March 30. Available at: http://www.bankofengland.co.uk/publications/news/2010/036.htm Hoenig, Thomas (2010). “The Financial Foundation for Main Street,” Speech to US Chamber of Commerce Center for Market Competitiveness, Washington, D.C., March 24. Hughes, Chris and Brooke Masters (2008). Financial Times, “Reforms of bankers' pay in the spotlight,” May 22. Johnson, Simon and James Kwak (2010). 13 Bankers. New York: Pantheon Books. Kaplan, Steve and Joshua Rauh (2007). “Wall Street and Main Street: What Contributes to the Rise in the Highest Incomes?,” NBER Working Paper No. 13270, July. Kay, John (2009). Financial Times, “Powerful interests are trying to control markets,” November 11. Krugman, Paul (2008). New York Times, “The Madoff Economy,” December 19. Krugman, Paul (2010). New York Times, “Bankers Without a Clue,” January 15. Kwak, James (2010). “The Cover Up,” The Baseline Scenario, April 12, 2010. Avialable at: http://baselinescenario.com/2010/04/12/magnetar-financial-crisis-cover-up/. Lahde, Andrew (2008). Financial Times, “Letter to the Editor” October 17. Larsen, Peter (2008). Financial Times, “The flaw in the logic of investment banks’ largesse,” January 7. Lewis, Michael (2007). “Why I'm Ready to Be New Citigroup CEO,” Bloomberg website, Nov. 15.
104
Lewis, Michael (2009). “What Wall Street CEOs Don’t Know Can Kill You,” Bloomberg website, March 26. Lindblom, Lance and Laura Shaffer (2010). New York Times Deal Book, “Another View: We Need a “Blankfein Amendment,” April 14. Lohr, Steve (2009). New York Times, “Wall St. Pay is Cyclical, Guess Where We Are Now,” February 5. Litan, Robert (2010). “The Derivative Dealers’ Club and Derivatives Markets Reform,” The Brookings Institution, April 7. Available at: http://www.brookings.edu/~/media/Files/rc/papers/2010/0407_derivatives_litan/0407_derivatives_litan.pdf. Lowenstein, Roger (2000). When Genius Failed: The Rise and Fall of Long-Term Capital Management. New York: Random House. Mackenzie, Michael (2009). Financial Times, “High-frequency trading under scrutiny,” July 28. Mason, Paul (2009). Meltdown: The End of the Age of Greed. London: Verso. McKinsey Report (2009). “Global capital markets: Entering a new era,” September. Available at: http://www.mckinsey.com/mgi/reports/pdfs/gcm_sixth_annual_report/gcm_sixth_annual_report_full_report.pdf. McKinsey&Company (2010). "Debt and deleveraging. The global credit bubble and its economic consequences," January. Available at: http://www.mckinsey.com/mgi/reports/freepass_pdfs/debt_and_deleveraging/debt_and_deleveraging_full_report.pdf. Meunier, Francois (2007). “Les hauts salaires dans la banque: Talent ou collusion? (High-Earners in Investment Banking Talent or Collusion? With English summary), Revue Francaise d'Economie, v. 22, iss. 1, pp. 49-71. Morrison, A. and W. Wilhelm (2004). “The Demise of Investment Bank Partnerships: Theory and Evidence,” July. Available at: http://www.finance.ox.ac.uk/file_links/finecon_papers/2004fe14.pdf. Nersisyan, Yeva and L. Randall Wray (2010). “The Global Financial Crisis and the Shift to Shadow Banking,” Levy Economics Institute, Working Paper No. 587, February. New York State Comptroller’s Office 2010. “DiNapoli: Wall Street Bonuses Rose Sharply in 2009,” Press Release, February 23.

105
Norris, Floyd (2009). New York Times, “Off the Charts: A 10-Year Stretch That’s Worse Than It Looks” February 7. Office of the Comptroller of the Currency 2009. “OCC’s Quarterly Report on Bank Trading and Derivatives Activities: Fourth Quarter 2009.” Oyer, Paul (2006). "The Making of an Investment Banker: Macroeconomic Shocks, Career Choice, and Lifetime Income,” National Bureau of Economic Research, Working Paper 12059, February. Phillipon, T. and A. Reshef (2007). “Skill Biased Financial Development: Education, Wages and Occupations in the U.S. Financial Sector,” NBER Working Paper No. 13437, September. Philippon, T. and A. Reshef (2009). “Wages and Human Capital in the US Financial Industry: 1909-2006,” NBER Working Paper No. 14644, January. Plender, John, Financial Times, “A world where transactions rule,” March 9, 2009. Rajan, R. (2005), "Has Financial Development Made the World Riskier?,” NBER Working Paper 11728, November. Prins, Nomi (2009). It Takes a Pillage. Hoboken, New Jersey: John Wiley & Sons, Inc. Rajan, Raghuram (2009a). “The Credit Crisis and Cycle-Proof Regulation,” Review, Federal Reserve Bank of St. Louis, 91 (5), pp. 397-402, September/October. Rajan, Raghuram (2009b). “Corporate Finance,” NBER Reporter, Number 4, p. 4. Reinhart, Carmen and Kenneth Rogoff (2009). This Time is Different: Eight Centuries of Financial Folly. Princeton: Princeton University Press. Robert Reich 2009. blog, July 16. Available at: http://robertreich.blogspot.com/2009/07/goldman-and-jpmorgan-two-winners-when.html. S&P (2009a). Industry Surveys: Investment Services, May 28. S&P (2009b). Industry Surveys: Investment Services, November 26. Scheer, Robert (2010). “McCain gets it; Obama doesn’t,” Truthdig.com, January 6. Schumpeter, Joseph (1942). Capitalism, Socialism and Democracy. New York: Harper and Collins.

106
Securities Industry and Financial Markets Association Fact Book (SIFMA) 2008. Sirri, Erik (2009). “Speech by SEC Staff: Remarks at the National Economists Club: Securities Markets and Regulatory Reform,” April 9. Available at: http://www.sec.gov/news/speech/2009/spch040909ers.htm. Sorkin, Andrew Ross (2009). Too Big to Fail. London: Penguin. Standard and Poor’s (2009). “Industry Surveys: Investment Services,” November 26. Stiglitz, Joseph (2009). How to Rescue the Bank Bailout,” Truthout website, January 26. Stiglitz, Joseph (2010a). Mother Jones, “Moral Bankruptcy: Why Are We Letting Wall Street Off So Easily?,” January 13, 2010. Stiglitz, Joseph (2010b). Freefall: America, Free Markets, and the Sinking of the World Economy. New York: W.W Norton and Company. Sum, Andrew and Paulo Tobar (2008). “The Great Divergence: Real-Wage Growth of All Workers Versus Finance Workers,” Challenge, May/June, pp. 57-79. Taibbi, Matt (2009). Rolling Stone.com, “Obama’s Big Sellout,” December 9. Taibbi, Matt (2010). "Wall Street's Bailout Hustle," Rolling Stone, February 21. Available at: http://www.commondreams.org/print/53031. Taylor, Martin (2009). “Innumerate bankers were ripe for a reckoning,” Financial Times, December 16, p. 13. Tett, Gillian (2009). “Why the idea of ‘living wills’ is likely to die a quiet death,” Financial Times, August 14, 2009. The Economist (2008). “Confessions of a risk manager,” August 7. Trichet, Jean-Claude (2009). “What lessons can be learned from the economic and financial crisis,” speech in Paris, March 17. Available at: http://www.ecb.int/press/key/date/2009/html/sp090317.en.html. Tymoigne, Eric (2009). “Securitization, Deregulation, Economic Stability, and Financial Crisis, Part II: Deregulation, the Financial Crisis, and Policy Implications,” Levy Institute Working Paper No. 573.2, August 2009. Wall Street Watch (2009). “Sold Out: How Wall Street and Washington Betrayed America,” March. Available at: http://www.wallstreetwatch.org/reports/sold_out.pdf.

107
Wessel, David. (2010). Wall Street Journal, “Bernanke’s Puzzling Bubble Logic,” January 24. Williamson, Oliver (1985), The Economic Institutions of Capitalism. New York: Free Press.