the bishop cone audit - inyo county · for account #ba1: usage is the sum of ditch 1 and 2 uses...
TRANSCRIPT

The Bishop Cone Audit
An annual accounting which compares water use on LA land on the Bishop Cone to LA groundwater
extraction from the Bishop Cone to confirm LADWP compliance with the 1940 Hillside Decree

• The Bishop Cone’s Boundaries (yellow)
• Rivers, creeks, ditches (blue)
• General surface flow directions (green)

• During a drought in the late 1920s and early 1930s LADWP pumped and
exported a significant amount of groundwater from wells on the Bishop
Cone to LA
• Local property owners challenged this export and a multi-year legal battle
ensued
• 1940 Hillside Decree settled this protracted legal challenge
• Extraction declined after 1940 but has gradually increased to an average
of 15,000 Acre-feet/year
• 1991 Long Term Water Agreement Section VIIA recognizes the Hillside
Decree and incorporates stipulations into Bishop area water management
• 1996 Green Book Section IV.D adds the specific Bishop Cone Audit
procedures
Background and Timeline

• Bishop Cone Audit is conducted to comply with the strictures
of the Hillside Decree, the LTWA, and the Green Book
• BCA uses the existing LADWP lease, ditch and monitoring
systems that were in place in 1990s
• LADWP’s data is based on leased “Accounts” for irrigated land
and recreation areas (Millpond, Buckley Ponds, etc.)
• Geographical realities of LADWP infrastructure play a role in
water management on the Bishop Cone
• BCA is not a water budget; it isn’t a total of Bishop area
exported water; it isn’t a groundwater modeling tool
Key Concepts

Feature Water Role
Blue are rivers, streams, ditches, drains Use or Export
Purple are pumped wells Use
Red are flowing artesian wells Export
Orange are irrigated “Accounts” Use
Black are surface water monitoring stations
Bishop Cone Infrastructure
8

Extractions include:
• Pumped groundwater from 8 existing LADWP wells on the Cone
• Flowing water from 15 artesian wells near Owens River
• These extractions are relatively easy to quantify
Uses include:
• Surface or groundwater applied to Bishop Cone “Accounts”
(irrigation to leases, ponds and recreation areas)
• Return flows subtracted from Uses
• Conveyances losses (surface water seepage)
• More complicated system to quantify
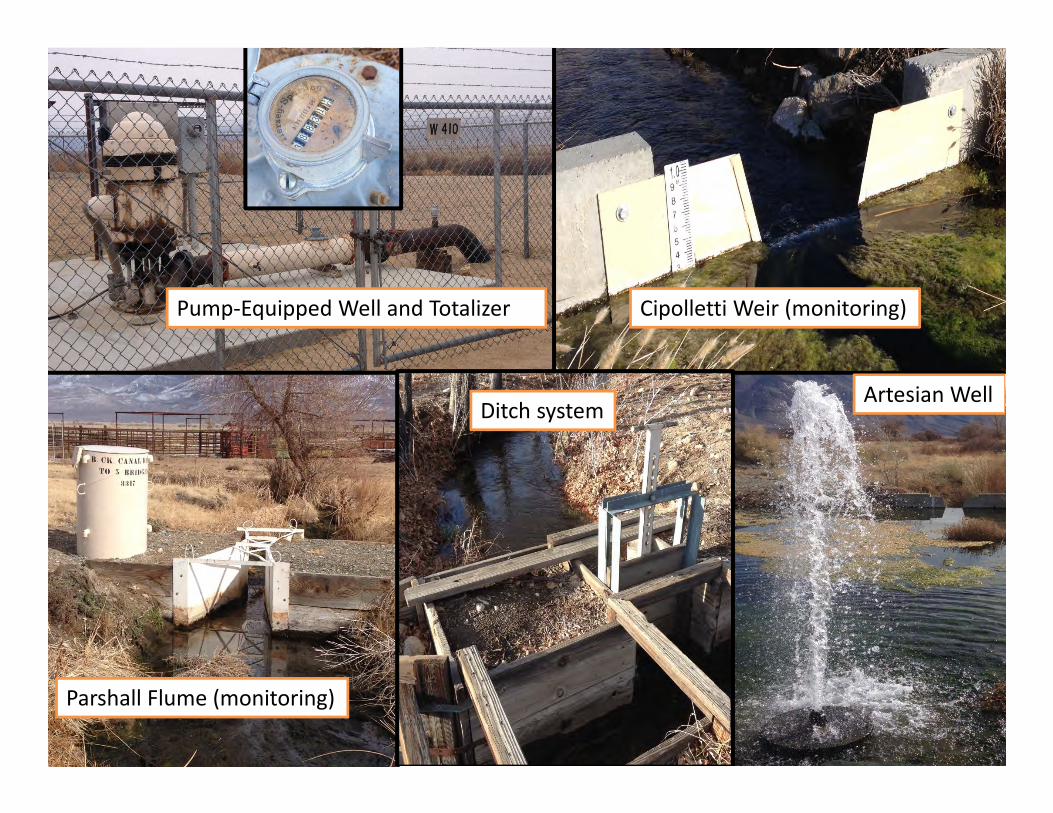
Monitoring Apparatus include:
• Totalizers measure outflow from pumped wells
• Artesian wells flow into pools; and weirs monitor outflow
• Flumes and weirs with data-logging devices measure surface
flows onto and off-of leases
Key Components
10
Pump-Equipped Well and Totalizer
Parshall Flume (monitoring)
Cipolletti Weir (monitoring)
Ditch systemArtesian Well

For Account #BA1: Usage is the sum of Ditch 1 and 2 Uses
Ditch 1: Flow onto parcel minus amount of return flow off account to conveyance
= 500 AF – 250 AF = 250 AF “Used”
Ditch 2: Flow onto parcel minus amount of return flow off account (no flow)
= 500 AF – 0 AF = 500 AF “Used”
Ditch 1
Account BA#1 Total Usage = 250 AF + 500 AF = 750 AF
Ditch 2no flow
500 AF
500 AF
250 AF
On Off
Wa
ter
Co
nve
yan
ce (
I.E
. B
ish
op
Cre
ek
) Wa
ter C
on
veya
nce
(I.E. O
we
ns R
iver)

0
5000
10000
15000
20000
25000
30000
35000
4000019
96‐199
7
1997
‐199
8
1998
‐199
9
1999
‐200
0
2000
‐200
1
2001
‐200
2
2002
‐200
3
2003
‐200
4
2004
‐200
5
2005
‐200
6
2006
‐200
7
2007
‐200
8
2008
‐200
9
2009
‐201
0
2010
‐201
1
2011
‐201
2
2012
‐201
3
2013
‐201
4
2014
‐201
5
2015
‐201
6
2016
‐201
7
Acre Fee
t of W
ater
Run‐off Year (Apr 1 to Mar 31)
FIGURE 2WATER USES VERSUS EXTRACTIONS ON THE BISHOP CONE
Total Uses
Total Extractions

Recent Activity on Bishop Cone
• Increased monitoring by ICWD & DWP staff on BishopCone due to drought and ditch flows
• ICWD conducting field audit of all accounts andmonitoring devices with DWP staff
• Working on clarifying and simplifying Bishop Water UseReport component of BCA
• ICWD staff conducting spot checks of BCA devices
• LADWP has consultants updating Bishop/Lawsgroundwater model
• DWR staff investigated West Bishop Flooding/Dry Wells