the biogeography and ecology of the secondary marine
TRANSCRIPT

The biogeography and ecology
of the secondary marine arthropods
of southern Africa \ .
by ~erban Proche~
Submitted in partial fulfillment of the requirements for the degree of
Doctor of Philosophy Degree
in the
School of Life and Environmental Sciences
Faculty of Science and Engineering
University of Durban-Westville
Promoter: Dr. David J. Marshall
November 2001

DECLARATION
The Registrar (Academic)
UNIVERSITY OF DURBAN-WESTVILLE
Dear Sir
I, Mihai ~erban Proche§
REG. NO.: 9904878
hereby declare that the thesis entitled
The biogeography and ecology of the secondary marine arthropods of southern Africa
is the result of my own investigation and research and that it has not been submitted in part or
full for any other degree or to any other University.
S.tl"h"iA. ~ ('oc~ c· -----~------------------------~
Signature
11
15 November 2001
Date

The biogeography and ecology of the secondary marine
arthropods of southern Africa
~erban Proche§
Submitted in partial fulfillment of the requirements for the degree of Doctor of Philosophy
degree in the School of Life and Environmental Sciences, Faculty of Science and Engineering,
University of Durban-Westville, November 200l.
Promoter: Dr. David J. Marshall.
Abstract
Because of their recent terrestrial ancestry, secondary marine organisms usually differ from
primary marine organisms in life history and physiological traits. Intuitively, the traits of
secondary marine organisms constrain distribution, thus making these organisms interesting
subjects for comparative investigation on ecological and biogeographical theory. A primary
objective of the studies presented here was to improve our current knowledge and
understanding of the generally poorly known secondary marine arthropods (e.g. mites and
insects). An additional objective was to outline relationships between ancestry, ecology, and
biogeography of small-bodied, benthic marine arthropods.
In establishing a context for the global biogeographical study, the distribution patterns
of secondary marine plants and animals were determined by means of a literature survey.
These organisms, including mangrove trees and marine tetrapods, form three distinct
groupings which relate to northern, tropical and southern latitudinal bands, and, exhibit
bimodal species richness in each hemisphere. The exact same patterns were resolved for non
halacarid marine mites and are thought to have arisen from the effects of elevated tropical
speciation and high latitude glaciation. Whereas the typically marine Halacaridae show a high
degree of radiation in sub-tidal habitats, global distribution patterns and species to genus
ratios indicate that the intertidally-restricted Ameronothroidea (Oribatida) and Hyadesiidae
(Astigmata), have had long marine associations relative to other non-ha1carid mites
(Mestostigmata and Prostigmata). The mari~e mite fauna of southern Africa clusters into three
geographical provinces, and the species richness of rocky shore mites peaks in the southern,
warm temperate province. In being consistent with the trend for the region'S marine fauna in
III

general, the mite biogeography highlights the generality of this faunistic trend, with respect to
taxonomic resolution and taxonomic diversity.
Ecological studies focussing on mangrove pneumatophores show that they support a
characteristic suite of arthropods (mites, copepods, tanaids, insect larvae), which differs from
that of the benthic sediment. Pneumatophore assemblages comprise similar numbers of
primary and secondary marine species, although the former group is more abundant by one
order of magnitude. Pneumatophore assemblage composition varies between mangrove
forests, predominantly in relation to salinity variation. Within mangrove forests differences
arise through differential wetting frequency and variable sunlight intensity. Desiccation
limited algal growth and sediment deposition determine the vertical zonation of arthropods
along the pneumatophore length, with secondary marine species typically occurring at lower
elevations, and primary marine species at higher elevations. The levels of similarity in the
composition of arthropod assemblages decreases with spatial scale, the largest differences
occurring between estuarine systems.
Despite their recent terrestrial ongms, secondary marine arthropods show a high
degree of integration into marine ecosystems, and should be consistently considered in marine
ecological and biogeographical studies.
Key Terms: Acari, ecological transitions, intertidal, mangroves, mites, southern Africa
IV

Acknowledgements
Lots of thanks to my promoter, David 'Mick' Marshall, who took the chance of offering a
bursary to an unknown student, coming from faraway Romania. If I'll ever be anywhere in the
scientific world, I will owe it to him. Thanks to the NRF and UDW for funding me, and to the
MCM for granting me collection permits. My gratitude to Profs. Carolyn Baker and Ahmed
Thandar for their easy-going approach to administrative matters, and to the technical staff for
taking me around on collecting trips. Thanks to Angelo Lambiris and Renzo Perissinotto for
amazing exchanges of scientific, and not only scientific, ideas. Thanks in their respective
languages to all my excellent friends here in Durbs. They made these two years and a half,
more than a PhD, a real social experience. I specifically want to name here Santosh Bachoo,
Dennis Ball, Amar Bholonath, Ketelo Hlehlisi, Israel Kibirige, Deshi Moodley, June
Munnisunker, Mags Natasen-Moodley, Phindi Nonyane, Christian Nozais, Ashvena and
Ashvita Ramcharan, Syd Ramdhani, Vanessa Singh, and Kaajial U grasen.
I thought it appropriate to list here (in chronological order) the five people whose contribution
was essential in my choice of natural science as a career.
Mr. ~tefan Proche~ - my father, that is. He fashioned my first insect tray when I was
four. He had reasons to get seriously worried later on, when another seven were required to
accommodate my growing collections.
Mr. Mihai Filip - my best friend from the gymnasium years, and my opponent in a
fierce competition for 'who gathers more bugs' .
Mr. Alexandru Iftime - my twin-brother-in-fate, who introduced me to the mysterious
world of scientific names and encyclopedic knowledge.
Mrs. Rodica Serafim - 'mom' of all Romanian beetles. She taught me the patience to
go through endless pages of scientific literature, and grew me up as a real coleopterist. If I
turned out otherwise, it's all my fault.
Prof. Irina Teodorescu - my Honours and MSc supervisor. A lady of an almost extinct
kind, she went through great pains explaining me that in science, to exist, one must publish.
This thesis is dedicated to my parents, Ileana and ~tefan Proche~. Thanking them here for
bringing me up would be beside the point. I just want to say I appreciate them for who they
are.
v

Publications
(Papers published, in press, or submitted, arising from the study presented in this
thesis)
Proche§ ~, Marshall DJ. 2001. Global distribution patterns of non-halacarid manne
intertidal mites: implications for their origins in marine habitats. Journal of
Biogeography 28: 47-58 .
Proche§ ~, Marshall DJ, Ugrasen K, Ramcharan A. 2001. Mangrove pneumatophore
arthropod assemblages and seasonality patterns. Journal of the Marine Biological
Association of the United Kingdom 81 : 545-552.
Proche§ ~. 2001. Back to the sea: secondary marine organisms from a biogeographical
perspective. Biological Journal of the Linnean Society 74: 197-203.
Proche§ ~. 2001. Halacaropsis praecognita n. sp. (Acari: Halacaridae) from southern Africa.
Transactions of the Royal Society of South Africa, in press.
Proche§ ~. 2001. New species of Copidognathinae (Acari: Halacaridae) from southern
Africa. Journal of Natural History, in press.
Proche§ ~, Marshall DJ. 2001. Ecological patterns of two cohabiting evolutionary distinct
animal groups: mangrove pneumatophore arthropods as a case study. Ecography,
submitted.
Proche§ ~, Marshall DJ. 2001. Algal growth and sediment deposition as determinants of
arthropod distribution and abundance on mangrove pneumatophores. Estuarine,
Coastal and Shelf Science, submitted.
Proche§ ~, Marshall DJ. 2001. Diversity and biogeography of southern African marine
Acari. Journal of Biogeography, submitted.
VI

Contents
Abstract ...... .. .... . . . . .. ... .... .. . .. ... .. . .. . . . ... . . .. ..... ....... ... . .. . ... . ..... ... . . ...... . . . .... .. 111
Acknowledgements .. .. .. . ...... .... ... ..... ..... . .. .. . .. .............. . . .. ... .. .. . ... . . . ...... . ... .. . v
Publications .. . . ... . ..... .. . .. ... .. .... . . ...... . . . . ........ . . ... ...... ... . ...... . ... .. . . ......... .. . ... VI
Table of contents ... . . . .. .. . . . . .. . .. . . .. . .. . ..... ... .... .... . .. ... .. . · · · · .· ... . .. .. ···. · · ·· · ···· ···· .V11
Chapter I. Introduction ....... . . .. . .. ....... . . ..... .. .. . ........... ....... . . . . ... ..... .... . . . .... . ... . .1
Section I. Biogeography
Chapter II. Back to the sea: secondary marine organisms from a biogeographical
perspective .. . ... . . .. . . ... . . . .. . . ..... ..... .. . ... ....... . ... . . . ... . ...... . . . ...... . ..... ... .. .. 1 0
Chapter III. Global distribution patterns of non-halacarid marine intertidal mites:
implications for their origins in marine habitats ...... . ... . .. .. ... .. .. . . ...... ... .. .. ... 25
Chapter IV. Diversity and biogeography of southern African intertidal Acari .......... ... .... . 50
Section II. Ecology
Chapter V. Mangrove pneumatophore arthropod assemblages and temporal patterns .. .... .. .. 79
Chapter VI. Assemblage structure of two phylogenetically distinct arthropod groups
inhabiting mangrove pneumatophores ...... . ..... .. .. . ............ . ... . ..... . . . ... .. . ... 96
Chapter VII. Epiphytic algal cover and sediment deposition as determinants of
arthropod distribution and abundance on mangrove pneumatophores .. . ......... .. 116
Chapter VIII. Arthropod distribution across spatial scales: patterns of diversity
and abundance ..... . ... . . . ....... . . . ... . ...... . .. . .. . ... . .... . ...... .. ....... . .... . . ... .. .. 132
Chapter IX. Discussion . ...... . ... . . .. ... . . ... ......... . ...... . . . . .. ... . ... .. .. . . . . . .. . . .. ...... .. . .. .... 153
Appendix
Part 1. Halacaropsis praecognita n. sp. (Acari: Halacaridae) from southern Africa ... . . . .... .159
Part II. New species ofCopidognathinae (Acari: Halacaridae) from southern Africa ... . . .. .. 166
Vll

Chapter I
Introduction
Primary and secondary marine organisms
The two realms making up the Earth's biosphere, terrestrial and marine, are so different that in
many ways meaningful ecological comparisons between them are not yet possible. Rough
quantitative comparisons of productivity, species richness, and other simple ecological
indicators are available, however, integrating the information about the underlying processes
often proves difficult (May, 1992, 1994; Angel, 1994; Briggs, 1994; Gray 1997). Despite
these differences, animals and plants have crossed the land/sea barrier repeatedly. While the
entire variety of terrestrial life, as seen today, originated, at some point, in the sea (for
reviews, see Little, 1983; 1990), few marine organisms have a terrestrial ancestry (Vermeij &
Dudley, 2000). The organisms arising from land-to-sea transitions, are the focus of this thesis,
and will further be referred to as secondary marine (as opposed to primary marine organisms
which have spent their entire evolutionary history in the marine environment). The diversity
of secondary marine life is briefly reviewed below.
Among the angiosperms, there are two distinct growth forms associated with marine
habitats: the mangrove trees and sea grasses. Tree species from at least fifteen families are
strictly limited to coastal waters, and are described under the common name of mangroves
(Tomlinson 1987). Although extremely heterogeneous, these trees are characterized by three
common adaptations, attained to various degrees in different taxonomic groups: viviparity,
breathing roots, and resistance to high salinity. Sea grasses, resembling algae in many
superficial ways, represent at least three different invasions of the sea by basal monocots (Les
& Cleland, 1997).
No recent species of moss, fern, or gymnosperm can be considered truly marine.
Defining secondary marine groups in higher algae and unicellular organisms is rather
problematic, because little is known about their transitions between terrestrial, freshwater and
marine environments. Among the fungi, at least two secondary invasions of the sea have been
documented for the Ascomycota (see Spatafora et aI., 1998), and numerous other groups,
including lichens, are generally accepted to be only secondarily marine.
Among the vertebrates, the reptiles have had a long history of past associations with
the sea. When considering recent taxa, however, marine reptiles are scarce. There is only one,
1

apparently monophyletic group of marine chelonians (Schaffer et aI., 1997), one species of
sea crocodile, two distinct groups of sea snakes (Keogh, 1998), and one species of truly
marine lizard (see Rassman, 1997). Best known among secondary marine organisms are the
seabirds, where adaptations to marine life appeared on numerous occasions (at least once each
in Sphenisciformes, Procellariiformes, Pelecaniformes and Lariformes; see Cracraft, 1981),
and the mammals, with four distinct recent marine groups (Sirenia, Cetacea, Pinnipedia, and
the genus Enhydra in Fissipedia; see Reeves et aI., 1992).
Secondary marine arthropods
Arthropods, like all animal phyla, originated in the sea. One of the major arthropod groups,
the Crustacea, has been predominantly marine throughout its evolutionary history. Two other
groups, which are largely terrestrial, re-colonized the marine environment to various extents,
in multiple invasions: these are the Acari (mites) and the Hexapoda (springtails and insects).
Numerous families of mesostigrnatid, prostigrnatid, oribatid and astigrnatid mites have
marine representation. However, most of the marine mites are strictly intertidal, with only one
family, the Halacaridae (pro stigmata), extending into subtidal habitats. Halacarid mites
represent more than half the total diversity of marine mites worldwide. Bartsch (1989)
indicates a total of 700 species described to date, while Otto (2000a; that is, only eleven years
later) suggests this figure might have already reached 1000. Two weeks of collections in tiny
Rottnest Island off the coast of Western Australia yielded 80 species (Otto, 1999), while
extensive collections in the Great Barrier Reef returned almost 300 (Otto, personal
communication). Habitat specialization in halacarid mites is obvious at genus level. Some
genera, such as Acarochelopodia and Actacarus are interstitial, inhabiting sandy deposits
(Otto 2000b), while others, like Agauopsis (Bartsch, 1986) are characteristic for rocky shores.
Still others, like Bathyhalacarus, inhabit the ocean floor thousands of meters below sea level
(Bartsch, 1982), making the Halacaridae the only secondary marine organisms that complete
their life cycle on the ocean floor. This makes halacarid mites ecologically closer to primary
marine organisms, and it can be explained only by considering their long evolutionary history
in the marine environment (see Bartsch 1996).
The degree of adaptation to the marine environment varies less amongst hexapods,
with most species being intertidal, and this applies to both collembolans and insects. Only one
group of insects, the water-skaters, has adapted to an entirely marine existence on ocean
surfaces, and certain parasitic insects can be found in the open sea, together with their hosts.
2

All marine Colembola are intertidal air-breathers. Invasions of the marine environment
happened independently in five families from two orders: Isotomidae, Entomobryidae
(Entomobryomorpha) Hyp0 gastruridae, Onychiuridae and Neanuridae (Poduromorpha) (see
Greenslade, 1986; Christiansen & Bellinger, 1988; Greenslade & van Klinken, 1994).
Numerous insects (Diptera: Canacidae, Ceratopogonidae, Chironomidae, Coelopidae,
Culicidae, Dolichopodidae, Ephydridae, Tipulidae, Trichoptera: Chathamiidae) live in
intertidal environments as aquatic larvae, but lead a supralittoral, air-breathing existence as
adults. The Canacidae, Coelopidae and Chathamiidae are predominantly marine, as are a few
genera in Ceratopogonidae and Chironomidae (midges) (Morley & Ring 1972; Cheng, 1976;
Neumann, 1976; Kronberg, 1988; Cheng & Frank, 1993). Midge larval and pupal
development is well correlated with tidal rhythms (Neumann, 1976; Robles, 1984; Saigusa &
Akiyama, 1995). Two weevil genera, Bothrometopus and Palirhoeus (Coleoptera:
Curculionidae), live (both as adults and larvae) in the supralittoral and intertidal zones of sub
Antarctic islands, heavily exposed to salt spray (Chown & van Drimmelen, 1992). Other
groups of insects (Coleoptera: Dytiscidae, Gyrinidae, Dryopidae, and Heteroptera: Corixidae)
are known to tolerate brackish and even salt water, but typically live in freshwater.
In water-skaters (Heteroptera: Gerridae, Veliidae, Hermatobatidae), all life stages live
on the sea surface (mostly in sheltered mangrove habitats, but in some cases on coral reefs,
and even in the open ocean; see Cheng, 1985). This group has radiated extensively in marine
habitats; around 170 species are known, most of them in the Indo-Pacific region (Andersen,
1999). However, no known insect spends its entire existence submerged in seawater,
reproduction happening most often above the water surface. Even seal lice (from the orders
Mallophaga and Anoplura), although staying submerged for entire seasons, only reproduce
when their mammalian hosts are on land (Cheng & Frank, 1993).
Present state of knowledge for southern Africa
Our knowledge of the southern African secondary marine arthropods is largely based on
taxonomic descriptions and species lists. Recently, numerous mite species have been
described, a few of them in papers included in this thesis. Four species of marine spider are
known from the region (Lamoral, 1968). Although a single species of collembolan (Anurida
maritima) is mentioned from the rocky shores of southern Africa (Branch & Branch, 1981),
numerous other species have been observed and collected.
Numerous insect families have been reported from sandy beaches (Dermaptera:
Labiduridae, Orthoptera: Stenopelmatidae, Coleoptera: Cicindelidae), stranded kelp
3

(Coleoptera: Carabidae, Cicindellidae, Tenebrionidae, Diptera: Chironomidae,
Anthomyiidae), and brackish estuarine waters (Heteroptera: Saldidae, Corixidae, Coleoptera:
Dytiscidae, Hydraenidae, Staphilinidae, Heterroceridae, Trichoptera: Ecnomidae, Diptera:
Ephydridae) (Hesse, 1934; Branch & Grindley, 1979; Stenton-Dozey & Griffiths, 1980;
Branch & Branch, 1981; Scholtz & Holm, 1985; Rebelo, 1987). On rocky shores, several taxa
(Coleoptera: Staphilinidae, Diptera: Chironomidae) have been found living in conditions of
temporary or permanent submersion (Hesse, 1934; Scholtz & Holm, 1985). One species of
water strider (Halobates micans) has been recorded along the eastern coast of southern Africa
(Scholtz & Holm, 1985). It is however worth noting, that many of the taxa listed above are not
normally considered as marine (Cheng, 1976).
Previous to the current series of investigations, there has been a dearth of information
concerning the ecology and biogeography of secondary marine arthropods in general. The
objectives of this thesis were to 1) describe distribution patterns of secondary marine
arthropods at global, regional (southern Africa) and local scale, and 2) conduct ecological
investigations comparing primary and secondary marine organisms in terms of abundance,
species richness, temporal dynamics, and interactions with biotic and abiotic factors.
Thesis outline
While the studies presented here address the biogeography and ecology of secondary marine
organisms, with a focus on arthropods and on southern Africa, the scope extends to global
geographical patterns of secondary marine organisms in general. The thesis contains two
sections. The first section (chapters II - IV) concerns the biogeography of secondary marine
organisms, while the second section (chapters V-IX) concentrates on community and spatial
ecology of mangrove pneumatophore arthropods.
Chapter II refers to secondary marine organisms in general, excluding arthropods.
However its inclusion in the thesis was considered to be beneficial in 1) supplementing the
introduction with information about secondary marine life forms; and 2) offering global
distribution patterns from groups of secondary marine organisms that, unlike arthropods, have
been extensively studied. Chapter III considers the global distribution patterns of non
halacarid intertidal mites. Taxonomic and geographical patterns are reviewed, in order to
assess the evolutionary age in the marine environment for various groups. The diversity and
distribution patterns of marine intertidal Acari in southern Africa are described in Chapter IV,
and compared to global patterns (as presented in chapter III), and to other animal groups.
4

Chapter V analyses previously undescribed communities of mesoarthropods from
mangrove pneumatophores, in order to assess the comparative representation of primary and
secondary marine species. Chapter VI compares the vertical distribution of these two groups,
and considers the associations existing within and between them, to decide whether the
evolutionary history of species has any effect on resistance to physical stress (e.g.
desiccation), or on the strength of biotic interactions. Chapter VII considers small-scale
distribution and abundance patterns of pneumatophore arthropods in relation to the algal
covering of the pneumatophores and the sediment trapped within it, and monitors temporal
changes on defaunated pneumatophores. In Chapter VIII, a nested sampling design is used to
assess variation in ecological parameters (assemblage composition, species richness and
abundance) of pneumatophore arthropods, across a variety of scales (between 10 cm and 100
km).
All chapters (except for I, VIII and IX) have been structured and prepared
independently for journal publication. Some are published, others in press, and others still, are
submitted. Given this structure, there is inevitable repetition of information, and this applies
especially to the Introduction and Methods sections of the chapters. Furthermore, the study
was not undertaken in the same order as that given for the thesis chapters. This means that
some chapters occurring later in the thesis may not always refer to earlier stated information.
Finally, as the papers for pUblication were not altered when compiling the thesis, there is no
cross-referencing between chapters. For purpose of cross-referencing, and to place the study
in the context of the sequence in which it was undertaken, this sequence is given below: 1)
Chapter III (Global distribution patterns of non-halacarid marine intertidal mites: implications
for their origins in marine habitats), 2) Chapter V (Mangrove pneumatophore arthropod
assemblages and seasonality patterns), 3) Chapter II (Back to the sea: secondary marine
organisms from a biogeographical perspective.), 4) Chapter VI (Patterns of distribution,
abundance and interactions among primary and secondary marine arthropods cohabiting
mangrove pneumatophores), 5) Chapter VII (Algal growth and sediment deposition as
determinants of distribution and abundance in mangrove pneumatophore arthropods).
Two further papers, written earlier than the rest of the thesis, were included as an
appendix, and represent the descriptions of four new species of halacarid mite from the
southern African coast. Among these, Halacaropsis praecognita (Appendix: Part I) is a rocky
shore species, and appears in the biogeographical analyses in Chapter IV, while Acarothrix
umgenica and Copidognathus caloglossae (Appendix: Part II) are mangrove species, and their
ecology is investigated in Chapters V -VIII.
5

References
Andersen NM. 1999. The evolution of manne insects: phylogenetic, ecological and
geographical aspects of species diversity in marine water striders. Ecography 22: 98-
111.
Angel MV. 1994. Spatial distribution of marine organisms: patterns and processes. In:
Edwards PJ, May RM Webb NR (eds), Large Scale Ecology and Conservation
Biology. pp. 59-109. Oxford: Blackwell Scientific.
Bartsch I. 1972. Halacaridae (Acari) aus Stidafrika. Mitteilungen aus dem Hamburger
Zoologischen Museum und Institut 69: 5-32.
Bartsh, I. 1982. Zur Gattung Bathyhalacarus (Acari, Halacaridae), nebst Beschreibung fiinf
neuer Arten. Zoologica Scripta 11 : 209-220.
Bartsch I. 1986. Zur Gattung Agauopsis (Acari, Halacaridae), Beschreibung zweier neue
Arten und Ubersicht tiber Verwandtschafisgruppen. Zoologica Scripta 15: 165-174.
Bartsch, I. 1987. Arhodeoporus kunzi n. sp., eine Halacaride (Acari) aus dem Mesopsammal
Slidafrikas. Articulata, 2: 389-392.
Bartsch I. 1989. Marine mites (Halacaroidea: Acari) A geographical and ecological survey.
Hydrobiologia 178: 21-42.
Bartsch, I. 1992. Lohmannella dictyota n. sp. und Lohmannella africana n. sp., von der
Slidhalbkugel. (Arachnida: Acari : Halacaridae). Senckenbergiana Biologica 72: 457-
464.
Bartsch, I. 1996. Halacarids (Halacaroidea, Acari) in freshwater. Multiple invasions from the
Paleozoic onwards? Journal o/Natural History 30: 67-99.
Branch G, Branch M. 1981. Living shores of southern Africa. Cape Town: C. Struik.
Branch GM, Grindley JR. 1979. Ecology of southern African estuaries. Part XI. Mngazana:
a mangrove estuary in the Transkei. South African Journal o/Zoology, 14: 149-170.
Briggs Jc. 1994. Species diversity: land and sea compared. Systematic Biology 43: 130-135.
Cheng L. 1976. Marine insects. Amsterdam: North Holland.
Cheng L. 1985. Biology of Halobates (Heteroptera: Gerridae). Annual Review 0/ Entomology
30: 111-135.
Cheng L, Frank JH. 1993. Marine insects and their reproduction. Oceanography and Marine
Biology - Annual Review 31 : 479-506.
Chown SL, van Drimmelen M. 1992. Water balance and osmoregulation in weevil larvae
(Coleoptera: Curculionidae: Brachycerinae) from three different habitats on sub
Antarctic Marion Island. Polar Biology 12: 527-532.
6

Christiansen K, Bellinger P. 1988. Marine littoral Collembola of North and Central
America. Bulletin of Marine Science 42: 215-245.
Cracraft J. 1981. Towards a phylogenetic classification of birds of the world (class Aves).
Auk98: 681-714.
Gray J8. 1997. Gradients in marine biodiversity. In: Ormond RFG, Gage JD, Angel MV, eds,
Marine Biodiversity. Patterns and processes. Cambridge: Cambridge University Press,
19-34.
Greenslade P. 1986. Psammisotoma, a new genus of Isotomidae (Collembola) from marine
littoral habitats. Proceedings of the Royal Society of Queensland 97: 89-95.
Greenslade P, van Klinken RD. 1994. Marine littoral and coastal Collembola on the
subantarctic Macquarie Island. Acta Zoologica Fennica 195: 58-61.
Hesse AJ. 1934. Contributions to the knowledge of S. African marine Clunioninae -
Choironomids. Transactions of the Royal Entomological Society of London 55: 27-40.
Keogh J8. 1998. Molecular phylogeny of elapid snakes and a consideration of their
biogeographic history. Biological Journal of the Linnean Society 63: 177-203.
Lamoral BH. 1968. On the ecology and habitat adaptations of two intertidal spiders, Desis
formidabilis (OP Cambridge) and Amaurobioides africanus Hewitt at 'The Island'
(Kommetjie; Cape Peninsula), with notes on the occurence of two other spiders.
Annals of the Natal Museum 20: 151-193.
Les DH, Cleland MA. 1997. Phylogenetic studies in Alismatidae, II: evolution of marine
angiosperms (seagrasses) and hydrophily. Systematic Botany 22: 443-463.
Little C. 1983. The colonization of land. Origins and adaptations of terrestrial animals.
Cambridge: Cambridge University Press.
Little C. 1990. The terrestrial invasion: an ecophysiological approach to the origins of land
animals. Cambridge: Cambridge University Press.
Neumann D. 1976. Adaptations of chironomids to intertidal environments. Annual Review of
Entomology 21: 387-414.
Otto Jc. 1999. Corallihalacarus chilcottensis, a new genus and species of marine mite from
the Coral Sea. Zoological Science 16: 839-843.
Otto Jc. 2000a. Australacarus (Acari: Halacaridae) from northern Australia, with the
description of three new species. Records of the Western Australian Museum 20: 103-
114.
Otto Jc. 2000b. Acarochelopodia and Actacarus species (Acari: Halacaridae) from Australia,
with remarks on A. pacificus and A. orthotectus. Species Diversity 5: 111-127.
7

Rassmann K. 1997. Evolutionary age of Galapagos iguanas predates the age of the present
Galapagos islands. Molecular Phylogenetics and Evolution 7: 158-172.
Rebelo AG. 1987. Mass migration of kelp flies (Coelopidae). Journal of the Entomological
Society of South Africa 50: 257-258.
Reeves RR, Stewart BS, Leatherwood S. 1992. The Sierra Club Handbook of Seals and
Sirenians. San Francisco: Sierra Club.
Robles C. 1984. Coincidence of agonistic larval behaviour, uniform dispersion, and unusual
pupal morphology in a genus of marine midges (Diptera: Chironomidae). Journal of
Natural History 18: 897-904.
Saigusa M, Akiyama T. 1995. The tidal rhythm of emergence and the seasonal variation of
this synchrony, in an intertidal midge. Biological Bulletin 188: 166-178.
Schaffer HB, Meylan P, McKnight ML. 1997. Tests of turtle phylogeny: molecular,
morphological, and paleontological approaches. Systematic Biology 46: 235-268.
Scholtz CH, Holm E. 1985. Insects of southern Africa. Durban: Butterworth.
Spatafora JW, Volkmann-Kohlmeyer B, Kohlmeyer J. 1998. Independent terrestrial
origins of the Halosphaeriales (marine Ascomycota). American Journal of Botany 85:
1569-1580.
Stenton-Dozey J, Griffiths CL. 1980. Growth, consumption, and respiration by larvae of the
kelp fly Fucellia capensis (Diptera: Anthomyiidae). South African Journal of Zoology
15: 280-283.
Tomlinson PB. 1986. The botany of mangroves. Cambridge: Cambridge University Press.
Vermeij GJ, Dudley R. 2000. Why are there so few evolutionary transitions between aquatic
and terrestrial ecosysytems? Biological Journal of the Linnean Society 70: 541-554.
8

Section I
Biogeography

Chapter II
Back to the sea: secondary marine organisms from a
biogeographical perspective
Abstract
Secondary marine organisms belong to groups of terrestrial ancestry which have recolonized
marine habitats. Some of them are, to various degrees, still dependent on the terrestrial habitat
where they originated, which imposes certain limits in the expansion of their distribution
range. This makes them an ideal subject for historical reconstruction. Here I perform
biogeographical analyses on the global distribution of twelve groups of land-dependent
secondary marine plants and animals (mangrove trees, sea turtles, sea snakes, seabirds and
seals). When all groups are taken together, species diversity shows a unique bimodal pattern
for each hemisphere, with high values in cold-temperate and tropical regions, but low values
in mid-latitude regions. None of the individual groups considered reaches its highest species
concentration in mid-latitude regions. This is shown to be due to the existence of three
different species assemblages, inhabiting the three species-rich latitudinal bands (northern
cold-temperate, tropical, and southern cold-temperate), and intermixing to a limited degree in
the species-poor mid-latitude bands. This is evidence that secondary marine organisms
diversified independently in cold-temperate and tropical regions, and strongly suggests that
colonization from terrestrial habitats took place independently in the three species-rich
latitudinal bands. Different constraints in the terrestrial habitat of origin are put forward as
evolutionary incentives for colonizing the sea: glaciation processes in cold regions and
competition in tropical regions.
Introduction
The distinction between terrestrial and marine ecosystems is the most prominent dichotomy in
the living world. Essentially, each of these types of ecosystems represents a no-go area for the
vast majority of the other one's inhabitants (Little, 1983; 1990). There are, however,
numerous groups of organisms originating in terrestrial habitats, which have recolonized the
marine environment (for a review, see Vermeij & Dudley, 2000). These are known as
secondary (or secondarily) marine organisms. The degree to which they became independent
10

of terrestrial habitats varies. Some (such as mangrove trees, and most marine mite and insect
species) are restricted to the littoral fringe. Others (sea turtles, seabirds and seals) are mainly
marine, but need to come to the shore during the reproductive season. Finally, others (sea
grasses, true sea snakes, dolphins and whales) became completely land-independent, and live
in either shallow coastal waters or even deep oceanic waters.
In explaining why such transitions took place, it is worth noting that the oceans
represent an enormous potential of space, matter and energy. Transfer of matter and energy
from marine to terrestrial ecosystems has been documented (e.g. Polis & Hurd, 1996), and
entire sea-dependent terrestrial communities are known (see Heatwole, 1971). However
marine resources are normally inaccessible to terrestrial organisms, which cannot withstand
long submersion periods, and can also be affected by high salinity values. To withstand these,
dramatic anatomical and physiological changes are necessary, and the incentive of copious
food resources may not provide sufficient selective pressure to this effect. More likely,
restrictive conditions in the environment of origin are responsible for these changes.
There is little information on the ecological factors that originally caused marine
organisms to invade land. It is known however that present-day marine organisms inhabiting
the upper littoral level of rocky shores are forced into this harsh habitat by competition
(Connell, 1961) and! or predators (Seed, 1969). What caused terrestrial life forms to go back
to the sea should be easier to understand, given the fact that some major invasions of the sea
by terrestrial biota happened relatively recently, and in taxonomic groups we are more
familiar with.
Historical factors are essential in explaining distribution patterns in manne
environments (Crame, 1993, 2000). One may therefore assume that, in certain groups of
secondary marine organisms, present-day biogeographical patterns can be meaningful in
indicating the habitat where the land-to-sea transition originally took place. The most obvious
candidates were those organisms, which are linked to terrestrial habitats by particUlar stages
in their life history, as they are constrained in expanding their distribution range by both
terrestrial (reproduction- and attachment-related), and marine (mainly feeding- and dispersal
related) factors. The present investigation into the biogeography of these organisms will
hopefully provide useful insights into the ecological background accounting for
recolonization of the marine environment, as well as into subsequent taxonomic
diversification within secondary marine groups.
11

Material and Methods
Twelve groups which are assumed to have independently colonized the marine environment
and subsequently diversified within it were considered (see Table 1); biogeographical
information for other groups is rather incomplete. The marine representatives in each of these
groups are currently thought to have resulted from the diversification of one single land-to-sea
transition, with the possible exception of the Combretaceae (Tomlinson, 1983) and Laridae
(which apparently are relatively recent colonizers from freshwater habitats - see Warheit,
1992).
To assess the species richness of each group, and for all considered groups taken
together, in various parts of the world, the world map was divided into 15 X 15 degrees of
latitude/longitude squares (288 squares in all - see Fig. 1). The area north of 30° N was
defined as northern; that between 30° N-30° S as tropical, and that south of 30° S, as southern.
A special attention was paid to the bands comprised between 30°-45° in each hemisphere,
further referred to as mid-latitude regions. The species from each group, currently breeding in
each square were counted, following a literature survey (see references in Table 1).
This resulted in a square-group matrix. To define world centres of secondary marine
diversity, the squares were arranged in decreasing order of total species number, and the one
hundred most speciose squares were mapped. To define any differences among faunas of
various world regions, this matrix (untransformed data) was used to calculate Euclidian
distances between the squares, and the results were plotted as an MDS (see Legendre, 1990;
Clarke, 1993). Only the 100 most speciose squares were used in this analysis, in order to point
out the richest species assemblages, and also to avoid overcrowding the plot. For this, I used
the SPSS (ver. 9.0) package for Windows.
To see where (in terms of latitude) each group reaches highe~/ lower concentrations,
the mean number of species per square was calculated for each of the twelve latitudinal belts.
12

~
w
Table 1. Groups of secondary marine organisms. All genera considered in the study include at least one sea-dependent species. Asterisks
mark: *genera with a few localized species living in terrestrial or freshwater habitats; ** genera with widespread species living in
terrestrial or fi:eshwater habitats. Sources: Tomlinson, 1986; Woodroffe & Grindrod, 1991; Ricklefs & Latham, 1993 (mangrove trees),
Cogger, 1975; Halliday & Adler, 1986; Dauner, 1988; Matz & Weber, 1988; Capula 1990; Castroviejo et aI., 1994; Keogh, 1998 (marine
reptiles), Tuck & Heinzel, 1979; Harrison, 1987; Howard & Moore, 1994 (seabirds), King, 1983; Reeves et aI., 1992; Novak, 1994
(seals).
Groups
Mangrove trees Combretaceae Sonneratiaceae Rhizophoraceae A vicenniaceae
Marine reptiles Chelonia Laticaudinae
Seabirds Sphenisciformes Procellariiformes
Pelecaniformes
Marine species
3 5 17 8
7 4
18 108
47
Laguncularia, Lumnitzera Sonneratia
Genera considered in the study
Bruguiera, Ceriops, Kandelia, Rhizophora Avicennia
Caretta, Chelonia, Dermochelys, Eretmochelys, Natator Laticauda*
Aptenodytes, Eudyptes, Eudyptula" Megadyptes, Pygoscelis, Spheniscus Bulweria, Calonectris, Daption, Diomedea, Fregetta, Fulmarus, Garrodia, Halobaena, Halocyptena, Hydrobates, Loomelania, Macronectes, Nesofregetta, Oceanites, Oceanodroma, Pachyptila, Pagodroma, Pelagodroma, Pelecanoides, Phoebetria, Procellaria, Pseudobulweria, Pterodroma, Puffin us, Thalassoica Fregatta, Morus, Nannopterum, Papasula, Pelecanus**, Phaeton Phalacrocorax**, Sula.

.......
..j::>.
Table 1. (continued).
Laridae
Alcidae
Seals Pinnipedia
58
22
32
Anous, Catharacta, Creagrus, Gabianus, Gygis, Larosterna, Larus * *, Pagophila, Procelsterna, Rhodostethia, Rissa, Sterna * *, Stercorarius, Thalasseus, Xema Aethia, Alca, Aile, Brachyramphus, Cepphus, Cerorhinca, Cyclorrhynchus, Fratercula, Lunda, Ptychoramphus, Synthliboramphus
Arctocephalus, Callorhinus, Cystophora, Erignathus, Eumetopias, Halichoerus, Hydnlrga, Leptonychotes, Lobodon, Mirounga, Monachus, Neophoca, Odobenus, Ommatophoca, Otaria, Phoca *, Phocarctos, Zalophus

Results
Regional and latitudinal patterns of distribution for secondary marine organisms in general
Higher levels of diversity in secondary marine organisms were found to occur in the tropical
and southern regions, with a lower diversity in the northern regions (Figure 1). In the tropics,
there were two major diversity centers: a very extensive one in the Indo-West Pacific, and a
smaller one in tropical America. The southern regions showed no clear pattern of high
diversity centers, rather, all sub-Antarctic locations had a relatively high diversity (Figure 1).
Largely glaciated latitudes (75°-900N and 600-900S) had impoverished faunas. The
other latitudinal bands, showed a clear tendency towards a bimodal distribution of the high
diversity squares for each hemisphere. Species richness was high in northern (45°-75°),
tropical (30°-30°) and southern regions (45°-60°), but low the mid-latitude regions (30°-45° in
each hemisphere). Only three squares in the northern mid-latitude band were counted among
the top one hundred most diverse, despite the fact that neighbouring bands, both to the north
and to the south had higher values. In a similar way, eight squares in the southern mid-latitude
band had top diversity values, with more squares in both neighbouring bands (Figure 1).
Northern, southern and tropical bands had markedly different faunas, which clustered
on the MDS as three different directions. The most distinct regions from the three categories
were the Behring Sea (northern), Indo-Malesia (tropical), and New Zealand and the sub
Antarctic islands (southern), corresponding to the largest agglomerations of high diversity
squares. The faunas locally intermixed, especially in mid-latitude areas, these having the least
differentiated faunas, and were grouped in the central part of the MDS (Figure 2).
Latitudinal patterns of individual secondary marine groups
Out of the twelve groups examined, six (Combretaceae, Rhizophoraceae, Sonneratiaceae,
Avicenniaceae, Chelonia and Laticaudidae) were typically tropical, one (Alcidae) typically
northern, one (Sphenisciformes) typically southern, and four (Procellariiformes,
Pelecaniformes, Laridae and Pinnipedia) cosmopolitan. Among the cosmopolitan groups, two
(pelecaniformes and Laridae) reached top species diversity in tropical regions, one
(procellariiformes) in southern regions and one (Pinnipedia) in both northern and southern
regions. No group of secondary marine organisms is best represented in mid-latitude regions
of each hemisphere (30°-45°) (Figure 3).
15

0\
75°- 900 N
60°- 75°N
45°- 600 N
30°- 45°N
15°- 300 N
0°_ 15°N
0°_ 15°S
15°- 300 S
30°- 45°S
~rAI'" I.i. I I .i. I I A 1.& 1"-'-1 IAI"-'I I 45°- 600 S
60°- 75°S
75°- 900 S
Figure 1. Areas of high diversity for selected groups (see Table 1) of secondary marine organisms_ Symbols: squares, northern; circles,
tropical; triangles, southern. Open symbols mark mid-latitude regions. The size of the symbols is roughly proportional to the number of
species within the squares (large symbols, more than 30; medium symbols, 20-29; small symbols, 12-19 species).

3 I
New Zealand . ~
• Kerguelen
•
• I / ~ >-' -...)
Antarctic N Peninsula • c •• 0 .~ -2 • c
Behring Sea cv E 0 -3
-6 -4 -2 a 2 4 Dimension 1
Figure 2. MDS plot for the 100 squares with high species diversity of secondary marine organisms marked in Figure 1. Stress: 0.12

Discussion
Two major patterns emerged from this study: the existence of different assemblages of
secondary marine organisms in northern, tropical and southern regions, and bimodal
distributions of species richness values in each hemisphere. The existence of distinct northern,
tropical and southern species assemblages is by no means unique to secondary marine
organisms; in fact this is the most obvious biogeographical pattern in the marine realm
(Briggs, 1974, 1995). On the other hand, the existence of three high-diversity latitudinal bands
in secondary marine organisms can be considered a major anomaly, and has not been
previously reported. Typically, both marine and terrestrial groups show a gradiental decrease
in species richness from the equator towards the poles (see Rohde, 1992 and references
therein). Although some observations relating to higher marine biodiversity in the southern, as
compared to northern, hemisphere have been made (Gray, 1996), and even substantiated for a
secondary marine group (Chown et aI., 1998; Chown & Gaston, 1999 for Procellariiformes), a
decrease in species richness in mid-latitudes has never been reported in any group, whether
defmed on taxonomic or ecological grounds.
Before trying to explain these patterns III relation to origination III the manne
environment, it is important to consider two aspects potentially limiting further interpretation.
Firstly, as these patterns were derived from analyses on a limited number of secondary
marine groups, it is questionable to what extent these are representative for the distributions of
secondary marine groups in general. The selection of the groups was dictated by both
availability and reliability of distribution information, which is only pertinent to organisms
with large body sizes, and these may show different patterns to smaller organisms (Gaston &
Blackburn, 1996). However, another study (Proche~ & Marshall, 2001) shows that the marine
ameronothroid mites (Acari: Oribatida) have similarly globally separated faunas and
bimodally distributed species numbers in each hemisphere, which indicates that these patterns
may be widespread among secondary marine organisms.
Secondly, as the present study included 329 species resulting from twelve land-to-sea
transitions, it is worth considering to what extent diversification following a transition leaves
room for interpreting present day biogeographical patterns as results of the conditions in
which the transition took place. For appreciating this, one needs to have a closer look at the
distribution patterns of individual groups (Figure 3). Only four of the twelve groups have a
cosmopolitan distribution, indicating range expansions from one latitudinal band to another;
18

the other groups are clearly centred in one of the bands with high species richness (northern,
tropical or southern). While strictly tropical distributions can be interpreted as the result of
climatic barriers, the distribution of the auks (Alcidae), limited to the northern hemisphere,
and that of the penguins (Sphenisciformes), to the southern hemisphere (although the two
groups almost meet on the western American coast), suggest that these are relatively new
groups with limited possibilities of expanding their distribution . .In a similar way, among
tropical groups, the sea snakes (Laticaudinae) and some groups of mangroves do not span
over the entire tropical band, but are limited to parts of it - presumably, those parts where they
originated (Figure 3, and references in Table 1).
4
3
2
o
4
3
2
o
N9075 60 45 30 15 0 15 30 45 60 75 908
A
-0-Combretaceae
-0-- Rhizophoraceae
~ Sonneratiaceae
~ Avicenniaceae
B
-0--Chelonia
-0-- Laticaudidae
N 90 75 60 45 30 15 0 15 30 45 60 75 90 S
6
4
2
o N9075 60 45 30 15 0 15 30 45 60 75 908
6
4
2
o
c -0- Sphenisciformes
-0-- Procellariiformes
~ Pelecaniformes
~ Lariformes
~AJcidae
D
1-0--Pinnipedia I
N 90 75 60 45 30 15 0 15 30 45 60 75 90 S
Figure 3. Average species richness for twelve groups of secondary marine organisms III
twelve latitudinal bands (see Material and Methods). A, mangrove trees; B, marine reptiles; C,
seabirds; D, marine mammals.
19

Therefore, my original assumption that possibilities of range expansion will be limited in
groups of secondary marine organisms with a degree of land dependency is largely supported,
and grants further interpretation of the observed patterns.
The high species richness in the tropical band can be explained either according to the
theory stipUlating higher speciation/lower extinction rates for tropical regions (see Chown &
Gaston, 2000), or by assuming higher rates of origination in the marine environment. The
latter would mean that, for some reason, the tropical environment is conducive for land-to-sea
transitions. It is generally accepted that biotic factors are essential in structuring complex
communities, such as those in the tropics (Grime, 1976, Wilson & Lee, 2000). It would be
therefore likely that biotic interactions are responsible for land-to-sea transitions in the
tropics. One example supporting this idea is the fact that mangrove trees can occur in
freshwater habitats (W oodroffe & Grindrod, 1991), but are generally displaced there by more
competitive species.
Explanations for the high diversity bands in the cold-temperate regIOns of each
hemisphere must be based on the assumption that these bands also have high origination rates.
According to Grime (1976), communities in extreme environments are mainly structured by
physical factors. Glaciation processes have been suggested to represent the most powerful
physical factor influencing the natural history of polar regions, both directly, by eliminating
species physiologically unable to cope with climatic change, and indirectly, by reducing
terrestrial food supply (Crame, 1992, 1993). Climatic changes have been shown to have
obvious effects in marine, as compared to terrestrial, environments. For example, it is known
that Antarctic terrestrial biota were almost completely eliminated as a result of glaciation
processes (but see Marshall & Coetzee, 2000), while marine littoral ecosystems remained
fairly species-rich all through the Cenozoic (Clarke & Crame, 1992). Numerous studies
suggest that the high species richness of secondary marine invertebrates in intertidal and
supralittoral zones of sub-Antarctic islands relates to glaciation processes (Chown, 1990,
1994; Marshall et al., 1999; Mercer et al., 2000) .
In summary, I present evidence in support of the independent origination of secondary
marine organisms in three latitudinal bands, and suggest that land-to-sea transitions within
these bands have been promoted by different factors: biotic interactions, such as competition,
in the tropical belt, and physical stress (represented in partiCUlar by glaciation processes) in
the cold regions.
20

Acknowledgements
The present study has been partly funded by the National Research Foundation (grant to
David J. Marshall) and the University of Durban-Westville. David J. Marshall (UDW) is
thanked for assistance with editing and structuring the manuscript; one anonymous referee for
some useful comments. Alexandru Iftime (National Museum of Natural History 'Grigore
Antipa', Bucharest) helped with the literature survey on the distribution of marine reptiles and
Antarctic seals.
References
Briggs JC. 1974. Marine Zoogeography . New York: McGraw-Hill.
Briggs JC. 1995. Global Biogeography . Amsterdam: Elsevier.
Capula M. (ed) 1990. The Macdonald Encyclopedia of Reptiles and Amphibians. London:
Macdonald Orbis.
Castroviejo J, Juste BJ, Perez-del-Val J, Castelo R, Gil R. 1994. Diversity and status of
sea turtle species in the Gulf of Guinea islands. Biodiversity and Conservation 3: 828-
836.
Chown SL. 1990. Possible effects of Quaternary climate change on the composition of insect
communities of the South Indian Ocean Province Islands. South African Journal of
Science 86: 386-391.
Chown SL. 1994. Historical ecology of sub-Antarctic weevils: patterns and processes on
isolated islands. Journal of Natural History 28: 411-433.
Chown SL, Gaston KJ. 1999. Patterns in procellariifonn diversity as a test of species-energy
theory in marine systems. Evolutionary Ecology Research 1: 365-373.
Chown SL, Gaston KJ. 2000. Areas, cradles and museums: the latitudinal gradient in species
richness. Trends in Ecology and Evoluton, 15: 311-315.
Chown SL, Gaston KJ, Williams PH. 1998. Global patterns in species richness of pelagic
seabird: the Procellariifonnes. Ecography 21: 342-350.
Clarke A, Crame JA. 1992. The Southern Ocean benthic fauna and climate change: a
historical perspective. Philosophical Transactions of the Royal SOciety, London B 338:
299-309.
Clarke KR. 1993. Non-parametric multivariate analyses of changes in community structure.
Australian Journal of Ecology 18: 117-143.
21

Cogger HG. 1975. The sea snakes of Australia and New Guinea. In Dunson W, ed. The
Biology of Sea Snakes. Baltimore: University Park Press, 59-139.
Connell JH. 1961. The influence of interspecific competition and other factors on the
distribution of the barnacle Chthamalus stellatus. Ecology 42: 710-723.
Crame JA. 1992. Evolutionary history in the polar regions. Historical Biology 6: 37-60.
Crame JA. 1993. Latitudinal range fluctuations in the marine realm through geological time.
Trends in Ecology and Evolution 8: 162-166.
Crame JA. 2000. Evolution of taxonomic diversity gradients in the marine realm: evidence
from the composition of Recent bivalve faunas. Paleobiology 26: 188-214.
Dauner H. 1988. Tortues terrestres et aquatiques. Paris: De Vecchio
Gaston KJ, Blackburn TM. 1996. Range-body size relationships: evidence of scale
dependence.
Gikos 75: 479-485.
Gray JS. 1997. Gradients in marine biodiversity. In: Ormond RFG, Gage ill, Angel MV, eds,
Marine Biodiversity. Patterns and processes. Cambridge: Cambridge University
Press, 19-34.
Grime JP. 1977. Evidence for the existence of three primary strategies in plants and its
relevance to ecological and evolutionary theory. American Naturalist 111: 1169-1194.
Halliday T, Adler K 1986. The Encyclopedia of Reptiles and Amphibians. Oxford: Equinox.
Harrison P. 1987. Seabirds of the World: A Photographic Guide. Princeton: Princeton
University Press.
Heatwole H. 1971. Marine-dependent terrestrial biotic communities on some cays in the
Coral Sea. - Ecology 52: 363-366.
Howard R, Moore A. 1994. A complete checklist of the birds of the world. ed. 2 - Academic
Press.
Keogh JS. 1998. Molecular phylogeny of elapid snakes and a consideartion of their
biogeographic history. Biological Journal of the Linnean Society 63: 177-203.
King JE. 1983. Seals of the world. ed. 2. Oxford: Oxford University Press.
Legendre P. 1990. Quantitative methods and biogeographic analysis, Pages In Garbary D,
South GR, eds, Evolutionary Biogeography of the Marine Algae of the North Atlantic.
Berlin: Springer-Verlag, 9-34.
22

Little C. 1983. The colonization of land. Origins and adaptations of terrestrial animals.
Cambridge: Cambridge University Press.
Little C. 1990. The terrestrial invasion: an ecophysiological approach to the origins of land
animals. Cambridge: Cambridge University Press.
Marshall DJ, Coetzee L. 2000. Historical biogeography and ecology of a Continental
Antarctic mite genus, Maudheimia (Acari: Oribatida): evidence for a Gondwanan
origin and Pliocene-Pleistocene speciation. Zoological Journal of the Linnean Society
129: 111-128.
Marshall DJ, Gremmen NJM, Coetzee L, OConnor BM, Pugh PJA, Theron PD,
Ueckermann EA. 1999. New records of Acari from the sub-Antarctic Prince Edward
Islands. Polar Biology 21: 84-89.
Matz G, Weber D. 1988. Guide des Amphibiens et Reptiles d'Europe, Paris: Delachaux et
Niest16.
Mercer RD, Chown SL, Marshall DJ. 2000. Mite and insect zonation on a Marion Island
rocky shore: a quantitative approach. Polar Biology 23: 775-784.
Novak R. 1994. Walker's Mammals of the World. Baltimore: Johns Hopkins University
Press.
Polis GA, Hurd SD. 1996. Linking marine and terrestrial food webs: Allochtonous input
from the ocean supports high secondary productivity on small islands and coastal land
communities. American Naturalist 147: 396-423.
Proche~~, Marshall DJ. 2001. Global distribution patterns of non-hal acarid marine intertidal
mites: implications for their origins in marine habitats. Journal of Biogeography 28:
47-58.
Reeves RR, Stewart BS, Leatherwood S. 1992. The Sierra Club Handbook of Seals and
Sirenians. San Francisco: Sierra Club.
Ricklefs RE, Latham RE. 1993. Global patterns of diversity in mangrove floras. In Ricklefs
RE, Schluter D, eds. Species Diversity in Ecological Communities: Historical and
Geographical Perspectives, Chicago: University of Chicago Press, 215-240.
Rohde K 1992. Latitudinal gradients in species-diversity - the search for the primary cause.
Gikos 65: 514-527.
Seed R. 1969. The ecology of Mytilus edulis (Lamellibranchiata) on exposed rocky shores. 2.
Growth and mortality. Gecologia 3: 317-350.
23

Tomlinson, PB. 1986. The botany of mangroves. Cambridge: Cambridge University Press.
Tuck GS, Heinzel H. 1979. A fieldguide to the seabirds of southern Africa and the world.
London: William Collins, Sons and Co.
Vermeij GJ, Dudley R. 2000. Why are there so few evolutionary transitions between aquatic
and terrestrial ecosysytems? Biological Journal of the Linnean Society 70: 541-554.
Warheit KI. 1992. A review of the fossil seabirds from the Tertiary of the North Pacific -
plate-tectonics, paleoceanography, and faunal change. Paleobiology 18: 401-424.
Wilson JB, Lee WG. 2000. C-S-R triangle theory: community-level predictions, tests,
evaluation of criticisms, and relation to other theories. Oikos 91: 77-97.
Woodroffe CD, Grindrod J. 1991. Mangrove biogeography: the role of Quaternary
environmental and sea-level change. Journal of Biogeography 18: 479-492.
24

Chapter III
Global distribution patterns of non-halacarid marine intertidal
mites: implications for their origins in marine habitats
Abstract
Aim We investigated the taxonomic, ecological and global biogeographical trends on non-
halacarid marine mites with a view to understanding their origins in the marine environment.
While halacarid mites are typicaly marine, numerous other mite taxa occupy littoral habitats,
including rocky-shores, boulder beaches, slat marshes and mangrove forest floors, and occur
in most geographical regions.
Location This study concerns the extant taxa of non-halacarid marine mite from intertidal
zones, worldwide.
Methods A literature survey was undertaken to compile the records for localities and habitats
of all the known species of non-halacarid intertidal mite. Simple analyses were used to
determine their taxonomic and geographical trends. A multivariate analysis was used to
compare how closely the biogeography of selected faunas conformed with the generally
accepted marine biogeographical zones.
Results Although the species records are incomplete because of variable sampling intensities
among regions, there is clear indication that these faunas are species-poor (only 162 species
were recorded in the literature). The records for some groups (ameronothroid and hyadesiid
mites), some habitats (rocky-shores) and some world regions (Eastern Atlantic-Boreal, Sub
Antarctic and Southern New Zealand) are apparently representative of the actual faunas,
whereas those for the mesostigmatid and non-halacarid prostigmatid mites, and mangrove and
salt marsh habitats, are clearly incomplete. The faunas comprise mites from four suborders;
mesostigmatid and prostigmatid mites comprise species to genus and species to family ratios,
relative to oribatid and astigmatid mites. These mite groups also differ with respect to
ecological and geographical attributes; ameronothroid (oribatid) and hyadesiid (astigmatid)
mites exibit wider generic geographical distributions and stronger marine trophic links.
Conclusions The emerging trends suggest different geological time-scales for the
evolutionary incursions into the marine environment by the mesostigmatid and prostigmatid
mite group and the oribatid and hyadesiid mite group. They suggest that members of the latter 25

have had longer associations with marine intertidal ecosystems. The origins of both groups are
also likely to differ of typically marine halacarid mites.
Introduction
Mites have successfully colonized most terrestrial and freshwater habitats on earth, including
the deserts and polar regions, but their colonization and radiation in the marine environment
has been markedly limited. With the exception of a single family, the Halacaridae
(Prostigmata), which shows a high degree of radiation within the marine environment (around
900 known species) and extends subtidally to the ocean depths (Bartsch, 1989; Abe, 1998; for
recent biogeographical syntheses), all other mite groups show limited radiation and are
restricted to littoral fringes (intertidal and supralittoral zones). This investigation undertakes to
characterize these limitations of non-halacarid mites in marine environments by considering
taxonomic, biogeographical and ecological patterns.
The restriction of non-hal acarid mites to fringe marine habitats suggests that they have
not completely transcended the stark ecological barrier between the marine and terrestrial
environments. As such they are extremely useful candidates for investigation, offering
numerous opportunities into understanding the evolutionary constraints and processes
involved in the transition from a terrestrial to a marine existence. However, only a single
study considers this subject and its scope is limited to a single mite taxon, the oribatid super
family Ameronothroidea (Weigmann & Schulte, 1977). Numerous investigations have
considered other aspects of the ecology of marine mites, specifically concerning community
structure, local distribution patterns and feeding behaviour patterns (Luxton, 1964, 1966,
1967a,b; Ganning, 1970; Schulte, Schuster & Schubart, 1975; Schulte 1975, 1976a,b;
Schuster, 1979; S0mme & Block, 1984; Pugh & King, 1985a,b, 1988; Buckling, Ernst &
Siemer, 1998; Mercer, Chown & Marshall, 2000). Most studies on marine mites, however,
deal with their taxonomy.
This study presents a compilation of all known records of non-halacarid marine mite,
as accessed from the primary taxonomic literature. In addition to taxonomic data,
geographical and ecological data were collated for each record. The emergent taxonomic,
geographical and ecological patterns are interpreted within the context of the origination and
antiquity of the acarine sub-orders. Our interpretation firstly and most importantly considers
the extent to which the records represent actual species numbers and actual faunas.
26

Materials and Methods
A list of records of non-halacarid mite species was compiled from a literature survey (see
Appendix). The habitat (e.g. rocky-shore, mangrove) and geographical region of each record
were noted. With respect to vertical position on the shore, we considered only the intertidal
species. Species found in the supralittoral zones only were not included in the list as these
zones are poorly defined and highly likely to contain numerous "tourists" (see Gaston et al.,
1993) from adjacent terrestrial habitats. Species that occur in both the supralittoral and
intertidal zones were however included. Where the distinction between these two levels was
not made clear in the primary literature, the records were omitted, as were parasitic species
(e.g. Halarachnidae). Intermediate taxonomic levels (sub-species, sub-genus) were not taken
into account. All reference to marine mites, except where otherwise stated, refers to taxa other
than the Halacaridae. Whereas the global biogeographical regions are widely accepted for
terrestrial biota, few attempts have been made to derive a similar synthesis for the marine
biota. Most marine biogeographical studies focus on regional distributions; the Indo-West
Pacific and Antarctic regions in particular have been well studied (for recent examples see
Briggs, 1999; Glasby & Alvarez, 1999). Probably the most recognized world biogeography
for the littoral and shelf biota is that proposed by Briggs (1974). We used Briggs's scheme in
our analyses, but modified this in order to 1) simplify the terminology, 2) remove the sub
regions identified as provinces, and 3) include only the regions from which mites have been
recorded. Hong Kong, which falls on the limit between the Indo-West Pacific and Japan
regions, was considered part of the Indo-West Pacific. Briggs distinguishes five broad
latitudinal, "climatic" zones: northern cold-temperate, northern warm-temperate, tropical,
southern warm-temperate and southern cold-temperate. Seventeen regions nested within these
zones were found to contain non-halacarid marine mites (see Figure 1).
To assess the degree of conformity of the mite faunas to the global manne
biogeographical reglOns, a multivariate analysis was performed, specifically a
multidimensional scaling procedure (MDS). A matrix was established to assess the number of
species in each hyadesiid and ameronothroid genus for each biogeographical region. Genera
which were recorded from only one region, as well as regions containing a single genus, were
excluded from the data set. Euclidean distances among the regions were calculated from
untransformed data. The results were plotted in a two-dimension ordination, which included
the zero coordinate lines. The data sets closest to the intersection of the coordinates were
27

considered to have the least individualized (common) fauna, while those furthest apart, the
most individualized (disparate) fauna. The analysis was performed using SPSS Ver. 9.0
(1999) for Windows.
Sub-Antarctic Southern
New Zealand
Figure 1. Littoral biogeographical regions of the world (thin line) and climatic zones (thick
line) based on those of Briggs (1975). Only the regions in which non-halacarid mites occur
are named.
Results
Taxonomic patterns
The species richness of mites living in intertidal habitats worldwide is notably low; only 162
species have been recorded from these habitats. These species are taxonomically partitioned
among four mite sub-orders (Meso stigmata, Pro stigmata, Oribatida and Astigmata), 21
families and 44 genera. The partitioning of the families and genera within the sub-orders is
remarkably skewed. Despite notably more species belonging to the Oribatida and Astigmata
than to the Mesostigmata and Prostigmata, the latter two orders comprise more than three
times as many families (Table 1, Appendix). More than half of the known marine mite species
(57%) belong to two higher taxonomic groups, the Ameronothroidea (Oribatida) (27%) and
28

the Hyadesiidae (Astigmata) (30%). The Arneronothroidea, which contains the families
Arneronothridae, Fortuyniidae and Selenoribatidae, comprises 93% of the marine oribatid
mite species. The Arneronothridae comprises only two marine genera, with the other thirteen
belonging to the latter two families. All of the marine astigmatid mite genera and species
belong to the single family, Hyadesiidae (see Appendix).
Ecological patterns
Non-halacarid mites have been collected from intertidal zones of rocky-shores, boulder
beaches, salt marshes and mangroves, but not from the intertidal zone of sandy shores. By far
the majority of species are found on rocky-shores (and boulder beaches) (91 %). In most cases
they are specific to rocky-shore habitats, and do not extend distributions to the other intertidal
habitats. The Astigmata are only found on rocky-shores and boulder beaches, unlike the other
sub-orders, which are represented in all of the above intertidal habitats.
Table 1. Number of species, genera and families for each of the four sub-orders of marine
mites and for all marine mites (halacarid mites excluded).
Sub-orders Lower taxa Species Genera Families
Mesostigmata 32 16 9 Pro stigmata 37 14 8 Oribatida 45 13 4 Astigmata 48 2 1
All intertidal non-halacarid mites 162 44 21
Geographical patterns
Most non-halacarid intertidal mite species (73%) are contained within only four geographical
regions, Indo-West Pacific, East Atlantic-Boreal, Southern New Zealand and Sub-Antarctic.
The remaining species (27%) are distributed among fourteen other regions (Table 2). Whereas
the cold-temperate and tropical regions are relatively species rich, the warm-temperate regions
of both hemispheres are conspicuously species poor (Table 2). Most mesostigmatid and
29

prostigmatid mite genera are restricted to a single geographical region; a few genera, however,
are more widely distributed (Leioseius, Hydrogamasus, Nanorchestes, Microtrombidium; see
Figure 2). In contrast, the major oribatid and astigmatid mite genera are globally widespread
(Figures 3 and 4).
The Ameronothroidea is represented in most of the manne littoral geographical
regions (Figure 3). The genera of the Ameronothridae are bipolar and to a greater extent are
contained within the limits of the cold-temperate zones, whereas the other two families,
Fortuyniidae and Selenoribatidae, have mainly tropical to warm-temperate distributions
(Figures 1 and 3). The two major marine ameronothrid genera are either strictly Holarctic, as
in the case of Ameronothrus (assuming that A. bilineatus Michael, 1888 recorded from
southern Africa, and A. schneideri Oudemans, 1903 from Curayao in the Caribbean are
introduced), or largely confined to the Antarctic and Sub-Antarctic regions, as in the case of
Halozetes (Figure 3).
The astigmatid mite family Hyadesiidae shows a similarly wide distribution to that of
the Ameronothroidea (Figure 4). Although there is slight overlap in the latitudinal distribution
of the two hyadesiid genera, Hyadesia and Amhyadesia, there is a tendency for the prevalence
of the former in cold-temperate regions, and the latter in the warm-temperate to tropical
regions (Figure 4). At the species level, Amhyadesia heterophalius Fain & Schuster, 1984 and
Fortuynia elamellata Luxton, 1967, are particularly widely distributed, extending over most
of the Indo-West Pacific region. Extensive specific distributions are also seen in the Northern
Hemisphere species, Ameronothrus nigrofemoratus Koch, 1879 and A. lineatus Thorell, 1871,
and in the Antarctic Halozetes belgicae (Michael, 1903) and H marinus (Lohmann, 1907)
(Table. 3). Levels of generic and specific endemism are difficult to assess given the
uncertainty regarding the completeness of the records. However, there is a higher degree of
local distribution of species and genera among the Mesostigmata and Prostigmata than among
the Oribatida and Astigmata. The ordination of the ameronothroid and hyadesiid mite genera
shows three distinct clusters, which approximately coincide with the northern temperate,
tropical and southern temperate zones of Briggs (1974; Figure 5). The first cluster comprises
the Arctic, Eastern Pacific-Boreal, Western and Eastern Atlantic-Boreal, California and
Mediterranean-Atlantic. The second cluster groups the Tropical Eastern Pacific, Tropical
Western Atlantic and Indo-West Pacific together with Northern New Zealand, and the third
30

Table 2. The representation of mite species in the marine biogeographical regions ofthe world (based on Briggs 1974).
Regions Sub-orders Total number of species
Mesostigmata Prostigmata Oribatida Astigmata
Arctic 3 3 Eastern Pacific-Boreal 1 2 3 Eastern Atlantic-Boreal 16 13 6 2 37 Western Atlantic-Boreal 2 2 California 1 2 3 Mediterranean-Atlantic 6 3 9 Japan 1 1 2 Tropical Eastern Pacific 1 5 1 7 Tropical Western Atlantic 2 1 1 3 7 Indo-West Pacific 6 9 17 9 41
w Eastern South America 2 1 3 ........ Southern Africa 3 1 1 6 11
Northern New Zealand 5 2 2 4 13 Southern South America 2 1 3 Southern Australia 2 1 3 Southern New Zealand 9 5 1 5 20 Su b-Antarctic 2 4 6 4 16 Antarctic 4 4 2 3 13

cluster comprises Southern Africa, Southern South America, Southern New Zealand, Sub
Antarctic and Antarctic. The most disparate regions for each of the three climatic zones are
East Atlantic-Boreal, Indo-West Pacific and Sub-Antarctic, while the least disparate are
Western Atlantic-Boreal, Tropical Western Atlantic and Southern Africa, respectively. The
clusters conform with the patterns for the ameronothroid genera, in particular (Ameronothrus
- northern, Fortuyniidae and Selenoribatidae - tropical, Halozetes - southern; Figure 3).
gjCGLO
Figure 2. Global distributions of mesostigmatid (lower case) and prostigmatid (upper case)
mite genera . Different letters represent different genera, as follows: a, Arctoseiodes; b,
Leioseius; c, Pontiolaelaps; d, Ha lola elaps; e, Macrocheles; f, Parasitus; g, Hydrogamasus;
h, Litogamasus; j, Parasitiphis; k, Tangaroellus; 1, Vulgarogamasus; m, Thinozercon; n,
Deraiophorus; 0, Phaulodinychus; p, Uroobovella; r, Cyrthydrolaelaps; A, Bdella; B,
Neomolgus; C, Ereynetes; E, Abrolophus; F, Balaustium; G, Eupodes; H, Halotydeus; L,
Nanorchestes; M, Foveacheles; N, Robustocheles; 0, Microtrombidium; P, Platytrombidium
and R, Lasiotydeus.
32

Discussion
Species richness versus species records
Although mites are among the most species-rich taxa, much of their diversification and
radiation is restricted to certain habitats, environments, and regions. Whereas soil habitats and
tropical rainforests are typically rich in species (see Walter & Behan-Pelletier, 1999), species
richness declines considerable in the desert, alpine and polar regions. Speciation and radiation
of mites in marine intertidal habitats is markedly constrained, and this is indicated by the
relatively few species recorded worldwide (162). Halacarid mites (Prostigmata: Halacaridae)
are however the exception. The group comprises relatively many species (around 900) and is
ecologically diverse, extending distributions to the ocean depths (for a review of the
biogeography of the halacarid mites see Bartsch, 1989).
Ha/ozetes • Ameronothru
I Forluynia .Schusteria +other genera 00
o 0
o
o o
o
Figure 3. Global distributions of the ameronothroid mite genera.
33

While the recorded number of species of marine mite is certainly an underestimate of the
actual number, the records are seemingly representative of some regions and for some
taxonomic groups. For example, the records from the Eastern Atlantic-Boreal, the Sub
Antarctic and Southern New Zealand, which have been extensively studied, probably closely
match the actual species number in these regions (Schulte, 1975; Schulte et aI., 1975; Pugh &
King, 1985; Luxton 1986b, 1992a,b, and also note the number of collection localities in Figs.
2, 3, and 4). Conversely, those records from the northern and southern warm-temperate
regions may be an underestimate of the actual species number. These regions may be expected
to contain more species than the cold-temperate regions, given the generally accepted inverse
relationship between species richness and latitude (Table 2; see Rosenzweig, 1997). However,
the observed bimodal relationship of species number against latitude in the southern and
I Hyadesia
eAmhyadesia
I I II
Figure 4. Global distributions of the hyadesiid mite genera.
34
e' "
~ III
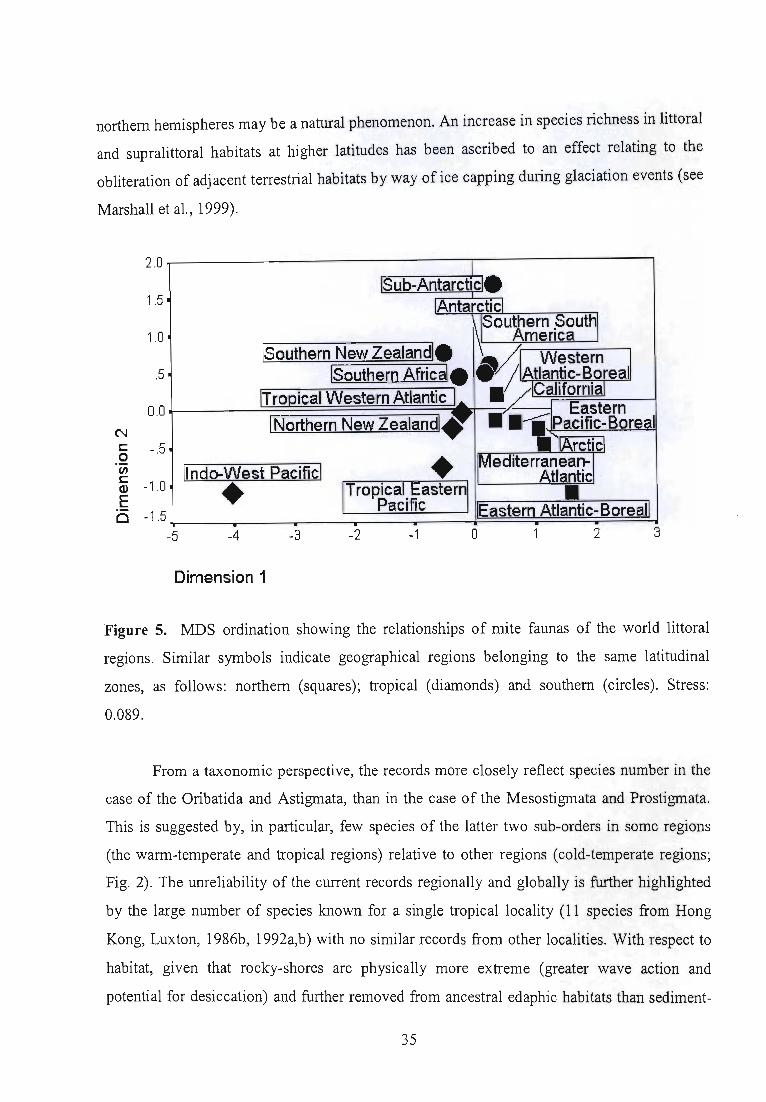
northern hemispheres may be a natural phenomenon. An increase in species richness in littoral
and supralittoral habitats at higher latitudes has been ascribed to an effect relating to the
obliteration of adjacent terrestrial habitats by way of ice capping during glaciation events (see
Marshall et al., 1999).
2.0
1.5 ISub-Antarctic.
IAntarctici
1.0
.5
0.0
N £: -.5 0 'in £:
-1 .0 Q)
E 0 -1 .5
1\ Southern ,Southl Amenca
ISouthern New Zealandl. ,,~ Western III ISouthern Afric~. /IAtlantic-Boreal
_/-Icalifornial ITrol2ical Western Atlantic L ... Eastern
I Northern New Zealandl# - _-. Pacific-Boreal _IArctici
+ Mediterranean-:~ lindo-West Pacificl Atlantic + ITropical, Eastern\ • PaCific IEastern Atlantic-Boreall . --5 -4 -3 -2 -1 o 2 3
Dimension 1
Figure 5. MDS ordination showing the relationships of mite faunas of the world littoral
regions. Similar symbols indicate geographical regions belonging to the same latitudinal
zones, as follows: northern (squares); tropical (diamonds) and southern (circles). Stress:
0.089.
From a taxonomic perspective, the records more closely reflect species number in the
case of the Oribatida and Astigmata, than in the case of the Mesostigmata and Prostigmata.
This is suggested by, in particular, few species of the latter two sub-orders in some regions
(the warm-temperate and tropical regions) relative to other regions (cold-temperate regions;
Fig. 2). The unreliability of the current records regionally and globally is further highlighted
by the large number of species known for a single tropical locality (11 species from Hong
Kong, Luxton, 1986b, 1992a,b) with no similar records from other localities. With respect to
habitat, given that rocky-shores are physically more extreme (greater wave action and
potential for desiccation) and further removed from ancestral edaphic habitats than sediment-
35

based mangrove and salt marsh habitats, the latter may be expected to contain more species.
The relatively few species known from these habitats (see Appendix) suggests an
incompleteness of the records.
Origin and speciation in marine environments
Despite inconsistencies in the reflection of the records of marine mites with the supposed
number of species, distinctive patterns emerge from the records, which warrant further
interpretation. Taxonomic, ecological and geographical patterns all suggest that the current
faunas of the Astigmata and Oribatida have had a long association (in geological time) with
the marine environment. In contrast, the faunas of mesostigmatid and prostigmatid mites are
relatively recent in marine habitats, in evolutionary terms. The first line of support of this
antiquity assumption for the ameronothroid (Oribatida) and hyadesiid (Astigmata) mites arises
from the broad generic (Figures 3 and 4) and specific geographical distribution, in the light of
dispersal constraining life history characteristics. Unlike most marine invertebrates, which
may produce vast numbers of swimming pelagic larvae, these mites produce relatively few
crawling larvae, a regression from their ancestral terrestrial lifestyles, which theoretically
constrains their capacity to disperse in the marine environment. An increase in species range
is, however, not limited to vicariant events, but may also take place by means of incidental
dispersal, eventually leading to a greater regional distribution through a stepping-stone effect
(Kensler & Crisp, 1965; and see Myers & Giller, 1988).
Additionally, the long association of ameronothroid and hyadesiid mites with marine
environments is suggested by the closeness with which the biogeographical trends of the
fauna matches those of typically marine faunas, rather than complying with terrestrial trends
(see Figure 5; Briggs, 1974). Furthermore, ameronothroid and hyadesiid mites have strong
trophic links within marine systems, indicated by their prevalence for feeding on marine plant
taxa (Buckling et aI., 1998). Characters underpinning their capacity for an evolutionary long
existence in marine environments must relate to low rates of speciation and extinction. Both
mite groups are characterized by relatively low reproductive rates, which will lower the rate of
loss of those genetic attributes most suitable for a marine existence, but potentially also lower
rates of speciation (Norton, 1994; OConnor, 1994). Speciation influenced by physiological
adaptations will be limited in cases where the physiological capacity is wide, and enables
greater survival of extreme environmental conditions. A wide physiological capacity is
36

suggested by the tropical and polar distributions of Hyadesia, and has also been proposed as
characteristic of some ameronothroids (see Block & Convey, 1995). Indeed, the ability to
survive extremely variable environmental conditions may be key to the long-term persistence
of these mites in the physically variable intertidal zones.
The geographical distributions, species to genus partitioning, and the predacious
lifestyle of many species of mesostigmatid and prostigmatid mite suggest that they have
relatively recently colonized intertidal habitats. Even though the available records are limited
in this case, the generally restricted geographical distributions of the genera and species
indicate a relatively short time frame for dispersal. The relatively high ratios for number of
species to number of genera, and species and genera to families (Table 1), suggests a greater
rate of speciation (and possibly extinction) of these mites compared to the ameronothroid and
hyadesiid mites. In some respects these ratios agree with their relatively more rapid
reproductive rates compared to those of ameronothroid and hyadesiid mites. Loose trophic
links within the marine environment of mesostigmatid and prostigmatid mites are indicated
particularly in the predacious species which are known to feed on secondary marine taxa such
as mites, tardigrades and collembolans (Schuster, 1979). Limitations on a high quality food
supply coupled with the likelihood of high metabolic requirements are possible factors
constraining water-borne dispersal of these mites in marine environments.
In sum, although the records are clearly incomplete for some taxonomic groups, some
geographical regions and some habitat types, the patterns that emerge for the taxonomy,
geography and ecology of non-halacarid marine mites strongly suggest different underlying
processes for the present day taxa of the four sub-orders. During the course of their evolution,
predacious mesostigmatid and prostigmatid mites have presumably undergone numerous
independent incursions into intertidal habitats from adjacent, local supralittoral and terrestrial
habitats, rather than having diversified to any degree within the marine environment. In
contrast, the present day oribatid and astigmatid mite taxa have apparently been associated
with the marine environment for a long geological time.
37

Acknowledgements
This study was supported by grants from the National Research Foundation (NRF) and the
University of Durban-Westville.
References
Abe H. 1996. Rhombognathine Mites. Taxonomy, Phylogeny, and Biogeography. Sapporo:
Hokkaido University Press.
Bartsch I. 1989. Marine Mites (Halacaroidea: Acari) A geographical and ecological survey.
Hydrobiologia 178: 21-42.
Block W, Convey P. 1995. The biology, life cycle and ecophysiology of the antarctic mite
Alaskozetes antarcticus. Journal of Zoology 236: 431-449.
Briggs Jc. 1974. Marine zoogeography . New York: McGraw-Hill Bok Company.
Briggs JC. 1999. Modes of speciation: Marine Indo-West Pacific. Bulletin of Marine Science
65: 645-656.
Bucking J, Ernst H, Siemer F. 1998. Population dynamics of phytophagous mites inhabiting
rocky shores - K -strategists in an extreme environment? Biosystematics and Ecology
Series 14: 93-143.
Fain A. 1981. Notes on the Hyadesiidae and Algophagidae, nov. tax. with a rediscription of
Hyadesia curassaviensis and Hsellai. Acarologia 22: 47-61 .
Fain A, Ganning B. 1989. Notes on Hyadesiid mites (Acari, Hyadesiidae) from North
America with description of a new species. Bulletin de l'Institut des Sciences
Naturelles de Belgique. Entomologie 59: 161-164.
Fain A, Schuster R. 1984a. Four new species of the genus Amhyadesia from the intertidal
zone from several Indo-Pacific islands. International Journal of Acarology 10: 103-
111.
Fain A, Schuster R. 1984b. Two new species of mites of the family Hyadesiidae from Costa
Rican and Brazilian coasts. Acarologia 25: 271-279.
Fain A, Schuster R. 1985. New observations on the Hyadesiidae description of three new
species of the genus Hyadesia. Acarologia 26: 67-77.
Fain A, Schuster R. 1986. First record of the mite family Hyadesiidae from the Madeira
Archipelago. Bocagiana 99: 1-10.
38

Fain A, Synnot R. 1981. Hyadesia australiana sp. n. from south-eastern Australia. Bulletin
Annuelle Societe Royale BeIge. Entomologie 117: 195-201.
Ganning B. 1970. Population dynamics and salinity tolerance of Hyadesia fusca from
brackish water rockpools, with notes on the microenvironment inside Enteromorpha
tubes. Oecologia (Berlin) 5: 127-137.
Gaston KJ, Blackburn TM, Hammond PM, Stork NE. 1993. Relationships between
abundance and body size: where do tourists fit? Ecological Entomology 18: 310-314.
Glasby CJ, Alvarez B. 1999. Distribution patterns and biogeographic analysis of Austral
Polychaeta (Annelida). Journal of Biogeography 26: 507-533 .
Grandjean F. 1966. Selenoribates mediterraneus n. sp. et les Selenoribatidae (Oribates).
Acarologia 8: 129-154.
Grandjean F. 1968. Schusteria littorea n. g., n. sp. et les Selenorabitidae (Oribates).
Acarologia 10: 116-150.
Kensler CB, Crisp DJ. 1965. The colonization of artificial crevices by marine invertebrates.
Journal of Animal Ecology 34: 507-516.
Luxton M. 1964. Some aspects of the biology of saltmarsh Acarina. Acarologia (Comptes
rendus ler Congres International d'Acarologie) pp. 172-182.
Luxton M. 1966. Laboratory studies on the feeding habits of saltmarsh Acarina, with notes on
their behaviour. Acarologia 8: 63-174.
Luxton M. 1967a. The ecology of saltmarsh Acarina. Journal of Animal Ecology, 36: 257-
277.
Luxton M. 1967b. The zonation of saltmarsh Acarina. Pedobiologia 7: 55-66.
Luxton M. 1986a. A new species of Fortuynia (Acari: Cryptostigmata) from the marine
littoral of Kenya. Journal of Natural History 20: 65-69.
Luxton M. 1986b. Mites (Arachnida) from the coast of Hong Kong. The Marine Flora and
Fauna of Hong Kong and Southern China (ed. by B. Morton), pp. 667-671. Hong
Kong: Hong Kong University Press.
Luxton M. 1989. New taxa of intertidal mites. Journal of Natural History 23: 407-428.
Luxton M. 1990. The marine littoral mites of the New Zealand region. Journal of the Royal
Society of New Zealand 20: 367-418.
39

Luxton M. 1992a. Oribatid mites from marine littoral of Hong Kong. The Marine Flora and
Fauna of Hong Kong and Southern China III (ed. by B. Morton), pp. 211-227. Hong
Kong: Hong Kong University Press.
Luxton M. 1992b. Hong Kong hyadesiid mites (Acari : Astigrnata). The Marine Flora and
Fauna of Hong Kong and Southern China III (ed. by B. Morton), pp. 229-236. Hong
Kong: Hong Kong University Press.
Marshall DJ, Gremmen NJM, Coetzee L, OConnor BM, Pugh PJA, Theron PD,
Ueckermann EA. 1999. New records of Acari from the sub-Antarctic Prince Edward
Islands. Polar Biology 21: 84-89.
Marshall DJ, Nunkumar S. 1999. First records and descriptions of the marine littoral genus
Amhyadesia Fain & Ganning 1979 (Acari: Astigrnata: Hyadesiidae) from southern
Africa. South African Journal of Zoology 34: 173-179.
Marshall DJ, Pugh PJA. 2001a. Two new species of Schusteria (Acari: Oribatida:
Ameronothoidea) from marine shores in southern Africa. African Zoology, 35: 201-
205.
Marshall DJ, Pugh PJA. 2001b. Fortuynia (Acari: Oribatida: Ameronothoidea) from the
marine littoral of southern Africa. Journal of Natural History, in press.
Marshall DJ, Ugrasen K. 2000. Three new species of the marine littoral genus Hyadesia
(Parahyadesia) (Acari: Astigmata: Hyadesiidae) from southern Africa. South African
Journal of Zoology 35: 85-92.
Mercer RD, Chown SL, Marshall DJ. 2000. Mite and insect zonation on a Marion Island
rocky shore: a quantitative approach. Polar Biology 23: 775-784.
Myers AA, Giller PS. 1988. Analytical Biogeography - an integrated approach to the study of
animal and plant distributions. London: Chapman & Hall.
Norton RA. 1994. Evolutionary aspects of oribatid mite life histories and consequences for
the origin of the Astigrnata. Mites, ecological and evolutionary analyses of life-history
patterns. (ed. by M.A. Houck) pp. 99-135. London: Chapman & Hall.
OConnor BM. 1994. Life-history modifications in astigmatid mites. Mites, ecological and
evolutionary analyses of life-history patterns. (ed. by M.A. Houck) pp. 136-159.
London: Chapman & Hall.
Pugh PJA. 1993. A synonimic catalogue of the Acari from Antarctica, the sub-Antarctic
Islands and the Southern Ocean. Journal of Natural History 27: 323-421.
40

Pugh PJA, King PE. 1985a. Seasonality in some British intertidal Acari. Journal of Natural
History 20: 653-666.
Pugh PJA, King, PE. 1985b. The vertical distribution of the British intertidal Acari - the non
halacarid fauna (Arachnida: Acari). Journal of Zoology 207: 21-33.
Pugh PJA, King PE. 1988. Acari of the British supralittoral. Journal of Natural History 22:
107-122.
Rosenzweig ML. 1997. Species diversity in space and time (third edition). Cambridge:
Cambridge University Press.
Schatz H. 1998. Oribatid mites of Galapagos Islands - faunistics, ecology and speciation.
Experimental and Applied Acarology 22: 373-409.
Schulte G. 1975. Holoarlctische Artareale der Ameronothridae (Acari, Oribatei).
Veroffentlichungen des Institutes fur Meeresforschung in Bremerhaven 15: 339-357.
Schulte G. 1976a. Zur Nahrungsbiologie der terrestrischen und marinen Milbenfamilie
Ameronothridae. Pedobiologia 16: 332-352.
Schulte G. 1976b. Gezeitenrythmische Nahrungsaufuahme und Kotballenablage emer
terrestrischen Milbe (Oribatei: Ameronothridae) im marinen Fe1s1itoral. Marine
Biology 37: 265-277.
Schulte G. 1978. Die Kustenbindung terrestrischer Arthropoden und ihre Bedeutung flir den
Wandel des Okosystems "marines Fe1slitoral" in unterschiedlichen geographischen
Breiten. Mitteilungen des Deutsches Gesellschaft fur Allgemeine und Angewandte
Entomologie 1: 211-219.
Schulte G, Schuster R, Schubart H. 1975. Zur Verbreitung und Okologie der
Ameronothriden (Acari, Oribatei) in terrestrischen, limnischen und marinen
Lebensraumen. Veroffentlichungen des Institutes for Meeresforschung in Bremerhaven
15: 359-385.
Schuster R. 1979. Soil mites in the marine environment. Recent Advances in Acarology 1:
593-602.
Schuster R, Bartsch I. 1986. Order Acari (mites and ticks). Marine Fauna and Flora of
Bermuda (ed. W.Sterrer) pp . 270-275. New York: John Wiley & Sons.
van der Hammen L. 1960. Fortuynia marina nov.gen., nov.spec ., an oribatid mite from the
intertidal zone in Netherlands New Guinea. Zoologische Mededelingen, Leiden 37: 1-
9.
41

van der Hammen L. 1963. Description of Fortuynia yunkeri nov. spec., and notes on the
Fortuyniidae nov. fam. (Acarida, Oribatei). Acarologia 5: 152-167.
Walter DE, Behan-Pelletier V. 1999. Mites in forest canopies: Filling the size distribution
shortfall? Annual Review of Entomology 44: 1-19.
Weigmann G, Schulte G. 1977. The evolution of the family Ameronothridae (Acari:
Oribatei). II. Ecological aspects. Acarologia 19: 167-173.
Appendix. List of non-halacarid intertidal mites of the world. Numbers in parantheses after
species names refer to publications used in compiling this table, as follows: 1, Pugh & King
1985; 2, Luxton 1990; 3, Marshall & Proche~, unpublished data; 4, Pugh, 1993; 5, Pugh &
King 1988; 6, Luxton 1986b; 7, van der Hammen 1963; 8, van der Hammen 1960; 9, Schulte
et al. 1975; 10, Fain & Ganning 1989; 11, Luxton 1992a, 12, Luxton 1986a; 13, Schatz 1998;
14, Grandjean 1968; 15, Marshall & Pugh 2000; 16, Grandjean 1966; 17, Marshall &
Nunkumar 1999; 18, Luxton 1992b; 19, Fain & Schuster 1984b; 20, Fain & Schuster 1984a;
21, Fain & Schuster 1986; 22, Marshall & Ugrasen 2000; 23, Luxton 1989; 24, Fain 1981; 25,
Fain & Schuster 1985; 26, Fain & Synnot 1981; 27, Schuster & Bartsch 1986, 28, Marshall &
Pugh, 2001. Shore habitats: M, mangroves; R, rocky-shores and boulder beaches; S,
saltmarshes. Information on distribution is based on the geographic regions of Briggs (1974) -
see methods and Figure 1 for details . Localities are given in parentheses in the case of large
and heterogeneous regions.
Taxa
MESOSTIGMATA
Ascidae Voigts & Oudemans, 1905 Arctoseiodes ibericus Willmann, 1949 (1) Leioseius australis Luxton, 1984 (2)
Leioseius vallaensis Luxton, 1989 (23) Leioseius sp. 1 (3)
42
Shore habitat
Geographical distribution
R Eastern Atlantic-Boreal R Northern New Zealand;
Southern New Zealand: Nelson
R Southern Australia R, Indo-West Pacific: M KwaZulu-Natal; Southern
Africa

Appendix. (continued)
Leioseius sp. 2 (3)
Digamasellidae Evans, 1957 Pontiolaelaps salinus Luxton, 1989 (2) Pontiolaelaps crenatus Luxton, 1984 (2) Pontiolaelaps terebratus Luxton, 1984 (2)
Halolaelapidae Karg, 1965 Halolaelaps celticus Halbert, 1915(1) Halolaelaps marinus Brady, 1875 (1)
Macrochelidae Vitzthum, 1930 Macrocheles glaber (Muller, 1860) (1) Macrocheles superbus (Hull, 1918) (1)
Parasitidae Oudemans, 1901 Parasitus kempersi Oudemans, 1902 (1)
Rhodacaridae Oudemans, 1902 Hydrogamasus giardi (Berlese & Trouessart, 1889) (1) Hydrogamasus kensleri Luxton, 1967 (2)
Hydrogamasus salinus (Laboulbene, 1851) (1) Hydrogamasus sp. (27)
Litogamasusfalcipes Lee & Hunter, 1974 (2) Litogamasus setosus (Kramer, 1898) (2) Litogamasus sp. (4) Parasitiphis brunneus (Kramer, 1898) (4) Parasitiphis jeannelli (Andre, 1947) (2)
Parasitiphis aurora Lee, 1970 (2)
Tangaroellus porosus Luxton, 1968 (2)
Vulgarogamasus trouessarti (Berlese) (1)
Thinozerconidae Halbert, 1915 Thinozercon michaeli Halbert, 1915 (5)
43
M
R R R
R R
R R
R
R
R
R,S R
R R R R R
R
R
R
R
Indo-West Pacific : KwaZulu-Natal
Southern New Zealand Northern New Zealand Northern New Zealand
Eastern Atlantic-Boreal Eastern Atlantic-Boreal
Eastern Atlantic-Boreal Eastern Atlantic-Boreal
Eastern Atlantic-Boreal
Eastern Atlantic - Boreal
Northern New Zealand; Southern New Zealand; Sub-Antarctic Eastern Atlantic-Boreal Tropical western Atlantic: Bennuda Southern New Zealand Southern New Zealand Antarctic Antarctic Southern New Zealand; Sub-Antarctic; Antarctic Southern New Zealand; Sub-Antarctic; Antarctic Northern New Zealand; Southern New Zealand Eastern Atlantic-Boreal
Eastern Atlantic-Boreal

Appendix. (continued)
Uropodidae Berlese, 1900 Deraiophorus sp. (27) R Tropical western Atlantic:
Bermuda
Phaulodinychus orchestiidarum Barrois (5) R,S Eastern Atlantic-Boreal
Uroobovella magna Hiramatsu & Hirschmann, 1977 M Japan; Indo-West Pacific :
(6) Hong Kong
Uroobovella sp. (3) M Indo-West Pacific: KwaZulu-Natal
Veigaiidae Oudemans, 1939 Cyrthydrolaelaps hirtus Berlese, 1905 (1) R Eastern Atlantic-Boreal
Cyrthydrolaelaps incisus Evans (1) Eastern Atlantic-Boreal
PRO STIGMATA
Bdellidae Duges, 1834 Bdella decipiens Thorell, 1872 (1) R Eastern Atlantic-Boreal
Bdella interrupta Evans, 1954 (1) R Eastern Atlantic-Boreal
Neomolgus littoralis (Linnaeus, 1758) (1) R Eastern Atlantic-Boreal
Bdellidae gen sp. 1 (3) R Southern Africa
Bdellidae gen sp. 2 (3) R Southern Africa
Ereynetidae Oudemans, 1931 Ereynetes arcuatus (1) R Eastern Atlantic-Boreal Ereynetes macquariensis Fain, 1962 (2) R Sub-Antarctic; Antarctic
Erythreidae Robineau-Desvoidy, 1828 Abrolophus zelandicus Luxton, 1989 (2) R Northern New Zealand;
Southern New Zealand Abrolophus sp. (27) R Tropical western Atlantic:
Bermuda Balaustium araneoides Berlese, 1910 (1) R Eastern Atlantic-Boreal Balaustium halberti (Cooremann, 1936) (1) R Eastern Atlantic-Boreal Balaustium harrisoni Hull, 1918 (1) R Eastern Atlantic-Boreal Balaustium rubripes (Trouessart, 1889) (1) R Eastern Atlantic-Boreal Balaustium tardum (Halbert, 1915) (1) R Eastern Atlantic-Boreal
Eupodidae C. L. Koch, 1835 Eupodes minutus (Strandtmann, 1967) (2) R Southern New Zealand;
Sub-Antarctic Eupodes sp. (4) R Antarctic Halotydeus hydrodromus Berlese & Trouessart, 1891 R Eastern Atlantic-Boreal (1)
44

Appendix. (continued)
Halotydeus mollis Luxton 1986 (6) M
Halotydeus signiensis Strandtmann & Tilbrook, 1968 R (4) Halotydeus sp. (6)
Nanorchestidae Grandjean, 1937 Nanorchestes amphibius (Top sent & Trouessart, R 1890) (1) Nanorchestes dicrosetus Luxton, 1984 (2) R Nanorchestes hutchinsoni Luxton 1989 (23) R Nanorchestes macquariensis Strandtmann, 1982 (2) R Nanorchestes sp. 1 (3) R Nanorchestes sp. 2 (3) M
Rbagidiidae Oudemans, 1902 Foveacheles canestrinii (Berlese & Trouessart, 1889) R (1) Robustocheles mucronata (Willmann, 1936) (1) R
Trombidiidae Leach, 1814 Microtrombidium aucklandicum Luxton, 1989 (2) R Microtrombidium karriensis Wormesley, 1934 (2) R
Microtrombidium littorale Michener, 1946 (7) M
Microtrombidium malindiensis Luxton, 1989 (23) R Microtrombidium otagoensis Luxton, 1989 (2) R Platytrombidium sp. (8) R
Tydeidae Kramer, 1877 Lasiotydeus brevistylus Halbert (5) Tydeidae gen sp. (3)
ORIBATIDA
R M
Indo-West Pacific: Hong Kong Antarctic
Indo-West Pacific: Philippines
Eastern Atlantic-Boreal
Southern New Zealand Southern Australia Sub-Antarctic; Antarctic Southern Africa Indo-West Pacific: KwaZulu-Natal
Eastern Atlantic-Boreal
Eastern Atlantic-Boreal
Northern New Zealand Sub-Antarctic, Southern New Zealand Tropical eastern Pacific: Panama Indo-West Pacific: Kenya Southern New Zealand Indo-West Pacific: New Guinea
Eastern Atlantic-Boreal Indo-West Pacific: KwaZulu-Natal
Ameronothridae Willman, 1931 Ameronothrus bilineatus Michael 1888 (9)
Ameronothrus lineatus Thorell, 1871 (9)
R,S Eastern Atlantic-Boreal; Mediterranean-Atlantic; South Africa (introduced ?)
45
R Arctic; Eastern AtlanticBoreal; Eastern PacificBoreal

Appendix. (continued)
Ameronothrus maculatus Michael, 1882 (9) R Arctic; Eastern Atlantic-Boreal; Mediterranean-Atlantic
Ameronothrus marinus Banks, 1896 (9) R Eastern Atlantic-Boreal; Mediterranean-Atlantic
Ameronothrus nigrofemoratus Koch, 1879 (9) R,S Arctic; Eastern Atlantic-Boreal; Eastern Pacific-Boreal
Ameronothrus schneideri Oudemans, 1903 (9) R Eastern Atlantic-Boreal; Mediterranean-Atlantic; Tropical Western Atlantic: Curac;:ao (introduced 7)
Ameronothrus schubarti Weigmann & Schulte, 1970 R California (9) Ameronothrus schusteri Schubart, 1970 (9) R Mediterranean-Atlantic Halozetes bathamae Luxton, 1984 (2) R Southern New Zealand Halozetes belgicae (Michael, 1903) (4) R Sub-Antarctic; Antarctic Halozetes intermedius Wallwork, 1963 (4) R Sub-Antarctic Halozetes littoralis Wallwork 1970 (4) R Antarctic Halozetes marinus (Lohmann, 1907) (4) R Southern Africa: St Paul &
Amsterdam; Southern South America: Falkland; Southern New Zealand; Sub-Antarctic; Antarctic
Halozetes marion ens is Engelbrecht, 1974 (4) R Southern South America: Gough Island; Sub-Antarctic
Halozetes plumosus Wallwork, 1966 (2) R Southern New Zealand Halozetes sp.1 (4) R Sub-Antarctic Halozetes sp.2 (4) R S ub-Antarctic
Fortuyniidae van der Hammen, 1960 Alismobates reticulatus Luxton, 1992 (11) Indo-West Pacific: Hong
Kong Alismobates rotundus Luxton, 1992 (11) R Indo-West Pacific: Hong
Kong Circellobates venustus Luxton, 1992 (11) R Indo-West Pacific: Hong
Kong Fortuynia elamellata Luxton, 1967 (3, 12) R Japan; Indo-West Pacific:
East coast of Africa; Northern New Zealand
Fortuynia maculata Luxton, 1986 (12) R Indo-West Pacific: Kenya Fortuynia marina van der Hammen, 1960 (12) R Indo-West Pacific: New
Guinea
46

Appendix. (continued)
Fortuynia sinensis Luxton, 1992 (11) R Indo-West Pacific: Hong Kong
Fortuynia yunkeri van der Hammen, 1963 (12) R Tropical eastern Pacific: Panama
Fortuynia inhambanensis Marshall & Pugh, 2001 (28) R Indo-West Pacific: Mozambique
Fortuynia rotunda Marshall & Pugh, 2001 (28) M Indo-West Pacific: Mozambique
Fortuynia sp. (27) R Tropical western Atlantic: Bermuda
Fortuyniidae gen sp. 1 (13) 7 Tropical eastern Pacific: Galapagos Islands
Fortuyniidae gen sp. 2 (13) 7 Tropical eastern Pacific: Galapagos Islands
Oribatulidae Thor, 1929 Pontiobates denigratus Luxton, 1989 (2) R Northern New Zealand
Pontiobates sp (3) M Indo-West Pacific: KwaZulu-Natal
Oribatulidae gen sp (3) M Indo-West Pacific: KwaZulu-Natal
Selenoribatidae Schuster, 1963 Arotrobates granulatus Luxton, 1992 (13) R Indo-West Pacific: Hong
Kong Arotrobates lanceolatus Luxton, 1992 (13) M Indo-West Pacific: Hong
Kong Psednobates uncunguis Luxton, 1992 (13) S Indo-West Pacific: Hong
Kong Schusteria littorea Grandjean, 1968 (14) R Tropical eastern Pacific:
Galapagos Islands (7); Eastern South America
Schusteria sp 1 (14) R Eastern South America: Sao Paolo
Schusteria sp 2 (14) M Tropical eastern Pacific: El Salvador
Schusteria sp 3 (15) R Indo-West Pacific: KwaZulu-Natal
Schusteria sp 4 (15) M Indo-West Pacific: Mozambique
Selenoribates mediterraneus Grandj ean, 1966 (16) R Mediterranean-Atlantic Selenoribates foveiventris Strenzke, 1961 (16) R7 Indo-West Pacific: Red Sea Thalassozetes riparius Schuster, 1963 (16) R7 Mediterranean-Atlantic Selenoribatidae gen sp. (16) M Indo-West Pacific:
Maldives
47

Appendix. (continued)
ASTIGMATA
Hyadesiidae Halbert, 1915 Amhyadesia atlantica Fain & Schuster, 1984 (10) R
Amhyadesia austafricana Marshall &Nunkurnar, 1999 R, (17) M Amhyadesia bartschae Luxton, 1992 (18) R
Amhyadesia bermudana Fain & Schuster, 1984 (10) R
Amhyadesia brasiliensis Fain & Schuster, 1984 (19) R
Amhyadesia bursaria Fain & Schuster, 1979 (20) R
Amhyadesia cali/ornica Fain & Ganning, 1979 (10) R Amhyadesia costaricensis Fain & Schuster, 1984 (19) R
Amhyadesia elizabethensis Marshall &Nunkurnar, R 1999 (17) Amhyadesia glynni (Manson, 1963) (10) R Amhyadesia heteromorpha Luxton, 1992 (18) R
Amhyadesia heterophallus Fain & Schuster, 1984 (20) R
Amhyadesia longipilis Fain & Schuster, 1984 (20)
Amhyadesia madeirensis Fain & Schuster, 1986 (21) Amhyadesia pacifica Fain & Schuster, 1984 (20)
Amhyadesia punctulata Luxton, 1989 (2) Hyadesia agulhensis Marshall & U grasen, 2000 (22)
Hyadesia algivorans (Michael, 1893) (24) Hyadesia arabica Fain & Schuster, 1985 (25)
Hyadesia australiana Fain & Synnot, 1981 (26) Hyadesia benguelensis Marshall & U grasen, 2000 (22) Hyadesia chelopus (Trouessart ) Andre, 1931 (24)
48
R
R R
R R
R R
R R
R
Tropical western Atlantic: Bermuda Southern Africa
Indo-West Pacific: Hong Kong Tropical western Atlantic: Bermuda Tropical Atlantic: Sao Paolo, Brazil Indo-West Pacific: New Caledonia Eastern Pacific-Boreal Tropical eastern Pacific: Costa Rica Southern Africa
Eastern Pacific-Boreal Indo-West Pacific: Hong Kong Indo-West Pacific: Maldives; Philippines; Mozambique; KwaZuluNatal Indo-West Pacific: Philippines Mediterranean-Atlantic Indo-West Pacific: Philippines Northern New Zealand Indo-West Pacific: South Africa: Eastern Cape Eastern Atlantic-Boreal Indo-West Pacific: Red Sea (Egypt) Southern Australia Southern Africa
Indo-West Pacific: Indian Ocean

Appendix. (continued)
Hyadesia curassaviensis Viets, 1936 (24)
Hyadesiafusca (Lohman, 1896) (10)
Hyadesia glynni Manson, 1963 (10) Hyadesia halophila Fain, 1974 (24) Hyadesia heteromorpha Marshall & U grasen, 2000 (22) Hyadesia kerguelensis (Lohman, 1907) (24) Hyadesia maxima Fain, S0mme & Block, 1983 (24) Hyadesia microseta Luxton, 1989 (2) Hyadesia mollis Luxton, 1989 (2) Hyadesia nearctica Fain & Ganning, 1978 (10) Hyadesia pakistanensis Fain & Schuster, 1985 (25) Hyadesia paulensis Fain, 1975 (24)
Hyadesia plicata Luxton, 1989 (2) Hyadesia reticulata Luxton, 1989 (2) Hyadesia sanjuanensis Fain & Ganning, 1989 (10)
Hyadesia sellai Viets, 1937 (24) Hyadesia subantarctica Fain, 1974 (24) Hyadesia tesselata Luxton, 1989 (2) Hyadesia travei Fain, 1975 (2)
Hyadesia tumida Benard, 1961 (24)
Hyadesia uncifer Megnin, 1891 (24) Hyadesia verrucosa Fain & Schuster, 1985 (25) Hyadesia vietsii Wonnesley, 1961 (24)
Hyadesia wormesleyi Luxton, 1989 (23) Hyadesia zelandica Luxton, 1989 (2)
Hyadesia sp. (4)
49
R
R
R R R
R R R R R R R
R R R
R R R R
R
R R R
R R
R
Tropical eastern Atlantic: Curayao
~
Western Atlantic-Boreal; Eastern Atlantic-Boreal Eastern Pacific-Boreal Sub-Antarctic; Antarctic Southern Africa
Sub-Antarctic Antarctic Northern New Zealand Northern New Zealand Western Atlantic-Boreal Indo-West Pacific: Karachi Southern Africa: S1. Paul & Amsterdam Southern New Zealand Southern New Zealand Tropical eastern Pacific: Central America Mediterranean-Atlantic Sub-Antarctic; Antarctic Southern New Zealand Southern Africa: S1. Paul & Amsterdam Mediterranean-Atlantic: Brittany Magellan: Tierra del Fuego Mediterranean-Atlantic Indo-West Pacific: New Guinea Sub-Antarctic Northern New Zealand; Southern New Zealand
Antarctic

Chapter IV
Diversity and biogeography of southern African intertidal Acari
Abstract
Aim The aims were 1) to describe the diversity and geographical distribution of the intertidal
mite fauna of southern Africa, and 2) to show how species richness, endemism and
geographical patterns of this fauna (comprising taxa of variable terrestrial ancestry) compare
with typically marine faunas.
Location and methods To assess intertidal mite diversity and endemism, records (published
and unpublished) were complied for a variety of habitats (mainly rocky shores and
mangroves), between Swakopmund (Namibia) and Inhambane (Mozambique). The
geographical study was based on a dedicated sampling programme from the rocky shore, at
nine localities between Elandsbaai (on the west coast) and St Lucia (on the east coast).
Results Eighty two species of marine mite, from thirty three genera, are currently known from
southern Africa. The majority belong to the earlier marine ancestral Halacaridae (forty eight
species), with the Ameronothroidea and Hyadesiidae collectively comprising seventeen
species. In constituting three faunistic provinces, corresponding with the west (Atlantic),
south, and east coast (Indian) regions, the mite fauna conforms with trends for the southern
African marine fauna in general. Species richness was greatest in the southern province, which
deviates from the general pattern of increase from west to east, but is similar to that of some
invertebrate taxonomic groups.
Conclusions Despite their relatively recent marine connections, marine mites show typical
geographical distributions, comparable to those of other rocky shore biota in southern Africa.
The marine faunistic provinces are "insular" and apparently remain largely intact, across
taxonomic groups and with increased taxonomic resolution.
Introduction
High levels of taxonomic diversity and endemism are distinct features of the southern African
biota, and this is as much applicable to marine systems as to terrestrial systems. While notable
efforts have been (and continue to be) made to document the region's taxonomic richness in as
50

meaningful a way as possible, our knowledge of the marine biota is largely incomplete
(Gibbons et al. 2000). Whereas some taxonomic groups, such as the molluscs and fishes, have
understandably received considerable attention (Gosliner, 1987; Prochazka,1994; Turpie,
2000), others, comprising rare and cryptic faunas, remain poorly known. It is within this
context that studies on the diversity and geography of marine mites (Acari) in southern Africa
seem particularly relevant.
The Acari comprises predominantly terrestrial speCIes, with few groups having
colonized the marine environment. One family, the Halacaridae (Prostigmata), has been
especially successful in this regard; members of this family occur from the ocean depths to the
intertidal zones, and radiation is demonstrated by the group comprising over one thousand
known species (Barstch, 1989; Otto, 2000). Among the mite groups restricted to intertidal
zones, the Ameronothroidea (Oribatida) and Hyadesiidae (Astigmata) have strong ecological
and long historical links with marine systems, whereas the Mesostigmata and non-halacarid
Prostigmata have tenuous marine associations (proche~ & Marshall, 2001a). Given these
different evolutionary backgrounds, marine mites are ideal for investigating evolutionary
effects on ecological and biogeographical patterns (see Proche~ & Marshall, 2001 a, for
biogeography; Proch~ & Marshall, 2001b, for ecological relationships). For example it is
likely that these patterns will be influenced by the retention, in more recently originated taxa,
of traits for a terrestrial existence, such as low fecundity, crawling (as opposed to swimming)
larval stages, and the inability for aquatic respiration. As these traits intuitively constrain
dispersal in marine environments, geographical studies on marine mites are fertile grounds for
investigating vicariance versus dispersal models of distribution.
Geographical variation in southern African marine faunas is thought to be
predominantly affected by two processes. In the first instance this arises from variations in
seawater temperature along the coast, deriving from prominent adjacent current systems
(Branch & Branch, 1981; Field and Griffiths, 1991). Secondly, this arises through the
incursion of Indo-Pacific species into the warmer coastal regions (Brown & Jarman, 1978).
The extent of this variation is seen by three generally recognised biogeographical provinces
falling within the political boundaries of South Africa: a cool temperate province extending
along the west coast from Cape Point northwards, a warm temperate province along the south
coast, and a sub-tropical province along the east coast (Brown & Jarman, 1978; Branch &
51

Branch, 1981; Field & Griffiths, 1991). However, less consensus exists as to the actual limits
of these provinces (Day, 1967; Stephenson & Stephenson, 1972; Siegfried, 1984; Emanuel et
al., 1992; Prochazka, 1994; Briggs 1995; Bolton & Anderson, 1997; Turpie et al., 2000).
Furthermore, the limits seemingly vary from one taxonomic group to the next (Day, 1967;
Griffiths, 1976; Siegfried, 1981; Gosliner, 1987; Thandar, 1989; Williams, 1992; Whitfield,
1994; Bolton & Anderson, 1997; Turpie et al., 2000; Awad et al., 2001).
The current investigation documents the diversity and geography of the southern
African marine mites. As these comprise an evolutionary and taxonomically poorly-associated
marine invertebrate fauna, they were also used to test the generality, across taxonomic groups
and hierarchies, of commonly observed diversity and geographical patterns for the southern
African marine fauna as a whole. This fauna can be described as 1) being highly diverse and
endemic (relative to other world faunas) , 2) forming three distinct geographical regions and 3)
increasing in species richness from west to east. As a key outcome, the investigation
highlights the remarkable degree of conformity that exists in southern Africa between the
biogeography of marine mites and that of typically marine groups, despite the historical
discrepancies between primary and secondary marine organisms.
Material and methods
Records of southern African marine mites were complied from 1) all known publications and
unpublished observations as well as 2) collections made towards a dedicated study from nine
localities along the coastline (see below). Mite records from coastal habitats below the spring
highwater mark were considered, however, collections were concentrated on rocky shore and
mangrove communities, with less consideration being given to sandy beaches, saltmarshes and
other estuarine communities. The southern African (s-A) region was delimited here on the
west coast, at Swakopmund (Namibia), and on the east coast, at Inhambane (Mozambique).
For each species, southern African distributions were recorded, as was taxonomic information
and distributions outside the region (where applicable) . On the basis of known geographical
distribution, and with reference to patterns of endemism for other taxonomic groups (Griffiths,
1974; Brown & Jarman, 1978; Turpie et aI, 2000), each species was categorized as 1) endemic
(only between Orange River and East London), 2) possible endemic (as in 1 and extending
north of East London, but never outside the s-A region), 3) possible Indo-Pacific (not south of
East London and not outside the s-A region), 4) Indo-Pacific (not south of East London but
52

also outside the s-A, and in the Indo-Pacific region; see Briggs, 1995), 5) Cosmopolitan
(outside s-A, but not only in the Indo-Pacific region), 6) Southern (shared with other southern
temperate regions).
The biogeographical study concerned nme localities along the coast between
Elandsbaai and St Lucia, inclusive (Figure 1). Climatic conditions (sea surface and air
temperatures) vary markedly across this geographical range, as indicated in Table l.
Collecting was undertaken between November 2000 and May 2001. At each locality, three
sites were selected, and nine samples taken from each site (three in each of the supralittoral
fringe, upper mid-littoral, and lower mid-littoral (see Brown & Jarman, 1978; Field &
Griffiths, 1991), giving a total of twenty-seven samples per locality. The sites were located
tens or hundreds of meters apart, depending on the extent of rocky shore sampled. Each
sample comprised the algae, sessile animals and sand covering the rock in a 15 X 15 cm
quadrat. The contents of a sample were washed over two sieves in order to retain organisms
larger than 0.12 mm but smaller than 5 mm. These were preserved in 70% ethanol (25 ml
plastic sample bottles).
In the laboratory, the mites were extracted from each sample (under dissecting
microscope at X 100 magnification), cleared in lactic acid, and slide-mounted in Hoyer's
medium. Specimens were identified and counted. Only three taxonomic groups, Halacaridae,
Ameronothroidea and Hyadesiidae, accounting for 98.9% of all collected mites, were included
in further analyses. Brief taxonomic descriptions were undertaken for species previously
unknown from the region (see Appendix). While these descriptions were useful in
distinguishing the southern African Halacaridae in particular, more detailed investigation
referring to the known global taxa is required to confirm new species.
To assess how mite abundance varies across the southern African region, mean
abundance was determined for each of the two evolutionary distinct groups (Halacaridae and
AmeronothroidealHyadesiidae) in relation to position on the shore. Bray-Curtis similarity
analysis of presence! absence data was used to determine the relationship of the faunas of each
locality. Additional analyses were performed using species ranges and assuming the
occurrence of a species at all localities within the range. Statistical procedures were carried out
using PRIMER (Plymouth Routines in Multivariate Ecological Research; Clarke & Warwick,
1994) and SPSS ver. 7 . .
53

e \wakopmund
eLuderitz
o 250 500 750 1000 km
} Inhambanee
Lwandile .
Richards Bay "7 Umlalazi I} -- -DUrba~\ -ST LUCIA
Park Rynie \
East London "" ELANDSBAAle Port Elizabet~~ PORT EDWARD
YZERFONTEIN ~ Cape Town "'-- MAZEPPA BAY ":r, -~J PORT ALFRED KOMMET JIE- ~~. r NATURE1S VALLEY
GANSBAAI / Knysna Mosse Bay
Figure 1. Collection localities for southern African marine mites. Data from localities
indicated by capital letters were used in the analyses of the present study. Earlier collections
were made from the other localities (see Table 2).
Table 1. Average annual minimum and maximum (±SE; n=10; 1990-1999), for nine localities
on the southern African coast caC; based on monthly minimum and maximum temperature
data).
Air temperature Seawater temperature Minimum Maximum Minimum Maximum
Doringbaai (55 km N of Elandsbaai) 11.2±0.3 13.2±0.1 Y zerfontein 11.3±1.2 12.2±1.3 Kommetjie 7.4±0.9 27.1±1.1 11.5±1.2 12.4±1.2 Gansbaai 15 .5±0.2 16.7±0.2 Tsitsikamma 10.l±1.5 24.5±1.1 15.8±0.2 18.l±0.3 Port Elizabeth (125 km W of Port Alfred) 7.7±1.1 26.0±0.5 16.7±O.l 19.4±0.2 East London (90 km SW of Mazeppa Bay) 10.2±1.1 26.2±0.7 17.4±O.l 18.7±0.1 Port Edward 13 .0±O.8 26.7±0.5 20.6±O.2 21.3±O.1 St Lucia 14.3±1.3 28 .0±1.1
54

Results
Mite diversity and endemism
The currently known southern African marine mite fauna comprises 82 species, representing
four major groups (Mesostigmata, Prostigmata, Oribatida and Astigmata), 14 families, and 33
genera (see Tables 2 and 3). The majority of species (68%) are contained within three
super/families, the Halacaridae (Prostigmata), Ameronothroidea (Oribatida) and Hyadesiidae
(Astigmata). The Mesostigmata and non-halacarid Prostimata are poorly represented; because
of their low abundance it is difficult to acquire representative collections. Thirty one new
species and seven new genera (Isobactrus, Ralacarus, Thalassarachna, Bradyagaue,
Actacarus, Halozetes, and an undescribed fortuyniid genus) are reported in the present study.
The most speciose genus is the halacarid, Copidognathus (20 species), followed by
Rhombognathus (seven species) and Agauopsis (six species). Although no generic endemism
was observed for the region, the fauna comprises close to 60% specific endemics (but many of
these remain unconfirmed (24%)). Around 34% of the species derive from an IndoPacific
component (including unconfirmed records), and the remaining 6% are Cosmopolitan, or from
the other southern hemisphere regions. Three halacarid mite species (Ralacarus actenos,
Copidognathus gibbus and Copidognathus bairdii) have particularly wide distributions and
are known from various tropical and temperate locations in the Atlantic and Indian oceans,
while Simognathus glareus is also known from New Zealand. Fortuynia elamellata
(Ameronothroidea) and Amhyadesia heterophallus (Hyadesiidae) are widely distributed in the
Indo-Pacific.
Faunistic patterns
Thirty six mite species were collected during the biogeographical investigation (see Figure 2
for species list and their distributions). There was no indication of greater abundance at any
particular level on the shore or for any particular locality for either evolutionary group, when
species were grouped into Halacaridae or AmeronothroidealHyadesiidae (see Table 4).
However, more detailed ecological investigation taking into account habitat variability
within and between localities may yield a different result. Bray-Curtis analyses using 4th root
transformed abundances, and presence/absence data for collection records, showed three
distinct faunistic groupings, representing west, south, and east coast faunas (Figure 3).
55

Table 2. Intertidal mite species of southern Africa.
MESOSTIGMATA ASCIDAE
UROPODIDAE
PRO STIGMATA BDELLIDAE
NANORCHESTIDAE
HALACARIDAE
Genera/Species
Leioseius sp 1. Leioseius sp 2. Leioseius sp 3. Uroobovella sp.
Bdella sp. Spinibdella sp. Nanorchestes sp 1 Nanorchestes sp 2 Isobactrus sp 1. Isobactrus sp 2. Rhombognathus sp 1. Rhombognathus litoralis Bartsch. Rhombognathus sp 3. Rhombognathus sp 4. Rhombognathus sp 5. Rhombognathus sp 6. Rhombognathus sp 7. Halacarus actenos Trouessart.
Thalassarachna sp. Actacarus sp. Bradyagaue sp. Agaue sp. Agaue debilis Lohmann. Agaue hypertrophica Lohmann. Agaue papillifera Gimbel. Agauopsis crassipes Gimbel.
Agauopsis sp 2. Agauopsis sp 3.
Agauopsis papillata Bartsch.
Agauopsis sp 5. Agauopsis chelipes, Bartsch.
56
Distribution
Endemic (21) Endemic (P) (24) Indo-Pacific (P) (21) Indo-Pacific (P) (21)
Endemic (P) (21) Endemic (P) (21) Endemic (P) (21) Indo-Pacific (P) (21) Endemic (25) Indo-Pacific (P) (25) Endemic (23,24,25) Endemic (3,24,25) Endemic (25) Indo-Pacific (P) (25) Indo-Pacific (P) (25) Indo-Pacific (P) (25) Endemic (23) Cosmopolitan.
(12,25). Endemic (24,25) Endemic (P) (24) Endemic (P) (24) Endemic (1) Endemic (1) Endemic (1) Endemic (2) Endemic (P)
(2,23,25) Endemic (P) (25) Endemic (P)
(24,24,25) Endemic (P)
(3,24,25) Endemic (23,25) Endemic (3)

Table 2. (continued)
Halacaropsis praecognita Proche§.
Arhodeoporus kunzi Bartsch. Acarothrix umgenica Proche~. Copidognathus sp. 1. Copidognathus sp. 2. Copidognathus gibbus Trouessart.
Copidognathus sp. 4. Copidognathus sp. 5. Copidognathus bairdi Newell.
Copidognathus sp. 7. Copidognathus sp. 8. (17) Copidognathus sp. 9. Copidognathus sp. 10. Copidognathus sp. 11. Copidognathus sp. 12. Copidognathus sp. 13. Copidognathus sp. 14. Copidognathus pulcher Lohmann. Copidognathus simonis Lohmann. Copidognathus hartmanni Bartsch. Copidognathus isopunctatus Bartsch. Copidognathus caloglossae Proche~. Copidognathus xaixaiensis Proche~. Simognathus glareus Bartsch. Simognathus latitarsus Proche~. Lohmannella africana Bartsch.
PONTARACHNIDAE Pontarachna capensis Lohmann. Pontarachna sp. Litarachna sp 1. Litarachna sp 2.
TROMBIDIIDAE Microtrombidium sp. TYDEIDAE Tydeus sp.
ORIBATIDA AMERONOTHRIDAE Ameronothrus bilineatus Michael.
Halozetes sp. FORTUYNIIDAE Fortuynia elamellata Luxton.
Fortuynia inhambanensis Marshall & Pugh.
Fortuynia rotunda Marshall & Pugh.
57
Indo-Pacific (P) (18,24,25)
Endemic (P) (11) Indo-Pacific (P) (19) Endemic (3,25) Endemic (25) Cosmopolitan.
(1,12,25). Endemic (25) Endemic (25) Cosmopolitan
(3,8,24,25). Endemic (25) Endemic (P) (25) Indo-Pacific (P) (25) Endemic (P) (24) Indo-Pacific (P) (24) Endemic (P) (24) Endemic (P) (24) Endemic (P) (24) Endemic (1) Endemic (1) Endemic (3) Endemic (3) Indo-Pacific (P) (19) Indo-Pacific (P) (19) Southern (10,25). Indo-Pacific (P) (25) Endemic (P) (13) Indo-Pacific (1,8,24) Endemic (24) Endemic (24) Endemic (24) Indo-Pacific (P) (21) Indo-Pacific (P) (21)
Introduced? Northern Atlantic (6,7).
Endemic (25) Indo-Pacific. (4,5,17) Indo-Pacific (P) (17)
Indo-Pacific (P) (17)

Table 2. (continued)
SELENORIBATIDAE
ORIBATULIDAE
ASTIGMATA HY ADESIIDAE
ACARIDAE
N. g., n. sp. Schusteria ugraseni Marshall & Pugh. Schusteria sp 2. Schusteria sp 3. Schusteria melanomerus Marshall & Pugh. Pontiobates sp. N. g., n. sp.
Amhyadesia austafricana Marshall & Nunkumar
Amhyadesia elizabethensis Marshall & Nunkumar.
Amhyadesia sp 3. Amhyadesia heterophallus Fain &
Schuster. Hyadesia benguelensis Marshall &
Ugrasen. Hyadesia agulhensis Marshall & U grasen. Hyadesia heteromorpha Marshall &
Ugrasen. Tyrophagus putrescentiae Schrank
Indo-Pacific (P) (24)
Endemic (P) (16,25) Indo-Pacific (P) (25) Indo-Pacific (P) (24) Indo-Pacific (P) (16) Indo-Pacific (P) (21) Indo-Pacific (P) (21)
Endemic (14,25)
Endemic (14,25)
Endemic (25) Indo-Pacific.
(9,14,25) Endemic (P) (15,25)
Indo-Pacific (P) (15) Endemic (P) (15)
Cosmopolitan (22)
Distribution information from: Lohmann 1898; 1907a; 1907b (1); Gimbel 1919; 1920 (2);
Bartsch, 1972 (3); Luxton, 1967 (4); Aoki, 1974 (5); Schulte et al., 1975 (6); Weigmann, 1975
(7); Konnerth-Ionescu, 1977 (8); Fain & Schuster, 1984 (9); Bartsch, 1985 (10); Bartsch, 1987
(11); Green & Macquitty, 1987 (12); Bartsch, 1992 (13); Marshall & Nunkumar, 1999 (14);
Marshall & Ugrasen, 2000 (15); Marshall & Pugh, 2001a (16); Marshall & Pugh, 2001b (17);
Proche§, 2001b (18); Proche§, 2001c (19); Proche§ & Marshall, 2001 (21); Marshall et al.,
2001 (22); Bartsch & Marshall, unpublished data (23); Proche§ & Marshall, unpublished data
(24), present study (25). Endemic (P) and Indo-Pacific (P) refer to possible endemics and
possible (unconfirmed) Indo-Pacific distributions, respectively (see Material and Methods).
Separation of the three faunas is seen at c. 30 % similarity in the 4th root analysis and 37 %
similarity in the presence/absence analysis (Figure 3). However, local faunas were differently
grouped in each analysis. In the 4th root analysis, Kommetjie grouped with the west and not
58

the south coast, and Mazeppa Bay with the south and not the east coast. Given that numerous
ecological factors known to influence local abundance were not taken into account, the
presence/absence pattern is probably of greater biogeographical relevance (Figure 3B).
Although the pattern of three sub-provincial faunas is obscured by Gansbaai being associated
with the west coast, and Kommetjie with the south coast in the presence/absence analysis,
distinctness is indicated by the high similarity between adjacent localities within each
province in the case of Elandsbaai and Yzerfontein (c. 58% similarity), Nature's Valley and
Port Alfred (c. 87% similarity), and Port Edward and St Lucia (c. 56% similarity; Figure 3).
The distinctness of the east coast fauna (Mazeppa Bay, Port Edward and St Lucia) from the
rest of the southern African fauna (at 23% similarity) is accountable to the introduction of an
Indo-Pacific element into this fauna (see Figure 2 and Table 2).
Because our sampling procedure may have overlooked some species which occur at
particular localities, another similarity analysis was derived using distribution ranges and
assuming presence at all localities within the known geographical range of a species. This had
a minor effect on the faunistic scheme, other than improving similarity among localities and
grouping both Gansbaai and Kommetjie into the south coast province (Figure 3C).
Geographical pattern of species richness
Species richness of both the Halacaridae and AmeronothroidealHyadesiidae was depressed
almost twofold for the west coast localities, as compared to the south and east coast localities
(which were similar) when actual collections were analysed (Figure 4A). However the pattern
changed somewhat when species ranges were taken into account (recording presence at all
localities with the range). This shows a distinct peak for the south coast with richness
declining towards the cool temperate west coast and the SUbtropical east coast (Figure 4B).
Discussion
Diversity and endemism
Biodiversity and endemism studies are becoming an increasingly important basis for the
management and preservation of faunas, which is receiving increased attention in the light of
the threat of global wanning and man' s ongoing destruction of the environment. Both the
59

0\ 0
Table 3 Intertidal mite species richness for southern Africa, according to taxonomic group and biogeographical affinity. Endemic (P) and
Indo-Pacific (P) refer to possible endemics and possible (unconfirmed) Indo-Pacific distributions, respectively (see Material and Methods).
Total Mesostigmata Prostigmata Oribatida Astigmata Halacaridae Ameronothroidea+ Other H yadesiidae
Fanlilies 14 2 6 4 2 1 4 9 Genera 33 2 2 7 3 14 7 12 Species 82 4 58 12 8 48 17 17
Cosmopolitan 4 0 3 0 1 3 0 1 Indo-Pacific 3 0 1 1 1 0 2 1 Indo-Pacific (P) 25 2 14 8 1 11 7 7 Endemic 29 1 24 1 3 21 4 4 Endemic (P) 20 1 16 1 2 13 3 4 Southern 1 0 1 0 0 1 0 0

Isobactrus sp. 1 Isobactrus sp. 2
Rhombogllatlllls sp 1.
Rhombognathus litoralis
Rhombognatlzus sp. 3
Rhombognathus sp. 4
Rhombognathus sp. 5
Rhombognathlls sp. 6
Halacarus aclellos
Talassaraclma sp
Agauesp
Agauopsis crassipes
Agallopsis sp 2
Agauopsis sp 3
Agallopsis sp 4
Agallopsis papillala
Halacaropsis praecogllita
Copidogllalhus sp 1
Copidognallzus sp 2
Copidognathus gibbus
Copidogllalhus sp 4
Copidognalhus sp 5
Copidognathus bairdi
Copidognalhus sp 7
Copidognathus sp 8
Copidogllathus sp 9
Simognalhlls glareus
Simogllathlls sp 2
Halozeles sp
Schusteria ugraseni
Schusteria sp 2
Amhyadesia elizabeth ens is
Amhyadesia austafricalla
Amhyadesia sp 3
Amhyadesia helerophallus Hyadesia benguelensis
Elandsbaai Yzerfontein Komme~ie Gansbaai
~ ~'
<~."!:'tt.
Nature's Valley
Port Alfred
Mazeppa Bay
Port Edward
StLucia
Figure 2. Distributions of southern African intertidal mite species. Actual records are given in
black, while gray indicates localities within the distribution range where the species was not
collected.
61

terrestrial and marine environment of southern Africa are centres of high biodiversity, and are
thus relevant and important for investigation. Gibbons et al. (1999) review the current status
of our knowledge of marine biodiversity in the region. Comprehensive diversity studies on
marine mites are known from only few regions, including the British Isles, New Zealand, and
some sub-Antarctic islands (Pugh & King, 1985; 1988; Green & McQuitty, 1987; Luxton,
1990; Pugh & Bartsch, 1993; Pugh, 1995). However, attempts have been made to describe
their global distribution patterns (Proche~ & Marshall, 2001a).
A 1 Elandsbaal 2 Yzerfonteln 4 Gansbaal 3 Kommetjle 5 Nature'S Valley 6 Port Alfred 7 Mazeppa Bay 8 Port Edward 9 st. Lucia
I I I I I I I I I I I
0 10 20 30 40 50 60 70 80 90 100 %
B 1 Elandsbaai 2 Yzerfonteln 4 Gansbaal 3 Kommetjle 5 Nature's Valley 6 Port Alfred 7 Mazeppa Bay 8 Port Edward 9 st. Lucia
I I I I I I I I I I I
0 10 20 30 40 50 60 70 80 90 100 %
C 1 Elandsbaal 2 Yzerfonteln 3 Kommetjie 4 Gansbaal
I 5 Nature's Valley 6 Port Alfred 7 Mazeppa Bay
L 8 Port Edward 9 st Lucia
I I I I I I I I I I I
0 10 20 30 40 50 60 70 80 90 100 % Bray-Curtis similarity
Figure 3. Dendrograms based on Bray-Curtis similarity for southern African marine mite
faunas of nine localities. Figures next to each locality indicate the order of the localities on the
coast, from west to east. A, 4th root-transformed abundance data; B, presence/absence for
actual records; C, presence/absence for species ranges (see Figure 2).
62

Table 4. Mite abtmdance (mean ±SE; N=9 for S, U, L; N=27 for T; for 15 x 15 cm quadrats)
in three tidal levels (S, supralittoral fringe; U, upper mid-littoral; L, lower mid-littora; T,
total), at nine localities along the southern African shore. Data are given separately for the two
evolutionary distinct marine mite groups.
Halacaridae
Elandsbaai Y zerfontein Kommetjie Gansbaai Nature's Valley Port Alfred Mazeppa Bay Port Edward St Lucia
Ameronothroidea and Hyadesiidae
Elandsbaai Y zerfontein Kommetjie Gansbaai Nature's Valley Port Alfred Mazeppa Bay Port Edward St Lucia
S
1.22±0.55 1.78± 1.09 0.11±0.11 1.56±0.77 0.56±0.44 8.33±3.12 10.11±6.21 0.67±0.37 0.S6±0.36
S
1.44± 1.44
0.22±0.22
8.78±3.81 1.44±0.44 3.33± 1.07 1.22±0.70 1.11±0.48
U L T
3.67 ± 1.46 2.89±0.87 2.59±0.60 5.56±2.60 0.67±0.29 2.67± 1.00 3.11± 1.07 0.44±0.24 1.22±0.44
23.00±9.48 9.56±2.80 11.37±3.62 2.S6±0.69 S.89± 1.76 3.00±0.76 3.33±0.82 2.44±0.93 4.70± 1.19 3.56± 1.76 3.67± 1.39 5.78±2.20 6.67±2.44 2.89± 1.16 3.41 ± 1.00 1.11 ±0.31 15.44±3.47 5.70± 1.76
u L T
14.11±14.11 5.19±4.71
76.00±9.45 0.33±0.33 25.52± 7.63 0.22±O.lS 0.07±0.OS 2.44± 1.28 0.S6±0.38 3.93± 1.47 S.S6±3.49 2.33± 1.22
58.00±30.60 0.22±0.IS 20.S2± 11.10 S.l1 ± 1.44 1.33±0.83 2.56±O.68 0.44±0.34 O.l1±O.l1 0.56±0.21
The present study reports eighty two species of intertidal mite from the southern
African region. While this number is likely to be accurate in the case of some taxa (for
example the ameronothroid and hyadesiid group), it apparently underestimates the actual
number of species in the case of others. The high rate at which new halacarid mites were
collected in the present study, and their known high global diversity (Bartsch, 1989; Abe,
1998; Otto, 2000), suggest that the number of southern African species may be more than
63

double the forty eight recorded here. Likewise, the records probably underestimate the
mesostigmatid and prostigmatid mite diversity, given the rarity of these mites. Nevertheless,
the recorded species richness for the non-halacarid mites compares favourably with that for
New Zealand (which IS 11 ameronothroidlhyadesiid mite speCIes and 15
mesostigmatidiprostigmatid mite species). Additionally, the species richness of the
ameronothroidihyadessid group, represents 10% of the world's species known in this group,
though this figure may be an artefact of elevated collecting effort in southern Africa (see
Proche§ & Marshall, 2001).
18 (J) A If) Q) c .c .g 12 If) Q)
'0 Q)
g.6
0
1 (J) B If) Q) c .c .g12 (J) Q)
'0 &6 If)
0 . iii c: "~ "iii (\I ]i = (\I .0 Q) .0 (/) c: E (/) (\I
"C .g E c: a. -c: Q) (\I (/) a. CI) (\I 0 <.!J -~
Ui ~ ~ Q) N ::l (\I -(\I ~ z
Figure 4. Total species richness of marine Acari for nine localities along the southern African
coast. A, actual records; B, species ranges (see Figure 2). White, Halacaridae; black,
Ameronothroidea and Hyadesiidae.
64

The southern African marine mites show a high level of endemism, characteristic of
many other marine taxonomic groups in the region. The inferred endemism of 50% is
comparable to that for amphipods (40%), bivalves (45%) and opisthobranch molluscs (48%),
(Awad et aI., 2001), though lower and higher values are known for other groups (e.g. 9% for
fishes, Turpie et aI, 2000; 21 % for polychaetes, 84% for isopods, Awad et aI., 2001). This
generally high level of endemism can be largely attributed to the geographical isolation of
southern Africa, as well as to effects of current systems precluding dispersal from the south
and west. The low temperatures and current directions of the Benguela and Southern Ocean
systems are of particular importance in this respect. An obvious route of dispersal to the
region exists via the Indo-Pacific (Agulhas current system), however, southern distributions
are limited by cooler temperatures. Some endemic fish taxa have close relatives in South
America and Australia (Smith 1965), but the extent to which such connections are historically
based (i.e., Gondwanan associations) has not been well explored for southern African marine
taxa, in general.
Faunistic provinces
Three biogeographical provinces are now well recognised for southern African marine animals
(delimited here by the political borders of South Africa, extending from Namibia to
Mozambique; see Brown & Jarman, 1978, and Field & Griffiths, 1991). A cool temperate
West Coast province, a wann temperate South Coast province and a SUbtropical East Coast
province have been established for a variety of taxonomic groups (phyla or groups of phyla) of
intertidal invertebrates and fishes (Stephenson & Stephenson, 1972; Brown & Jarman, 1978;
Emanuel et aI., 1992; Field & Griffiths, 1991; Bustamante & Branch, 1996; Turpie, 2000;
Awad, 2001). The present study shows that this pattern remains intact for the marine mite
fauna, even though this comprises a poorly taxonomically associated group of families
(Halacaridae, Ameronothroidea and Hyadesiidae). The only deviation from the typical
regional pattern was seen in the case of Kommetjie, which consistently clustered with the
south coast fauna. However, with respect to the general faunistic pattern, less consensus exists
as to the limits of the provinces, and some authors suggest transitional zones between
Kommetjie and Cape Columbine and between East London and Port Edward (see Brown &
65

Jannan, 1978; Turpie et aI., 2000). The fonner transition zone would account for the
Kommetjie anomaly in our observations.
The basis for the origin of the three provinces is not always clear at the super/family
level, but is distinctive in the case of ameronothroid mites. In the southern hemisphere, this
mite group comprises a typically tropical element of low latitudinal genera, such as Fortuynia
and Schusteria (largely limited to between 300 N and 300 S), and a typically high latitudinal
sub-polar element, the genus Halozetes (between 30° and 700 S) (Luxton, 1967; Proche~ and
Marsha1l2001a; also Proche~ 2001a). In the southern African region, the southerly limit of the
tropical genera is at 33°S, whereas Halozetes is only found south of this latitude. Furthennore,
this first recording of Halozetes in southern African represents a new northerly limit for this
widespread and speciose peri-Antarctic genus.
Geographical pattern of species richness
When marine animals are considered as a group, species richness along the southern African
coastline shows a distinctive trend of increase from west to east (West Coast province to East
Coast province). As previously implied, this is largely accountable to the incursion of a
species rich Indo-Pacific element into the southern African fauna on the east coast (see Turpie
et aI., 2000). When taxonomic resolution increases, however, this pattern either persists as in
the case of the fishes and echinodenns, or it breaks down, as in the case of isopods,
polychaetes and ascidians (see Figure 5). In common with some of these latter invertebrate
groups, the marine mites are best represented on the south, and not the east coast. One
explanation for these differences may derive from the inclusion both subtidal reef and
intertidal habitats in surveys of the fish and echinodenns including both sub-tidal reef and
intertidal habitats, whereas other studies including the present one, consider only the intertidal
habitats. Eastwards along the coastline towards the equator, intertidal rocky habitat availability
and diversity decline, whereas the converse applies in the case of sub-tidal reef systems which
become more diverse with the introduction of coral reefs. The species richness of marine
mites would, however, be expected to increase markedly along the SUbtropical east coast if
other habitats in addition to rocky shores were also considered. For example, mangroves in
particular are known to support an array of habitat specific mites (Marshall & Pugh, 2001a;
2001 b; Proche~, 2001c; Proche~ et aI., 2001).
66

A
1 III 0.8 III CII C ..c 0.6 (J
·c III 0.4 CII ·u CII
0.2 Co III
0
B
III 0.8 III CII C ..c 0.6 (J ·c III 0.4 CII ·u CII
0.2 Co III
0
C
III 0.8 III CII C ..c 0.6 (J
·c III 0.4 CII ·u CII
0.2 Co III
0 .iij c Q) .iij >- "0 >- "E (II (II :s ~ (II ~ ~
(II .(3 .0 Q) .0 Iii cc (II
::J C ~ III .g E III > ~ (II ...J "0 E c Co "0 C (II C/l t W -(II Q) 0 C) -~ 0 Co (J)
UJ N ~ a.. Q) t >- N 0 ::J (II - a..
(II ::2: z
Figure 5. Trends in relative species richness along the southern African coast for various
marine animal groups. A, groups with highest richness on the south coast (data from Awad et
aI., 2001): diamonds = octocorallians, triangles = polychaetes, stars = isopods, x-signs =
amphipods, circles = ascidians; B, groups with highest richness on east coast (data from
Turpie et aI., 2000; Awad et aI., 2001): squares = echinoderms, triangles = brachyurans, stars
= bivalves, x-signs = gastropods, diamonds = fish; C, Acari: triangles = halacarids, circles =
ameronothrids + hyadesiids, squares = total. The data were scaled from zero to one (no species
present, to greatest number present of at any locality) .
67

Concluding remarks
This study confinns well-established geographical patterns for southern Africa marine biota. It
suggests that these patterns persist for most animal taxonomic groups, including evolutionary
divergent marine mite groups (which may maintain physiological, life-history and ecological
features similar to terrestrial arthropods). It also shows that the patterns are generally
applicable over a broad range of taxonomic hierarchies (considering that the mites were
examined down to family). Although geographical trends are clearly discernible, the factors
governing these have received limited consideration. In this respect, studies have been
conducted to assess geographical variation of some community attributes (e.g. biomass, see
Bustamante & Branch, 1996) and some physical effects (such as habitat diversity, geology,
and wave action; Emanuel et al., 1992; Bustamante & Branch, 1996). However there scope for
investigation into habitat variability within and among the geographical provinces, as well as
into patterns of genetic variation across geographical scale. Even though present day
temperature seems to be the overriding detenninant of geographical patterns of the southern
African marine biota, studies adding a historical perspective would be of interest.
Acknowledgements
Ilse Bartsch (Biologische Anstalt Helgoland, Hamburg) is thanked for the original
identification of twelve halacarid species from early collections. Air temperature and sea
surface temperature data were, respectively, provided by the South African Weather Service
and CMC Cape Town. Ashvita and Ashvena Ramcharan are thanked for sample processing
and slide preparation. The study was supported by grants from the National Research
Foundation and the University of Durban-Westville.
References
Abe H. 1998. Rhombognathine mites. Taxonomy, phylogeny, and biogeography. Sapporo:
Hokkaido University Press.
Aoki J. 1974. The first record of the intertidal oribatid genus, Fortuynia , from Asia.
Annotationes Zoologicae Japonenses 47: 170-174.
68

Awad AA, Griffiths CL, Turpie JK. 2001. Distributions and endemicity patterns of marine
benthic invertebrates in South Africa applied to the selection of priority conservation
areas. Diversity and Distributions, in press.
Bartsch I. 1972. Halacaridae (Acari) aus Stidafrika. Mitteilungen aus dem Hamburger
Zoologischen Museum und Institut 69: 5-32.
Bartsch I. 1985. New species of Halacaridae (Acari) from New Zealand. New Zealand
Journal of Zoo logy 12: 547-560.
Bartsch I. 1987. Arhodeoporus kunzi n. sp., eine Halacaride (Acari) aus dem Mesopsammal
Sudafrikas. Articulata 2: 389-392.
Bartsch I. 1989. Marine mites (Halacaroidea: Acari) A geographical and ecological survey.
Hydrobiologia 178: 21-42.
Bartsch I. 1992. Lohmannella dictyota n. sp. und Lohmannella africana n. sp., von der
Sudhalbkugel. (Arachnida: Acari: Halacaridae). Senckenbergiana Biologica 72: 457 -
464.
Bolton JJ, Anderson RJ. 1997. Marine vegetation. In Vegetation of southern Africa (eds.
R.M. Cowling, D.M. Richardson & S.M. Pierce), pp. 348-370. Cambridge: Cambridge
University Press.
Branch G, Branch M. 1981. Living shores of southern Africa. Cape Town: C. Struik.
Briggs Jc. 1995. Global Biogeography. Amsterdam: Elsevier.
Brown AC, Jarman N. 1978. Coastal marine habitats In: Werger M.J.A. (ed.), Biogeography
and ecology of southern Africa, Monographiae Biologicae 31: 1239-1277.
Bustamante R, Branch GM. 1996. Large scale patterns and trophic structure of southern
African rocky shores: the roles of geographic variation and wave exposure. Journal of
Biogeography 23: 339-351.
Clarke KR, Warwick RM. 1994. Changes in marine communities: an approach to statistical
analysis and interpretation. Plymouth: Plymouth Marine Laboratory.
Day JH. 1967. A monograph of the Polychaeta of southern Africa, Vol. 2, London: The
British Museum of Natural History.
Emanuel BP, Bustamante R, Branch GM, Eekhout S, Odendaal FJ. 1992. A
zoogeographic and functional approach to the selection of marine reserves on the west
coast of South Africa. South African Journal of Marine Science 12: 341-354.
69

Fain A, Schuster R. 1984. Four new species of the genus Amhyadesia from the intertidal
zone from several Indo-Pacific islands. International Journal of Acarology 10: 103-
111.
Field JG, Griffiths CL. 1991. Littoral and sublittoral ecosystems of southern Africa.
Ecosystems of the World 24. Intertidal and littoral ecosytems (ed. A.c. Mathieson,
P.H. Nienhuis), pp. 323-346. Amsterdam: Elsevier Science.
Gibbons MJ, Abiahy BB, Angel M, Assuncao CML, Bartsch I, Best P, Biseswar R,
Bouillon J, Brandford-Grieve JM, Branch W, Burreson E, Cannon L, Casanova
J-P, Channing A, ~hild CA, Compagno L, Cornelius PFS, Dadon JR, David
JHM, Day J, della Croce N, Emschermann P, Erseus C, Esnal G, Gibson R,
Griffiths CL, Hayward PJ, Heard R, Heemstra PJLB, Herbert D, Hessler R,
Higgins R, Hiller N, Hirano YM, Kensley B, Kilburn R, Kornicker R, Lambshead
J, Manning R, Marshall D, Mianzan H, Monniot C, Monniot F, Newman W,
Nielsen C, Patterson G, Pugh P, Roeleveld M, Ross A, Ryan P, Ryland JS, Samaai
T, Schleyer M, Schockaert E, Seapy R, Shiel R, Sluys R, Southwood EC,
Sulaiman A, Thandar A, van der Spoel S, van Soest R, van der Land J, Vetter H,
Vinogradov GA, Williams G, Wooldridge T. 1999. The taxonomic richness of South
Africa's marine fauna: a crisis at hand. South African Journal of Science 95: 8-12.
Gimbel O. 1919. Uber einige neue Halacariden. Mitteilungen aus dem Zoologischen Museum
in Hamburg 36: 105-130.
Gimbel O. 1920. Halacaridae. In: Michaelsen, W. (ed.) Beitrage zur Kenntnis Meeresfauna
Westafrikas pp. 1-12. Jena: G. Fischer.
Gosliner T. 1987. Biogeography of the opistobranch gastropod fauna of southern Africa.
American Malacological Bulletin 5: 243-258.
Green J, Macquitty M. 1987. Halacarid mites. Synopses of the British Fauna 36: 1-178.
Griffiths CL. 1974. The gammaridean and caprellid Amphipoda of southern Africa. PhD
thesis, University of Cape Town.
Griffiths CL. 1976. Guide to marine benthic amphipods of southern Africa. Cape Town:
Trustees of the South African Museum.
Konnerth-Ionescu A. 1977. Marine Acari (Arachnida, Acari) from the littoral waters of
Tanzania. Travaux du Museum d'Histoire Naturelle "Grigore Antipa 11 18: 67-71.
70

Lohmann H. 1893. Die Halacariden der Plankton Expedition. Ergebnisse des Atlantischen
Ozeans Planktonexpedition. Humboldt Stift, 2: 11-95.
Lohmann H. 1907a. Uber einige faunistische Ergebnisse der Deutschen Siidpolar-Expedition,
unter besonderer Beriicksichtigung der Meeresmilben. Scriften an Naturwissenschaft
Vereins Schleswig-Holstein 14: 1-14.
Lohmann H. 1907b. Die Meeresmilben der Deutsches Siidpolar-Expedition 1901-1903.
Deutsche Siidpolar-Expedition 9: 361-413.
Luxton M. 1967. Two new mites from the rocky shore of North Auckland, with a note on the
zoogeographical relations of the littoral Cryptostigmata (Acari) of New Zealand. New
Zealand Journal of Marine and Freshwater Research 1: 76-87.
Luxton M. 1990. The marine littoral mites of the New Zealand region. Journal of the Royal
Society of New Zealand 20: 367-418.
Marshall DJ, Nunkumar S. 1999. First records and descriptions of the marine littoral genus
Amhyadesia Fain & Ganning 1979 (Acari: Astigmata: Hyadesiidae) from southern
Africa. South African Journal of Zoology 34: 173-179.
Marshall DJ, Pugh PJA. 2001a. Two new species of Schusteria (Acari: Oribatida:
Ameronothoidea) from marine shores in southern Africa. African Zoology 35: 201-
205.
Marshall DJ, Pugh PJA. 2001b. Fortuynia (Acari: Oribatida: Ameronothoidea) from the
marine littoral of southern Africa. Journal of Natural History, in press.
Marshall DJ, Ugrasen K. 2000. Three new species of the marine littoral genus Hyadesia
(Parahyadesia) (Acari: Astigmata: Hyadesiidae) from southern Africa. South African
Journal of Zoology 35: 85-92.
Marshall DJ, Perissinotto R, Nozais C, Haines C-J, Proche~ ~. 2001. Occurrence of the
astigmatid mite Tyrophagus (Acari: Astigmata) in the estuarine environment. Journal
of the Marine Biological Association of the United Kingdom, in press.
Otto JC. 1994. New species of Halacaridae from Australia (Acarina: Prostigmata).
Acarologia 35: 31-48.
Otto Jc. 2000. Australacarus (Acari: Halacaridae) from northern Australia, with the
description of three new species. Records of the Western Australian Museum 20: 103-
114.
71

Prochazka K. 1994. Habitat partitioning in shallow-water cryptic ichthyofaunal communities
in the western and south-western Cape, South Africa. PhD thesis, University of Cape
Town.
Proche~ ~. 2001a. Back to the sea: secondary marine organisms from a biogeographical
perspective. Biological Journal of the Linnean Society 74: 197-203.
Proche~ ~. 2001b. Halacaropsis praecognita n. sp. (Acari: Halacaridae) from southern
Africa. Transactions of the Royal Society of South Africa, in press.
Proche~ ~. 2001c. New species of Copidognathinae (Acari: Halacaridae) from southern
Africa. Journal of Natural History, in press.
Proche~ ~, Marshall DJ. 2001a. Global distribution patterns of non-halacarid manne
intertidal mites: implications for their origins in marine habitats Journal of
Biogeography 28: 47-58.
Proche~ ~, Marshall DJ. 200lb. Ecological patterns of two cohabiting evolutionary distinct
animal groups: mangrove pneumatophore arthropods as a case study. Ecography,
submitted.
Proche~ ~, Marshall DJ, Ugrasen K, Ramcharan A. 2001. Mangrove pneumatophore
arthropod assemblages and seasonality patterns. Journal of the Marine Biological
Association of the United Kingdom 81: 545-552.
Pugh PJA. 1995. Air breathing littoral mites of sub-Antarctic South Georgia Acta
Oecologica 15: 71-77.
Pugh PJA, Bartsch I. 1993. Ecology of the littoral Halacaridae of South Georgia in the sub
Antarctic. Journal of Natural History 28: 75-85
Pugh PJA, King PE. 1985. The vertical distribution of the British intertidal Acari - The non
halacarid fauna (Arachnida: Acari). Journal of Zoology 207: 21-33.
Pugh PJA, King PE. 1988. Acari of the British supralittoral. Journal of Natural History 22:
107-122.
Schulte G, Schuster R, Schubart H. 1975. Zur Verbreitung und Okologie der
Ameronothriden (Acari, Oribatei) in terrestrischen, limnischen und marinen
Lebensraumen. Veroffentlichungen des Institutes fur Meeresforschung in Bremerhaven
15: 359-385.
72

Siegfried WR. 1981. The estuarine avifauna of southern Africa. In Estuarine ecology with
particular reference to southern Africa (ed lH. Day), pp. 223-250. Rotterdam: A.
Balkema.
Smith JLB. 1965. The sea fishes of southern Africa . Cape Town: Central News Agency.
Stephenson TA, Stephenson A. 1972. Life between tidemarks on rocky shores. San
Francisco: W.H. Freeman.
Thandar AS. 1989. Zoogeography of the southern African echinoderm fauna. South African
Journal of Zoology 24: 311-318.
Turpie JK, Beckley LE, Katua SM. 2000. Biogeography and the selection of priority areas
for conservation of South African coastal fishes . Biological Conservation 92: 59-72.
Weigmann G. 1975. Vorkommen von Ameronothrus (Acari, Oribatei) im Litoral Siidafrikas.
Veroffentlichungen des Institutesfiir Meeresforschung in Bremerhaven 15: 65-67.
Whitfield AK. 1994. An estuary-association classification for the fishes of southern Africa.
South African Journal of Science 90: 411-418.
Williams GC. 1992. Biogeography of the octocorallian coelenterate fauna of southern Africa.
Biological Journal of the Linnean Society 46: 351-401.
Appendix. Diagnoses for halacarid mites. Abbreviations: AD, anterior dorsal plate; AE,
anterior epimeral plate; AG, ano-genital plate; OC, ocular plate; PD, posterior dorsal plate;
PE, posterior epimeral plate; pgs, perigenital setae. Legs numbered I to N .
RHOMBOGNATHINAE Palpi short, in contact with the rostrum all along their length, none
of the segments more than twice longer than wide. Flexible portion between end of tarsus and
claws with a small sclerite.
Isobactrus Newell. OC without setae. Opening in AD for insertion of gnathosoma ventral.
Sclerite between tarsus and claw moniliform.
Isobactrus sp 1. Dorsal plates (AD, PD, ~C) separate, with strong reticulation. Male with
more than 70 pgs. Gnathosoma completely covered by AD. Tibiae I and II with one strong,
slightly barbed seta. Claws smooth.
Isobactrus sp 2. Dorsal plates (AD, PD, OC) separate, smooth. Male with 50-60 pgs.
Gnathosoma half covered by AD. Tibiae I and II with one feather seta. Claws smooth.
73

Appendix. (continued)
Rhombognathus Trouessart. OC with two setae. Opening in AD for insertion of gnathosoma
antero-ventral. Sclerite between tarsus and claw elongated.
Rhombognathus sp 1. Dorsal plates (AD, PD, ~C) separate, with slight reticulation, generally
only visible at the posterior end of PD. Male with 14-16 pgs, all branched towards the end.
Feather setae on tibiae 2-1-1-2, rarely 3-1-1-2. Claw comb present, with 8-12 teeth.
R. !itoralis Bartsch. Dorsal plates (AD, PD, OC) separate, with slight reticulation. Male with
20 pgs, all branched towards the end, one pair on a separate, inner circle. Feather setae on
tibiae 2-1-1-0 or 2-1-0-0. Claw comb present, with 18-21 teeth.
Rhombognathus sp 3. Dorsal plates (AD, PD, OC) separate, smooth, OC, twice longer than
wide. Male with 26-30 branched pgs, branches few and scattered all along the length of the
setae. Feather setae on tibiae 2-2-2-2, barbs on the two posterior pairs of legs less prominent
than on the anterior pairs. Claw comb absent.
Rhombognathus sp 4. Dorsal plates (AD, PD, OC) separate, smooth, OC round. Male with 24
branched pgs, branches dense, scattered all along the length of the setae. Feather setae on
tibiae 2-2-2-2. Claw comb absent.
Rhombognathus sp 5. Dorsal plates (AD, PD, OC) separate. Male with 16-18 pgs, some bi- or
tri-furcated from the base. Feather setae on tibiae 2-1-2-2, 2-1-1-2 or 2-2-1-2. Claws comb
present, with 6 teeth at all legs.
Rhombognathus sp 6. Dorsal plates fused, or at least margins adjacent, with clear reticulation,
more obvious along three longitudinal bands. Male with 14-18 short, not branched pgs.
Feather setae on tibiae 2-1-1-2. Claws comb present, with 15-18 teeth.
HALACARINAE. Palpi long, laterally inserted on the rostrum, of 3-4 segments, at least the
2nd more than twice longer than wide, 3rd with a seta.
Halacarus Gosse. Patella I comparable in length with telofemur I and tibia I. Tibia I with
more than 10 setae.
H. actenos Trouessart. PD and OC absent, AD with pointed tip, five pairs of large dorsal
pores. Telofemur and patella I with a pair of strong spiniform setae each, tibia I with two
pairs.
74

Appendix. (continued)
Talassarachna Packard. Patella I much shorter than telofemur I and tibia I. Tibia I with more
than 10 setae.
Talassarachna sp. AD with two reticulated areas, one large, posterior, one small, anterior, and
a series of 12-15 pores along the posterior margin. OC kidney shaped, with a reticulated area
along the convex, internal side. PD small, covering the posterior third of the body, with three
longitudinal reticulated bands, the median one broad. Legs slender. This species is similar to
T. lubrica (Bartsch), known from Australia and New Zealand, and noted for its variability (see
Bartsch, 1985, Otto, 1994). However, the African populations probably deserve specific
status.
Agaue Lohmann. Body and legs generally adorned with lamellae. Mouthparts long, the
distance between basirostral and tritorostral setae similar or greater than between left and right
basirostrals. Patella I much shorter than telofemur I and tibia I. Tibia I with 10 or more setae.
Agaue sp. Dorsal plates with thickened areas where punctuation and pigmentation are easily
visible: one V-shaped on AD, one round, anterior on OC, two band-shaped on PD. Legs
flattened, lamellae most obvious on telofemur I. This species is similar, but probably not
identical, with A. chevreuxi Trouessart.
Agauopsis Viets. Legs, especially the first pair, with numerous peg-like setae. Patella I much
shorter than telofemur I and tibia I. Tibia I with less than 10 setae.
A. crassipes Gimbel. Dorsal plates tightly juxtaposed, punctuation vague, more obvious on
two longitudinal bands on AD and PD. Mouthparts shorter than gnathosomal base. Peg-like
setae on the segments of leg I: 0-0-3-2-3-1, thick and flattened. Claw I with accessory tooth,
but no obvious comb, claws II-IV with fine-toothed combs.
Agauopsis sp 2. Dorsal plates loosely juxtaposed, punctuation clear, especially on an H
shaped area of AD and four costae on PD, clear reticualtion in the intervals. Mouthparts
longer than gnathosomal base. Peg-like setae on the segments ofleg I short, 0-0-4-2-3-1. Claw
I with accessory tooth, but no obvious comb, claws II-IV with very fine-toothed combs.
Agauopsis sp 3. Dorsal plates loosely juxtaposed, with uniform reticulation. Mouthparts
shorter than gnathosomal base. Peg-like setae on the segments of leg I short, 0-0-2-2-3-1.
Claw I with accessory tooth, but no obvious comb, claws II-IV with barely visible teeth.
75

Appendix. (continued)
Agauopsis sp 4. Dorsal plates with clear punctuation, especially on two longitudinal bands on
AD and PD. AE very large, spanning over two thirds the length of the idiosoma. Gnathosomal
base once and a half longer than wide, mouthparts very short. Peg-like setae on the segments
of leg I short, 0-0-3-2-4-1. The two internal peg-like setae on tibia I starting from the same
base. Claws smooth.
A. pap illata Bartsch. Dorsal plates tightly juxtaposed, punctuation clear, especially on two
longitudinal bands on AD and PD, with clear reticulation in between. Mouthparts as long as
the base of gnathosoma. Peg-like setae on the segments ofleg I relatively small, 0-0-1-1-3-1.
Claw I with accessory tooth, but no obvious comb, claws IT-IV with fine-toothed combs.
Halacaropsis Bartsch. Patella I much shorter than telofemur I and tibia 1. Tibia I with more
than 10 setae.
H. praecognita Proche~. Anterior tip of AD with lateral lobes. Rostrum slightly longer than
gnathosomal base. Seta on third article of palpus with terminal spines. Postero-ventral seta on
tibia I denticulate, lateral claws smooth, no accessory tooth on middle claws.
COPID0 GNATHINAE. AE with a pair of gland pores. Palpi laterally inserted on rostrum, of
4 segments, at least the second clearly longer than wide, third without a seta.
Copidognathus Trouessart. Diagnosis as for the subfamily.
Copidognathus sp. 1 (similar to the unnamed species in Bartsch, 1972). Dorsal plates with
small pores, more obvious on two longitudinal bands on the AD and PD. Mouthparts more
than three times longer than gnathosomal base. Tibia I with one anterior pectinate seta, one
short posterior branched seta, and seven normal setae.
Copidognathus sp. 2. AD with punctuation more visible on a H-shaped area. OC sickle
shaped, five times longer than wide. All leg segment flattened, with strongly punctuated
lamellae, most obvious on telofemur 1. Two anterior spiniform setae and one posterior
pectinate seta on tibia 1. Trochanter ITI with long thorn-like expansion.
C. gibbus Trouessart. Dorsal plates strongly convex, margins of AD and PD adjacent to each
other. OC narrow, lateral. AD with a strong prominence covering the gnathosoma, and two
lateral expansions towards the base of legs I on either side. Legs flattened, with wing-like
expansions with strong punctuation.
76

Appendix. (continued)
Copidognathus sp. 4. Body flattened, egg-shaped in dorsal view. AD divided in one anterior
and one posterior half. Posterior AD and PD with strongly punctuated costae, and reticulated
intervals. OC as long as wide. Tarsus I minute, less than half the length of tibia I. Tibia I with
one strong thorn and seven setae. Claws I more than twice smaller, as compared to claws II.
Copidognathus sp. 5. AD and PD with vague, uniform reticulation. OC sickle-shaped, twice
longer than wide. Tibia I with one posterior pectinate seta, two anterior spiniform setae, and
four normal setae. Claws with strong accessory process, as long as the main tip, and strong
comb teeth.
e. bairdi ssp. africanus Bartsch. AD with four elevated areas, one anterior, elongated, two
medial, round, and one posterior, transversal, all with clear punctuation; and one anterior
prominence. OC with clear punctuation in the anterior half, and pointed posterior tip. PD with
four costae, the medial ones strongly elevated. Ventral plates fused, sometimes PE separate.
Copidognathus sp. 7. AD with punctuation more visible on a H-shaped area. OC sickle
shaped, four times longer than wide. All leg segments flattened, but without wing-like
expansions. Two short anterior spiniform setae and one posterior pectinate seta on tibia I.
Trochanter III without thorn-like expansion. Anterior middle claws with rounded tooth.
Copidognathus sp. 8. Palpi twice longer than gnathosomal base. Tibia I with two slightly
thicker setae, but no pectinate setae. Tarsi with square claw fossae, claws with around 12 long,
fine teeth.
Copidognathus sp. 9. AD with three round elevated areas, one anterior and two posterior. PD
with four costae, the medial ones strongly elevated. Ventral plates (AE, PE, AG) separate.
SIMOGNATHINAE. OC small or absent. Palpi short, of 2-3 segments, dorsally inserted on
the triangular rostrum. Tarsus I forms a chela together with a spine on tibia I.
Simognathus Trouessart. Leg I with one strong median claw and two setiform lateral claws.
Palpi of three segments.
S. glareus Bartsch. OC reduced, AE large, with uniformly distributed pores, posterior half
strongly pigmented. PD small. Chela robust, with setal digit blunt.
Simognathus sp. 2. OC reduced, AE large, without pigmented areas, central area lacking
pores. PD small. Chela weak, with setal digit pointed.
77
Section II
Ecology

Chapter V
Mangrove pneumatophore arthropod assemblages and temporal
patterns
Abstract
Arthropod assemblages comprising mites, crustaceans and hexapods are characterized here for
mangrove pneumatophores in southeastern Africa. Initial sampling showed that
pneumatophore assemblages differed markedly from benthic sediment assemblages, not only
in being more species rich, but also in having lower abundances. Differences among
pneumatophore arthropod assemblages were observed in comparisons of two mangrove stands
(in the Durban region) and habitats within each stand. Strikingly higher arthropod abundances
were found in assemblages associated with pneumatophores on the seaward fringes of the
mangrove stands, as compared to those situated inside the mangrove stands or along minor
waterways. These differences in abundance are ascribed to differences in physical conditions
among habitat types, relating to wetting frequency and sunlight exposure. The assemblages
associated with minor waterways varied among themselves according to variations in salinity.
Temporal variation in abundance showed that some species peaked in summer and others in
winter, indicating effects more closely related to terrestrial seasonal patterns, than to seawater
temperature. This study highlights the uniqueness of the mangrove pneumatophore arthropod
assemblages, and the need for further investigation into these in order to better understand
mangrove meiofaunal ecology.
Introduction
Mangroves are thought to playa major role in supporting tropical estuarine and coastal marine
systems by providing an important source of organic material and acting as nursery grounds
and habitats for fishes. The benthic meiofauna, in particular, is postulated to function in litter
degradation in high detritus areas, and to provide prey for fishes (Alongi, 1987; Gee, 1989).
Numerous investigations have documented the composition and abundance of meiofaunal
species for a variety of mangrove systems around the world (see Alongi & Sasekumar 1992
for a review). These highlight the taxonomic complexity and variability of meiofaunas from
79

one region to the next. The current investigation focuses on the meiofauna of the southeastern
African mangroves, the subject of a few previous investigations (Dye, 1983a; 1983b;
Olafsson, 1995; Ndaro & Olafson, 1999; Olafson et aI., 2000).
Most mangrove meiofaunal studies consider the assemblages associated with benthic
sediments, with considerably less attention being given to other habitats, such as decaying
mangrove litter layers (Gee & Somerfield, 1997) or stems and pneumatophores of mangrove
trees. Pneumatophores of the mangrove tree, Avicennia marina (Forssk.) Vierh., in particular,
not only provide large surfaces for the attachment of epiphytic plants and animals, but
accumulate sediment that supports a suite of unattached biota. Additionally, pneumatophores
experience considerably more variable physical conditions than benthic sediments. These
arise from variable exposure to tidal and sunlight conditions along pneumatophore lengths and
between pneumatophores, in relation to their position in a mangrove stand, and are likely to
increase microhabitat diversity and hence species richness.
While some investigations on pneumatophores have considered algal communities
(Wilkinson et aI., 1981; Aikanathan & Sasekumar, 1994; Phillips et aI., 1994; 1996),
cyanobacteria (potts, 1980), fungi (Hyde, 1990), barnacles and other sessile animals
(Farnsworth & Ellison, 1996; Saturmanatpan et aI., 1999) associated with pneumatophores,
virtually nothing is known about the meiofaunas inhabiting these structures. Estuarine
meiofaunal studies classically consider nematodes and harpacticoid copepods, with relatively
less attention given to groups such as mites and hexapods (collembolans and dipterans), even
though these are common components of marine intertidal systems (Cheng, 1976; Pugh &
King, 1985; Thibaud & Christian, 1997). The only known ecological studies considering
estuarine mites concern temperate saltmarsh systems (Luxton, 1966; 1967a; 1967b).
The objectives of the current study were therefore as follows: 1) to characterize the
marine arthropod assemblages associated with mangrove pneumatophores; 2) to determine
whether these differ from benthic sediment assemblages; and 3) to examine spatial and
temporal variability in assemblage structure within and between mangrove stands.
Materials and Methods
Study area
Sampling was undertaken at two localities (Beachwood and Bayhead Lagoon) near Durban,
KwaZulu-Natal, South Africa, between June 1999 and June 2000. The mangrove stand at 80

Beachwood (~44 ha) is located at the mouth of the Umgeni River, while the one at Bayhead
(~15 ha) is located in the Durban harbour, approximately 10 km south of Beachwood (Figure
1; Ward & Steinke, 1982). Nine sites were established at each locality (see Figure 1). Site
selection took account of three apparently different sets of environmental conditions that the
pneumatophores are likely to experience: the pneumatophores growing at the seaward edge of
a mangrove stand (fringe, sensu Woodroffe, 1992) experience typical tidal conditions and
fairly normal salinities (25 - 35); those associated with minor waterways such as creeks
(riverine) are exposed to reduced salinities (below 15) arising from freshwater inflow (Phillips
et aI., 1994, 1996), and those located deep inside mangrove stands (basin), experience limited
sunlight exposure, infrequent wetting and variable salinities. No fringe sites were available at
Beachwood, dictating the selection of six riverine and three basin sites there, whereas at
Bayhead, three of each habitat type was selected (see Fig. 1 for site locations and numbering
details).
Beachwood
I I I I
o 1 2 3 km
Figure 1. Map of Durban with the position of the collecting sites. The distance between
adjacent sites is roughly 50 m.
81

Sample collection and abundance determination
In the initial study to assess how pneumatophore and benthic sediment meiofaunas compare,
samples were collected from the Bayhead fringe and riverine sites (sites 10 - 15), as they
contained the most abundant faunas. The spatial studies included sampling from all eighteen
sites of the two localities, on three separate occasions (August, October and December 1999).
For the assessment of temporal abundance patterns, additional sampling was undertaken at
Bayhead (sites 10 - 15), in February, April and June 2000. On each sampling occasion, five
randomly selected replicate samples were collected, comprising the Avicennia
pneumatophores within a 15 x 15 cm area, or in the case of benthic sediments, the upper 1 cm
of sediment within a disc area of 22.5 cm2• Pneumatophores were cut at ground level and
placed in plastic bags. In the laboratory they were washed over two sieves (5 mm and 0.1
mm), to retain all the mites, copepods, collembolans, tanaidaceans, isopods, amphipods and
dipteran larvae. These arthropods were preserved in 70% ethanol for later identification,
sorting and counting.
The extraction procedure followed two steps. Firstly, the mites, tanaidaceans and some
insect larvae were extracted from each ethanol sample by hypersaline flotation (Fain & Hart,
1986). The remainder of the sample, which contained mainly copepods and insect larvae, was
then brought to a homogeneous aqueous solution of standard volume (50 ml). This was then
sub-sampled to give three 5 ml volumes. The number of arthropods in each sub-sample was
determined, averaged, and multiplied by ten to obtain an estimate for the entire 50 ml sample.
The total number of individuals of the various taxa for the sample was obtained by addition of
the numbers in each fraction (hypersaline and aqueous). Benthic samples were treated as
above; at the end of the procedure both pneumatophore and sediment values were normalized
to 0.1 m2
• Attempts were made to resolve taxa down to species, but in the cases of
taxonomically complex groups, more than one species was counted together. Samples were
counted under Xl 00 magnification using a dissecting microscope.
Statistical procedures and data presentation
Using the data for August, October and December 1999, mean abundances (individuals in
0.lm2
; N = 45) were determined for each group of three sites (1 - 3, 4 - 6, 7 - 9, 10 -12,13-
15, 16 - 18; see Figure 1). Because numbers and lengths of the pneumatophores varied among
quadrats, total pneumatophore length was also determined. Paired t-tests were used to assess 82

significant differences in abundance of taxa in pneumatophore and benthic sediments. To see
how closely the sites were associated with one another in tenns of species composition and
abundance, a non-metric multidimensional scaling ordination (MDS) was perfonned from a
Bray-Curtis dissimilarity model, using 4th root transfonned abundance values to account for
rare taxa (Clarke & Warwick, 1994). Plots are given for temporal variations in abundance, as
well as for abundances of some Beachwood riverine taxa along a salinity gradient. All
statistical procedures were undertaken using SPSS ver. 9.0 for Windows (1999).
Results
Species composition and abundance
The mesoarthropod fauna of southern African mangroves comprises three similarly species
diverse, taxonomic groups: mites (Acari - mesotigmatids, pro stigmatids , and oribatids),
crustaceans (copepods, tanaidaceans, isopods and amphipods) and hexapods (collembolans
and dipterans) (Table 1). Thirty taxa in total were identified, however, this excludes some
copepod taxa that were not readily discernible. Of the twenty-two easily identifiable taxa,
twelve were found at both Bayhead and Beachwood, while four and six were exclusive to
Beachwood and Bayhead, respectively (Table 1).
Arthropod faunas of the benthic sediment below pneumatophores differed markedly
from those associated with the pneumatophores themselves. Of ten taxa, four were more
abundant on the pneumatophores, two were more abundant in the sediment, and four showed
no significant differences between the two habitat types (Figure 2). The most abundant taxon
in the sediment (Harpacticoidea, 1900 individuals for 0.1 m2) differed by one order of
magnitude from the most abundant taxon on the pneumatophores (Tanais, 190 individuals for
0.1 m2). The mites (Acari) were restricted to pneumatophore habitats. Different groups of
crustaceans dominated on the pneumatophores (tanaids), and in the sediment (harpacticoids).
Generally, dipteran larvae showed similar abundances, both in the sediment and on the
pneumatophores, but the Empidoidea were more abundant in the sediment (Figure 2).
The crustaceans were the most abundant pneumatophore meso arthropods (-100
individuals for 0.1 m2), followed by the mites (-60 individuals) and then the hexapods (-30
individuals). Crustacean abundance was dominated by the abundance oftanaidaceans, though
this varied among sites (0 to -430 individuals for 0.1 m\ Occupancy was higher than 10% in
most species from the three taxonomic groups, but highest in Leioseius, a mite present in
83

relativey low abundances. The greatest arthropod abundance was found at the Bayhead fringe
sites (~900 individuals for 0.1 m2) (Table 2). Overall abundances were overwhelmingly
influenced by the fringe arthropods and particularly the dominant species of each major
taxonomic group, Copidognathus (Acari), Tanais (Crustacea) and Culicoides (Hexapoda)
(Table 2). Although total pneumatophore lengths were variable among groups of sites, there
was apparently no relationship between total mesoarthropod abundance and total
pneumatophore length (Table 2).
Table 1. Mesoarthropod taxa occuring in mangrove pneumatophores and benthic sediment.
(Asterisks indicate putative complexes of species.)
Acari
Crustacea
Hexapoda
Mesostigmata
Pro stigmata
Oribatida Copepoda
Tanaidacea Isopoda Amphipoda
Poduromorpha Diptera
TAXA
Ascidae: Leioseius sp. nov. Uropodidae: Uroobovella sp. Nanorchestidae Nanorchestes sp. Halacaridae: Copidognathus caloglossae
Acarothrix umgenica Agauopsis sp. nov.
Tydaeidae indet. Tarsonemidae indet. Oribatulidae indet. Harpacticoidea: Canthocamptidae: Amphibiperita sp., Diosaccidae: Robertsonia robusta, etc.
Metidae: Metis sp. nov. Tanaididae Tanais philetaerus Sphaeromatidae indet. Hyalidae Hyale grandicornis Melitidae Melita zeylanica Podoceridae indet. Corophiidae: Corophium triaenonyx Neanuridae: Anurida maritima Tipulidae indet. Cecidomyiidae: Lestremyiinae indet. Empidoidea indet. Ceratopogonidae: Culicoides sp. nov.
84
Further referred to as:
Leioseius Uroobovella Nanorchestes Copidognathus Acarothrix Agauopsis Tydaeidae Tarsonemidae Oribatulidae*
Non-metid Harpacticoidea * Metis Tanais Sphaeromatidae Hyale Melita Podoceridae Corophium Anurida Tipulidae Cecidomyiidae Empidoidea* Culicoides

Table 2. Abundance of mangrove pneumatophore arthropods (mean ±SE for 0.1 m2; N=45 for groups of three sites, n=270 for the grand mean). Total
pneumatophore length (cm) is also given.
Beachwood Bayhead
Riverine Riverine Basin Fringe Riverine Basin Grand mean Occupancy Taxa sites 1- 3 Sites 4-6 Sites 7-9 Sites 10-12 Sites 13-15 Sites 16-18 sites 1-18 (%)
Leioseius 8.12 ±1.84 4.58 ±0.82 4.56 ±1.06 10.00 ±1.53 6.88 ±1.37 3.51 ±0.85 6.31 ±0.54 50.00 Uroobovella 0.29±0.29 0.30 ±0.22 43.03 ±5.89 3.10±1.11 0.61 ±0.34 7.77 ±1.37 21.85 Nanorchestes 0.77 ±0.32 2.33 ±0.59 2.14 ±0.60 2.32 ±1.16 0.03 ±0.03 1.26 ±0.25 14.44
00 Copidognathus 223.61 ±37.96 16.26 ±6.03 3.92 ±1.33 40.06±8.06 29.63 VI Acarothrix 0.77 ±0.40 13.92 ±2.29 3.62 ±1.24 3.10 ±0.54 18.89
Tydaeidae 0.77 ±0.32 0.88 ±0.43 5.52 ±1.68 0.10 ±0.10 1.23 ±0.32 10.74 Tarsonemidae 1.06 ±0.35 0.97 ±0.48 0.11 ±0.1O 0.36±0.1O 5.56 OribatuIidae 1.16 ±0.57 0.98 ±0.28 1.46 ±0.68 0.61 ±0.23 1.07 ±0.35 0.68 ±0.24 1.00 ±0.18 16.67
Total Acari 11.94 ±2.21 24.39±2.99 17.97 ±3.46 276.81 ±42.65 27.84±7.74 8.00 ±1.70 61.10 ±9.30
Non-metid Harpacticoidea 3.28 ±1.02 0.12 ±0.1O 26.77 ±5.26 10.35 ±3.07 1.27 ±0.48 7.05 ±1.19 29.26
Metis 21.80 ±9.09 15.01 ±6.14 3.39 ±1.64 6.63 ±1.92 12.96 Tanais 38.55 ±8.02 1.72 ±0.94 0.12±0.10 432.48 ±50.80 15.52 ±4.05 14.82 ±3.07 85.50 ±12.93 49.26 Sphaeroma tidae 1.41 ±0.56 0.77 ±0.35 0.01 ±0.01 0.36 ±0.11 5.56 Hyale 1.45 ±1.00 1.37 ±0.48 2.43 ±1.25 0.89 ±0.28 7.78 Melita 6.57 ±2.12 1.21 ±0.72 1.08 ±0.47 0.40 ±0.31 0.50 ±0.21 1.07 ±0.70 1.82 ±0.42 15.19

Table 2. (continued).
Beachwood Bayhead
Riverine Riverine Basin Fringe Riverine Basin Grand mean Occupancy Taxa sites 1- 3 Sites 4-6 Sites 7- 9 sites 10-12 Sites 13- 15 Sites 16-18 sites 1-18 (%)
Podoceridae 0.10 ±O.1O 0.10 ±0.10 0.03 ±0.02 0.74 Corophium 0.39 ±0.39 0.01 ±0.01 0.10 ±0.10 0.08 ±0.07 0.74
Total Crustacea 51.35 ±10.15 4.25 ±1.72 3.85 ±1.55 494.36 ±53.41 43.00 ±9.16 19.56 ±4.21 102.37 ±14.08
Anurida 23.84 ±6.01 11.23 ±2.76 1.77 ±1.28 6.33 ±1.25 22.22 ~ Cecidomyiidae 0.10 ±O.1O 1.64 ±1.32 0.03 ±0.03 7.98 ±3.47 0.39 ±0.19 0.17 ±0.12 1.71 ±0.64 5.93
Empidoidea 0.29 ±0.17 0.68 ±0.28 2.13 ±2.05 5.05 ±1.49 0.89 ±0.27 1.87 ±1.06 1.82 ±0.47 15.16 Culicoides 0.10 ±0.10 0.58 ±0.30 0.30 ±0.17 120.39 ±23.19 2.68 ±1.21 15.86 ±3.41 23.14±4.71 28.89
Total Hexapoda 0.49 ±0.21 2.96 ±1.35 2.47 ±2.08 158.01 ±28.67 15.41 ±3.03 19.35 ±4.07 32.99 ±5 .91
Total 63.80 ±10.40 31.60±4.19 24.29 ±5.57 929.18 ±112.67 86.26 ±11.83 46.91 ±7.97 196.46 ±27.45 mesoarthropods
Total 222.11 ±33.11 285.39 ±42.54 241.35 ±35.98 285.93 ±42.62 224.42 ±33.45 114.03 ±17.00 272.60 ±16.59 pneumatophore
length

Comparisons of assemblages within and between localities
The multidimensional scaling ordination showed a clear distinction between the Beachwood
and Bayhead assemblages (Figure 3). This was largely due to differences in species
composition at each locality (see Table 2; only twelve of the twenty taxa were common to the
two localities). The riverine and basin assemblages were separated at both localities, and
showed similar patterns of association for each locality (Figure 3).
250
200 Q)
g150 co "C
§100 .c co
Q)
50
0
2500
2000
~ 1500 "C
§ 1000 .c co
500
00
-
-
-
-
r.t'J co ::::l Q) Q)
r.t'J > 0 0
.c Q) 0 --l 0
~
::J
co Q) Q) co "C "C 0 '>, U E is 0 co "C c.. '(3 ~ co Q)
::r: ()
~
* * I
p S p
r.t'J r.t'J r.t'J r.t'J ::::l r.t'J 'ffi Q) ~ 0- c:: "C 16 0 co '0 c:: ::::l f- u C) co ::::l 0 C)
() "C <l: 0-0 ()
* p S P P S
co Q) Q) co "C "C 0 ::::l "C 0-c.. ~ E UJ
fE1 -* * I
s p S p s
Figure 2. Abundances (mean ±SE for 0.1 m2; N=30) for arthropod taxa on the
pneumatophores (P) and in the benthic sediment (S). Pairs of asterisks indicate significant
differences between the pneumatophores and the sediment (paired t-test, P<O.05).
87

At Bayhead, the fringe assemblages were, however, closely associated, and broadly separated
from both the basin and riverine assemblages, an effect attributable to the greater species
abundances in the fringe assemblages. Separation of the assemblages at riverine sites in
Beachwood, seemed to be influenced by a salinity gradient along the Beachwood Creek. The
ordination showed that the assemblages were separated almost linearly from site 1 to site 6
(Figure 3), which respectively represented the highest and lowest salinities of the gradient.
Assemblage differences were apparently linked to changing abundances of the dominant taxa
along this gradient; abundances of the two dominant crustacean taxa decreased (Figure 4),
while those of the hal acarid mite Acarothrix, increased along the gradient of decreasing
salinity. Abundances of the predatory mesostigmatid mite, Leioseius, were seemingly
independent of salinity (Figure 4).
low salinity
Beachwood riverine
sites
Bayhead
(0 fringe
12 10 sites 11
Figure 3. MDS plot for the arthropod assemblages in the 18 sample sites (stress = 0.13).
Temporal variation
The abundance values for all the mesoarthropods combined showed a prominent summer and
a less prominent winter peak (Figure 5). These patterns were to a large extent influenced by
the three most dominant species (Copidognathus (Acari), Tanais (Crustacea) and Culicoides
(Hexapoda) (Table 1)). Some of the less abundant species showed slightly different trends
(e.g. Empidoidea and Harpacticoidea; Figure 5).
88

Discussion
Comparisons between pneumatophores and the benthic sediment
We show here that the mesoarthropod assemblages associated with mangrove
pneumatophores differ considerably from those of benthic sediments. A new suite of
arthropods, containing tanaidaceans and mites, was found exclusively on the pneumatophores
investigated, and abundances of other species varied greatly between pneumatophores and
benthic sediments. The single known study concerning pneumatophore meiofaunas, shows
abundances to be lower on pneumatophores relative to benthic sediments (see Alongi &
Sasekumar, 1992), but this excludes mites and tanaidaceans. Even though mites are known to
colonize mangrove benthic sediments (Bartsch, 1990; Gee & Warwick, 1996; Chapman,
1998), they were absent from these in the present investigation. Tanaidaceans have been
reported in relatively few mangrove meiofaunal studies (Branch & Grindley, 1979; Gee &
Warwick, 1996; Chapman, 1998), and the extent to which they colonize benthic sediments
remains unclear.
20
Q) 15 u
~ 10 'C <: E 5 III
150
~ 100 c:
.l!J 50
Leioseius
2 3 4 5 6 sites
Tanais
<: :::l .0 III 0 +---L--L-,---L--L-,-JL..l....L---,--=--r-----.------,
2 3 4 5 6 sites
Acarothrix
1 2 3 4 5 6 sites
15 Non-Metid Harpacticoidea
10 ~ c: ra 5 'C <: :::l .0 III 0
1 2 3 4 5 6 sites
Figure 4. Abundance values (mean ±SE for 0.1 m2; N=15) for four arthropod taxa at sites 1- 6.
Salinity decreases from site 1 to site 6.
Spatial and temporal variability in marine meiofaunal assemblages has been attributed
to a variety of biotic factors (including food availability) and habitat conditions. For example,
in lotic systems, biotic interactions include large scale effects resulting from fish predation
89

and small scale effects resulting from meiofaunal predation (Swan & Palmer, 2000). Another
example for deep-sea sediments, ascribes variability to worm-related disturbance (Gage,
1997). Habitat conditions of relevance include sediment particle size, habitat salinity and the
Total mesoarthropods
! 1500 I i 1~~ LL,[L,~,~ , rL , ~
1000 ~ 800 c ro 600 "0 § 400 ~ 200
VIII X XII II IV VI month
Total Crustacea
O+'--=-.--'-'--.-..L....OI"'--r-''--''''''-r-'--=--,-1-=-,
Q) 600 (.) c ro 400 "0 c ::l .0
200 ro
Q) 250 g 200 ~ 150 § 100 .g 50
VIII X XII II IV VI
VIII
month
Copidognathus
X XII mil mon
Empidoidea
IV VI
0-t-L--'--,L-~,-L---r-"""--'...c:J,--.....L....!la...,
VIII X X~nt~1 IV VI
Q) (.)
300
~ 200 "0 C
E 100 ro
Total Acari
VIII X XII hll mont
IV VI
Total Hexapoda
~~
Q) 400 I ~ 300 ~ -g 200
~ 1 o~ n. I FL I I I I I
VIII X XII II IV VI month
Non-Metid Harpacticoidea Q) 400 g 300 ro -g 200
E 100 ro
O-t-L-~.-~r=-.~-.~~~~
VIII X XII tlill mon
Culicoides
IV VI
VIII X XII II IV VI month
Figure 5. Mean abundance values (for 0.1 m2; N=5) for arthropods in sites 10-16 at six
moments (August, October, December 1999, February, April, June 2000). White bars, fringe
sites (10-12); grey bars, creek sites (13-15).
90

potential for dehydration (Alongi & Sasekumar, 1992; Olafsson et al., 2000). Salinity is
known to vary considerably in relation to position on the shore, and depressions in the
sediment (Phillips et al., 1996; Chapman, 1998; Olafsson et al., 2000). Probably the greatest
cause of the observed increase in species richness on pneumatophores relative to benthic
sediments, derives from the physical and structural attributes of the pneumatophores.
Pneumatophores introduce a unique structural feature to the physical environment of
mudflats, which significantly increases habitat complexity (Beck, 2000). Additionally, they
provide surfaces for the attachment of sessile biota (for example, algae, barnacles), which
form a habitat for other smaller biota (for example, mites). Furthermore, pneumatophores
experience differential dehydration along their lengths during air exposure (following tidal
recession). The exclusive occurrence of some taxa on pneumatophores may well relate to their
enhanced capacities to withstand dehydration.
Comparisons of assemblages between and within mangrove stands
A second definitive result is that the meiofaunal arthropod assemblages of pneumatophores
vary remarkably among mangrove stands, and within stands depending on the position
relative to the edge, and to minor waterways.:. The way in which assemblages change in
tandem with changes in salinity between Bayhead and Beachwood, and between sites at the
latter, suggests the predominant role of salinity in structuring these assemblages. Numerous
other studies have suggested how salinity influences mangrove meiofaunal assemblages
(Olafsson, 1995; Somerfield et al., 1998; Ndaro & Olafsson, 1999, Olafsson et. al., 2000).
Differences between the fringe and basin pneumatophore assemblages apparently also relate
to differences in habitat conditions; fringe pneumatophores experience a higher frequency of
wetting and are often exposed to direct sunlight. At least the latter condition is likely to yield
greater algal productivity, and thus support larger meiofaunal colonies. This would explain the
considerably greater arthropod abundances associated with fringe pneumatophores relative to
basin pneumatophores. The lower species richness of fringe assemblages is probably
explained by the loss from these assemblages of dehydration intolerant species, as exposure to
direct sunlight causes rapid dehydration of these pneumatophores, compared to basin
pneumatophores which are shaded by the tree canopy.
91

Temporal patterns
The temporal patterns of the mangrove pneumatophore arthopods are open to interpretation in
terms of terrestrial or marine variations in climatic conditions. Because there is very little
variation in the seawater temperature conditions during the year (the warm Agulhas current in
the region keeps this parameter between 20 and 25°C year round; Bolton & Anderson, 1997),
it is unlikely that the arthropods are at any moment limited by either low, or high seawater
temperatures, as compared to the rest of the year. More likely, the observed patterns relate to
terrestrial conditions. Summers in Durban are considerably hotter and wetter than winters
(when temperatures often fall below 15°C; Cockcroft & Forbes, 1981). The observed
differences among taxa in seasonal abundances may relate to their different preferences of air
temperatures prevailing at different times of the year. Besides temperature, the decrease in
salinity caused by summer rainfall can be taken into consideration. However, the occurrence
of summer peaks in taxa which apparently prefer relatively low salinity conditions as well as
those which prefer relatively high salinity conditions, suggest that salinity variation caused by
summer rains can be discounted as a factor influencing abundance variation among taxa.
Concluding remarks
In summary, we show that mangrove pneumatophores provide an additional dimension of
habitat to the mud surface below them, and that the physical characteristics of this habitat
explain differences between pneumatophore and sediment assemblages. While we show that
pneumatophore arthropod assemblages differ at two different spatial scales: between and
within mangrove stands, it is obvious that complex gradients of habitat conditions must exist
over a variety of spatial scales. There is certainly scope to investigate much finer scales than
those considered here. For instance, it would be interesting to know whether vertical gradients
of assemblages exist along the pneumatophore length, considering the potential for
differential dehydration along pneumatophores. Even more challenging would be to consider
the scale of the sediment particle, which presumably represents the actual habitat space of
some ofthe smaller meiofauna, like nematodes and copepods.
Acknowledgements
Drs. Janet Reid (NMNH Smithsonian) and Nancy Rayner (UDW) are thanked for identifying
the copepods. Thanks also to the following people who helped on the collecting trips: Chris 92

George, J ayandra Rambaran, Vish Rajpal, Christian Nozais and Cindy Ouellet. The present
study was partly funded by the National Research Foundation and the University of Durban
Westville through grants to David J. Marshall.
References
Aikanathan S, Sasekumar A. 1994. The community structure of macroalgae in a low shore
mangrove forest in Salangor, Malaysia. Hydrobiologia , 285, 131-137.
Alongi DM. 1987. Interestuary variation and intertidal zonation of freeliving nematode
communities in tropical mangrove systems. Marine Ecology Progress Series, 40: 103-
114.
Alongi DM, Sasekumar A. 1992. Benthic communities. In Robertson AI, Alongi DM (eds.),
Tropical mangrove ecosystems, pp. 137-171. New York: American Geophysical
Union.
Bartsch I. 1990. Acarothrix palustris gen. et spec. nov. (Halacaroidea, Acari), ein Bewohner
der Salzwiesen Sudchinas. Zoologischer Anzeiger, 224: 204-210.
Beck MW. 2000. Separating the elements of habitat structure: independent effects of habitat
complexity and structural components on rocky intertidal gastropods. Journal of
Experimental Marine Biology and Ecology 249: 29-49.
Bolton JJ, Anderson RJ. 1997. Marine vegetation. In Cowling RM, Richardson DM, Pierce
SM (eds.), Vegetation of southern Africa pp. 348-370. Cambridge: Cambridge
University Press.
Branch GM, Grindley JR. 1979. Ecology of southern African estuaries. Part XI. Mngazana:
a mangrove estuary in the Transkei. South African Journal of Zoology, 14: 149-170.
Chapman MG. 1998. Relationshiop between spatial patterns of benthic assemblages in a
mangrove forest using different levels of taxonomic resolution. Marine Ecology
Progress Series, 162: 71-78.
Cheng L. 1976. Marine insects. Amsterdam: Northern Holland.
Clarke KR, Warwick RM. 1994. Changes in marine communities: an approach to statistical
analysis and interpretation. Plymouth: Plymouth Marine Laboratory.
Cockcroft VG, Forbes AT. 1981. Temperature and humidity in a southern African mangrove
swamp. South African Journal of Science 77: 41-42.
93

Dye AH. 1983a. Composition and seasonal fluctuations of meiofauna in a southern African
mangrove estuary. Marine Biology 73: 165-170.
Dye AH. 1983b. Vertical and horizontal distribution ofmeiofauna in mangrove sediments in
Transkei, southern Africa. Estuarine, Coastal and Shelf Science 16: 591-598.
Fain A, Hart BJ. 1986. A new, simple technique for extraction of mites, using the difference
in density between ethanol and saturated NaCl. (Preliminary note). Acarologia 27:
255- 256.
Farnsworth EJ, Ellison AM. 1996. Scale-dependent spatial and temporal variability in
biogeography of mangrove root epibiont communities. Ecological Monographs 66:
45- 66.
Gage JD. 1997. High benthic species diversity in deep-sea sediment: The importance of
hydrodynamics. In: Ormond RFG, Gage JD, Angel MV (eds.) Marine biodiversity.
Patterns and processes pp. 148-177. Cambridge: Cambridge University Press.
Gee JM. 1989. An ecological and economic review of meiofauna as food for fish. Zoological
Journal of the Linnean Society 96: 243-261.
Gee JM, Somerfield PJ. 1999. Do mangrove diversity and leaf litter decay promote
meiofaunal diversity? Journal of Experimental Marine Biology and Ecology 218: l3-
33.
Hyde RD. 1990. A study on the vertical distribution of intertidal fungi on Rhizophora
apiculata at Kampong Kapok mangroves in Brunei. Aquatic Botany 36: 255-262.
Luxton M. 1966. Laboratory studies on the feeding habits of saltmarsh Acarina, with notes on
their behaviour. Acarologia 8: 63-174.
Luxton M. 1967a. The ecology of saltmarsh Acarina. Journal of Animal Ecology 36: 257-
277.
Luxton M. 1967b. The zonation of saltmarsh Acarina. Pedobiologia 7: 55-66.
Ndaro SGM, Olafsson E. 1999. Soft-bottom fauna with emphasis on nematode assemblage
structure in a tropical lagoon in Zanzibar, eastern Africa: 1. spatial variability.
Hydrobiologia 405: l33-148.
Olafsson E. 1995. Meiobenthos in mangrove areas m eastern Africa with emphasis on
assemblage structure of free-living marine nematodes. Hydrobiologia 312: 47-57.
Olafsson E, Carlstrom S, Ndaro SGM. 2000. Meiobenthos of hypersaline tropical mangrove
sediment in relation to spring tide innundation. Hydrobiologia 426: 57-64. 94

Phillips A, Lambert G, Granger JE, Steinke TD. 1994. Horizontal zonation of epiphytic
algae associated with Avicennia marina (Forssk.) Vierh. pneumatophores at
Beachwood Mangroves Nature Reserve, Durban, South Africa. Botanica Marina 37:
567-576.
Potts M. 1980. Blue-green algae (Cyanophyta) in marine coastal environments of the Sinai
peninsula: distribution, zonation, stratification and taxonomic diversity. Phycologia
19: 60-98.
Pugh PJA, King PE. 1985. Feeding in intertidal Acari. Journal of Experimental Marine
Biology and Ecology 94: 269-280.
Satumanatpan S, Keough MJ, Watson GF. 1999. Role of settlement in detennining the
distribution and abundance of barnacles in a temperate mangrove forest. Journal of
Experimental Marine Biology and Ecology 241 : 45-66.
Somerfield PJ, Gee JM, Aryuthaka C. 1998. Meiofaunal communities in a Malaysian
mangrove. Journal of the Marine Biology Association of the United Kingdom 78: 717-
732.
Swan CM, Palmer MA. 2000. What drives small-scale spatial patterns in lotic meiofauna
communities? Freshwater Biology 44: 109-121.
Thibaud JM, Christian E. 1997. Biodiversity of interstitial Collembola (Insecta) in sand
sediments. European Journal of Soil Biology 33: 123-127.
Ward CJ, Steinke TD. 1982. A note on the distribution and approximate areas of mangroves
in South Africa. South African Journal of Botany 1: 51-53.
Woodroffe C. 1992. Mangrove sediments and geomorphology. In Robertson AI, Alongi DM
(eds.), Tropical mangrove ecosystems pp. 7-41. New York: American Geophysical
Union.
95

Chapter VI
Assemblage structure of two phylogenetically distinct arthropod
groups inhabiting mangrove pneumatophores
Abstract
Intertidal marine habitats support two groups of evolutionary widely-separated arthropods;
one having had a long marine evolutionary history (e.g. crustaceans) and the other, comprising
relatively recent colonizers (e.g. insects). Secondary marine (,terrestrial') taxa generally differ
from their typically 'marine' counterparts with respect to physiological and life history traits,
and biological interactions. For example, many taxa have enhanced capacities to tolerate
desiccation, and exhibit weak interspecific interactions. These propositions are examined here
by considering the ecological patterns of coexisting 'terrestrial' and 'marine' arthropods on
mangrove pneumatophores. Species abundances of nine taxa (five 'terrestrial' including
acarine and dipteran species, and four 'marine' including halacarid mite and copepod species)
were compared along an ecological stress gradient, by considering three pneumatophore
elevations for pneumatophores exposed to direct sunlight or in the shade. No clear distribution
pattern emerged to suggest that the 'terrestrial' arthropods were more tolerant of desiccation
stress than the 'marine' arthropods. The 'terrestrial' arthropods, which occurred in lower
abundance, showed greatest abundance at the lowest pneumatophore elevation, whereas the
'marine' arthropods were more abundant on the middle and upper pneumatophore segments.
These patterns however closely mirrored those of the most dominant species for each group.
Marked reductions in abundance of both groups of arthropod in the sun, as compared to the
shade, are interpreted as relating to limited food resources on sunned pneumatophores.
Abundance covariations for both groups of species and all species combined indicated highly
significant positive interactions for pneumatophores in the sun, but not those in the shade.
This is interpreted as an increase in competition among species (regardless of evolutionary
background) arising from synchronized fluctuations in populations tracking a limited resource,
under conditions of environmental stress. The similarity of this response in both evolutionary
groups suggests that they may not be as ecologically disparate as previously thought. There
are marked differences in ecological patterns among primary and secondary marine arthropods
96

for some taxa and some intertidal habitats, but this investigation highlights the limitations of
generalizing among taxa and habitats for either group.
Introduction
The need to include historical perspectives into community ecological investigations has been
realized for some time (Brooks, 1985; Waring, 1989; Wanntorp et al., 1990), but there are
numerous and seemingly insurmountable difficulties in achieving this (Holt, 1995). A simple
approach would require examining an ecological situation comprising evolutionary distinctive
taxonomic groups. While most ecological systems support taxa having diverse historical
backgrounds, in only a few are the differences in evolutionary history as clear as those found
in some marine intertidal systems. These usually support invertebrate taxa of marine origin,
e.g. cnidarians, annelids, molluscs, crustaceans, echinoderms (hereafter primary marine or
'marine') as well as taxa of recent terrestrial descent, e.g. insects and mites (hereafter
secondary marine or 'terrestrial') (Glynne-Williams & Hobart, 1952; Morton, 1954;
Chapman, 1998).
Differences in the evolutionary origin of the two groups appear to have different
consequences in respect of their ecological and biogeographical distributions (Proche~ &
Marshall, 2001a). For example, the restricted distribution of most 'terrestrial' arthropods to
intertidal habitats (as opposed to sub-tidal habitats), relates to phylogenetic ally constrained
physiological, life history and dispersal traits associated with their earlier terrestrial
backgrounds (Little, 1990; Vermeij & Dudley, 2000). More specifically, their life history
traits include, low fecundity (egg production), long generation times, and complex life-cycles
(cf. dipteran larval stages), and no 'terrestrial' arthropods produce pelagic larvae nor have the
capacity for aquatic respiration. Even though the evolutionary constraints of many 'terrestrial'
arthropods present fertile ground for investigation, their ecology remains poorly known. The
few ecological studies concerning rocky-shore, salt marsh and estuarine mites, are mostly not
quantitative (Luxton, 1967a; 1967b; Pugh & King, 1985a; 1985b; 1988; but see Kronberg,
1988; Mercer et al., 2000; Proche~ et a1., 2001), and none concern both primary and secondary
marine taxa, nor integrate evolutionary aspects into ecological interpretations.
Identifying the patterns and understanding the underlying processes which influence
variations in assemblage structure across vertical gradients, is an integral facet of intertidal
ecology (Underwood & Denley, 1984; Menge et a1., 1994; Roughgarden et al., 1994;
97

Underwood & Chapman, 1996; Connolly & Roughgarden, 1999). In general, intrinsic
physiological capacities of species for tolerance of physical stress determine upper shore
distribution limits, whereas low shore limits are largely influenced by biological interactions
(Menge, 2000). While this applies to most typically marine intertidal invertebrates and
especially to rocky shore situations, there is evidence to suggest that the opposite is applicable
in the case of secondary marine arthropods. They are intolerant of both submersion and wave
action, but are relatively more tolerant than 'marine' arthropods of air exposure and
desiccation (Neumann, 1976; Schulte, 1976a; 1976b; Witteveen & Joosse 1987; 1988; King et
aI., 1990; Pugh et aI., 1990; Chown & van Drimmelen, 1992; Mercer et aI., 2001). While
biological interactions probably largely influence the structuring of their upper-shore
assemblages, some evidence suggests that interactions between 'terrestrial' and 'marine' taxa
are weak or non-existent (for example, some predatory mites feed only on other 'terrestrial'
species) (see Proche~ & Marshall, 2001a).
This investigation, undertaken to compare the ecological patterns of arthropods from
different evolutionary backgrounds, considered intertidal mangrove pneumatophore taxa.
Pneumatophores are particularly suitable for a study of this nature, in that 1) they support a
variety of arthropods from the two evolutionary-distinct backgrounds, 2) the arthropods can be
readily collected and quantified, without loss of specimens, by cutting and bagging
pneumatophore segments, 3) vertical intertidal zonation patterns can be assessed by
considering different pneumatophore lengths (Phillips et aI. 1994, 1996), and 4) their habitat
structure is easily definable (Beck, 1998; 2000). Although numerous studies have considered
mangrove meiofauna (usually excluding 'terrestrial' taxa), these concern mainly benthic
sediments rather than the pneumatophores themselves (see Proche~ et aI., 2001). The present
investigation intended to determine whether the evolutionary-distinct groups respond in
different ways to physical environmental conditions and with respect to their biological
interactions. More specifically, it considered whether 1) intertidal vertical distributions and
abundances of species differed between the two evolutionary groups, 2) species interactions
were stronger within than between the groups of different origin, and 3) interactions between
and within these groups vary with varying degrees of physical stress.
98

Material and methods
Sampling locality
Mangroves are found in isolated stands in estuaries and bays along the eastern seaboard of
southern Africa, and typically comprise three widespread tree species, Avicennia marina
Forsk. (Vierh.), Bruguiera gymnorrhiza (L.) and Rhizophora mucronata Lam. (Macnae,
1963). We sampled Avicennia marina pneumatophores from the Bayhead mangrove forest in
the Durban Harbour, South Africa, (approximately 15 ha; 29° 53' S, 30° 61' E, Ward &
Steinke, 1982). An earlier study describing pneumatophore arthropod assemblages identified
the seaward fringe pneumatophores at Bayhead as being the most abundant and diverse
(Proche~ et al., 2001). These became the focus of the present study, which was undertaken in
March 2000.
Mangrove pneumatophore arthropod taxa
Only the most abundant arthropod species (taxa) were considered here, including mites
(Acari), dipterans, copepods and tanaids, giving four primary marine and five secondary
marine taxa (see Table 1 for taxonomic details). The secondary marine ('terrestrial') taxa
included insects and mites, but excluded the typically marine mite family, Halacaridae (see
Bartsch, 1989; 1996; Abe, 1996). The taxa are usually referred throughout by family (or
superfamily) name, as indicated in the table. In all but two cases, the taxa represent single
species; the Empidoidea contains three species from two families, while the Harpacticoidea
comprise two species from two families (see Table 1). Species of these taxa could not be
distinguished under the dissecting microscope.
Sample collection and processing
Twenty by one meter long line transects were established; ten in a shaded area (approximately
3m X 3m) and ten in an area exposed to direct sunlight for most of the day (approximately 3m
X 3m, and 5 m from the shaded area). The areas were otherwise similar with respect to tidal
position (110 - 120 cm above low spring tide level), and density and length of
pneumatophores (400 - 500 pneumatophoresl m2, 10 - 25 cm long). Considering that habitat
usage in most of the meiofaunal arthropods is not much greater than the size of a thumbnail,
and that colonization and recruitment is limited (Proche~ & Marshall, 2001 b), it was assumed
that each transect represented an independent site.
99
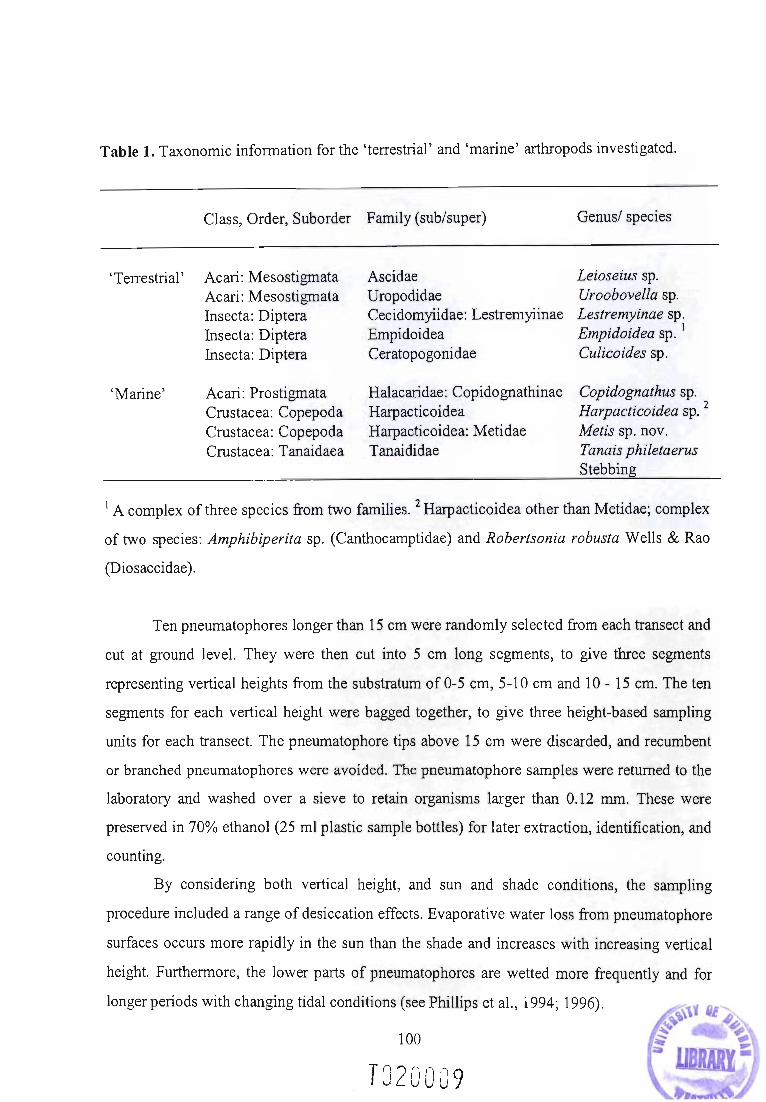
Table 1. Taxonomic information for the 'terrestrial' and 'marine' arthropods investigated.
'Terrestrial'
'Marine'
Class, Order, Suborder Family (sub/super)
Acari: Mesostigmata Acari: Mesostigmata Insecta: l)iptera Insecta: l)iptera Insecta: l)iptera
Acari: Prostigmata Crustacea: Copepoda Crustacea: Copepoda Crustacea: Tanaidaea
Ascidae Uropodidae Cecidomyiidae: Lestremyiinae Empidoidea Ceratopogonidae
Halacaridae: Copidognathinae Harpacticoidea Harpacticoidea: Metidae Tanaididae
Genus/ species
Leioseius sp. Uroobovella sp. Lestremyinae sp. Empidoidea sp. 1
Culicoides sp.
Copidognathus sp. Harpacticoidea sp. 2
Metis sp. nov. Tanais philetaerus Stebbing
1 A complex of three species from two families. 2 Harpacticoidea other than Metidae; complex
of two species: Amphibiperita sp. (Canthocamptidae) and Robertsonia robusta Wells & Rao
(Diosaccidae) .
Ten pneumatophores longer than 15 cm were randomly selected from each transect and
cut at ground level. They were then cut into 5 cm long segments, to give three segments
representing vertical heights from the substratum of 0-5 cm, 5-10 cm and 10 - 15 cm. The ten
segments for each vertical height were bagged together, to give three height-based sampling
units for each transect. The pneumatophore tips above 15 cm were discarded, and recumbent
or branched pneumatophores were avoided. The pneumatophore samples were returned to the
laboratory and washed over a sieve to retain organisms larger than 0.12 mm. These were
preserved in 70% ethanol (25 ml plastic sample bottles) for later extraction, identification, and
counting.
By considering both vertical height, and sun and shade conditions, the sampling
procedure included a range of desiccation effects. Evaporative water loss from pneumatophore
surfaces occurs more rapidly in the sun than the shade and increases with increasing vertical
height. Furthermore, the lower parts of pneumatophores are wetted more frequently and for
longer periods with changing tidal conditions (see Phillips et a1., 1994; 1996).
100
T020009

In order to extract the mites, tanaids, and some insect larvae, the contents of the bottles
were first treated with hypersaline solution (see Fain and Hart, 1986). All floating specimens
were removed from the sample bottles, identified and counted under a dissecting microscope
(X 100 magnification). The remaining fraction was then brought to a 50 ml volume
homogeneous aqueous solution. Three by 5 ml sub-samples were taken from this solution and
the arthropods contained (mainly copepods and insect larvae) were determined and counted.
The average number of individuals per 50 ml volume was derived by mUltiplication. The total
number of individuals for each sample was determined by addition of each fraction. From the
ten replicate transects, mean abundances of each arthropod species, and that of total
'terrestrial' or 'marine' arthropods (number of individuals per 10 pneumatophores) were
determined for each vertical level, for pneumatophores in the shade and sun.
Statistical analysis
Two-way ANOVA's (applied on log-transfonned data) were used to assess significant levels
of the effects of sunlight and elevation on abundance, for the species (species against sunlight
and species against elevation), and evolutionary groups (groups against sunlight and groups
against elevation). As a first measure of species interactions, Pearson's correlation coefficients
were determined for abundances of species pairs, without considering elevation or sunlight
condition. Both within ('terrestrial' or 'marine' species) and between ('marine' versus
'terrestrial' species) evolutionary group relationships were determined.
A second analysis considered species abundance covariation (according to Schluter,
1984). This analysis determined the ratio of the variance (V) for total abundance of the group
to the sum of the variances for abundance of each component of a group. Ratios of greater
than one (V> 1) indicate positive interactions while those of less than one (V<1), negative
interactions (see Schluter, 1984; Gabriel et aI., 2001). Levels of significance were determined
using an associated statistic CW), which equals nVand has a chi-squared distribution (Schluter,
1984). We undertook analyses to assess the abundance covariation for three groups of
arthropods for the six combination of sunlight and elevation conditions, and overall. The
groups comprised 'terrestrial' species only, 'marine' species only, and all species irrespective
of evolutionary background.
101

Results
Abundances in relation to sunlight and elevation
All nine arthropod species were distributed along the entire length of pneumatophores, for
both pneumatophores in the direct sun and those in the shade. However, abundances differed
significantly among species and between the two evolutionary groups; the 'marine' arthropods
were more abundant than the 'terrestrial' arthropods by nearly an order of magnitude (Figures
1 and 2; Tables 1 and 2). At both the level of species and evolutionary group, abundances
varied significantly with elevation and between pneumatophores in the sun and shade (Figures
1 and 2; Tables 1 and 2). Total abundance of each evolutionary group, however, reflected that
of the dominant species. In the 'marine' group, the Tanaididae was dominant, occurring at an
average of 408.1 individuals/ 10 pneumatophores. In the 'terrestrial' group, the
Ceratopogonidae was dominant, occurring at 52.1 individuals/ 10 pneumatophores. The least
abundant 'marine' and 'terrestrial' species were, respectively, the Metidae and Ascidae,
occurring at 34.1 and 5.75 individuals/ 10 pneumatophores (Figure 1). Pneumatophore density
in the area sampled was approximately 450 per m2.
Direct sunlight significantly reduced abundances of both 'marine' and 'terrestrial'
arthropods (Figure 2; Table 3). However, the effect of sun exposure on abundance varied
among species. For example, abundances on sun-exposed pneumatophores compared to
shaded pneumatophores were significantly lower for the Halacaridae, Tanaididae, and
Ceratopogonidae and significantly greater for the Harpacticoidea (Figure 1). Although
elevation had a significant effect on arthropod abundance in general (Tables 2 and 3), this
differed among the evolutionary groups. Abundance decreased almost linearly with increasing
elevation for the 'terrestrial' arthropods, but was maximal at the intermediate level of
elevation (though not significantly different from the uppermost level) for 'marine' arthropods
(Figure 2). These trends for abundance in relation to elevation were mirrored for conditions of
sunlight and shade (Figure 2). As a whole, the patterns largely mirrored those of the most
abundant species of each group (see above; Figures 1 and 2).
102

Table 2. Two-way analysis of variance showing the effects of exposure to sunlight and
elevation on the abundance of pneumatophore arthropod species.
Source of Variation SS dj MS F P-value F cril
Sunlight 6.63 1 6.63 26.41 0.000 3.86 Species 107.43 8 13.43 53.45 0.000 1.96 Interaction 18.13 8 2.27 9.03 0.000 1.96
Elevation 0.27 2 0.134 0.51 0.599 3.01 Species 107.43 8 13.43 50.80 0.000 1.96 Interaction 19.91 16 1.24 4.7l 0.000 1.66
Table 3. Two-way analysis of variance showing the effects of exposure to sunlight and
elevation on the abundance of pneumatophore arthropods from two different backgrounds
(terrestrial and marine).
Source of Variation SS df MS F P-value F crit
Sunlight 0.33 1 0.33 29.34 0.000 3.92 'Terrestrial' / 'marine' 0.72 1 0.72 63.53 0.000 3.92 Interaction 0.04 1 0.04 3.17 0.078 3.92
Elevation 0.36 2 0.18 0.98 0.379 3.08 'Terrestrial' / 'marine' 19.25 1 19.25 105.28 0.000 3.92 Interaction 2.46 2 1.23 6.73 0.002 3.08
103

Figure 1. Abundance values (mean and SE for n=10 sets of ten pneumatophore segments
each) for individual arthropod taxon in the shade and in the sun, at three levels of elevation.
Grey bars indicate pneumatophores in the shade, and white bars, pneumatophores in the sun.
The elevation levels indicated represent: 1: 0-5 cm; 2: 5-10 cm; 3: 10-15 cm above ground. A,
'terrestrial' arthropods; B, 'marine' arthropods. One-way ANOV A's were used to check for
differences between the different environmental conditions (P<0.05): * significant differences
between shade and sun; ** significant differences between elevation levels.
Figure IA.
Ascidae
elevation
Cecidomyiidae
elevation
Ceratopogonidae', ••
$0
~
El '0 ('Q "CI 40 C i! 20 ('Q
elevation
~ U 20 C ('Q 15
"CI C 10 ::$ .c 5 ('Q
10 ~
Uropodidae', ..
elevation
Empidoidea
u , c ('Q ,
"CI C 4 ::$ .c 2 ('Q
104
elevation

Figure lB.
Total terrestrial Total marine Total arthropods '," arthropods', •• arthropods', ..
600 (1)
500 (1)
... ~ (1)
'00 1 to)
u u C 400 C t o C (1:1 (1:1 '0 (1:1 'C 300 'C 'C C 200 C 40 C iij ~,L.L :: ::s 20 ::s .Q 100 .Q .Q (1:1
0 (1:1 0 (1:1
2 3 2 3
elevation elevation elevation
Figure 2. Total abundance values for 'terrestrial', 'marine', and 'all' arthropods. Shading of
bars and asterisks have the same meaning as in Figure 1.
105

Abundance relationships among species
Pearson's correlation coefficients for abundance relationships are shown in Table 4. These
were all positive within the 'terrestrial' group with the exception of one relationship, but only
half of the relationships were significant. Within the 'marine' group, half the relationships
were negative with a single relationship being significant. Abundance relationships between
the 'terrestrial ' and the 'marine' species gave three significantly negative and three
significantly positive correlations. The strongest positive relationship was noted between two
'marine' species (the Halacaridae and Tanaididae), while the strongest negative relationship
occurred between a 'terrestrial' and a 'marine' species (the Ceratopogonidae and Halacaridae)
(Table 4).
Table 4. Pearson's correlation coefficient for abundance relationships among nine arthropod
taxa (ASCI, Ascidae; UROP, Uropodidae; EMPI, Empidoidea; CECI, Cecidomyiidae; CERA,
Ceratopogonidae; HALA, Halacaridae; HARP, Harpacticoidea; METI, Metidae; TANA,
Tanaididae). Bold indicates significant relationships (P < 0.05).
'Terrestrial' - ASCI-UROP +0.291 'Terrestrial' - ASCI-HALA +0.306 'terrestrial' ASCI-EMPI +0.094 'marine' ASCI-HARP -0.044
ASCI-CECI +0.254 ASCI-METI -0.068 ASCI-CERA -0.067 ASCI-TANA +0.299 UROP-EMPI +0.323 UROP-HALA -0.082 UROP-CECI +0.105 DROP-HARP -0.145 UROP-CERA +0.264 UROP-METI +0.140 CECI-CERA +0.020 UROP-TANA +0.110 CECI-EMPI +0.122 CECI-HALA +0.032 EMPI-CERA +0.377 CECI-HARP -0.061
CECI-METI +0.266 CECI-TANA -0.097 EMPI-HALA +0.072 EMPI-HARP -0.262
HALA-HARP +0.062 EMPI-METI +0.028 HALA-METI -0.187 EMPI-TANA +0.126
'Marine'- HALA-TANA +0.543 CERA-HALA -0.275 'marine' HARP-METI +0.014 CERA-HARP -0.273
HARP-TANA -0.113 CERA-METI +0.232 METI-TANA -0.219 CERA-TANA -0.010
106

Effects of sunlight and elevation on abundance covariation
The variance ratios (V) indicating abundance covariation were low, and significant, for
'marine'arthropods at low elevations on the pneumatophores (both in the shade and in the
sun) (Table 5), indicating strong negative interactions. On the contrary, 'terrestrial species'
did not yield significant results for any of the specific habitat types, but only when all samples
were considered together, in this case suggesting mildly positive interactions. However, when
all arthropod species were considered together, the values were remarkably high, especially in
the sun and at higher elevations (Table 5), indicating strong positive interactions.
Table 5. Variance ratios (V) of abundance covariation for three groups of arthropod species on
shaded and sunlit mangrove pneumatophores, at three elevation levels (1: 0-5 cm; 2: 5-10 cm;
3: 10-15 cm); n= 1 0 for each combination of elevatiOn/sunlight, n=60 for the total. Asterisks
mark significant values, as indicated by the associated test statistic W, with a chi-squared
distribution (Schluter, 1984): * P<0.05; ** P<0.005.
'Terrestrial' species 'Marine' species All species
Shade, low elevation 0.99 0.03** 0.46 Shade, middle elevation 0.70 0.11 ** 1.04 Shade, upper elevation 1.19 0.48 2.27* Sun, low elevation 1.54 0.03** 1.93* Sun, middle elevation 1.26 0.23* 1.24 Sun, upper elevation 1.59 0.51 3.09** Total 1.36* 1.21 1.21
Discussion
Mangrove meiofaunas have been examined mainly with respect to understanding their
diversity and assemblage structure (Dye, 1983a; Gee, 1989; Olafsson, 1995; Gee &
Somerfield, 1999; Ndaro & Olafsson, 1999; Olafsson et aI., 2000). The majority of studies
concentrate on the benthic sediment meiofauna with considerably less known about the
pneumatophore meiofaunal assemblages. These have been shown to differ from benthic
sediment assemblages in their species composition and abundance (Proche~ et aI., 2001), and
such differences are thought to relate to greater habitat variability along the vertical lengths of
107

pneumatophores (Proche~ & Marshall, 2001b). Even though mangrove pneumatophores can
be readily sampled and their meiofaunal assemblages accurately determined, and thus they
offer unique ,possibilities for exploring ecological theory (regarding distribution, abundance,
recruitment, and colonization) over very small spatial scales, surprisingly few studies have
taken advantage of this (Alongi, 1987; Bingham & Young, 1992; Farnsworth & Ellison,
1996), The disparate evolutionary backgrounds of the taxa comprising pneumatophore
meiofaunal assemblages (typically marine, or of recent terrestrial decent), make these
assemblages particularly suitable for investigating the effects of evolutionary history on
ecological patterns, as was the objective of the present investigation.
We show here that distributions and abundances of arthropods on pneumatophores are
distinctly variable 1) among the evolutionary disparate groups, and 2) in relation to elevation
and conditions of sun exposure. The total abundance of 'marine' arthropods was almost an
order of magnitude greater than that of the 'terrestrial' arthropods. With respect to relative
abundance of each group in relation to elevation, the 'marine' arthropods predominated at the
middle and upper levels and the 'terrestrial' species at the lower level, patterns corresponding
with those of the dominant species of each group (see Ceratopogonidae and Tanaididae; Figs.
1 and 2). Although increased activity/inactivity and vertical migrations in relation to tidal
cycles characterize the behaviour of many intertidal invertebrates, this is unknown for
meiofaunal arthropods. Therefore, other than the potentially active predatory mite, Ascidae
(see Krantz, 1978), the abundance distributions observed here are likely to persist temporally
during the tidal cycle.
While the foregoing account highlights discrepancies in abundance in relation to
pneumatophore elevation, a more striking effect was observed in comparisons between
pneumatophores in the sun and those in the shade. The low abundance of arthropods on sun
exposed pneumatophores throughout, may relate to their intolerance of dehydration. But,
given that no taxonomic patterns were apparent to suggest species differences in stress
tolerance, these abundances more likely relate to changes in habitat and food availability
deriving from reduced algal or detrital development on dehydrated pneumatophores.
Irrespective of taxonomic resolution, be it species, evolutionary group, or the arthropods as
a whole, lowest abundances consistently occurred on the uppermost pneumatophore level, for
pneumatophores in the sun (the most extreme physical condition), Species distributional limits
are probably realized on these pneumatophore segments, and this is particularly apparent in
108

the case of two taxa (Ceratopogonidae - 'terrestrial' and Metidae - 'marine'; Figure 1).
Studies on intertidal benthic communities are at the forefront of testing ecological
theory concerning biological interactions (e.g. Underwood & Denley, 1984; Menge et al.,
1994; Underwood & Chapman, 1996; Berlow, 1997; 1999; Berlow et al., 1999; Leonard,
2000; Menge, 2000). These have considered the implications, for community structuring, of
directions and strengths of interactions in relation to environmental stress. Although it is
frequently argued that definitive conclusions concerning species interactions require field
experimental manipulations, and often the removal of one or more components of the
community (see Menge et al., 1994; Menge 2000), in many circumstances this is practically
impossible. The only alternative to achieving insights into species interactions of
meioarthropods is through derivations of correlation or covariation in species abundance (see
Gabriel et al., 2001). Species abundance correlations of the pneumatophore arthropods where
largely not statistically significant, and therefore limited in interpretation, but they could
suggest weak interactions. There were no clear patterns within or between evolutionary groups
to distinguish one group from the other. The strongest association was seen between the
Halacaridae and the Tanaididae, which were the most abundant taxa on the middle and upper
pneumatophore segments in the shade. This may represent a real interaction, even when
habitat circumstances (elevation and sunlight) are not taken into account.
Distinct abundance covariation patterns were observed with respect to both elevation
and the sunlight conditions, although these affected differently the different groups of
arthropods, and were not observed in 'terrestrial' species. The covariations for the uppermost
elevation (suggesting weak non-significant positive or negative interactions for 'terrestrial'
and 'marine' arthropods respectively, but significant positive interactions when all species
were considered together), is probably accountable to the low abundances and differential
species limits at this elevation (Table 5). As previously mentioned, reduced abundances on
pneumatophores is best explained as relating to a limitation on food resources. In competing
for this limited resource, species popUlations will fluctuate in unison, and be observable as
positive associations (see Schluter, 1984). The amelioration of potential food resources as
occurs on the lower levels of the pneumatophores, is likely to increase interspecific
competition and be observed as stronger negative interactions. However, the findings here
presented suggest that these interactions differ between 'terrestrial' and 'marine' arthropods in
relation to physical conditions.
109

Our ecological distribution findings suggest that mangrove pneumatophores contain
arthropod species having an array of possible physiological tolerances, which are not
necessarily group-specific for any particular evolutionary group. Furthermore, there is little
evidence to suggest that interactions among the 'marine' arthropods are stronger and better
developed than those among the 'terrestrial' arthropods. However, physical aspects on
mangrove pneumatophores play an important role in increasing the degree of interaction
among the arthropods. A more in-depth understanding of what influences distributions and
abundances of these arthropods, requires investigations into the availability of primary food
resources and habitat. The similarity of responses for both evolutionary groups suggests that
they may not be as ecologically disparate as previously thought. There are marked differences
in ecological patterns among primary and secondary marine arthropods for some taxa and
some intertidal habitats (see Schulte, 1976a; 1976b; Kronberg, 1988; Cheng & Frank, 1993),
but this investigation highlights the limitations on generalizing among taxa and habitats for
either group.
Acknowledgements
Janet Reid (NMNH Smithsonian) and Nancy Rayner (UDW) are thanked for identifying the
copepods, Gert Venter (Veterinary Institute, Onderstepoort) for checking our identification of
Culicoides. Kaajial Ugrasen and Ashvita Ramcharan (UDW) determined many of the
arthropod samples. The study was partly supported by the National Research Foundation
(grant to DJM) and the University of Durban-Westville.
110

References
Abe H. 1996. Rhombognathine Mites. Taxonomy, Phylogeny, and Biogeography. Sapporo:
Hokkaido University Press.
Alongi DM. 1987. Interestuary variation and intertidal zonation of freeliving nematode
communities in tropical mangrove systems. Marine Ecology Progress Series 40: 103-
114.
Bartsch I. 1989. Marine mites (Halacaroidea: Acari) A geographical and ecological survey.
Hydrobiologia 178: 21 - 42.
Bartsch I. 1996. Halacarids (Halacaroidea, Acari) in freshwater. Multiple invasions from the
Paleozoic onwards? Journal of Natural History 30: 67-99.
Beck MW. 1998. Comparison of the measurement and effects of habitat structure on
gastropods in rocky intertidal and mangrove habitats. Marine Ecology Progress Series
169: 165-178.
Beck MW. 2000. Separating the elements of habitat structure: independent effects of habitat
complexity and structural components on rocky intertidal gastropods. Journal of
Experimental Marine Biology and Ecology 249: 29-49.
Berlow EL. 1997. From canalization to contingency: historical effects in a successional rocky
intertidal community. Ecological Monographs 67: 435-460.
Berlow EL. 1999. Strong effects of weak interactions in ecological communities. Nature 398:
330-334.
Berlow EL, Navarrete SA, Briggs CJ, Power ME, Menge BA. 1999. Quantifying variation
in the strengths of species interactions. Ecology 80: 2206-2224.
Bingham BL, Young eM. 1992. Stochastic events and dynamics of a mangrove root
epifaunal community. Marine Ecology 16: 145-163.
Brooks DR. 1985. Historical ecology: A new approach to studying the evolution of ecological
associations. Annals of the Missouri Botanical Garden 72: 660-680.
Chapman MG. 1998. Relationshiop between spatial patterns of benthic assemblages in a
mangrove forest using different levels of taxonomic resolution. Marine Ecology
Progress Series 162: 71-78.
111

Cheng L, Frank JH. 1993. Marine insects and their reproduction. Oceanography and Marine
Biology Annual Review 31: 479-506.
Chown SL, van Drimmelen M. 1992. Water balance and osmoregulation in weevil larvae
(Coleoptera: Curculionidae: Brachycerinae) from three different habitats on sub
Antarctic Marion Island. Polar Biology 12: 527-532.
Connoly SR, Roughgarden J. 1999. Theory of marine communities: competition, predation,
and recruitment-dependent interaction strength. Ecological Monographs 69: 227-296.
Dye AH. 1983a. Composition and seasonal fluctuations of meiofauna in a southern African
mangrove estuary. Marine Biology 73: 165-170.
Dye AH. 1983b. Vertical and horizontal distribution of meiofauna in mangrove sediments in
Transkei, southern Africa. Estuarine, Coastal and Shelf Science 16: 591-598.
Fain A, Hart BJ. 1986. A new, simple technique for extraction of mites, using the difference
in density between ethanol and saturated NaCl. (Preliminary note). Acarologia 27:
255-256.
Farnsworth EJ, Ellison AM. 1996. Scale-dependent spatial and temporal variability in
biogeography of mangrove root epibiont communities. Ecological Monographs 66: 45-
66.
Gabriel AGA, Chown SL, Barendse J, Marshall DJ, Mercer RD, Pugh PJA, Smith VR.
2001. Biological invasions of Southern Ocean's islands: the Collembola of Marion
Island as a test of generalities. Ecography 24: 421-430.
Gee JM. 1989. An ecological and economic review of meiofauna as food for fish. Zoological
Journal o/the Linnean Society 96: 243-261.
Gee JM, Somerfield PJ. 1999. Do mangrove diversity and leaf litter decay promote
meiofaunal diversity? Journal of Experimental Marine Biology and Ecology 218: 13-
33.
Glynne-Williams J, Hobart J. 1952. Studies on the crevice fauna of a selected shore in
Anglesey. Proceedings o/the Zoological Society in London 122: 794-824.
Holt RD. 1995. Linking species and ecosystems: Where's Darwin? In: Jones CG, Lawton JH
(eds) Linking species and ecosystems, London: Chapman & Hall, pp. 273-279.
112

King PE, Pugh PJA, Fordy MR, Love N, Wheeler SA. 1990. A comparison of some
environmental adaptations of the littoral collembolans Anuridella marina (Will em)
and Anurida maritima (Guerin). Journal of Natural History 24: 673-688.
Krantz GW. 1978. A manual of Acarology (ed. 2). Corvallis: Oregon University Book Stores.
Kronberg I. 1988. Structure and adaptation of the fauna in the black zone (littoral fringe)
along rocky shores in northern Europe. Marine Ecology Progress Series 49: 95-106.
Leonard GH. 2000. Latitudinal variation in species interactions: a test in the New England
rocky intertidal zone. Ecology 81: 1015-1030.
Little C. 1990. The terrestrial invasion: an ecophysiological approach to the origins of land
animals. Cambridge: Cambridge University Press.
Luxton M. 1967a. The ecology of saltmarsh Acarina. Journal of Animal Ecology 36: 257-
277.
Luxton M. 1967b. The zonation of saltmarsh Acarina. Pedobiologia 7: 55-66.
Macnae W. 1963. Mangrove swamps in South Africa. Journal of Ecology 51: 1-25.
Menge BA. 2000. Testing the relative importance of positive and negative effects on
community structure. Trends in Ecology and Evolution 15: 46-47.
Menge BA, Berlow EL, Blanchette CA, Navarrete SA, Yamada SB. 1994. The keystone
species concept: variation in interaction strength in a rocky intertidal habitat.
Ecological Monographs 64: 149-286.
Mercer RD, Chown SL, Marshall DJ. 2000. Mite and insect zonation on a Marion Island
rocky shore: a quantitative approach. Polar Biology 23: 775-784.
Morton JE. 1954. The crevice fauna of the upper intertidal zone at Wembury. Journal of the
Marine Biological Association of the UK. 33: 187-224.
Ndaro SGM, Olafsson E. 1999. Soft-bottom fauna with emphasis on nematode assemblage
structure in a tropical lagoon in Zanzibar, eastern Africa: 1. spatial variability.
Hydrobiologia 405: 133-148.
Neumann D. 1976. Adaptations of chironomids to intertidal environments. Annual Review of
Entomology 21: 387-414.
Olafsson E. 1995. Meiobenthos III mangrove areas III eastern Africa with emphasis on
assemblage structure of free-living marine nematodes. Hydrobiologia 312: 47-57.
113

Olafsson E, Carlstrom S, Ndaro SGM. 2000. Meiobenthos of hypersaline tropical mangrove
sediment in relation to spring tide innundation. Hydrobiologia 426: 57-64.
Phillips A, Lambert G, Granger JE, Steinke TD. 1994. Horizontal zonation of epiphytic
algae associated with Avicennia marina (Forssk.) Vierh. pneumatophores at
Beachwood Mangroves Nature Reserve, Durban, South Africa. Botanica Marina 37:
567-576.
Phillips A, Lambert G, Granger JE, Steinke TD. 1996. Vertical zonation of epiphytic algae
associated with Avicennia marina (Forssk.) Vierh. Pneumatophores at Beachwood
Mangroves Nature Reserve, Durban, South Africa. Botanica Marina 39: 167-175.
Proche~ ~, Marshall DJ. 2001a. Global distribution patterns of non-halacarid marine
intertidal mites: implications for their origins in marine habitats Journal of
Biogeography 28: 47-58.
Proche~ ~, Marshall DJ. 2001b. Epiphytic algal growth and sediment deposition as
determinants of arthropod distribution and abundance on mangrove pneumatophores.
Estuarine, Coastal and Shelf Science, submitted.
Proche~ ~, Marshall DJ, Ugrasen K, Ramcharan A. 2001. Mangrove pneumatophore
arthropod assemblages and seasonality patterns. Journal of the Marine Biological
Association of the United Kingdom 81: 545-552.
Pugh PJA, King PE. 1985a. Feeding in intertidal Acari. Journal of Experimental Marine
Biology and Ecology 94: 269-280.
Pugh PJA, King PE. 1985b. The vertical distribution of the British intertidal Acari - The non
halacarid fauna (Arachnida: Acari). Journal of Zoo logy 207: 21-33.
Pugh PJA, King PE. 1988. Acari of the British supralittoral. Journal of Natural History 22:
107-122.
Pugh PJA, King PE, Fordy MR. 1990. Respiration in Fortuynia maculata Luxton
(Fortuyniidae: Cryptostigmata: Acari) with particular reference to the role of van der
Hammen's organ. Journal of Natural History 24: 1529-1547.
Roughgarden J, Pennington JT, Alexander S. 1994. Dynamics of rocky intertidal zone with
remarks on generalization in ecology. Philosophical Transactions of the Royal Society
of London Series B 343: 79-85 .
114

Schluter D. 1984. A variance test for detecting species asociations, with some example
applications. Ecology 65: 998-1005.
Schulte G. 1976a. Zur Nahrungsbiologie der terrestrischen und mannen Milbenfamilie
Ameronothridae. Pedobiologia 16: 332-352.
Schulte G. 1976b. Gezeitenrythmische Nahrungsaufuahme und Kotballenablage emer
terrestrischen Milbe (Oribatei: Ameronothridae) im marinen Felslitoral. Marine
Biology 37: 265-277.
Underwood AJU, Denley EJ. 1984. Paradigms, expenations, and generalizations in models
for the structure of intertidal communities on rocky shores. In: Strong DR, Simberloff
D, Abele LG, Thistle AB (eds) Ecological communities: conceptual issues and the
evidence. Princeton: Princeton University Press, pp. 151-180.
Underwood AJU, Chapman MG. 1996. Scales of spatial patterns of distribution in intertidal
invertebrates. Oecologia 107: 212-224.
Vermeij GJ, Dudley R. 2000. Why are there so few evolutionary transitions between aquatic
and terrestrial ecosysytems? Biological Journal of the Linnean Society 70: 541-554.
Wanntorp H-E, Brooks DR, Nilsson T, Nylin S, Ronquist F, Stearns SC, Wedell N. 1990.
Phylogenetic approaches in ecology. Oikos 57: 119-132.
Ward CJ, Steinke TD. 1982. A note on the distribution and approximate areas of mangroves
in South Africa. South African Journal of Botany 1: 51-53.
Waring RH. 1989. Ecosystems: fluxes of matter and energy. In: Cherrett JM (ed) Ecological
concepts: the contributions of ecology to the understanding of the natural world.
Oxford: Blackwell Scientific Publications, pp. 17-42.
Witteveen J, Joosse ENG. 1987. Growth, reproduction and mortality in marine Collembola at
different salinities. Ecological Entomology 12: 459-469.
Witteveen J, Joosse ENG. 1988. The effects ofinnundation on marine Collembola. Holarctic
Ecology 11: 1-7.
115

Chapter VII
Epiphytic algal cover and sediment deposition as determinants of
arthropod distribution and abundance on mangrove
pneumatophores
Abstract
Intertidal mangrove pneumatophores often support a variety of epiphytes (of both animal and
plant taxa). These may facilitate sediment deposition on pneumatophores, especially in the cases
of finely structured algae, and in estuarine systems where fine sediments are characteristic. The
sediment covering on pneumatophores shelters complex arthropod communities, comprising
mites, crustaceans and insects. We report here an investigation on mangrove pneumatophores
examining the relationships between arthropod abundance (for nine meiofaunal taxa), algal
growth and sediment cover. There was a strong correlation between mass of the sediment and
mass of the macroalgae, supporting the assumption that pneumatophore sediment cover depends
on algal growth. These two components of pneumatophore cover were negatively related to
elevation, an effect probably relating to desiccation-limited algal growth towards the
pneumatophore tips. Total arthropod abundance and that of some taxa (particularly, Uropodidae
(Acari), Metidae (Crustacea), Ceratopogonidae (Insecta) and Empidoidea (Insecta)), was
negatively correlated with elevation and positively correlated with sediment and algal cover,
suggesting a good relationship between abundance and habitat availability. Other arthropod taxa
(particularly, Halacaridae (Acari)), however, showed the opposite pattern of relationships. Their
distributions and abundances on pneumatophores must therefore depend to a greater extent on
other factors (habitat conditions and biotic interactions for example) than on available habitat.
When pneumatophore cover was physically removed, in an experiment to assess assemblage
recovery rates, some arthropod taxa (Halacaridae (Acari), Harpacticoidea (Crustacea) and
Ceratopogonidae (Insecta)) had completely recovered by twenty five weeks. Their recovery is
therefore only partially dependent on the recovery ofthe pneumatophore cover. Those taxa which
showed incomplete recovery (Tanaididae (Crustacea) and Empidoidea (Insecta)) are likely to be
constrained by life history characteristics and/or habitat availability. In conclusion, epiphytic
116

growth (and its associated sediment) has a key role in determining the assemblage composition
and structure of pneumatophore meiofaunal arthropods. Given the considerable taxonomic
variability of pneuma to ph ore epiphytes among systems and geographically, there is much scope
for comparison, through similar investigations from other regions.
Introduction
The habitat structure of mangrove systems is extremely complex and variable between and within
systems. Mangrove habitats comprise hard substrata (pneumatophores and tree trunks)
interspersed in a soft substratum matrix (benthic sediment). These elements of habitat support
vastly differing suits of biota: sediments typically can support burrowing organisms, whereas
sedentary organisms can attach to pneumatophores. Habitat variety appears even more remarkable
when considering spatial scale. For example, pneumatophore structure is variable over small
scales (Beck, 2000) and depressions in the otherwise near homogeneous benthic sediment may
vary considerably in physicochemical conditions (Olafsson et aI., 2000). Superimposed on entire
mangrove systems are effects deriving from tidal cycles in the intertidal zone (variable wetting,
see Dye, 1983b), and those deriving from exposure to direct sunlight (as opposed to shading under
tree canopies, see Proche~ & Marshall, 2001).
Although a bulk of information is available for mangrove communities, this appears to be
skewed towards studies examining the benthic component of these communities (Alongi &
Sasekumar, 1992; Kathiresan & Bingham, 2001). Much less known about the pneumatophore
component, which can contribute an extensive surface area to mangrove systems. Most studies
on pneumatophores concern epiphytic ecology, particularly that of algae (de Oliveira, 1984;
Davey & Woelkerling, 1985; Tanaka & Chihara, 1987; Mann & Steinke, 1988; Coppejans &
Gallin, 1989; Phillips et aI., 1994; 1996), though a few do consider the sessile fauna (Bingham,
1992; Bingham & Young, 1994; Satumanatpan et aI., 1999; Satumanatpan & Keough, 2000).
With respect to meiofaunal assemblages of mangrove systems (especially nematode and copepod
assemblages), those of the benthic sediments have received significant attention (Olafsson, 1995;
Schrijvers et aI., 1995; Somerfield et aI, 1998; Gee & Somerfield, 1999; Ndaro & Olafsson,
1999; Olafsson et aI., 2000), with relatively little known about the assemblages associated with
pneumatophores.
117

A recent study has however shown that pneumatophore arthropod assemblages differ markedly
from those of benthic sediments (proche~ et al., 2001). Differences are suggested to arise from
the steep gradient of drying along the vertical length of pneumatophores (Proche~ & Marshall
2001; Proche~ et al., 2001), but there is much scope for further investigation here.
Mangrove pneumatophore arthropod faunas are of special interest in that they comprise
proportionally more secondary marine taxa than faunas of most other intertidal systems, and thus
offer unique opportunities for examining evolutionary constraints on ecological patterns (proche~
& Marshall 2001). In addition, they provide opportunities for testing ecological theory over
small scales and across extremely narrow physical gradients. However, this task is not easily
attained, given that arthropod abundance and species richness could be directly affected by the
environmental conditions (microclimate) on the pneumatophore, indirectly, as these conditions
affect algal biomass and sediment deposition, or in both ways. Separating these effects is only
possible by combining mass/abundance measurements with experimental work. Therefore, this
study examined the relationships of arthropod abundances (including mites, insects, copepods
and tanaids) with pneumatophore algal growth and sediment cover (the primary elements of
microhabitat of these arthropods), and related these with the rates of arthropod recolonization
after the algal and sediment cover is removed from pneumatophores.
Material and methods
Locality and arthropod taxa
Sampling was undertaken in the Bayhead mangrove forest, Durban, South Africa (290 53' S, 300
61' E), between March and December 2000. This forest covers an area of approximately 15 ha
(Ward and Steinke, 1982) and experiences a regular tidal cycle with salinity fluctuating between
27 and 35 (Begg, 1976). Previous studies identified the seaward fringe pneumatophores at
Bayhead as comprising the most complex and abundant arthropod assemblages (proche~ &
Marshall, 2001; Proche~ et al., 2001). These pneumatophores therefore became the focus of the
present study. The ten most abundant arthropod taxa were considered, which included three mite
(Acari), two copepod, and three dipteran species, and a single species each oftanaid and barnacle
(see Table 1). All other species present in the samples were only represented by one or two
individuals, and were considered to be terrestrial contaminants.
118

Table 1. Arthropod taxa considered in the present study.
Acari
Crustacea
Insecta
Ascidae Uropodidae Halacaridae Harpacticoidea
Metidae Tanaididae Cecidomyiidae Empidoidea Ceratopogonidae
Leioseius sp. nov. Uroobovella sp. Copidognathus caloglossae Proche~ At least 2 spp. (Canthocamptidae; Diosaccidae) Metis sp. Nov. Tanais philetaerus Stebbing Lestremyiinae sp. At least 3 spp. (2 families); not identified Culicoides sp.
Field collections and abundance determinations
Four (X 5 m) transects were established and 50 pneumatophores longer than 10 cm were
randomly selected from each transect. The pneumatophores were cut at ground level, and then cut
into 5 em long segments towards the tip, complying with a measurement commonly used in
pneumatophore studies (see Davey & Woelkerling, 1985; Tanaka & Chihara, 1987; Coppej ans &
Gallin, 1989). This gave four elevation levels as follows, 0-5, 5-10, 10-15 and 15-20 em, with
segments above 20 em being discarded. The mean length of considered pneumatophores was 24.7
em (±SE 2.1cm).
The pneumatophore segments were bagged, returned to the laboratory and washed over a
0.12 mm mesh to retrieve arthropods, macroalgae and coarse sediment. The wash-water was
collected and evaporated to retain the fine sediment (particles smaller that 0.12 mm). Samples
retrieved in the mesh were transferred to small plastic bottles and treated with 25 ml hypersaline
solution (Fain and Hart 1986). Floating specimens (mainly mites, tanaids and insect larvae) were
removed from each bottle, identified and counted under a dissecting microscope (X 160
magnification). The remaining contents of each bottle were brought to a 50 ml aqueous solution,
and the arthropods (mainly copepods and insect larvae) in three 5 ml sub-samples of this, were
determined and counted. Based on these sub-samples, the number of individuals was determined
for the 50 ml volume, and the total number of arthropods for each sample determined by addition
of the fractions deriving from the two extraction procedures.
The sediment in both collections (greater than, and less than 0.12 mm particle size) and the
119

algae retrieved with the coarse sediment, were oven-dried at 600 C for 24 h, and weighed. These
samples were then burnt for 5 h at 5000 C to eliminate the organic component, and re-weighed.
Macroalgal dry mass (which dominated the organic biomass) was taken to be the difference
between total mass and the inorganic mass of the coarse fraction. The pneumatophore cover
components were related to elevation, and Spearman's rank correlation coefficients were
determined for relationships between the abundance of each taxon and elevation, sediment dry
mass, and algal dry mass (using data from the sixteen samples - 4 transects x 4 elevation levels).
To determine the proportion of variability in assemblage structure explained by elevation,
sediment and macro algae, multiple regressions were performed for the abundance of each species,
total abundance, and species richness. The most important factor in each regression was
determined by multiplying the average value of each factor with its coefficient, as determined
from the multiple regression. The total mass ofthe pneumatophore segments was included in the
correlation analysis, but as correlation values were very low (rs<0.250 for all taxa but the
Ascidae), and never significant, it was not presented, nor further considered in the regressions.
Assemblage recovery experiment
This experiment was intended to further explore the dependence of the arthropod assemblages
upon the sediment and algal cover of the pneumatophores, and was undertaken by monitoring the
temporal changes in these assemblages after the pneumatophore cover was removed. Three
experimental and three control plots each of 60 x 60 cm and around 3 m apart, were established.
These contained pneumatophores occurring at densities of 300 - 400 pneumatophores per m2• In
the experimental plots, the sediment and algal cover was removed from all pneumatophores using
abrasive Velcro material. Two samples of 10 pneumatophores each were randomly chosen from
each experimental and control plot. The pneumatophores were cut at their bases, placed in bags
and returned to the laboratory. The site was revisited after 1,4, 12 and 25 weeks, to undertake
further sampling. The samples were processed as described above. Samples were comparable in
summed pneumatophore length (mean 148.3 ±SE 4.5cm), alleviating the need to correct for
possible discrepancies arising from differences in habitat availability. Paired t-tests were used to
compare abundance values between experimental and control plots (N = 6 for each, P<0.05). The
SPSS package ver. 9.0 (1998) was used throughout.
120

Results
Both sediment deposition and algal cover were negatively correlated with elevation along the
pneumatophore. At the uppermost elevation, the mass of pneumatophore cover (sediment and
algae) was less than five times that at the base. At each elevation, the ratio of fine sediment, to
coarse inorganic sediment, to macro algae was approximately 25: 5: 1 (Figure 1). Spearman=s
rank correlation between the mass of the fine sediment and the coarse inorganic sediment was 1,
indicating no differential deposition of the two sediment fractions at different elevations along
pneumatophores. The total mass of sediment (the sum of the two sediment fractions) was
therefore used in further correlations with arthropod distribution and abundance. There was also a
strong correlation (rs = 0.925) between the mass of the sediment and that of the macroalgae.
Abundances were remarkably variable among the taxa, ranging from the greatest mean
abundance for a particular level (for 50 pneumatophores) of 533 individuals in the case of
Tanaididae, to no individuals for the Ascidae and Ceratopogonidae (Table 2). The abundances of
most taxa were negatively correlated with elevation, with the exception of the Ascidae,
Halacaridae and Cecidomyiidae (Table 3). Although the most abundant taxon, the Tanaididae,
showed a negative correlation with elevation, some samples gave extraordinary high abundance
values at the uppermost pneumatophore level. All taxa that were significantly negatively
correlated with elevation, were also significantly positively correlated with sediment deposition
and algal growth (Table 3), suggesting that their abundances are related to variations in habitat
availability along the pneumatophore length. The taxa that were positively correlated with
elevation were all negatively related to the cover components, though the relationship was
significant in only one case (Halacaridae). Total arthropod abundance was negatively correlated
with elevation and positively correlated with sediment and algae (Table 3). The multiple
regressions, however, showed that most ofthe variation in arthropod assemblage composition can
be explained by considering elevation alone; only in one taxon (Empidoidea), and for total
arthropod abundance was the amount of macro algae the most important factor; and only one
taxon (Uropodidae) yielded a significant value when regressed against the mass of sediment.
Experimental removal of the pneumatophore cover eliminated 90% of the arthropods
(Figure 2). Although there was high temporal variability for the abundances in control plots, there
was a general trend of recovery in the 25 week period considered. Total arthropod abundance on
experimental pneumatophores after 25 weeks was almost ten times greater than the initial
121

abundance following removal of cover, and 60% of the control abundance. The Halacaridae
showed the most rapid recovery (there was no difference between experimental and control
pneumatophores at 12 and 25 weeks), with complete recovery also seen for the Harpacticoidea
and Ceratopogonidae, after 25 weeks. The most abundant taxon (the Tanaididae) showed
relatively slow recovery (Figure 2).
, 0
2'
20
:§ II)
" II) C'CI
E 1 0
e Ie vat io n
Figure 1. Variation of three microhabitat factors on mangrove pneumatophores: fine sediment
(white), coarse inorganic sediment (gray) and macroalgae (black). The values represent grams of
dry mass (for N = 4 sets of 50 pneumatophore segments each). The elevation levels indicated
represent: 1: 0-5 cm; 2: 5-10 cm; 3: 10-15 cm; 4: 15-20 cm above ground.
Discussion
Pneumatophores provide ideal surfaces in estuaries for the attachment of sedentary biota, for
example, algae and barnacles. The biota is considerably variable, taxonomically and ecologically
(biomass and abundance), between mangrove stands and from one geographical region to the
next. Whereas eucaryotic life growing on pneumatophores may comprise as little as finely
structured filamentous algae, in other instances this contributes a biomass similar to that of the
pneumatophores themselves. For example, epiphytic macrobiotic assemblages on
pneumatophores are dominated by filamentous and lamellar algae in southern African estuarine
systems (see Lambert et aI., 1994; Phillips et aI, 1994; 1996), by barnacles and oysters in some
Australian bay systems (see Bayliss, 1993; Ross & Underwood, 1997), and by an array of
122

Table 2. Arthropod abundance values (mean ± SE, N = 4, per sets of 50 pneumatophores) at four
levels of elevation on mangrove pneumatophores. All pneumatophores were longer than 15 cm, so
the three lower levels represent abundances/50 pneumatophore segments, while the top level (15-
20 cm) contained various numbers of segments « 50).
0-5 cm 5-10 cm 10-15 cm 15-20 cm
Ascidae 0.00 ± 0.00 3.50 ± 2.02 0.83 ± 0.83 9.05 ± 7.01 Uropodidae 9.00 ± 4.38 8.50 ± 2.99 2.78 ± 1.84 0.83 ± 0.83 Halacaridae 0.00 ± 0.00 22.75 ± 11.39 69.92 ± 35.16 149.44 ± 122.78 Cecidomyiidae 4.00 ± 2.12 4.00 ± 2.12 6.64 ± 3.61 13.71 ± 9.97 Empidoidea 57.50 ± 11.08 21.00 ± 10.30 5.56 ± 5.56 1.25 ± 0.80 Ceratopogonidae 101.00 ± 40.44 32.50 ± 9.54 0.83 ± 0.83 0.00 ± 0.00 Harpacticoidea 10.50 ± 7.79 14.75 ± 9.82 6.89 ± 4.67 4.89 ± 3.77 Metidae 80.00 ± 28.37 16.50 ± 12.35 2.03 ± 2.03 0.83 ± 0.83 Tanaididae 312.00 ± 73.52 375.00 ± 123.19 244.90 ± 115.69 533.60 ± 294.95 Total 574.00 ± 132.47 498.50 ± 133.93 340.39 ± 130.93 713.62 ± 384.85
Table 3. Spearman's rank correlation values for abundance of the arthropod taxa against 1)
elevation level on the pneumatophores, 2) mass of sediment, and 3) mass of macroalgae. Asterisks
indicate significant relationships (* P < 0.05; ** P < 0.05).
Taxon Elevation Sediment Macroalgae
Ascidae 0.280 -0.227 -0.252 Uropodidae -0.589* 0.760** 0.694** Halacaridae 0.573* -0.491 -0.517* Cecidomyiidae 0.192 -0.183 -0.053 Empidoidea -0.748** 0.777** 0.676** Ceratopo gonidae -0.764** 0.787** 0.760** Harpacticoidea -0.209 0.149 0.052 Metidae -0.789** 0.688* 0.618* Tanaididae -0.255 0.391 0.492 Total -0.376 0.518* 0.526*
123

Halacaridae Harpacticoidea
80 ** ** ** 50 ** ** Q) Q) 40 Co) 60
Co)
c c ~ ~ 30 ~ 40 ~ c c 20 - -.:: 20 .:: 10 ~ ~
0 0
0 1 4 12 25 0 4 12 25
time (weeks) time (weeks)
Tanaididae Ceratopogonidae
200 ** ** ** ** ** 40 ** Q) Q) Co) 150 Co) 30 c c ~ ~ ~ 100 ~ 20 c c
50 - 10 .:: .:: ~ ~
0 0 0 4 12 25 0 1 4 12 25
time (weeks) time (weeks)
Empidoidea Total arthropods
20 ** ** ** ** ** 300 ** ** ** ** ** Q) Q) 250 Co) 15 Co)
c c 200 ~ ~ ~ 10 ~ 150 §
5 § 100
.:: .:: 50 ~ ~
0 0 0 1 4 12 25 0 4 12 25
time (weeks) time (weeks)
Figure 2. Variation in arthropods abundance (mean and SE, N = 6) for the most abundant five
arthropod taxa and total arthropods in plots where pneumatophore cover was experimentally
removed (gray bars) and in control plots (white bars). Pairs of asterisks indicate that abundance
values for the control plots are significantly higher than for the experimental plots (t-paired test, P
< 0.05).
124

Table 4. Multiple regressions of arthropod abundances and species richness against elevation,
sediment, and macro algal mass. Individual R values higher than 0.5 are marked by asterisks,
while overall R values are given in the last column. The factor with the highest contribution to
each multiple regression is shown in bold.
Taxon Intercept Coefficients Overall R
Elevation Macroalgae Sediment
Ascidae -11.20 4.21 0.19 2.27 0.42
Uropodidae -0.39 -0.53 0.07 12.87 0.69
Halacaridae -328.26 111.64* 11.63 -149.68 0.56
Cecidomyidae -17.89 6.33* 0.05 18.36 0.47
Empidoidea 4.27 -5.19 1.47 16.38 0.87
Ceratopogonidae 110.20 -32.77* -0.48 27.71 0.69
Harpacticoidea 42.78* -8.74 -1.09 10.94 0.40
Metidae 52.40 -18.42 0.28 30.90 0.69
Tanaididae -1001.44* 315.16* 30.80* 234.43 0.61
Total abundance 253.26 -29.26 20.68 -224.94 0.68 Species richness 8.10* -0.77 -0.06 2.37 0.42
sponges, cnidarians, and ascidians in the open sea mangrove islands of Florida (Bingham, 1992;
Bingham & Young, 1994). Depending on the nature ofthe biotic covering, in estuarine systems in
particular, it potentially traps fine sediment. The algal and sediment covering of pneumatophores
support a variety of motile meiofaunal arthropods, the distributions of which in southern African
mangroves, have been the subj ect of recent investigations (proche~ & Marshall, 2001; Proche~ et
aI., 2001).
Ecological distributions and species abundances, in general, are influenced by habitat
suitability (physico-chemical conditions), biotic interactions, and life history patterns (Rozenweig,
1997). Species vertical distributions in the intertidal zone (particularly upper limits) are largely
determined by tolerance of physical conditions relating to air exposure, such as desiccation
(Underwood & Denley, 1984, but see Pugh & King, 1985, for Acari). While a previous
investigation has shown that desiccation is important in structuring meiofaunal arthropod
assemblages on pneumatophores (Proche~ & Marshall, 2001), we show here that this also relates
125

to habitat availability in some instances. Initial findings indicated that the primary habitat
available to the meiofauna (comprising the algal and sediment cover) varies vertically along a
pneumatophore in a manner of decreasing habitat with increasing elevation. This pattern probably
relates to a desiccation-induced reduction in algal growth (Phillips et aI., 1994; 1996; see Figure
3)
Arthropod abundance of some taxa (particularly, Uropodidae, Empodiodea,
Ceratopogonidae and Metidae) corresponds with the reduction in habitat availability by
decreasing along the vertical height of the pneumatophore. This pattern suggests a causal
relationship between arthropod abundance and habitat availability (with reference to interstitial
Uropodidae and Ceratopogonidae see Krantz, 1976; Linley, 1976). The other meiofaunal taxa
showed either a significant positive relationship (in the case ofthe Halacaridae) or, were weakly
positively or negatively related to habitat availability. Included among the numerous factors
responsible for overriding the effects of habitat availability are those relating to biotic interactions
(such as competition or predation). These are suggested by abundance correlations implied from
this study and those determined in an earlier study (Proche~ & Marshall, 2001) which showed that
the two most abundant taxa (Halacaridae and Tanaidae) are similarly distributed on
pneumatophores, and both are mainly negatively correlated with the taxa which closely track
available habitat (Uropodidae, Empodiodea, Ceratopogonidae and Metidae; see Proche~ &
Marshall, 2001).
The low significance of algal and sediment mass regression values, as compared to the
high predictive values held by elevation alone, suggests that in fact other factors, such as the
direct influence of moisture, as well as biotic interactions among arthropods can be more
important in determining vertical zonation patterns than the algal and sediment mass. However,
the dependence of the arthropod assemblages upon the macro algal and sediment covering, is
shown clearly by the slow pace of recovery after clearing the pneumatophores.
The arthropod community had not completely recovered during the investigation period
(25 weeks), with rate of recovery being vastly variable among taxa. Whereas abundances of some
arthropod groups had recovered after twenty five weeks, the total arthropod abundance remained
below that ofthe controls by this time (though this was largely due to the dominant Tanaididae).
Extrapolation of the consistent temporal increase in our abundance data indicates that
126

ELEVATION
(1)J:
WETTING FREQUENCY
(1,t.l+
MOISTURE LEVEL t--
(1)~+
ALGAL
~ . SEDIMENT
GROWTH DEPOSITION
(3)1+ (3)1+
ARTHROPOD + ABUNDANCE (2)
r!(2) (2)Tr
+ BIOTIC (2) INTERACTIONS
Figure 3. Interrelationships among physical and biotic components of the mangrove
pneurnatophore environment, based on Phillips et al., 1996 (1); Proche~ & Marshall, 2001 (2); and
the present study (3).
complete recovery should be affected by around fifty weeks. In another study, Eston et al. (1992)
found epiphytic algal communities on pneumatophores to recover in four to eight months. The
most rapidly colonising pneumatophore epiphytes include barnacles. Their recovery and
colonisation, through the production of vast numbers of swimming larvae, happens within hours
(Satumanatpan et al., 1999; Satumanatpan & Keough, 2000). Unlike the taxa we considered,
barnacles are filter feeders and thus are unrelated to the algal and sediment habitat, but rather
utilize pnuematophores as attachment surfaces only.
Intuitively it follows that taxa whose populations recover completely, prior to full
recovery of the habitat, are more general in their utilization of habitat than those showing partial
recovery. This situation was found to be applicable to the rapidly recovering Halacaridae (strongly
negatively related to habitat availability) and the Harpacticoidea (weakly related to habitat), but
not to the Ceratopogonidae (strongly correlated to habitat) (see Table 3 and Figure 1). These
contrasting results indicate the effects on popUlation and assemblage recovery of factors other
127

than habitat utilization, for example, life history and dispersal characteristics of the taxa. The
temporarily consistent increase in abundance of the Halacaridae suggests that their recovery
relates to growth of the remnant population on the pneumatophores (as not all individuals were
removed during the experiment), whereas harpacticoid copepods could recolonise from benthic
sediments where they occur in relatively high abundance (Alongi & Sasekumar, 1992; Proche~ et
al., 2001). Insects (represented in our samples by larvae) have flying adults, enabling them to
disperse effectively (Cheng & Frank, 1993), but not necessarily uniformly across available
habitat. This may explain the variability in spatial and temporal distribution and abundance on
pneumatophores of insects in general, and particularly, the Ceratopogonidae. With respect to the
taxa showing poor recovery, the design of the current experiment does not permit inference
regarding the extent to which their life histories versus habitat and niche availability and
utilization, limit population growth.
Even though they offer considerable opportunities for ecological study, in that they can be
readily quantified and their spatial patterns be easily identified, mangrove pneumatophore
meiofaunas have been poorly explored. Whereas previously, the effects of desiccation and biotic
interactions on their communities have been highlighted, the current study elucidates the effect of
habitat availability on community structure. Utilization of the habitat comprising the algal and
sediment pneumatophore cover, varies considerably among the species. In addition to habitat
availability, development of the meiofaunal arthropod populations on pneumatophores depends
on life history characteristics of the specific taxa as well as other factors (including biotic
interactions). Given the diversity of mangrove systems worldwide, there is considerable scope for
comparing the effects of pneumatophore cover on the ecology of meiofaunal arthropods, by
considering other types of mangrove systems (which support vastly differing pneumatophore
components) from other geographical regions (Lambert et al., 1994; Bayliss, 1993; Ross &
Underwood, 1997; Bingham & Young, 1994).
Acknowledgements
Kaajial U grasen and Ashvita Ramcharan (UDW) determined the arthropod samples. Nisha Singh
is thanked for use of lab facilities. Chris George and Vish Rajpal helped on the collecting trips .
This study was partly supported by the National Research Foundation (grant to DJM) and UDW.
128

References
Alongi DM, Sasekumar A. 1992. Benthic communities. In: Robertson A.I., Alongi, D.M. (eds.)
Tropical mangrove ecosystems. Coastal and Estuarine Studies, 41: 137-171.
Bayliss DE. 1993. Spatial distribution of Balanus amphitrite and Elminius adelaidae on
mangrove pneumatophores. Marine Biology 116: 251-256.
Beck MW. 2000. Separating the elements of habitat structure: independent effects of habitat
complexity and structural components on rocky intertidal gastropods. fournal of
Experimental Marine Biology and Ecology 249: 29-49.
Begg GW. 1978. The estuaries of Nata!' Natal Town and Regional Planning Report 41: 1-657.
Bingham BL, Young CM. 1992. Stochastic events and dynamics of a mangrove root epifaunal
community. Marine Ecology 16: 145-163.
Bingham BL. 1994. Life histories in an epifaunal community: coupling of adult and larval
processes. Ecology 73: 2244-2259.
Cheng L, Frank JR. 1993. Marine insects and their reproduction. Oceanography and Marine
Biology Annual Review 31: 479-506.
Coppejans E, Gallin E. 1989. Macroalgae associated with the mangrove vegetation ofGazi Bay
(Kenya). Bulletin de la Societe Royale de Botanique Beige 122: 47-60.
Davey A, Woelkerling WJ. 1985. Studies in Australian mangrove algae. III. Victorian
communities: Structure and recolonization in West Port Bay. fournal of Experimental
Marine Biology and Ecology 85: 177-190.
de Oliveira FEe. 1984. Brazilian mangal vegetation, with special emphasis on seaweeds. In: Por
F. D. & Dor I. (eds.) Hydrobiology ofthe mangal B the ecosystem of mangrove forests.
Developments in Hydrobiology 20: 55-66.
Dye AH. 1983. Vertical and horizontal distribution of meiofauna in mangrove sediments in
Transkei, southern Africa. Estuarine, Coastal and Shelf Science 16: 591-598.
Eston VR, Braga MRA, Cordeiromarino M, Fujii MT, Yokoya NS. 1992. Macroalgal
colonization patterns on artificial substrates inside southeastern Brazilian mangroves.
Aquatic Botany 42: 315-325.
Fain A, Hart BJ. 1986. A new, simple technique for extraction of mites, using the difference in
density between ethanol and saturated NaCl. (Preliminary note). Acarologia 27: 255-256.
129

Gee JM, Somerfield PJ. 1999. Do mangrove diversity and leaflitter decay promote meiofaunal
diversity? Journal of Experimental Marine Biology and Ecology 218: 13-33.
Kathiresan K, Bingham BL. 2001. Biology of mangroves and mangrove ecosystems. Advances
in Marine Biology 40: 81-251.
Krantz GW. 1978. A manual of acarology (2nd ed.). Oregon University Book Stores, Corvallis.
Lambert G, Steinke TD, N aidoo Y. 1987. Algae associated with mangroves in southern African
estuaries. 1. Rhodophyceae. South African Journal of Botany 53: 349-361.
Linley JR. 1976. Biting midges of mangrove swamps and salt-marshes (Diptera:
Ceratopogonidae). In Cheng L, Marine insects, North Holland: Amsterdam, pp. 335-376.
Mann FD, Steinke TD. 1988. Photosynthetic and respiratory responses of mangrove associated
red algae, Bostrychia radicans and Calloglossa leprieurii. South African Journal of
Botany 54: 203-207.
Ndaro SGM, Olafsson E. 1999. Soft-bottom fauna with emphasis on nematode assemblage
structure in a tropical lagoon in Zanzibar, eastern Africa: I. spatial variability.
Hydrobiologia 405: 133-148.
Olafsson E. 1995. Meiobenthos in mangrove areas in eastern Africa with emphasis on
assemblage structure of free-living marine nematodes. Hydrobiologia 312: 47-57.
Olafsson E, Carlstrom S, Ndaro SGM. 2000. Meiobenthos of hypersaline tropical mangrove
sediment in relation to spring tide innundation. Hydrobiologia 426: 57-64.
Phillips A, Lambert G, Granger JE, Steinke TD. 1994. Horizontal zonation of epiphytic algae
associated with Avicennia marina (Forssk.) Vierh. pneumatophores at Beachwood
Mangroves Nature Reserve, Durban, South Africa. Botanica Marina 37: 567-576.
Phillips A, Lambert G, Granger JE, Steinke TD. 1996. Vertical zonation of epiphytic algae
associated with Avicennia marina (Forssk.) Vierh. Pneumatophores at Beachwood
Mangroves Nature Reserve, Durban, South Africa. Botanica Marina 39: 167-175.
Proche~ ~, Marshall DJ. 2001a. Ecological patterns of two cohabiting evolutionary distinct
animal groups: mangrove pneumatophore arthropods as a case study. Ecography,
submitted.
Proche~ ~, Marshall DJ, Ugrasen K, Ramcharan A. 2001. Mangrove pneumatophore
arthropod assemblages and seasonality patterns. Journal of the Marine Biological
Association of the United Kingdom, in press.
130

Pugh PJA, King PE. 1985. The vertical distribution of the British intertidal Acari - The non
halacarid fauna (Arachnida: Acari). Journal of Zoology 207: 21-33 .
Rosenzweig ML.1997. Species diversity in space and time (3rd edition). Cambridge University
Press, Cambridge.
Ross PM, Underwood AJU. 1997. The distribution and abundance of barnacles in a mangrove
forest. Australian Journal of Ecology 22: 37-47.
Satumanatpan S, Keough MJ. 2000. Roles of larval supply and behavior in determining
settlement of barnacles in a temperate mangrove forest. Journal of Experimental Marine
Biology and Ecology 260: 133-153.
Satumanatpan S, Keough MJ, Watson GF. 1999. Role of settlement in determining the
distribution and abundance of barnacles in a temperate mangrove forest. Journal of
Experimental Marine Biology and Ecology 241: 45-66.
Schrijvers J, Okondo J, Steyaert M, Vincx M. 1995. Influence of epibenthos on the
meiobenthos of the Ceriops tagal mangrove sediment at Gazi Bay, Kenya. Marine
Ecology Progress Series 128: 247-259.
Somerfield PJ, Gee JM, Aryuthaka C. 1998. Meiofaunal communities in a Malaysian
mangrove. Journal of the Marine Biology Association ofV. K. 78: 717-732.
Tanaka J, Chihara M. 1987. Species composition and vertical distribution of macroalgae in
brackish waters of Japanese mangrove forests. Bulletin of the National Science Museum in
Tokyo, Series B 13: 141-150.
Underwood AJU, Denley EJ. 1984. Paradigms, expenations, and generalizations in models for
the structure of intertidal communities on rocky shores. In: Strong DR, Simberloff D,
Abele LG, Thistle AB (eds.) Ecological communities: conceptual issues and the evidence.
Princeton University Press, Princeton.
Ward CJ, Steinke TD.1982. A note on the distribution and approximate areas of mangroves in
South Africa. South African Journal of Botany 1: 51-53.
131

Chapter VIII
Arthropod distribution across spatial scales: patterns of diversity
and abundance
Abstract
Although most ecological variables are scale-dependent, few studies compare scale-related
variations in abundance, species richness and assemblage structure. This study considers all of
these parameters in the case of mangrove pneumatophore arthropod (Acari, crustaceans and
insects), at seven spatial scales, from 10 cm to 100 km. Negative spatial autocorrelation in the
abundance of common species was stronger at 10 km than at 100 km, while for rare species,
the reverse was true. Spatial autocorrelation in species richness was found to decrease from 1
m (strong positive autocorrelation) to 10 km (strong negative autocorrelation), but was not
significant at the 100 km scale. While these patterns largely reflect the patchy distribution of
pneumatophores within mangrove forests, and that of the forests along the coast, an added
effect of spatial fragmentation can be attributed to the poor dispersal abilities of the
arthropods, in a highly dynamic environment. Variations in the abundance of common species,
as well as the limited distribution of rare species caused differences in assemblage structure to
increase with increasing distance, from 10 cm to 100 km. The 100 km scale clearly stood out
as the most distinct, indicating biogeographical, rather than ecological, differences. The study
highlights the need for combining univariate and multivariate approaches in investigating
scale-dependent phenomena
Introduction
Understanding the structuring of an ecosystem can only be achieved when all the processes
having a significant influence are considered, and these are likely to operate over a variety of
scales (Dayton & Tegner, 1984; Levin, 1988; 1992; 1994; Menge & Olson, 1990, McCoy &
Bell, 19910'Neill et aI, 1991; Legendre & Fortin, 1998; Koenig, 1999). Beyond pure
theoretical interest, scale research proved to be of practical importance, especially in
understanding human impact at local, regional and global levels, in defining critical habitat
fragmentation and loss, and in planning corresponding conservation activities (With et aI. ,
1997; Nagendra & Gadgil, 1999).
132

Marine SCIence IS one of the fields where scale research has been particularly
productive (Bingham, 1992; Underwood & Petraitis, 1993; Bourget et aI., 1994; Sournia,
1994; Saburova et aI., 1995; Farnsworth & Ellison, 1996; Schoch & Dieter, 1996; Underwood
& Chapman, 1996; 1998; Aberg & Pavia, 1997; Cosson et aI., 1997; Lancaster & Belyea,
1997; Swadling et aI., 1997; Guichard & Bourget, 1998; Eggleston et aI., 1999; Faucha1d et aI,
2000). These studies indicate that the the type of substratum, from intertidal rock and Arctic
ice to estuarine or deep-sea sediment, may greatly influence distribution patterns across scales,
due to the action of different biotic and abiotic processes. It is however difficult, from the
amount of knowledge accumulated so far, to assemble a detailed picture of scale-dependence
in marine ecology. This is mainly because few habitats have been systematically surveyed, so
as to consider large arrays of scales (but see Farnsworth & Ellison, 1996, Aberg & Pavia,
1997, Kunin, 1998). More often, the studies cover limited sets of distance classes, and as these
differ from one habitat to the next, comparisons are not always possible.
A variety of methods have been devised for the analysis of spatial patterns (see reviews
in Legendre & Legendre, 1983; Legendre & Fortin, 1989; Dutilleul, 1998; Gardner, 1998), but
many of these have only been applied within a given distance class, within one or two orders
of magnitude. For example, autocorrelograms (measuring self-correlation in the spatial
distribution of single variables) are normally employed in depicting spatial patterns along
series of evenly distanced samples. However, this method is applicable to samples separated
by uneven distances, even when these differ by a few orders of magnitude. In this case, the
method could provide a good deal of scale-dependence information. In the field of
multivariate techniques, the method proposed by Underwood and Chapman (1998) is a
relatively simple approach to analyzing cross-scale variations in community structure.
However, it has not been applied in conjunction with univariate methods considering the
distribution of single species.
The present study examines distribution patterns in a group of small-bodied animals
over an array of spatial scales (seven, from 10 cm to 100 km, this being the one of the largest
numbers considered so far in one sampling design). More specifically, it addresses the
arthropods living on the pneumatophores of the mangrove tree Avicennia marina. The
objective of the study was to identify the spatial scales at which most of the variation in
individual species abundance, total abundance, species richness, and assemblage structure
occurs, and to compare the results of these univariate and multivariate approaches. We show
that abundance and richness of pneumatophore arthropods are positively auto correlated over
133

composition changes increasingly with increasing spatial scale. However, variation is not
always highest for the largest scale (100 km). In ' the most abundant species, and also in total
arthropod abundance, the 10 km scale holds the largest amount of variation, and this is
suggested to be in relation with physical factors such as salinity, often more variable within,
than between, estuarine systems.
Material and methods
Sampling program
Mangrove forests have a patchy distribution along the southern African coast, naturally
occurring in open estuaries and bays (Macnae, 1963, Betjak et aI., 1977, Ward & Steinke,
1982). The size of these patches varies from stands of a few square meters to hundreds of
hectares, and adjacent patches are often tens of kilometers apart. The most abundant tree
species in these forests is Avicennia marina (Forssk.) Vierh .. The pneumatophores of this
species are pencil-like structures with a respiratory function (Tomlinson, 1986), emerging
from the sediment of the mangrove forest floor at irregular intervals. Even in stands dominated
by other tree species, Avicennia pneumatophores are present in high numbers, due to the broad
distribution of subterranean roots. The pneumatophores occur at variable densities, from 0 to
1000/ m2. Numerous studies have considered aspects related to their size, distribution, and the
algal assemblages that usually cover them (Saifullah & Elahi, 1992, Phillips et aI., 1994; 1996;
Beck, 1998; 2000). Information is also available on the spatial distribution of the sessile fauna,
with two studies actually considering spatial scale (Bingham, 1992; Farnsworth & Ellison,
1996). Much less is known about the motile arthropod fauna; although general
characterizations of both small-scale (centimeters) and large-scale (hundreds of meters -
kilometers) distributions exist (Proche$ & Marshall, 2001a; 2001b; Proche$ et aI., 2001), no
inter-scale study is available.
Sampling was done in three mangrove forests along the coast of KwaZulu-Natal
(South Africa). The forest in Richards Bay covers an area of approximately 427.S ha and is
divided by a 'berm' (dam) wall between a southern wildlife sanctuary, and a northern harbour.
The forests at Beachwood (c. 44 ha) and Bayhead (c.1S ha) are located within the Durban
metropolitan area (Ward & Steinke, 1982). One transect was set in each of Richards Bay
Harbour, Richards Bay Sanctuary, Beachwood and Bayhead. The distance between the former
two, as well as the distance between the latter two, was approximately 10 km. The distance
134

2 localities Richards Bay
2 localities x 2 transects! locality = 4 transects
4 transects x 2 areas! transect = 8 areas
8 areas x 2 double grids! area =16 double grids
16 double grids x 2 grids! double grid = 32 grids
32 grids x 2 double plots! grid = 64 double plots
64 double plots x 2 plots! double plot =128 plots
15 cm 15 cm
Figure 1. The sampling program. The 128 samples were collected from plots so arranged, as
to allow assessing spatial relationships for species and communities at seven different spatial
scales (localities 100lan apart, transects 10km apart, areas 1 km apart, double grids 100m
apart, grids 10 apart, double plots 1 m apart, adjacent plots).
between the two localities was 180 km, but for simplicity this will further be referred to as the
100 km scale. Five finer scales (1 km, 100 m, 10m, 1 m, 10 cm) were considered in each
transect, following a nested design based on that of Underwood & Chapman (1998) (Figure 1).
This resulted in a total of 128 samples, allowing for comparisons at seven spatial scales. The
environment within which sampling was conducted imposed some limitations on the sample
layout, e.g. the distances between the sets of samples did not always represent the nominal
values of their respective spatial scale. However, they did always represent between half and
twice this value (e.g. double grids - nominally 100 m apart, were always between 50 and 200
m apart). The distance between the centers of the plots in a double plot, representing the 10 cm
scale, was always 15 cm. The actual samples were represented by the arthropods on the
Avicennia pneumatophores within each of the 128 plots.
135

Sample collection and processing
All the pneumatophores in a 15 x 15 cm sample quadrat were cut at ground level and returned
to the laboratory. The pneumatophores were washed over a sieve to retain the algal and
sediment covering, together with the arthropods larger than 0.15 mm. This was preserved in
25 ml sample bottles with 70% ethanol. The pneumatophores in each sample were dried and
weighed, as a surrogate of habitat availability. The content of each bottle was then treated with
hypersaline solution (as described in Fain & Hart, 1986), which resulted in the flotation of c.
90% of the arthropods. Floating specimens were identified and counted. The number of
remaining arthropods was estimated by subsampling the mass of algae and sediment. This was
brought to a 50 ml homogeneous solution; five subsamples of 5 ml each were then taken and
arthropods in them counted until the total number of individuals belonging to one species
surpassed twenty. A species represented by more than twenty individuals in a number of
subsamples was not counted in the following subsamples. The average numbers of individuals
from one species in the subsamples where this species was counted, was then multiplied by
ten, to obtain an estimate for the 50 ml volume. c) the numbers of individuals belonging to
each species in the two fractions were added to obtain the total value. Barnacles were counted
separately.
Mangrove pneumatophore taxa
The arthropods inhabiting Avicennia pneumatophores are characterized by small SIze,
generally low dispersal abilities, and high local abundance (Proche~ et aI., 2001). Efforts were
made to identify all arthropods to 'morpho species ' level, however this was not possible for the
harpacticoid copepods and the insect larvae, which were found (as slide-mounted specimens)
to belong to numerous species, but were impossible to tell apart at the dissecting microscope.
These two groups, representing respectively 16.86% and 10.16% of the total number of
individuals were therefore excluded from our analyses. This left 21 species in the assemblage
(14 Acari, 3 amphipods, 1 isopod, 1 tanaidacean, 1 barnacle, 1 collembolan). Morphospecies
labeling was not always possible below family level; in fact among the Acari more than half
the species are undescribed. The species considered in the study are listed in Table 1. Apart
from the typical arthropod fauna of the mangrove forest floor (see Chapman, 1998; Proche~ et
aI., 2001), rare taxa (e.g. Parasitidae, Cheyletidae, Erythraeidae, Nothridae), were also
considered, in order to give correct estimates of species richness, and also to compare spatial
patterns in common and rare species.
136

Table 1. Arthropod taxa from mangrove pneumatophores.
Acari Mesostigrnata Parasitidae Parasitidae sp. Ascidae Leioseius sp. Uropodidae Uroobovella sp.
Prostigrnata Halacaridae Copidognathus caloglossae Acarothrix umgenica Agauopsis sp.
Tydeidae Tydeidae sp. Tarsonemidae Tarsonemidae sp. Cheyletidae Cheyletidae sp. Erythraeidae Erythraeidae sp.
Oribatida Nothridae Nothridae sp. Oribatulidae Oribatulidae sp.
Pontiobates sp. Astigrnata Thyreophagidae Thyreophagus sp.
Crustacea Tanaidacea Tanaididae Tanais philetaerus Isopoda Sphaeromatidae Sphaeromatidae sp. Amphipoda Amphipoda sp.
Melitidae Melita zeylanica Caprellidae Caprellidae sp.
Cirripedia Balanidae Balanus amphitrite Hexapoda Poduromorpha Neanuridae Anurida maritima
Statistical analysis
For univariate quantification of the effect of scale on species abundance, total arthropod
abundance, and species richness patterns, spatial autocorrelation was conducted on each of
these measures, using Bonferroni-corrected correlograms (with Moran's I as an
autocorrelation measure, see Moran, 1950) on log-transformed data. The SAAP (Spatial
Autocorrelation Analysis Program) package, ver. 4.3 (Wartenberg, 1989) was used.
Correlograms are structure functions with autocorrelation values plotted on the ordinate, and
distances among the sampling sites classed on the abscissa (Legendre & Fortin, 1989; Koenig,
1999). For describing spatial relations between samples, the rectangular co-ordinates system
(Wartenberg, 1989) was employed. In defining distance classes for analyses, the unequal
(customized) distance class option was used (see Wartenberg, 1989), in order to make each
distance class represent one of the seven spatial scales considered. This resulted in 64, 128,
256, 512, 1024, 2048 and 4096 pairs, respectively, for the seven distance classes. According to
Legendre & Fortin (1989), autocorrelation values in distance classes containing more than 1 %
137

of the total numbers of pairs can be readily interpreted. This grants interpretable results for six
of the seven distance classes in this study. The lowest number of pairs, 64, represented 0.8%
of the total number (8128), however the results are considered for limited interpretation.
Correlograms were used to illustrate autocorrelation in total abundance, species richness, and
pneumatophore mass values. Autocorrelation values for individual species were given
separately, as a table. To compare autocorrelation values in common and rare species,
common species were defined as those present in more than 10% of the samples and
representing more than 1 % of the total number of individuals. Species present in only. one
sample were excluded from this analysis.
To compare the variation in community structure at different scales avoiding data non
independence, we used the method designed by Underwood & Chapman (1998). Bray-Curtis
dissimilarity values were calculated for pairs represented by one individual sample and the
centroid of one set of samples it belonged to. Sets of samples were selected to represent all of
the distance classes considered (a sample was compared with the centroid of the samples
found in the same double plot, grid, double grid, area, transect, locality, or the centroid of all
128 samples in the study). As 21 samples contained no arthropods, the total of 107 non-empty
samples had to be used for comparison with seven distance classes without using the same
sample twice. This gave a maximum of fifteen replicate dissimilarity values for each scale.
The samples to be used for comparison at each scale were randomly chosen (Figure 2). Bray
Curtis dissimilarity values were computed using PRIMER 5 (Plymouth Routines in
Multivariate Ecological Research) on 4th root transformed data (Clarke & Warwick, 1994),
and then plotted against a distance axis. A one-way ANOV A, followed by a Student-Newman
Keuls test, was performed to compare the dissimilarity values for each spatial scale, using
SPSS (ver. 9.0) for Windows.
Results
Univariate approaches: autocorrelation values of arthropod abundance and richness
Positive autocorrelations in species abundance were largely characteristic to fine scales (10
cm, 1 m, 10 m, 100 m), and negative autocorrelations, to large scales (10 km, 100 km). In the
intermediate scale of I km, the abundances of some species were positively, and those of
other, negatively autocorrelated. Generally, autocorrelation values decreased continuously
with increasing distance, exceptions occurring for the lowest and highest scales (Table 2).
138

area centroid
centroids of double grids
centroids of grids
centroids of double plots samples (plots)
c::::::a c::::::a c::::::a t::::::::::I c::::::a c::::::a c::::::a c::::::a do ubi e plots grids double grids area
Figure 2. The method for evaluating variations in community structure at different spatial
scales designed by Underwood & Chapman (1998). Circles represent samples or centroids for
subsets of 2, 4, 8, and 16 samples. Links represent randomly selected sample-centroid pairs for
which dissimilarity values are calculated. A sample is always compared to the centroid of the
set it belongs to, and equal numbers of dissimilarity values are calculated for sets from each
spatial scale. The example in this figure illustrates how this method is applied to a set of 16
samples. In our study, the method was applied to a set of 128 samples.
Unusual patterns appeared in Balanus amphitrite and Agauopsis sp. In these two species, the
positive values for the 100 m scale were higher than both the 10m and the 1 km scales. In
Leioseius sp., an unusually high value occurred in the 1 km class, as compared to the 100 m
class (Table 2). The highest positive autocorrelation was at the 10 cm scale for eight species,
and in the 1 m class for six species. The lowest negative correlation was at the 100 krn scale
for five species, at the 10 km scale for another five species, and at the 1 km scale for
Uroobovella sp (only significant values counted). Abundant and widely distributed species
showed more significant values than rare and localized species (Table 2). Positive
autocorrelation at low scales was high in common species, and lower in rarer species. For
common species, the highest positive autocorrelation value was most often at the 10 cm scale,
and the lowest negative value at 10 km, whereas in rare species the extreme values occurred
more often at 1 m and 100 lan, respectively (Table 2).
Autocorrelation of total arthropod abundance closely followed the curve for the
dominant species, Tanais philetaerus (Figure 3, cf. Table 2). Species richness showed a 139

...... +::> 0
Table 2. Autocorrelation vales (Moran's n for arthropod species from mangrove pneumatophores at seven spatial scales. Bonferroni
corrected overall significance values are also given for the correlogram of each species. Significance: * P< 0.050; ** P< 0.001. The lowest
significant negative values for each species is given in bold, while the highest positive significant value is underlined. The species area
arranged in decreasing order of abundance, and species present in only one sample were excluded.
Species Total Samples Overall abundance present 10cm 1m 10m 100m 1 Ian 10 Ian 100 Ian significance
Common
Tanais philetaerus 9362 81 0.95** 0.88** 0.79** 0.74** 0.27** -0.53** -0.01 0.001 Copidognathus caloglossae 1139 18 0.98** 0.87** 0.90** 0.11** 0.14** -0.11** -0.11** 0.001 Balanus amphitrite 772 45 0.87** 0.83** 0.20** 0.46** -0.02 -0.24** -0.01 0.001 Leioseius sp. 244 56 0.53** 0.59** 0.39** 0.03 0.22** -0.14** -0.05** 0.001 Acarothrix umgenica 144 22 0.70** 0.55** 0.11* -0.01 0.10** -0.04* -0.05** 0.001
Rare
Thyreophagus sp. 74 9 0.33** 0.46** 0.30** -0.03 0.11 ** -0.05** -0.05** 0.001 Melita zeylanica 57 10 0.11 0.38** -0.01 0.03 -0.06* -0.02 -0.01 0.001 Agauopsis sp. 33 4 0.65** 0.41 ** -0.03 0.14** -0.03 -0.03 -0.03** 0.001 Tarsonemidae sp. 30 4 0.13* 0.22** -0.02 -0.02 -0.02 -0.02 -0.01 0.001 Uroobovella sp. 25 9 0.75** 0.69** 0.74** -0.07 -0.07* -0.04* -0.05** 0.001 Tydaeidae sp. 16 7 -0.04 0.14* 0.08* -0.03 0.03* -0.02 -0.02 0.002 Pontiobates sp. 16 4 -0.02 0.08* 0.03 -0.02 0.01 -0.01 -0.01 0.103 Spheromatidae sp. 9 4 0.63** -0.03 -0.03 0.01 0.08** -0.03 -0.03** 0.001 Anurida maritima 4 3 0.70** -0.02 -0.02 -0.02 -0.02 -0.02 -0.01 0.001

similar curve, but with a relatively smoother slope, while correlation in total pneumatophore
mass was less regular, but still generally decreasing with distance (Figure 3).
A multivariate approach: differences in community structure
At all scales but 100 km, some samples were highly similar to the centroids of their respective
sample sets, while other were dissimilar, causing a wide scatter of the Bray-Curtis
dissimilarity values within each scale. Even so, averaged dissimilarity values significantly
increased with spatial scale (Table 3, Figure 4). The 100 km scale was the most distinct, as the
highest, and also the most homogeneous dissimilarity values occurred at locality level. Among
the other scales, the 10 em scale was quite distinct, with very low averaged dissimilarity, and
the 1 m scale appeared as intermediate between the 10 em scale and larger scales (Table 3,
Figure 4).
1
0.8
0.6
0.4
0.2
0
-0.2 -0.4
-0.6 10cm 1m 10m 100m 1km 10km 100km
Figure 3. Bonferroni-corrected correlograms for total arthropod abundance (squares), species
richness (diamonds), and total pneumatophore mass (triangles) at seven scales. Significant
values are represented by closed symbols.
141

Table 3. One-way ANOV A and Student-Newman-Keuls test comparing the Bray-Curtis
dissimilarity values between individual samples and the centroids of the sets they belong to, at
seven scales.
ANOVA
Between scales Within scales Total
SNK test
Average Standard error Subset
SS
30927.674 55097.893 86025.567
df
6 98 104
MS
5154.612 562.223
10 em 1 m 10 m 100 m 1 km
24.26 37.00 45.35 5.08 5.39 5.96
a alb b
57.00 6.89
b
58.45 7.59
b
F p
9.168 0.001
10 km 100 km
59.81 7.14
b
81.98 3.98
Significance of the subsets (a=0.05): a, 0.141; b, 0.074, c, 1.000
100 • • • • • • ~ 80 : • 'i: • • jg i J~ • • • In • In 60 ;:; • • In • • 1:: • • :::J • • u 40 • ; I • ~ • • .... • ! • ! m • • ~ 20 Q • • • * • •
0 10 cm 1m 10m 100m 1 km 10 km
distance
c
! • • • • t
100 km
Figure 4. The relationship between Bray-Curtis dissimilarity (among samples and sample
centroids), and spatial scale. (See Materials and Methods for a full explanation.)
142

Discussion
Environmental patchiness
The distribution of populations and assemblages is often limited to suitable patches of habitat.
In a spatial perspective, the distribution of organisms is likely to be most uneven at the scale
where environmental patchiness is most pronounced (Pielou, 1977; Maurer, 1990; Cosson et
al., 1997). For a given population or assemblage, the size and spacing of suitable patches
determines the level of habitat availability (Wiens, 1976; Levin & Buttel, 1987; Swadling et
al., 1997). At the same time, the existence of non-inhabited patches can impose barriers
resulting in local isolation. In a dynamic environment, each patch is characterized by its own
processes of colonization, population growth, and extinction, leading to differences among
patches (MacArthur & Wilson, 1967; Rosenzweig, 1997). In the presence of an environmental
gradient, these differences will tend to increase with increasing distance. Even if abiotic
gradients are absent, biotic gradients derived from patch history will cause similar effects, at
least over small scales (Levin, 1992; 1994).
Patchiness of arthropod distribution in mangrove pneumatophore habitats arises from
at least three effects: 1) aggregation of individuals on a pneumatophore; 2) aggregations of
pneumatophores within a mangrove forest; and 3) distribution of forest patches along the
coast. The first level of patchiness is not covered by the present study, but has been partly
addressed elsewhere (Proche§ & Marshall, 2001b). While it is preferable, especially in fine
scale studies, to consider distances between individual animals rather than samples lumping
together their coordinates (Gardner, 1998), the small size of pneumatophore arthropods
negates this procedure.
The third level of patchiness was purposefully eliminated from the study, by sampling
only in mangrove forests, and not outside them. Yet, it could be expected that the relative
isolation of the faunas in different forests, together with the specific characteristics of the
estuaries and bays where they were located, should cause spatially-related differences among
forests. The size of forest patches considered here ranges between the 1 km and 10 km scales,
and the distance between two patches is in the region of 10 km - 100 km.
Most of the spatial distribution patterns depicted here for pneumatophore arthropods
should relate to the second level of patchiness, and therefore the dry mass of pneumatophores
has been used as a surrogate of habitat availability. Variations in the density and size of
pneumatophores occur at all scales, from 10 cm to the size of the forest patch (see Saifullah &
Elahi, 1992). hl the present study, pneumatophore mass was negatively autocorrelated in the
143

10 krn and 100 krn scales (Figure 3), which suggests that variations also exist among
mangrove forests. This means that the availability of small-scale habitat patches (the
pneumatophores) differs among large-scale habitat patches (the mangrove forests). Arthropod
abundance, if strictly determined by habitat availability, should follow a similar pattern.
Species richness is also expected to follow a similar pattern, as larger numbers of species are
likely to inhabit larger habitat patches (see species-area curve theory in Rosenzweig, 1997).
And indeed, similar to pneumatophore mass, arthropod abundance and species richness show a
decline in autocorrelation from finer, to larger scales (Figure 3).
Habitat utilization and population dynamics
Mangrove arthropods are unlikely to fully exploit the available pneumatophore habitat.
Avicennia pneumatophores are not long-lived structures (Tomlinson, 1986), and are often
affected by the various disturbances characteristic to mangrove forests (lightning, tree
extraction, pollution, flooding; see Berjak et aI., 1977; Begg, 1978; Ellison & Farnsworth,
2000). Colonization of new pneumatophores is a must for population survival. Furthermore,
finding a partner and a suitable microhabitat for reproduction, are unlikely events considering
that, for most species, the average abundance per penumatophore was below one. While many
marine organisms have swimming larvae enabling long distance dispersal (Morgan, 2001;
Underwood & Keogh, 2001), among pneumatophore arthropods this feature is rare (it occurs
in barnacles (Satumantpan et aI., 1999; Satumanatpan & Keough, 2000), but is absent in mites
and most crustaceans). Therefore, a local population can generally spread only across small
distances. The improbability of long-distance dispersal explains why spatial dependence in
arthropod species richness was more pronounced, as compared to that of habitat availability
(pneumatophore mass), with stronger positive autocorrelation at finer scales, and stronger
negative autocorrelation at larger scale (Figure 3). Spatial dependence was even more
pronounced in the case of arthropod abundance, this being largely dependent on local
population size, in tum determined by the probability of the recruits finding a mate and
suitable microhabitat for reproduction.
Further differences appear at species level. Depending on their body size, mobility and
life history, different species utilize the available habitat to different degrees (Morse et aI.,
1985; ZwOlfer & Brandl R, 1989; Hansen, 2000). Although the abundance autocorrelation for
most species showed decreasing trends towards larger scales, similar to that of habitat
availability (pneumatophore mass), the preCIse shape of the latter (with top positive
144

autocorrelation values at 1 m and 1 km scales; compare Figure 3 and Table 2), was only
followed by one arthropod species: the ascid mite, Leoseius. This is not surprising, as
Leioseius, a predator of terrestrial affinities (see Krantz, 1978) is the only pneumatophore
species that fully exploits the entire surface of the pneumatophores, irrespective of
microhabitat conditions (Proche~ & Marshall, 2001 b; Proche~ et al., 2001). Other types of
patterns in cross-scale autocorrelation are noted in the other arthropod species. The uropodid
mite, Uroobovella, is characterized by a positive peak at 10m and a negative peak at 1 km.
This species is strictly dependent on a specific microhabitat with dense algal growth and
sediment deposition (Proche~ & Marshall, 2001a; 2001b), and its spatial distribution patterns
may reflect the distribution of this microhabitat. As the algal growth is dependent on particular
sunlight levels, the 10m peak could be explained as the typical spacing of mangrove trees or
canopy gaps. Another pattern, with high autocorrelation in the 100 m class occurred in the
barnacle, Balanus and the mite, Agauopsis. This is likely to indicate good intra-estuarine
dispersal, and is easy to explain in the case of the barnacle, which has swimming larvae, but
not in the case of the mite, which lacks them. The most common pattern (all other species, see
Table 2), is a relatively smooth decrease in autocomelation with scale, the highest positive
value being either at 10 cm, or at 1 m, and the lowest negative, at 10 or 100 km. No specific
explanation for this pattern can be suggested, but it may simply depict the general spatial
pattern for a population characterized by extinction and subsequent colonization from adj acent
patches.
Common and rare species
Further differences in spatial distribution exist among common and rare species (Gaston,
1994; McGeoch & Chown, 1997). In this study, the highest positive autocorrelation for rare
species occurred at 1 m, rather than 10 cm, generally indicating that two adjacent individuals
are more often 1 m apart. Also, rare species were characterized by strongest negative
autocorrelations at 100 km, as most of them only occur in only one of the two localities (either
Durban or Richards Bay). Such faunistic differences along the KwaZulu-Natal coast have
been observed by Macnae (1963), and should be considered a biogeographical, rather than
ecological, effect (see Cornell, 1985; Ricklefs, 1987; Cornell & Lawton, 1992). It is less
obvious why common species should have the strongest negative autocorrelation at 10 km. A
possible explanation, is that the harbours in both Durban and Richards Bay have a natural
regime of tidal flushing, normally keeping salinities above 30 (Begg, 1978). This insures an
145

input of arthropod recruits, especially In the form of crustacean larvae (see Ross &
Underwood, 1997; Satumanatpan et al., 1998). On the other hand, the estuarine waters in
Beachwood are known to have salinities often as low as 12 (Phillips et al., 1994; 1996). The
situation is similar in the Sanctuary in Richards Bay, completely closed to tidal flushing at the
time when we collected. Tanais philetaterus, the most abundant species in both harbours, was
represented in low numbers in Beachwood and Richards Bay Sanctuary, and this species has
been shown to be negatively influenced by low salinities (Proche~ et a1., 2001). Such
differences in the values of physical factors, more prominent within than among localities, can
account for the stronger negative auto correlations at the 10 km scale.
Community structure
Community structure is the result of both speCIes diversity and abundances (Clarke &
Warwick, 1994), therefore spatial variation in community structure combines all the single
factors discussed above. If some of these varied most at 10 km and others at 100 km,
community structure clearly varied most at 100 km. At all scales but 100 km, there was a
broad scatter of the dissimilarity values, indicating mixed (smaller and larger) variations in
assemblage structure, while in the 100 km scale, these were consistently large (Figure 4).
Three different classes of distances are separated by the ANOVA procedure (Table 3). These
can be defined as scales below alpha diversity (10 cm - 1 m), alpha diversity (1 m - 10 km),
and beta diversity (100 km) for mangrove pneumatophore arthropods (sensu Whittaker, 1970).
This means that the 'point diversity' for these assemblages is reached around the 1 m scale,
while biogeographical species replacement characterizes scales larger than 100 km.
Pneumatophore arthropod assemblages contain species of both marine and terrestrial
ancestry, and are influenced by physical factors from both environments. It is expected
(Ricklefs, 1990; Levin, 1994) that different patterns would occur between typical marine and
terrestrial ecosystems, as indicated by a number of available studies (e.g. Cornell, 1985;
Underwood & Chapman, 1996). However, to fully certify this, studies using standardized
nested hierachical schemes, similar to the one presented here, would be necessary.
In conclusion, this study brings together univariate and multivariate methods, to investigate
the patterns of spatial variation in arthropod assemblages. It points out the fact that these
methods can partly confirm one another, but also complete one another, and their combination
is likely to produce more accurate ecological interpretations.
146

Acknowledgements
This chapter will be prepared as a journal paper, in collaboration with Melodie A. McGeoch
(University of Stellenbosch) and David J. Marshall, both of whom are thanked for their
contributions. M.G. Chapman (University of Sydney) originally suggested a study on scales of
spatial distribution in arthropods from mangrove pneumatophores. Ashvita Ramcharan
(UDW) counted the arthropods in all samples. SP is indebted to Marie Warren (nee Rosch)
(University of Pretoria) for help with one of the statistical procedures. The study was partly
supported by the National Research Foundation (grant to DJM) and UDW.
References
Aberg P, Pavia H. 1997. Temporal and multiple scale spatial variation in juvenile and adult
abundance of the brown alga Ascophyllum nodosum. Marine Ecology-Progress Series
158: 111-119
Beck MW. 1998. Comparison of the measurement and effects of habitat structure on
gastropods in rocky intertidal and mangrove habitats. Marine Ecology Progress Series
169: 165-178.
Beck MW. 2000. Separating the elements of habitat structure: independent effects of habitat
complexity and structural components on rocky intertidal gastropods. Journal of
Experimental Marine Biology and Ecology 249: 29-49.
Begg GW. 1978. The estuaries of Natal, Part I. Natal Town and Regional Planning Report 41:
1-657.
Berjak P, Campbell GK, Huckett B, Pammenter N. 1977. In the mangroves of southern
Africa. Durban: Wildlife Society of Southern Africa (Natal Branch).
Bingham BL. 1992. Life histories in an epifaunal community - coupling of adult and larval
processes. Ecology 73: 2244-2259.
Bourget E, Deguise J, Daigle G. 1994. Scales of substratum heterogeneity, structural
complexity, and the early establishment of a marine epibenthic community. Journal of
Experimental Marine Biology and Ecology 181: 31-51.
Chapman MG. 1998. Relationshiop between spatial patterns of benthic assemblages in a
mangrove forest using different levels of taxonomic resolution. Marine Ecology
Progress Series 162: 71-78.
Clarke KR, Warwick RM. 1994. Changes in marine communities: an approach to statistical
analysis and interpretation. Plymouth: Plymouth Marine Laboratory.
147

Cornell HV. 1985. Local and regional richness of cynipine gall wasps on California oaks.
Ecology 64: 1247-1260.
Cornell HV, Lawton JH. 1992. Species interactions, local and regional processes, and limits
to the richness of ecological communities: a theoretical perspective. Journal of Animal
Ecology 61: 1-12.
Cosson N, Sibuet M, Galeron J. 1997. Community structure and spatial heterogeneity of the
deep-sea macrofauna at three contrasting stations in the tropical northeast Atlantic.
Deep-Sea Research Part I-Oceanographic Research Papers 44: 247-269.
Dayton PK, Tegner MJ. 1984. The importance of scale in community ecology: a kelp forest
example with terrestrial analogs. In: Price, P.W., Slobodchikoff CN, Gaud WS. (eds),
A new ecology: new approaches to interactive systems. New York: John Wiley, pp.
457-481.
Dutilleul P. 1998. Incorporating scale in ecological experiments: data analysis. In Peterson
DL, Parker VT. Ecological scale theory and applications. New York: Columbia
University Press, pp. 387-425.
Eggleston DB, Elis WE, Etherington LL, Dahlgren CP, Posey MH. 1999. Organism
responses to habitat fragmentation and diversity: Habitat colonization by estuarine
macrofauna. Journal of Experimental Marine Biology and Ecology 236: 107-132.
Ellison AM, Farnsworth EJ. 2001. Natural disturbance and the dynamics of marine benthic
communities. In: Bertness MD, Gaines, SD, Hay, ME (eds), Marine community
ecology. Sunderland: Sinauer Associates, pp 423-442.
Fain A, Hart BJ. 1986. A new, simple technique for extraction of mites, using the difference
in density between ethanol and saturated NaC!. (Preliminary note). Acarologia 27:
255-256.
Farnsworth EJ, Ellison AM. 1996. Scale-dependent spatial and temporal variability in
biogeography of mangrove root epibiont communities. Ecological Monographs 66:
45-66.
Fauchald P, Erikstad KE, Skarsfjord H. 2000. Scale-dependent predator-prey interactions:
The hierarchical spatial distribution of seabirds and prey. Ecology 81: 773-783.
Gardner RH. 1998. Pattern, process, and the analysis of spatial scales. In Peterson DL,
Parker VT. Ecological scale theory and applications. New York: Columbia University
Press, pp. 17-34.
Gaston KJ. 1994. Rarity. London: Chapmann & Hall.
148

Guichard F, Bourget E. 1998. Topographic heterogeneity, hydrodynamics, and benthic
community structure: a scale-dependent cascade. Marine Ecology Progress Series 171:
59-70.
Hansen, RA. 2000. Effects of habitat complexity and composition on a diverse litter
micro arthropod assemblage. Ecology 81: 1120-1132.
Koenig WD. 1999. Spatial autocorrelation of ecological phenomena. Trends in Ecology and
Evolution 14: 22-26.
Kunin WE. 1998. Extrapolating species abundance across spatial scales. Science 281: 1513-
1515.
Lancaster J, Belyea LR. 1997. Nested hierarchies and scale-dependence of mechanisms of
flow refugium use. Journal of the North American Benthological Society 16: 221-238.
Legendre P, Fortin M-J. 1989. Spatial pattern and ecological analysis. Vegetatio 80: 107-
138.
Legendre M, Legendre P. 1983. Numerical ecology. Amsterdam: Elsevier.
Levin SA. 1988. Pattern, scale, and variability: an ecological perspective. In Hastings A. (ed.)
Community ecology. Lecture notes in biomathematics 77. Berlin: Springer Verlag, pp.
1-12.
Levin SA. 1992. The problem of pattern and scale in ecology. Ecology 73: 1943-1967.
Levin SA. 1994. Patchiness in marine and terrestrial systems - from individuals to
populations. Philosophical Transactions of the Royal Society of London Series B
Biological Sciences 343: 99-103.
Levin SA. Buttel L. 1987. Measures of patchiness in ecological systems. Report Number
ERe-130. New York: Cornell University Ecosystems Research Center.
MacArthur RH, Wilson EO. 1967. The theory of island biogeography. Princeton University
Press, Princeton.
Macnae W. 1963. Mangrove swamps in South Africa. Journal of Ecology 51: 1-25.
Maurer BA. 1990. The relationship between distribution and abundance in a patchy
environment. Gikos 58: 181-189.
McCoy ED, Bell SS. 1991. Habitat structure: the evolution and diversification of a complex
topic. In: Bell SS. McCoy ED, Mushinsky HR. (eds.) Habitat structure: the physical
arrangement of objects in space. New York: Chapman & Hall, pp. 3-27.
McGeoch MA, Chown SL. 1997. The spatial variability ofrare and common species in a
gall-inhabiting Lepidoptera community. Ecography 20: 123-13l.
149

Menge BA, Olson AM. 1990. Role of scale and environmental factors in regulation of
community structure. Trends in Ecology and Evolution 5: 52-57.
Moran PAP. 1950. Notes on continuous stochastic phenomena. Biometrika 37: 17-23.
Morgan SG. 2001. The larval ecology of marine communities. In: Bertness MD, Gaines, SD,
Hay, ME (eds), Marine community ecology. Sunderland: Sinauer Associates, pp 159-
182.
Morse DR, Lawton JH, Dodson MM, Williamson MH. 1985. Fractal dimension of
,vegetation and the distribution ofathropod body lengths. Nature 314: 731-733.
Nagendra H, Gadgil M. 1999. Biodiversity assessment at multiple scales: Linking remotely
sensed data with field information. Proceedings of the National Academy of Sciences
of the United States of America 96: 9154-9158.
O'Neill RV, Gardner R, Milne BT, Turner MG, Jackson B. 1991. Heterogeneity and
spatial hierarchies. In: Kolasa J, Pickett STA. (eds), Ecological heterogeneity. New
York: Springer Verlag, pp. 85-95.
Phillips A, Lambert G, Granger JE, Steinke TD. 1994. Horizontal zonation of epiphytic
algae associated with Avicennia marina (Forssk.) Vierh. pneumatophores at
Beachwood Mangroves Nature Reserve, Durban, South Africa. Botanica Marina 37:
567-576.
Phillips A, Lambert G, Granger JE, Steinke TD. 1996. Vertical zonation of epiphytic algae
associated with Avicennia marina (Forssk.) Vierh. Pneumatophores at Beachwood
Mangroves Nature Sanctuary, Durban, South Africa. Botanica Marina 39: 167-175.
Pielou EC. 1977. Mathematical ecology, (second ed.) New York: JohnWiley & Sons.
Proche~ ~, Marshall DJ. 2001a. Ecological patterns of two cohabiting evolutionary distinct
animal groups: mangrove pneumatophore arthropods as a case study. Ecography,
submitted.
Proche~ ~, Marshall DJ. 2001b. Epiphytic algal growth and sediment deposition as
determinants of arthropod distribution and abundance on mangrove pneumatophores.
Estuarine, Coastal and Shelf Science, submitted.
Proche~ ~, Marshall DJ. Ugrasen K. Ramcharan A. 2001. Mangrove pneumatophore
arthropod assemblages and seasonality patterns. Journal of the Marine Biological
Association of the United Kingdom 81: 545-552.
Ricklefs RE. 1987. Community diversity: relative roles of local and regional processes.
Science 235: 167-171.
150

Ricklefs RE. 1990. Scaling patterns and processes in marine ecosystems. In Shennan K,
Alexander LM, Gold BD (eds), Large marine ecosystems: patterns, processes and
yields. Washington: American Association for the Advancement of Science, pp. 169-
178.
Rosenzweig ML. 1997. Species diversity in space and time (third edition). Cambridge
University Press, Cambridge.
Ross PM, Underwood AJU. 1997. The distribution and abundance of barnacles III a
mangrove forest. Australian Journal of Ecology 22: 37-47.
Saburova MA, Polikarpov IG, Burovsky IV, 1995. Spatial structure of an interstitial
sandflat microphytobenthic community as related to different spatial scales. Marine
Ecology Progress Series 129: 229-239.
Saifullah SM, Elahi E. 1992. Pneumatophore density and size in mangroves of Karachi,
Pakistan. Pakistan Journal of Botany 24: 5-10.
Satumanatpan S, Keough MJ. 2000. Roles of larval supply and behavior in detennining
settlement of barnacles in a temperate mangrove forest. Journal of Experimental
Marine Biology and Ecology 260: 133-153.
Satumanatpan S, Keough MJ, Watson GF. 1999. Role of settlement in detennining the
distribution and abundance of barnacles in a temperate mangrove forest. Journal of
Experimental Marine Biology and Ecology 241: 45-66.
Schoch GC, Dethier MN. 1996. Scaling up: The statistical linkage between organismal
abundance and geomorphology on rocky intertidal shorelines. Journal of Experimental
Marine Biology and Ecology 201 : 37-72.
Swadling KM, Gibson JAE, Ritz DA, Nichols PD. 1997. Horizontal patchiness in sympagic
organisms of the Antarctic fast ice. Antarctic Science 9: 399-406.
Tomlinson PB. 1986. The botany of mangroves. Cambridge: Cambridge University Press.
Underwood AJU, Chapman MG. 1996. Scales of spatial patterns of distribution in intertidal
invertebrates. Oecologia 107: 212-224.
Underwood AJU, Chapman MG. 1998. A method for analysing spatial scales of variation in
composition of assemblages. Oecologia 117: 570-578.
Underwood AJU, Petraitis PS. 1993. Structure of intertidal assemblages in different
locations: can the local processes be compared? In Ricklefs RE, Schluter D. Species
diversity in ecological communities, Chicago: University of Chicago Press, pp. 39-51.
151

Underwood AJU, Keough MJ. 2001. Supply-side ecology: the nature and consequences of
variations in recruitment of intertidal organisms. In: Bertness MD, Gaines, SD, Hay,
ME (eds), Marine community ecology. Sunderland: Sinauer Associates, pp 183-200.
Ward CJ, Steinke TD. 1982. A note on the distribution and approximate areas of mangroves
in south Africa. South African Journal of Botany 1: 51-53.
Wartenberg D. 1989. SAAP - A Spatial Autocorrelation Analysis Program. New Jersey:
published by the author.
Wiens JA. 1976. Population responses to patchy environments. Annual Review of Ecology
and Systematics 7: 81-120.
With KA, Gardner RH, Turner MG. 1997. Landscape connectivity and population
distributions in heterogeneous environments. Gikos 78: 151-169.
Whittaker RH. 1970. Communities and ecosystems. London: Macmillan.
Zwolfer H, Brandl R. 1989. Niches and size relationships in Coleoptera associated with
Cardueae host plants: adaptatinos to resource gradients. Gecologia 78: 60-68.
152

Chapter IX
Summary and discussion
Ecological and biogeographical patterns of secondary manne orgamsms are generally
constrained by their terrestrial links (Vermeij & Dudley, 2000). Chapter II shows that the taxa
that are in one way or another land-dependent (those land-dependent for most of their life
cycle, such as the mangrove trees, or at least during the reproductive season, as the seabirds,
seals and marine reptiles) have global distribution ranges largely corresponding to three
climatic belts. Some genera are strictly tropical in distribution, while others are restricted to
either northern, or southern cold waters. Very few are distributed across all latitudes. This
results in the existence of three distinct species assemblages, one northern, one tropical and
one southern, and also in an atypical latitudinal pattern of species richness, with three peaks in
the three species-rich latitudinal bands, and two lows in the warm temperate regions of each
hemisphere.
Both the existence of three different faunas, and the bimodal distribution of species
richness in each hemisphere is confirmed (Chapter III) for at least one group of marine mites,
the Ameronothroidea (Oribatida), for which records from the cold-climate regions of both
hemispheres are quite reliable. While records from tropical regions are scarce, these represent
entirely different families, and suggest much higher species richness. The Ameronothroidea,
together with the astigmatid family Hyadesiidae, are shown to represent an ecological group
characterized by worldwide intertidal distributions and high numbers of species per genus. In
this context, their low fecundity and limited dispersal possibilities, suggest long evolutionary
associations with the marine environment. However, their diversity is still relatively low, as
compared to that of typically marine (and not strictly intertidal) mites in the family
Halacaridae (prostigmata). Also, the latter family is cosmopolitan and seems to have unimodal
latitudinal distribution patterns, as suggested by Bartsch's (1989) review.
Chapter IV reviews the available literature on southern African marine intertidal mites,
and at the same time presents original results from a bioegeographical survey on the region's
rocky shores. The complete list of southern African mites contains eighty two species, but this
is likely to be an underestimation, given the absence of collections from habitats such as coral
reefs, sandy beaches and salt marshes. The bulk of the southern African intertidal mite fauna
(forty eight species) is contained in the family Halacaridae. Seventeen other species represent
153

the Ameronothroidea and Hyadesiidae. In both these ecological groups, the west coast is
species-poor, while the south and east coast are species-rich (the total number of species per
locality being about double, as compared to the west coast). These three provinces, defined for
other southern African marine biota, are confirmed here as having different marine mite
faunas. The pattern of species richness for intertidal mites is also similar to that already
observed for other intertidal rocky shore faunas, and different from that characterizing coral
reef faunas. (The coral reef element is essential in determining the patterns of species richness
in fishes and echinoderms, both of these having much richer faunas on the east coast, as
compared to both the west and south coast.)
The following chapters represent a senes of investigations into the ecology of
mangrove pneumatophore arthropods. Chapter V indicates that in this environment, species
richness is evenly distributed between primary and secondary marine species. However, the
two groups greatly differ in abundance, with primary marine arthropods being about one order
of magnitude more abundant that their secondary marine counterparts. Another difference
appears when considering assemblage composition along a salinity gradient, with primary
marine species apparently being more sensitive to low salinity, though this needs to be tested
experimentally. However, species from both groups are more abundant along forest fringes,
than in other habitats, and both groups appear to have summer peaks in abundance (though the
latter needs to be confirmed by multi-annual studies).
Further differences between primary and secondary marine arthropods are highlighted
In Chapter VI, concerning vertical distribution along the pneumatophores, and species
interactions. Typical primary marine species from this environment are more abundant at
higher elevation levels, while species with close terrestrial ancestry are more abundant at
lower levels. When considering the halacarid mites (that have long marine associations)
together with the primary marine group, differences in vertical distribution between the two
groups are highly significant. Correlation values among species abundances within each of the
two groups are always positive, while correlations between species from different groups are
either positive or negative. Environmental factors, especially desiccation, which increase with
both elevation and exposure to sunlight, affect both groups, causing their abundances to co
vary.
Chapter VII suggests that desiccation affects penumatophore arthropods not only
directly, but also by reducing algal growth. Algal mass is shown to increase sediment
deposition, thereby accommodating more interstitial arthropods. Correlations between
arthropod abundance and the dry mass of the algae/sediment are significantly positive for both
154

primary and secondary marine species. No clear differences between the two groups could be
observed in terms of population recovery after pneumatophore defaunation, which can be
explained by pneumatophore meiofaunal species in general lacking swimming larvae, and
therefore having limited dispersal capacities.
Patterns of variation in pneumatophore arthropod distribution across spatial scales are
described in Chapter VIII, showing that levels of similarity in assemblage composition and
species abundance decrease with increasing scale. No differences in cross-scale distribution
were observed between primary and secondary marine species, possibly relating to the fact
that both categories include widespread and localized species, occurring in low and high
abundance.
While logistic constraints imposed a limit on the number of factors considered in each
mangrove pneumatophore ecology chapter, by putting all these chapters together, a consistent
picture takes shape, indicating a strong dependence of the arthropod assemblages on the
availability of suitable habitat. This in tum is dependent upon both the density and size of the
pneumatophores, but only where sunlight and elevation conditions are suitable. Where the
microclimate is not appropriate, the arthropod assemblages are absent or scarce, irrespective
of pneumatophore availability. No definitive answers are provided regarding the nature of
biotic interactions within these assemblages, although such interactions are shown to be
present, and to some extent different between primary and secondary marine organisms.
Previously unreported patterns emerge from the thesis with respect to biogeography.
Differences are shown to occur between the distributions of primary and secondary marine
organisms, as long as secondary marine organisms maintain links with terrestrial habitats (as
in the case of seabirds and ameronothroid mites), but disappear in the case of land
independent species (such as cetaceans and halacarid mites). Also, these differences are clear
at global scale, but become difficult to assess at regional scale, as the small number of species
(e.g. southern African ameronothroid mites) does not allow for proper statistical treatment.
There remain many interesting unanswered questions, relating to both ecology and
biogeography. For example, how do abundance and species richness ratios between secondary
marine arthropods vary among habitats and geographical regions? From the little available
information, it appears that geographical variation in this respect is relatively small, when
compared to variation among habitats. Values around ten primary to one secondary marine
individuals, as documented for mangrove pneumatophores (Chapter V), have also been
reported for sand deposits, lower rocky shores (Bartsch, 1989), as well as sea-grass beds
155

(Sanchez-Jerez et aI., 1999). A much better representation of secondary marine species (up to
90% of the total arthropod abundance) is encountered in the upper littoral of rocky shores
(Bartsch, 1989; Mercer et aI., 2000). There is however a dearth of understanding as to what
are the factors determining these differences. Variations in species richness also appear to be
mainly habitat-determined. Rocky shores in most regions of the world, as well as in most
southern African localities, harbour a hyadesiid fauna of two to three species (chapters III,
IV). This taxonomic group could provide an excellent model for studying niche separation
mechanisms, in terms of feeding and tolerance to physico-chemical factors.
An interesting pattern not previously discussed in the thesis is the high ratio of
secondary marine to primary marine arthropod species on mangrove pneumatophores. It is
shown here that this ratio is around 1: 1. Although few cases for comparison are available, the
value of 1: 15 (for British subtidal hard substrata; Gee & Warwick, 1996) is more likely to be a
typical one. A reason for the high ratio in mangrove habitats may relate to the small ecological
distance between the typical soil environment of mites and insects, and the mangrove
sediments. This may suggest the center of origin for secondary marine arthropods to be in
tropical regions, where mangroves are prevalent. However, it would be simplistic to suggest a
that a single or predominant effect has prevailed in the origin of these arthropods. For
example, the ameronothroid mite Halozetes and the hyadesiid mites are restricted to rocky
shore environments. It is probable that these mites originated independently of the mangrove
environment, most likely as a result of glaciation at higher latitudes, and this resulted in
specialized attributes for a rocky shore existence. Although these ideas are given in different
perspectives for different organisms in chapters II and III, there is still considerable scope for
further study in this respect.
In the context of the growing concern for the loss of biodiversity, and its potential effects on
ecosystem functioning, further interest should be taken in the animal groups considered here.
Secondary marine arthropods constitute a major percentage of the total marine biodiversity,
and could therefore be used in assessing conservation priorities for marine protected areas.
Studies on these organisms are especially relevant in view of the recently recognized
importance to document the biodiversity of "coastal transition zones" (CTZs), which form the
interfaces among soils, freshwater sediments and marine sediments (Levin et aI., 2001; Wall et
aI.,2001).
156

References
Bartsch I. 1989. Marine mites (Halacaroidea: Acari) A geographical and ecological survey.
Hydrobiologia 178: 21-42.
Cornell HV, Lawton JH. 1992. Species interactions, local and regional processes, and limits
to the richness of ecological communities: a theoretical perspective. Journal of Animal
Ecology 61: 1-12.
Gaston KJ, Blackburn TM. 1996. Range size - body size relationship: evidence of scale
dependence. Oikos 75: 479-485.
Gee JM, Warwick RM. 1996. A study of global biodiversity patterns in the marine motile
fauna of hard substrata. Journal of the Marine Biological Association of the United
Kingdom 76: 177-184.
Levin LA, Boesch DF, Covich A, Dahm C, Erseus C, Ewel KC, Kneib RT, Moldenke A,
Palmer MA, Snelgrove P, Strayer D, Weslawski JM. 2001. The function of marine
critical zones and the importance of sediment biodiversity. Ecosystems 4: 430-451.
Mercer RD, Chown SL, Marshall DJ. 2000. Mite and insect zonation on a Marion Island
rocky shore: a quantitative approach. Polar Biology 23: 775-784.
Sanchez-Jerez P, Barbera Cebrian C, Ramos Espla AA. 1999. Comparison of the epifauna
spatial distribution in Posidonia oceanica, Cymodocea nodosa and unvegetated
bottoms: importance of meadow edges. Acta Oecologica 20: 391-405.
Vermeij GJ, Dudley R. 2000. Why are there so few evolutionary transitions between aquatic
and terrestrial ecosysytems? Biological Journal of the Linnean Society 70: 541-554.
Wall DH, Plamer MA, Snelgrove P. 2001. Biodiversity in critical transition zones between
terrestrial, freshwater, and marine soils and sediments: processes, linkages and
implications. Ecosystems 4: 418-420.
157

Appendix

Part I
Halacaropsis praecognita n. sp. (Acari: Halacaridae) from
southern Africa
Abstract
The marine halacarid mite genus Halacaropsis Bartsch, 1996 (Acari: Halacaridae) currently
comprises four species from the Mediterranean, northern Atlantic, and Australia. A new
species, Halacaropsis praecognita n. sp. (Acari: Halacaridae) is described from the rocky
shores of southeastern Africa (Eastern Cape and KwaZulu-Natal). This species possesses the
characteristic peg-like setae on leg I and enlarged median claws, but is distinguishable from
the other Halacaropsis species by not having toothed median claws on any ofthe legs.
Introduction
The family Halacaridae (Acari: Prostigmata) is mainly represented by marine species, living
in habitats ranging from the littoral fringe to deep-sea trenches (Bartsch 1989). Despite a
review (Bartsch 1972) and a few additional articles (Bartsch 1974, 1986, 1987, 1992), the
southern African fauna remains poorly known, with less than twenty species described from
the region. The current paper describes a new species, the largest known to date.
The genus Halacaropsis Bartsch, 1996 is based on the 'hirsuta group' of the genus
AgauopsisJ. and combines characters of both Agauopsis (chaetotaxy of tibia I) and Halacarus
(chaetotaxy of tarsi I and IT). It is represented by H hirsuta (Trouessart, 1889), from the
Mediterranean and the northern Atlantic, H warringa (Otto, 1993), from southeastern
Australia, H capuzina Bartsch, 1996, from south-western Australia and H nereis Otto, 1999,
from the Coral Sea. An undescribed species from southern Africa has been reported by
Bartsch (1986, 1996).
Material and methods
The southern African material comprised six specimens, which were cleared in lactic acid and
mounted in Hoyers medium. Three specimens of H nereis Otto were examined for
companson. Drawings were prepared from light-micrographs. Abbreviations used in
description: AD, anterior dorsal plate; AE, anterior epimeral plate; PE, posterior epimeral
plate; GA, genito-anal plate, OC, ocular plate; PD, posterior dorsal plate; ds, dorsal setae; ae,
159

anterior epimeral setae, P-2, P-3, P-4, second, third and fourth palpal segments, staring from
the base. All setae numbered from anterior to posterior. Legs numbered I to IV.
Halacaropsis praecogltita n. sp.
Holotype: male, South Africa, KwaZulu-Natal, Park Rynie, 29 VI 1999, leg. s. Proche~, from
mid-littoral algae. Paratypes: 1) male, South Africa, KwaZulu-Natal, Park Rynie, 1 IX 1999,
leg. s. Proche~, from Cheilosporum and Jania algae; 2) male, South Africa, Eastern Cape,
Preslies Bay, 29 V 1999, leg. DJ. Marshall, from lower littoral coralline algae; 3) female,
South Africa, Eastern Cape, Sardinia Bay, 8 VIII 1998, leg. DJ. Marshall, from Porphyra
algae; 4) female, South Africa, Eastern Cape, Sardinia Bay, 8 VIII 1998, leg. DJ. Marshall,
from mixed red algae; 5) deutonymph, South Africa, Eastern Cape, Sardinia Bay, 8 VIII 1998,
leg. DJ. Marshall, from mixed red algae. The holotype and paratypes are deposited at the
Natural History Museum in London (accession number BMNH(E)2001-13).
Male. Idiosoma 575 - 660 Ilm long and 510 - 565 Ilm wide.
Dorsum. AD 180-210 Ilm long and 175 - 190 Ilm wide, with ds-l situated on a small
prominence, frontal spine with small lateral lobes. OC 125-130 Ilm long and 70-75 Ilm wide,
with two corneae. PD 235-240 Ilm long and 150-190 Ilm wide, very thin and with ds-5 in its
posterior margin. Setae ds-2, ds-3 and ds-4 large, on platelets in the striated integument (Fig.
1A).
Venter. AE 205-215 Ilm long and 510 Ilm wide, carrying ae-l, ae-2 and ae-3. PE
280-310 Ilm long and 150-165 Ilm wide with one dorsal and three ventral setae. GA 255-
330 Ilm long and 180-230 Ilm wide, with genital opening placed centrally and the seventh
pair of ventral setae on in the anterior part (Fig. 1B). 5-6 pairs of peri genital setae on the inner
circle and 18-21 on the outer one. Genital opening with six pairs of subgenital setae, of which
the fourth is thicker than the other (Fig. 11).
Gnathosoma 225-230 Ilm long and 1651lm wide, rostrum slightly longer than
gnathosomal base. Basal pair of maxillary setae long, terminal pair short, two short pairs of
rostral setae present. Palps longer than rostrum, P-2 with a long seta, P-3 with one short,
spiny-tipped seta, P-4 with two proximal setae, one longer than the segment, and four distal
sub-apical setae (Fig. 1 C).
Legs long and robust. First pair longer than the other, with ventral peg-like setae. Two
ventral, denticulate setae are present on tibia II, one on tibia III, two on tibia IV. Chaetotaxy
160

B
Figure 1. Halacaropsis praecognita n. sp.; A idiosoma (dorsal), male; B idiosoma (ventral),
male; C gnathosoma (dorsal), male; D leg I, male; E leg II, male; F leg III, male; G leg IV,
male; H female genital opening; I male genital opening. All bars: 1 OO~m.
161
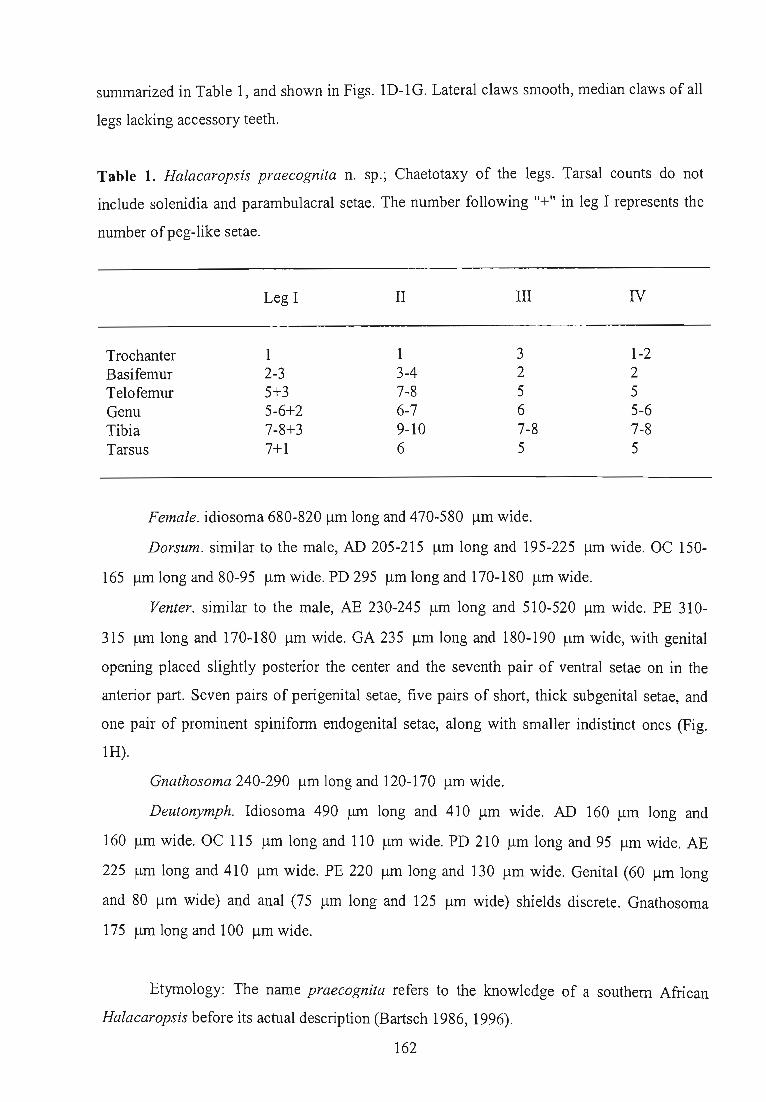
summarized in Table 1, and shown in Figs. 1D-1G. Lateral claws smooth, median claws of all
legs lacking accessory teeth.
Table 1. Halacaropsis praecognita n. sp. ; Chaetotaxy of the legs. Tarsal counts do not
include solenidia and parambulacral setae. The number following "+" in leg I represents the
number of peg-like setae.
Leg I II III IV
Trochanter 1 1 3 1-2 Basifemur 2-3 3-4 2 2 Telofemur 5+3 7-8 5 5 Genu 5-6+2 6-7 6 5-6 Tibia 7-8+3 9-10 7-8 7-8 Tarsus 7+1 6 5 5
Female. idiosoma 680-820 !lm long and 470-580 !lm wide.
Dorsum. similar to the male, AD 205-215 !lm long and 195-225 !lm wide. OC 150-
165 !lm long and 80-95 !lm wide. PD 295 !lm long and 170-180 !lm wide.
Venter. similar to the male, AE 230-245 !lm long and 510-520 !lm wide. PE 310-
315 !lm long and 170-180 !lm wide. GA 235 !lm long and 180-190 !lm wide, with genital
opening placed slightly posterior the center and the seventh pair of ventral setae on in the
anterior part. Seven pairs of perigenital setae, five pairs of short, thick sub genital setae, and
one pair of prominent spiniform endogenital setae, along with smaller indistinct ones (Fig.
1H).
Gnathosoma 240-290 !lm long and 120-170 !lm wide.
Deutonymph. Idiosoma 490 !lm long and 410 !lm wide. AD 160 !lm long and
160 !lm wide. OC 115 !lm long and 110 !lm wide. PD 210 !lm long and 95 !lm wide. AE
225 !lm long and 410 !lm wide. PE 220 !lm long and 130 !lm wide. Genital (60 !lm long
and 80 !lm wide) and anal (75 !lm long and 125 !lm wide) shields discrete. Gnathosoma
175 !lm long and 100 !lm wide.
Etymology: The name praecognita refers to the knowledge of a southern African
Halacaropsis before its actual description (Bartsch 1986, 1996).
162

Table 2. Characters oftaxonomic significance in the genus Halacaropsis.
Species H hirsuta H. warringa H capuzina H nereis H praecognita
Description Trouessart, 1889 Otto, 1993 Bartsch, 1996 Otto, 1999 Present paper
Lateral lobes at the anterior tip of AD + + + + Denticulate postero-ventral seta on tibia I + + + + Lateral claws denticulate + + + Accessory tooth on median claw I + + + +
....... 0\
W Accessory tooth on median claw II-IV + + + Rostrum slightly longer than gnathosomal base + + Spines at tip of P-3 seta + + + +

Discussion
H. praecognita sp. nov. is closest related to H. nereis Otto. The two species have in common
the smooth lateral claws, and the lack of the accessory tooth on median claws II-IV,
characteristics which distinguish them from all other Halacaropsis species (Table 2).
However, the absence of an accessory tooth on the median claw of leg I, the presence of a
denticulate postero-ventral seta on tibia I, and the rostrum, slightly longer than the
gnathosomal base, separate H. praecognita sp. nov. from H. nereis Otto.
Acknowledgements
Drs. David J. Marshall (University of Durban-Westville, South Africa), Philip J.A. Pugh
(British Antarctic Survey, Cambridge, u.K.) and one anonymous referee are thanked for
commenting on the manuscript. The study was partly funded by a National Research
Foundation (NRF) grant to Dr. D. J. Marshall. Dr. Jiirgen Otto (Australian Institute of Marine
Science, Townsville) kindly provided H. nereis material. Asok Rajh and Kaajial Ugrasen
(U.D.W.) assisted with the photography.
References
Bartsch I. 1972. Halacaridae (Acari) aus Stidafrika. Mitteilungen aus dem Hamburger
Zoologischen Museum und Institut 69: 5-32.
Bartsch I. 1974. Agaue vajeta n. sp., Beschreibung einer Halacaride (Acari) von Stidafrika.
Revue de Zoologie Africaine 88: 175 -179.
Bartsch I. 1986. Zur Gattung Agauopsis (Acari, Halacaridae), Beschreibung zweier neue
Arten und Ubersicht tiber Verwandtschaftsgruppen. Zoologica Scripta 15: 165-174.
Bartsch I. 1987. Arhodeoporus kunzi n. sp., eine Halacaride (Acari) aus dem Mesopsammal
Stidafrikas. Articulata 2: 389 - 392.
Bartsch I. 1989. Marine mites (Halacaroidea: Acari) a geographical and ecological survey.
Hydrobiologia 178: 21 - 42.
Bartsch I. 1992. Lohmannella dictyota n. sp. und Lohmannella africana n. sp., von der
Stidhalbkugel. (Arachnida: Acari: Halacaridae). Senckenbergiana Biologica 72: 457 _
464.
Bartsch I. 1996. Halacarines (Acari, Halacaridae) from Rottnest Island, Western Australia:
the genera Agauopsis Viets and Halacaropsis gen. nov. Records of the Western
Australian Museum 18: 1-18.
164

Otto JC. 1993. Description of a new species of the Agauopsis hirsuta -group from Australia
(Acarina: Halacaridae). Acarologia 34: 211-22l.
Otto Jc. 1999. Halacarid fauna of the Great Barrier Reef and Corral Sea: the genera
Agauopsis and Halacaropsis (Acarina: Halacaridae) . Memoirs of the Queensland
Museum 43 : 797-817.
Trouessart E. 1889. D'acariens manns (Halacaridae) des cotes de France. Diagnose
d'especes et genres nouveaux. Naturaliste 11 : 181.
165

Part II
New species of Copidognathinae (Acari: Halacaridae) from
southern Africa
Abstract
Three new species of Copidognathinae (Acari: Balacaridae) are described from the eastern
coast of southern Africa (Mozambique; South Africa: Eastern Cape and KwaZulu-Natal).
Copidognathus caloglossae sp. nov. and Acarothrix umgenica sp. nov. were collected in
mangrove habitats, whereas Copidognathus xaixaiensis sp. nov. was collected on a rocky
shore. Acarothrix umgenica represents the first record of the genus Acarothrix Bartsch 1990
from the African continent.
Introduction
The subfamily Copidognathinae compnses the largest halacarid genus (Copidognathus
Trouessart, 1888, which has c. 300 species described) along with Acarothrix Bartsch, 1990,
Arrhodeoporus Newell, 1947, Copidognathides Bartsch, 1976, Phacacarus Bartsch, 1992 and
Werthella Lohmann, 1907. Characteristics of the subfamily are: adult anterior epimeral plate
with one pair of pores, palp with one seta on the femur and none on the patella, leg genua
shorter than both telofemora and tibiae, chaetotaxy of tibiae I and II similar, solenidia dorso
lateral in tarsi I and II (Bartsch, 1997a).
To date, only one species from this subfamily, Arhodeoporus kunzi Bartsch, 1987, has
been recorded in the subtropical waters stretching from eastern South Africa to southern
Mozambique (Bartsch, 1987). Three new species of Copidognathinae from this region are
described here.
Methods
The mites described here were collected during the last few years by D. J. Marshall of the
University of Durban-Westville and the author in a few localities along the eastern coast of
southern Africa (Figure 1). Specimens were cleared in lactic acid and mounted in Boyers
medium. All measurements were taken on slide-mounted material and drawings were
prepared from light micrographs. The type material is deposited at the Natural History
Museum, London, United Kingdom.
166

Abbreviations used in description and figures: AD, anterior dorsal plate: AE, anterior
epimeral plate; AP, anal plate; GA, genito-anal plate; GP, genital plate; OC, ocular plates; PD,
posterior dorsal plate. Dorsal setae numbered ds-l to ds-6 (not including the dorsal seta on
PE). Legs numbered I to IV.
o
Figure 1. The collection localities.
Taxonomic descriptions
Copidognathus xaixaiensis sp. nov. (Figure 2)
Richard's Bay Durban (Beachwood, Bayhead, Isipingo)
Mtakatye
o 200 400 km
Material. One male (holotype, accession number BMNH(E)200l-l4), from the middle
littoral rocks on the breakwater wall facing the resort in Xai-Xai (Mozambique), collected in
December 1997, leg. DJ. Marshall.
Male. Idiosoma 265 11m long and 160 11m wide.
Dorsum. All plates with polygonal reticulation. AD 50 11m long and 60 11m wide, with
ds-1 positioned posterior of center; reticulation restricted to the central-posterior part. Anterior
margin of AD rounded. OC 45 11m long and 40 11m wide, with one large cornea and ds-2 at
the anterior end; the existence of a second cornea is not obvious. The posterior end of OC
protruding and reaching to the trochanter of leg III; reticulation restricted to the anterior half.
PD 175 11m long and 100 11m wide, not extending beyond the anterior margin of Oc. ds-3 to
ds-5 evenly placed along each median costa; lateral costae not obvious. The reticulation
covers the whole surface, although more pronounced in the anterior third, where the pattern is
generally hexagonal. In the posterior part the polygons have various shapes, but are
167

H
Figure 2. Copidognathus xaixaiensis sp. nov. (male), A) idiosoma, dorsal view, B) idiosoma,
ventral view (bar: 100 flm), C) gnathosoma, dorsal view, (bar: 50 flm), D) leg I, medial view,
E) leg II, medial view, F) leg III, lateral view, G) leg IV lateral view (bar: 100 flm), H) tarsus
III (bar: 50 flm), I) reticulation from the anterior third of AD (bar: 10 flm).
168

generally more elongated (Figure 2A). Meshes of reticulation not subdivided, size 4-10 11m
(Figure 21).
Venter. All plates smooth. AE 100 11m long and 125 11m wide, with three pairs of
ventral setae. PE 125 11m long, with one dorsal and three ventral setae. GA 120 11m long and
90 11m wide (Figure 2B).
Male genitalia. Located at the posterior extremity of GA, surrounded by numerous
perigenital setae (extremely fine and difficult to count). Genital opening with four pairs of
fine sub-genital setae, two anterior and two posterior.
Gnathosoma. 110 11m long and 55 11m wide, with smooth cuticle. Rostrum triangular,
palpi strongly elongated. Distal palp segment with a whorl of three long basal setae; no apical
setae were identified (Figure 2C).
Legs. Leg I longer and more robust than other legs. Chaetotaxy, from trochanter to
tibia: leg I, 1, 2, 5,4, 7; leg II, 1,2, 5, 4, 7; leg III, 1, 2, 2, 3, 5; leg IV, 0, 2, 2, 3, 5. Medial
setae on tibiae (two on legs I, II, one on legs III, IV) thickened, but not clearly bipectinated.
Lateral setae on genu and tibia II long, on genu and tibia I extremely long, longer then
corresponding tarsi (Figure 2D-G). Claws with a well-developed comb and long, pointed tips
(Figure 2H).
Female and juvenile stages. Unknown.
Etymology. This species is named after the collecting locality, Xai-Xai (pronounce
Shye-Shye) in Mozambique.
Remarks. This species belongs to the Copidognathus tricorneatus group, which has
been reviewed by Bartsch (1997b). Among the species of the group, it is similar to
Copidognathus tricorneatus (Viets, 1938) in having large meshes in the reticulation of PD,
medial costae not reaching the anterior margin of this plate, and triangular rostrum, with
rostral sulcus extending to the base of the second palp segment. It has however a very
characteristic OC, with no obvious second cornea, and ds-1 in the inner corner. Unlike in any
species of this group, the lateral setae on the genu and tibia of leg I are unusually long. A
similar feature occurs in the unrelated species Copidognathus venustus Bartsch, 1977.
Copidognathus caloglossae sp. nov. (Figure 3)
Type material (accession number BMNH(E)2001-13). Holotype: male, South Africa,
Eastern Cape, Mtakatye Estuary, May 1999, leg. ~. Proche~. Paratypes: one male, two
females, and one protonymph, data as in holotype; one protonymph, and two larvae, from
169

A
H _//0:'. -~~ " .
" . . ' . . ' .
Figure 3. Copidognathus caloglossae sp. nov. A) idiosoma, dorsal view, B) idiosoma, ventral
view, C) gnathosoma, dorsal view, D) female ano-genital plate, E) leg I, medial view, F) leg
II, medial view, G) leg III, lateral view, H) leg IV, lateral view, I) tip of tarsus I, J) telofemur
I, lateral view. All drawings, except D) based on male individuals. All bars: 100 flm, except
I), where 10 flm.
170

South Africa, KwaZulu-Natal, Bayhead Lagoon in the Durban Harbour, July 1999, leg. ~.
Proche~. Other material (30 more individuals examined) comes from Richards Bay, Isipingo
and Beachwood mangrove forests in KwaZulu-Natal, as well as from Inhambane
(Mozambique). All individuals were collected from the algal association known as
'Bostrychietum', covering the pneumatophores of the mangrove-tree Avicennia marina
(Forsk.) Vierh ..
Male. Idiosoma 370 - 425 11m long and 275 - 300 11m wide.
Dorsum. AD 115 - 135 11m long and 140 - 150 11m wide, with ds-l in the anterior half.
Three prominent porose areolae present, one oblong, anterior and two rounded, centro-lateral,
all with groups of five to ten pores. Other pores are present on all edges of the plate, without
forming clearly defined fields. OC 90 - 125 11m long and 60 - 80 11m wide, with centro-lateral
porose areolae, one seta and two comeae. A ridge separates the postero-Iateral end of OC by
from the rest of the plate. PD 230-260 11m long and 220 - 230 11m wide, with four large costae
covered with groups of 10-15 pores; the space between the costae with an indistinct
canalicular reticulation (Figure 3A).
Venter. AE 120 - 155 11m long and 240 - 260 11m wide, with the first three pairs of
ventral setae. Canaliculi mainly in two transverse bands, joining the origin of legs in pairs I
and IT, respectively. PE 160 - 180 11m long, with evenly distributed canaliculi, carrying one
dorsal and three ventral setae. GA 175 - 210 11m long and 150 -180 flm wide, with genital
opening placed behind the middle. Five to nine pairs of peri genital setae, generally disposed
in one circle; sometimes the posterior ones are more outwardly placed than the anterior ones.
Genital opening with four pairs of sub-genital setae, two anterior and two posterior (Figure
3B).
Gnathosoma. 130 - 135 flm long and 115 - 125 flm wide, rostrum slightly shorter than
gnathosomal base, palpi longer than rostrum. Gnathosomal base with evenly arranged
canaliculi. Distal segment of palpus with a whorl of three long basal setae and a few small
terminal setae (Figure 3C).
Legs. First pair shorter and more robust than other legs. Claws smooth, no accessory
process was identified (Figure 31). Canaliculi present, especially in the femora and tibiae of
legs I and II. Chaetotaxy, trochanter to tibia: leg I, 1,2,5,4, 7; leg IT, 1,2,4,4, 7; leg ITI, 1,2,
2, 3, 5; leg IV, 0, 2, 2, 3, 5. Medial bipectinated setae on tibiae: two on legs I and II, one on
legs III and IV (Figure 3E-H). Ventral setae on telofemora I and II, as well as on all
171

basifemora very short (Figure 3J). Dorsal setae on tarsus I and II located in the middle of the
segment.
Female. Idiosoma 410 - 450 J..l.m long and 305 - 335 J..l.m wide.
Dorsum. Similar to the male, AD 115 - 120 J..l.m long and 155 - 160 /lm wide. OC 105
- 120 J..l.m long and 80 - 105 J..l.m wide. PD 260 - 335 /lm long and 215 - 230 /lm wide.
Venter. AE 160 - 165 /lm long and 270 - 275 J..l.m wide. PE 170 - 180 /lm long. GA 200 -
205 J..l.m long and 150 - 175 /lm wide, with genital opening placed slightly behind the middle.
Three pairs of perigenital setae (Figure 3D).
Gnathosoma. 130 - 160 /lm long and 100 - 130 /lm wide.
Protonymph. Idiosoma 275 - 410 /lm long and 225 - 310 J..l.m wide. Plates smaller than
in adults, as compared to total body length, leaving large areas of striated integument. AD 60 -
75 /lm long and 90 - 95 J..l.m wide. OC 50 - 60 /lm long and 45 - 50 J..l.m wide, with two
corneae located on a protuberance; however, the posterior ridge present in adults is absent. PD
130 - 145 /lm long and 155 - 195 /lm wide. AE 85 - 95 /lm long and 160 - 220 /lm wide. PE
125 - 130 /lm long. Genital and anal plates separate; genital 45 - 60 /lm long and 50 - 60 /lm
wide, anal 50 /lm long and 75 - 80 J..l.m wide.
Gnathosoma relatively small, 125 - 130 J..l.m long and 45 - 90 /lm wide.
Legs significantly smaller than in adults, basifemur and telofemur N merged in one
femoral segment.
Larva. Idiosoma 270 - 280 /lm long and 195 - 210 /lm wide; plates small, large parts
of the integument are not striated, but have irregular folds. AD 50 - 55 /lm long and 55-
60 J..l.m wide. OC 25 - 30 /lm long and 30 - 35 /lm wide. PD 75 - 85 /lm long and 95 -
100 /lm wide. AE 75 - 85 /lm long and 160 - 170 /lm wide, with large, clearly visible pores.
PE 65 - 75 J..l.m long. Genital and anal plates separate; genital 25 - 30 /lm long and 35 -
40 J..l.m wide, anal 40 - 45 J..l.m long and 70 - 75 J..l.m wide.
Gnathosoma 105 - 110 /lm long and 40 - 80 /lm wide.
Femoral segments merged in all legs.
Etymology. The name caloglossae refers to the alga Caloglossa leprieurii (Mont.) 1.
Ag., one of the components of the algal association from which the mites were collected.
Remarks. One uncommon feature found in C. caloglossae sp. nov. is represented by
the completely smooth claws. It has been suggested that in the halacarid sub-family
Rhombognathinae, smooth claws are associated with species from habitats exposed to little
172

wave action, while claw combs are used for securing the mite to substrates exposed to strong
wave action (pugh et aI., 1987). As southern African mangroves are an estuarine feature, the
wave action is low, favoring similar features in C. caloglossae sp. nov. (subfamily
Copidognathinae). Other characters which, combined, are useful in defining this species are
the four dorsal costae covered with groups of pores, short mouthparts, the short ventral setae
on telofemora I and II, as well as on all basifemora, the medial position of dorsal setae on tarsi
I and II.
An aspect worth noting is the presence of this species in the Isipingo Estuary, where
salinity is close to zero. Five other species of Copidognathus have been recorded from similar
low-salinity habitats (Bartsch 1996).
Acarothrix umgenica sp. nov. (Figure 4)
Type material (BMNH(E)2001-13). Holotype: male, South Africa, KwaZulu-Natal,
Beachwood mangroves in Durban, 18 August 1999, leg. S. Proche~. Paratypes: one male,
same data as for holotype; two females, two protonymphs, and one larva, same locality as the
holotype, 26 October 1999, leg. S. Proche~. Other material was collected in Richards Bay
(South Africa, KwaZulu-Natal). In all, around 30 specimens were examined, all of which
were collected in sediment or algae covering the pneumatophores of the mangrove-tree
Avicennia marina.
Adults. Sexes very much alike; no significant difference in body or plate sizes.
Idiosoma 325 - 385 /lm long and 230 - 300 /lm wide.
Dorsum. All plates thin, apparently smooth, although high magnifications reveal
complex cuticular patterns. AD 80 - 90 /lm long and 100 - 105 /lm wide, with a posterior
transversal strip-shaped part where a reticulation is visible. OC 105 - 130 /lm long and 85 -
105 /lm wide, with two corneae, one anterior seta and, locally, unclear reticulation. ds-3 could
not be located. PD 220 - 230 /lm long and 105 - 115 /lm wide, with three pairs of setae: ds-4
and ds-5 placed centrally, equally distant from a pair of gland pores; ds-6 ventral, close to
anal opening, next to a pair of small gland-bearing cones, indistinct in some individuals. A
central pattern of canalicular polygons is more visible in the anterior half of PD; in many
individuals, particularly if well cleared, this plate appears to be completely smooth (Figure
4A).
Venter. All plates with fine, evenly arranged canaliculi. AE 150 - 155 /lm long and
210 - 255 /lm wide, with three pairs of ventral setae and a pair of large pores. PE 170 - 220
173

\
"" H ~ 1\
), ~
(/ ~-.
"
!\ ~ \ !
(
G ) ~.
Figure 4. Acarothrix umgenica sp. nov., male: A) idiosoma, dorsal view, B) idiosoma, ventral
view, C) gnathosoma, dorsal view, D) leg I, lateral view; E) leg II, lateral view, F) leg III,
dorsal view, G) leg N, lateral view, H) male genitalia, I) female genitalia. All drawings
except I) based on male individuals. All bars: 100 /lm.
174

~m long, with one dorsal and three ventral setae. GA 155 - 175 ~m long and 120 -160 ~m
wide, with a fold between the genital part and the anal part (Figure 4B).
Male genitalia. Eight to ten pairs of perigenital setae, sometimes asymmetrically
disposed. Sub genital setae: two pairs setiform and two spur-like. Behind the last spur-like
setae, a pair of genital acetabula can sometimes be observed (Figure 4H).
Female genitalia. Three pairs of peri genital setae surround the genital opening; and
one pair of anterior subgenital setae (Figure 41).
Gnathosoma. 125 - 170 ~m long and 55 - 90 ~m wide, palpi longer than rostrum.
Gnathosomal base with evenly arranged canaliculi. Distal palp segment with a whorl of three
long basal setae and one short subterminal seta (Figure 4C).
Legs. First pair more robust, the other pair long and slender. Chaetotaxy of legs, from
trochanter to tibia: leg I, 1,2,5,4,6; leg II, 1,3,5,4,6; leg III, 1,2,3,3,5; leg IV, 1, 1(?), 3,
3, 5. Claws very long, especially in legs II, III, IV, almost smooth, dent of accessory process
indistinct (Figure 4D-G).
Juvenile stages. Plates very thin, with poorly defined limits. The integument IS
generally smooth. Protonymph. Idiosoma 245 - 320 ~m long and 200 - 235 ~m wide.
Gnathosoma 120 - 155 ~m long and 80 - 85 ~m wide.
Legs: basifemur and telofemur IV merged in one femoral segment.
Larva. Idiosoma 235 - 265 ~m long and 175 - 205 ~m wide.
Gnathosoma 110 - 120 ~m long and 40 - 60 ~m wide.
Femoral segments merged in all legs.
Etymology. The name umgenica refers to the river Umgeni (alternative spellings:
Mgeni, rnNgeni, uMngeni), from whose estuary the specimens were collected. According to
Begg (1978), the name means in Zulu 'the river that flows among thorny trees (Acacia)'.
Remarks. Acarothrix umgenica sp. nov. differs from the other two species of
Acarothrix (compare Bartsch, 1990, 1997a) in the relative size of the dorsal plates: in the new
species AD is much smaller and PD is larger. The shape of OC is also different, with longer
posterior tips. The fold separating the anal and genital parts of AG, present in slide-mounted
males and females, indicates a strong convexity of the genitalia, not noted in the other
Acarothrix species. The reticulation present on PD is similar to that illustrated by Bartsch
(1990) for A. palustris protonymphs, but in the new species this could only be observed in
adults. No canalicular punctuation on the ventral plates has been described in either A.
palustris Bartsch, 1990 or A. longiunguis Bartsch, 1997.
175

This is the first mention of the genus Acarothrix from the African continent.
Previously, the genus was known from southern China and northern Australia (Bartsch, ' 1990,
1997a). This distribution is possibly congruent with that of Indo-West Pacific mangrove
forests.
Acknowledgements
Drs. David J. Marshall (University of Durban-Westville, South Africa), Jiirgen Otto
(Australian Institute of Marine Science, Townsville, Australia) and Ilse Bartsch (Biologische
Anstalt Helgoland, Germany) are thanked for advice and reprints. The comments of two
anonymous referees have been essential for the quality of this article. Asok Rajh and Kaajial
Ugrasen (UDW) assisted with the photography. The study was partly funded by a National
Research Foundation grant to Dr. D. J. Marshall and by the University of Durban-Westville.
References
Bartsch I. 1987. Arhodeoporus kunzi sp. nov., eme Halacaride (Acari) aus dem
Mesopsammal Slidafrikas, Articulata, 2: 389 - 392.
Bartsch I. 1990. Acarothrix palustris gen. et spec. nov. (Halacaroidea, Acari), ein Bewohner
der Salzwiesen Slidchinas. Zoologischer Anzeiger 224: 204-210.
Bartsch I. 1996. Halacarids (Halacaroidea, Acari) in freshwater. Multiple invasions from the
Paleozoic onwards? Journal of Natural History 30: 67-99.
Bartsch I. 1997a. Copidognathinae (Halacaridae, Acari) from northern Australia; description
of four new species. In: Hanley JR, Caswell G, Megirian D, Larson HK (eds.),
Proceedings of the Sixth International Marine Biological Workshop. The marine flora
and fauna of Darwin Harbour, Northern Territory, Australia, pp. 231-243, Darwin:
Museums and Art Galleries of the Northern Territory and the Australian Marine
Sciences Association.
Bartsch I. 1997b. A new speCIes of the Copidognathus tricorneatus group (Acari:
Halacaridae) from Western Australia with a review of this species-group. Species
Diversity, 2: 155-166.
Begg GW. 1978. The estuaries of Natal, Part I. Natal Town and Regional Planning Report
41: 1-657.
Pugh PJA, King PE, Fordy MR. 1987. Possible significance of the claw structure in the
Rhombognathinae (Halacaridae: Prostigmata: Acari), Acarologia, 27: 171-175.
176