the berger commission - cbcny · peninsula and st. ohn’s piscopal merge and downsize (180) ......
TRANSCRIPT

The Berger Commission: 10 Years On
November 29, 2016

Created in April 2005 to “review and strengthen New York State’s acute and long term delivery systems”
Empowered to make two types of recommendations:
1. Facility level recommendations using the “Base Closing Model”
2. Non-binding policy recommendations
Background
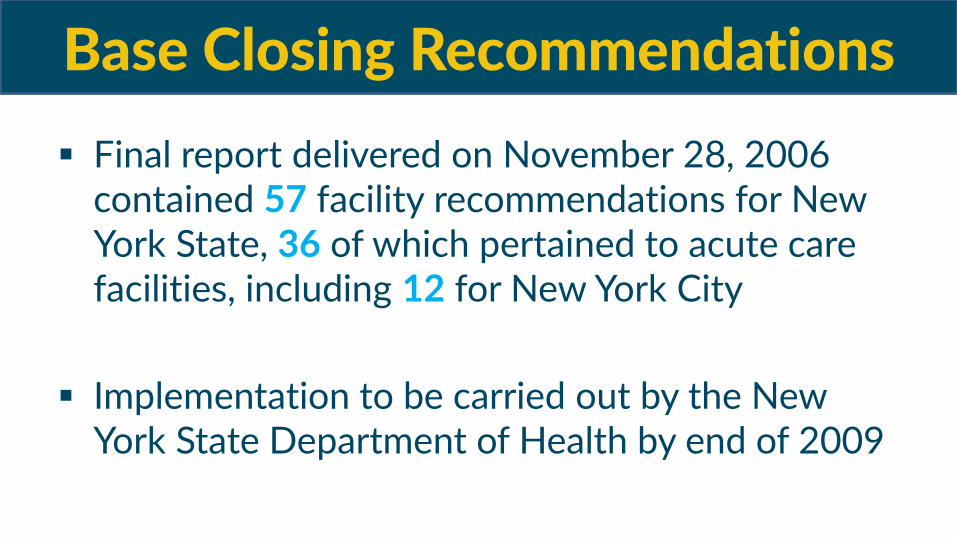
Final report delivered on November 28, 2006 contained 57 facility recommendations for New York State, 36 of which pertained to acute care facilities, including 12 for New York City
Implementation to be carried out by the New York State Department of Health by end of 2009
Base Closing Recommendations

Implementation of NYC Hospital Recommendations
Facility/Facilities Recommendation
Impact on Certified Beds
Recommended Actual
Victory Memorial Close (243) (243)
Parkway Hospital Close (251) (251)
Westchester Sq. Close (205) (205)
Cabrini Med. Close (474) (474)
St. Vincent’s Midtown and Manhattan Close Midtown; Manhattan add 12 beds (238) (238)
NY Methodist and BK Comm. Hospitals Full asset merger and downsize (100) 21
Peninsula and St. John’s Episcopal Merge and downsize (180) (180)
NY Downtown Downsize (74) (74)
Manhattan E, E, T Downsize (150) (150)
North General Merge w/ Mt. Sinai 0 0
Queens Hospital Add 40 Med/Surg 40 40
Beth Israel Petrie Convert beds 0 0
Net Reduction in Beds (1,875) (1,754)
Percent Decline -6.4% -6.0%

Changes in the Hospital System Have Been More Dramatic than Commission Anticipated
Acute inpatient capacity has shrunk beyond commission recommendations
Acute inpatient demand has dropped rapidly, meaning excess capacity remains despite downsizing
Acute inpatient capacity has been consolidated into large coordinated systems

Acute Inpatient Capacity Shrunk Beyond Commission Recommendations
2004
(actual) Commission
Recs 2009
(actual) 2014
(actual)
Total Certified Bed Capacity
29,230 27,355
26,226
23,467 Certified Beds per 1,000 Residents 3.7 3.3 3.2 2.8
Percent Decline from 2004 NA -6.4% -10.3% -19.7%
Source: NYS Health Profiles, Institutional Cost Reports; CBC communication with facilities

Acute Inpatient Demand Has Also Declined Rapidly – Leaving Occupancy Rates Unchanged
75
80
85
90
95
100
105
2004 2005 2006 2007 2008 2009 2010 2011 2012 2013 2014
Patient Days, Average Length of Stay and Discharges NYC, 2004-2014
(Indexed to 2004)
Patient Days ALOS Discharges
Source: Statewide Planning and Research Cooperative Commission Query System 2009-2014; SPARCS annual report ‘Hospital Inpatient Data of New York State’ 2004-2008.

Remaining Capacity Has Been Increasingly Consolidated into Coordinated Systems
11.5
5.6
1.4 1.9 1.8
0.8 0.6
7.0
5.2
3.3 2.2 2.2
1.1 0.6
Independent Health +Hospitals
Mount Sinai NY-Presbyterian
NorthwellHealth
NYU BronxLebanon
Inpatient Beds by Hospital System, 2004 and 2014 (in thousands)
2004 2014 Hospital Beds In
Independent Facilities
2004 – 39% 2014 – 30%
Source: CBC Analysis of CMS Institutional Cost Reports 2004-2013

Beyond Beds: Re-Routing Resources from ‘Sick Care’ to ‘Health Care’
Non-Binding Policy Recommendations
Expand access to health care through insuring the uninsured
Invest in primary care workforce and infrastructure and develop new delivery models
Align patient, payer and provider incentives
Medicaid reimbursement reform
New payment models
Invest in Health Information Technology infrastructure

The ACA and Medicaid Expansion Have Reduced NYC’s Uninsured Adult Population
-
1
2
3
4
5
6
7
2004 2005 2006 2007 2008 2009 2010 2011 2012 2013 2014
Mill
ion
s
13.8%
Notes: Includes New York City population age 19 years and older Source: New York City Community Health Survey, NYC Department of Health and Mental Hygiene, 2004-2014
17.6%

NYC Ambulatory Care Services Are Expanding
137 152
42
154
54
217
278
88
268
95
D&TCs D&TC - ExtensionClinic
School Based D&TC Hospital ExtensionClinic
School BasedHospital Extension
Clinic
Growth in Outpatient Facilities - 2004 vs 2016
Source: NYSDOH Health Facilities Information System

Growth in Retail Clinics and Urgent Care Centers
Source: United Hospital Fund, Convenient Care: Retail Clinics and Urgent Care Centers in New York State, February 2015

Developing New Delivery Models
Accountable Care Organizations
NYC: 9 NYS: 38
‘Health Home’ Primary Care Providers
NYC: 11 NYS: 32
Performing Provider Systems NYC: 11 NYS: 25

Employment in Ambulatory Care Settings Has Overtaken Hospital Based Employment
Source: US Bureau of Labor Statistics, Quarterly Census of Employment and Wages, 2004-2015
0
50
100
150
200
250
2004 2005 2006 2007 2008 2009 2010 2011 2012 2013 2014 2015
Th
ou
san
ds
Annual Average Employment - Ambulatory and Hospital Settings, New York City, 2004-2015
Ambulatory Health Care Hospital

There is Mixed Evidence That People are Accessing These New Resources
Source: New York City Community Health Survey, NYC Department of Health and Mental Hygiene, 2004-2014
0%
10%
20%
30%
40%
50%
2004 2005 2006 2007 2008 2009 2010 2011 2012 2013 2014
NoColonoscopyin past 10years (50+)
No PersonalDoctor
Mothers WhoReceived Lateor NoPrenatal Care

100
124
120
2005 2006 2007 2008 2009 2010 2011 2012 2013 2014
NYC ED Encounters per 1,000 Residents (Indexed to 2005)
Source: NYSDOH SPARCS, Emergency Department Audit Reports, 2005-2014
Increasing Emergency Department Use Suggests Inadequate Outpatient
Provision/Utilization

Progress is Being Made in Aligning Provider and Payer Financial Incentives
Source: NYSDOH Medicaid Eligibility and Expenditure Statistics Reports
Moving Medicaid from Fee-for-Service to Managed Care – New York City
-
500
1,000
1,500
2,000
2,500
3,000
3,500
4,000
2009 2012 2015
Th
ou
san
ds
Enrollment
$-
$5,000
$10,000
$15,000
$20,000
$25,000
$30,000
$35,000
2009 2012 2015
Mil
lio
ns
Expenditure
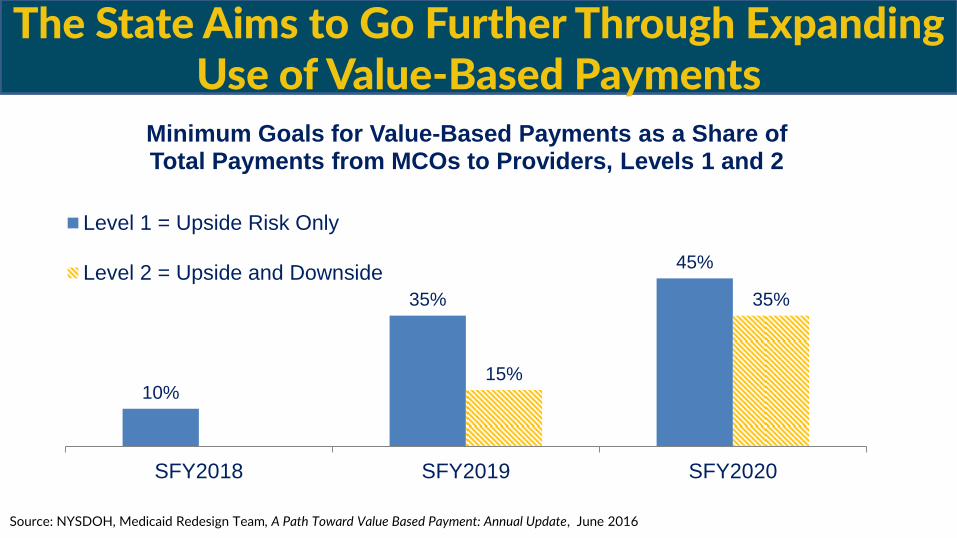
The State Aims to Go Further Through Expanding Use of Value-Based Payments
Source: NYSDOH, Medicaid Redesign Team, A Path Toward Value Based Payment: Annual Update, June 2016
10%
35%
45%
15%
35%
SFY2018 SFY2019 SFY2020
Minimum Goals for Value-Based Payments as a Share of Total Payments from MCOs to Providers, Levels 1 and 2
Level 1 = Upside Risk Only
Level 2 = Upside and Downside

Infrastructure Buy-In Is Robust, But Issues Remain
92% 79%
97%
81%
47%
23%
Hospitals Public HealthDepartments
FQHCs Home CareAgencies
Long Term CareFacilities
Clinical Practices
Statewide Health Information Network for New York Stakeholder Adoption by Provider Type
New York State – Sept. 2016
Source: SHIN-NY Dashboard Reports, April 2015 and September 2016

Takeaways
The Commission got the direction of change right, but it underestimated the pace of change;
The policy responses proposed were the right ones, but have yet to be fully implemented; and
More work needs to be done ensuring that outpatient care is replacing inpatient and emergency department care, not adding to it.

The Berger Commission: 10 Years On
November 29, 2016