the benefits and challenges of palm oil plantation in...
TRANSCRIPT

Proceedings of the International Conference on Global Business, Economics, Finance and
Social Sciences (GB15_Thai Conference) ISBN: 978-1-941505-22-9
Bangkok, Thailand, 20-22 February 2015 Paper ID: T518
1 www.globalbizresearch.org
The Benefits and Challenges of Palm Oil Plantation in Malaysia – A
Study on Foreign Direct Investment
Christo Selvan,
Nilai University,
School of Business, Malaysia.
E-mail: [email protected]
Chau Thanh Doan Thu,
Nilai University,
School of Business, Malaysia.
E-mail: [email protected]
___________________________________________________________________________
Abstract Foreign Direct Investment becomes an integral part of economic growth of a country. This
study investigates the issues relating to Foreign Direct Investment in Malaysia, Multinational
companies foreign direct investment strategy, motives and benefits of FDIs, capacity and
constraint, location strategies and taxation policy in Malaysia for MNCs. Keeping in mind the
national interests the policy makers designed the FDI policy which aims FDI as a medium for
acquiring advanced technology and to mobilize foreign exchange resources. Even though
there is no causal relationship between FDI and Malaysia economic growth still FDI plays
an important role in the economic growth of the country.
__________________________________________________________________________ Key words: FDI, Economic growth, Plantation industry, Investments

Proceedings of the International Conference on Global Business, Economics, Finance and
Social Sciences (GB15_Thai Conference) ISBN: 978-1-941505-22-9
Bangkok, Thailand, 20-22 February 2015 Paper ID: T518
2 www.globalbizresearch.org
1. Introduction
Foreign direct investment (FDI) and multinational corporations (MNCs) play a large and
growing role in shaping both economic and political world. From a macroeconomic point of
view, FDI is a particular form of capital flows across borders, from countries of origin to host
countries, which are found in the balance of payments (Denisia, 2010). FDI is the means by
which an MNC obtains or expands a subsidiary can take a variety of forms (Singh, 2012).
Global FDI flows increased by 35% to $345 billion for the first three quarters of 2013,
However, it was 4% below the $1 trillion observed over the same period in 2012 (OECD,
2014).
When multinational corporations enter different foreign markets, it is market failures that
attract FDI and give them the advantages in those markets (Denisia, 2010). According to
Yang and Huan (2011), the increasing prominence of MNCs in the recent economy has drawn
much attention not only from international organizations and national government agencies
but also from local citizens.
When the firm has grown rapidly but the domestic market is no longer sufficient, the
management chooses to expand to other countries (Iqbal, 2004). It means that the foreign
country must provide greater advantages than the home country; so, it lead the company go
for FDI. Hymer (1976, cited in Denisia, 2010) found that as MNCs are foreign, they face high
costs and risks with their investment in other countries. However, Faeth (2009) mentioned
that FDI was motivated by higher profitability as well as low labour costs and exchange risks
in foreign countries. The motives of FDI for every MNC are different within different
markets, home-countries, and industries. Manufacturing MNCs are attracted raw materials,
market, and infrastructure in the host country (Buckley and Casson, 2009), while MNCs in
knowledge-based investments are primarily attracted by skilled labour and industry presence
(Porter and Rivnik, 2012).
Majority of foreign companies choose electrical, chemical, basic metal, nonmetallic
mineral and plastic products, food manufacturing, and scientific and measuring equipment for
FDI (Ministry of Finance, 2001, cited in Karimi and Yusop, 2009). In addition, MNC use
various methods of FDI including acquisition, equity investment, expansion, Greenfield, joint
venture, and partnership (OECD, 2008).
Malaysia is an open and developing economy. As a result, external events such as the oil
crises of the 1970s, the downturn in the electronics industry in the mid-1980s, and especially
the Asian financial crisis of 1997, put a significant impact to Malaysian until 2000s.
Therefore, the government tried to attract FDI to improve the country’s economic condition.
Malaysian government introduced the Investment Incentives Act 1968 and established of free
trade zones in the early 1970s. Following that, Promotion of Investment Act (PIA) was

Proceedings of the International Conference on Global Business, Economics, Finance and
Social Sciences (GB15_Thai Conference) ISBN: 978-1-941505-22-9
Bangkok, Thailand, 20-22 February 2015 Paper ID: T518
3 www.globalbizresearch.org
announced in 1986 to allow a larger percentage of foreign equity ownership in enterprise. As
a result, the FDI inflow and outflow increased rapidly in Malaysia.
Based on the research of Chowdhury and Mavrotas (2005), there was a strong
relationship between FDI and economic growth for developing countries such as Malaysia.
However, Duasa (2007) found that there is no strong evidence of causal relationship between
FDI and Malaysian economic growth. However, FDI contribute to stability of economic
growth in this country.
2. Company’s corporate strategies and foreign investment
Johnson & Johnson's operating companies are divided into different business segments
including Medical Devices and Diagnostics, Consumer and Pharmaceutical. Therefore, their
strategic planning is to remain an impeccable and meeting all expectations of human-care
consumers and for its sellers, from pharmaceutical and medical device and diagnostics
markets. Johnson and Johnson has actively embraced outsourcing, making it a key component
in the company’s strategy, enabling it to maintain its competitive edge. When Johnson &
Johnson Company considers outsourcing, they look at the business environment including a
country's legal framework, regulatory and taxation complexity, and economic and political
volatility (Njau, 2012).
About foreign investment with acquisition, Johnson & Johnson (China) Investment Ltd.,
the branch of Johnson and Johnson that announced and handled the acquisition, is a foreign
investment entity established in China by Johnson and Johnson from 1998 (MPO, 2013). In
the 2013, Johnson and Johnson invested a reported $1.0 billion in company mergers and
acquisitions, which represented 3.98% of its available cash during this period (The New York
Times Company, 2013). At the same time, Johnson and Johnson planed to $290 million in a
new production base in Xi'an, China (Yang, 2013). In addition, Johnson and Johnson is
investing in proven programs to save new-born lives in countries including China, India,
Indonesia, Vietnam, Nepal, Pakistan, Uganda, Malawi, Kenya, Ethiopia, Ghana and South
Africa (Johnson and Johnson, 2012a).
3. Motives for Johnson & Johnson to engage for FDI:
3.1 Resource - seeking
Availability of natural resources, cheap unskilled or semi-skilled labor, creative assets
and physical infrastructure promotes resource-seeking activities. Historically, the most
important host country determinant of FDI has been the availability of natural resources, e.g.
minerals, raw materials and agricultural products. Johnson and Johnson’s demands for low
cost resources include raw material and human resource is increasing because their cost of
sale and expenses are significant. Base on the chart, even though the sales increased from

Proceedings of the International Conference on Global Business, Economics, Finance and
Social Sciences (GB15_Thai Conference) ISBN: 978-1-941505-22-9
Bangkok, Thailand, 20-22 February 2015 Paper ID: T518
4 www.globalbizresearch.org
2010 to 2012, Johnson and Johnson net earning reduced significantly. Therefore, in order to
improve the performance, Johnson and Johnson need to low down their expenses.
Table 1: Johnson and Johnson's Sales and Net Earnings (2008-2012)
TOPIC UNIT 2008 2009 2010 2011 2012
Sales
U.S. dollars, millions
Percentage change
over previous year
Net
earnings
U.S. dollars, millions
Percentage change
over previous year
Source: Johnson and Johnson, 2012b
Sustainability reaches far beyond the walls of any one company, from the raw
materials purchased to the external partners that manufacture some of our products.
Working closely with our supply chain partners, Johnson and Johnson seeks to ensure
the sourcing of raw materials is sustainable (Johnson and Johnson, 2014). Johnson &
Johnson's raw materials and supplies increased from 2010 to 2011 and from 2011 to
2012. Therefore, they aim to get the quality material at a cheaper cost to improve their
income.
Table 2: Johnson and Johnson's raw materials and supplies (2008-2012)
USD $ in millions 2012 2011 2010 2009 2008
Raw materials and
supplies
1,416 1,206 1,073 1,144 839
Source: Johnson and Johnson, 2012b
Johnson and Johnson companies use a tiny fraction of this total — approximately 75,000
tons palm oil or less than 0.2 percent annually. In addition, Malaysia is the second-biggest
palm oil producer in the world, and oil palms are an important source of income for the state
and thousands of smallholder farms. As a result, Johnson and Johnson can invest to Malaysia
to get the raw material supply.
3.2. Market – Seeking
Firms want expand overseas to find new costumers for their goods and services.
For every company, new markets bring a chance to maintain competitive advantages
and grow within the industry as well as achieve scale and scope economies (Bitzenis
et al., 2007). Another motivation for market-seeking occurs when company have

Proceedings of the International Conference on Global Business, Economics, Finance and
Social Sciences (GB15_Thai Conference) ISBN: 978-1-941505-22-9
Bangkok, Thailand, 20-22 February 2015 Paper ID: T518
5 www.globalbizresearch.org
saturated sales in their home country, or when they believe investments overseas will
bring higher returns than additional investments at home. It is clear that the sale for
international market is increasing for Johnson and Johnson, from 52% in 2010 to 56%
in 2011-2012. In addition, in 2012, Asia-Pacific Africa took 20% of Johnson and
Johnson total sales. Therefore, it encourages Johnson and Johnson to invest on Asia
countries such as Malaysia because this is a potential market.
Market-seeking investment is attracted by factors like host country‟ market size,
per capita income and market growth (Kudina and Jakubiak, 2008). For Malaysia, the
pharmaceutical industry has shown tremendous growth over the last 10 years,
consistently between 8 to 10% annually (Naw, 2013). Moreover, the medical devices
market in Malaysia is growing rapidly from $0.936 billion in 2009 to $1.091 in 2010
of medical devices sales. Then, it is expected to increase up to $1.692 billion by 2015.
Figure 1: Malaysia’s Medical Devices Sales Indicators, 2007-2015 (USD billions)
Source: Istituto nazionale per il Commercio Estero, 2012
3.3 Efficiency-Seeking
The efficiency-seeking FDI is motivated by creating new sources of competitiveness for firms
and it goes where the costs of production are lower. New sources of competitiveness,
economies of scope and specialization and low cost of production are some of the efficiency
seeking factors of FDI (Wadhwa and Reddy, 2011).
According to the World Economic Forum (cited in Invest in Malaysia, 2013), Malaysia is
ranked 3rd globally in terms of its pay-to-productivity ratio, outperforming economies such as
Australia (80), Brazil (81), Canada (24), China (16), India (43). Therefore, Johnson and
Johnson can low down their cost production in Malaysia because of its high productivity.
Figure 1: Asia Tax Rate (2012)
Source: China Briefing, 2012

Proceedings of the International Conference on Global Business, Economics, Finance and
Social Sciences (GB15_Thai Conference) ISBN: 978-1-941505-22-9
Bangkok, Thailand, 20-22 February 2015 Paper ID: T518
6 www.globalbizresearch.org
4. Benefits of international diversification
4.1. Risk reduction
Diversified international investment offers investors or Multinational Corporations higher
expected returns and reduced risks from exclusively domestic investment. Investing in a
variety of assets reduces risk, especially when compared to investing in a limited number of
stocks (Riddix, 2011). Moreover, because of different industrial structure in different
countries as well as because different economies do not trace out exactly the same business
cycle, there are reasons for smaller correlations between expected returns and investments in
numerous different countries than between investments within any one country (Johnston,
2014). By choosing many stocks from different industries or sectors, diversification can
protect the investors or MNCs from factors that influence each industry or sector. It means
that diversified international investment can help the company to share the risk into many
countries or segments. Therefore, if the investment in any countries faces losses or any
uncertainties, the investments in other countries will not be affected.
4.2. Opportunities
Because of the larger selection of investments in international markets, it brings the
company more opportunities. Hence, international diversifications offer the company such as
Johnson and Johnson with opportunities to generate profits with growth of international
market. The government from many countries is using infrastructure, raw materials and
resources in order to improve their economies. Johnson and Johnson will have more benefits
from investing in the new markets. The chart below shows that the U.S healthcare
expenditures growth rate reduces significantly.
The diversification lets multinational corporations to create opportunities that the home
country’s markets cannot offer. In addition, access to opportunities in foreign markets can
overcome growth challenges, and enhance a companies’ performance (Ang, 2007).
Specifically, in the latter half of the 1980s and early years of the 1990s, most of the
governments of ASEAN gradually liberalized their stock markets, giving foreign investors the
opportunity to invest in domestic securities. Therefore, the U.S based companies can have
more opportunities to earn more profit in foreign market, especially Asian market.
Moreover, a positive result of international diversification can be an increase in market
share for the company. By introducing new products, exploring new regions or targeting new
groups of customers in different countries, Johnson and Johnson can expand their customer
base. Other than that, international diversification leads the companies to more competition,
potential changes in customer preferences and seeing the products or services become
obsolete due to new technology (Johnston, 2014).

Proceedings of the International Conference on Global Business, Economics, Finance and
Social Sciences (GB15_Thai Conference) ISBN: 978-1-941505-22-9
Bangkok, Thailand, 20-22 February 2015 Paper ID: T518
7 www.globalbizresearch.org
4.3. Gain from stock and bond
Bonds as well as stocks in an internationally diversified portfolio provide an opportunity
to reduce risk for a given return compare to a stock only portfolio. According to a research by
Bruno Solnik (1974, cited in Goel and Chaudhary, 2013), an international portfolio of stocks
has about half as much risk as a portfolio of same size containing only U.S stocks.
Particularly, based on the figure 6, for any given number of stocks, an internationally
diversified portfolio typically has less than half the risk of a domestically diversified
portfolio. So, the gaining of international stock will be higher than U.S stock.
Furthermore, the benefit from holding bonds comes despite the relatively high exchange-
rate risk on bonds. Recently, Cappiello et al. (2006) found that an International Portfolio
Diversification of default-free bonds provides a good hedge against domestic bond market
declines. As a result, expected gains from international diversification are time-varying. In
addition, the expected gains from international diversification are higher for the globally
Portfolio Diversification of short term bonds than for long term bonds. On the other hand,
holding an International Portfolio Diversification of long term bonds provides little protection
against domestic bond market declines (Ahn et al., 2012). Gain from International Portfolio
Diversification in term of bonds and stocks bring benefit for multinational corporations such
as Johnson and Johnson because they can easily attract more investors when they apply
diversification strategy for their business.
5. Financial management capacity and constraints.
5.1. Financial Management
Johnson and Johnson have a healthy cash flow. The company generates positive free cash
flow each year from a highly diverse sales base, and often it’s a higher figure than net income.
The company’s free cash flow increased from $11,405 billion in 2011 to $13,819 billion in
2013. It allows the company to take advantage of acquisition opportunities that will augment
growth. For example, within the fiscal years from 2010 to 2012, the company brought in
nearly $38 billion in free cash flow. Then, the company paid about $18.5 billion in dividends,
another $18.2 billion on share repurchases, and about $8.5 billion on net acquisitions
(Dividend Monk, 2013).
Johnson and Johnson has a strong financial management in term of liquidity. Current
ratio, which measures the ability of a company to pay its current obligations using current
assets, for Johnson and Johnson, is significantly higher than the industry. Similarly, quick
ratio for the company is also better than the industry overall. It shows that Johnson and
Johnson has ability their creditors and repay their short-term debts. At the same time, Johnson
and Johnson’s debt/ equity ratios reduced from 2012 to 2013 and lower than the industry. It
means that the company can generate new funds from the capital market as they use less debt.
Proceedings of the International Conference on Global Business, Economics, Finance and
Social Sciences (GB15_Thai Conference) ISBN: 978-1-941505-22-9
Bangkok, Thailand, 20-22 February 2015 Paper ID: T518
8 www.globalbizresearch.org
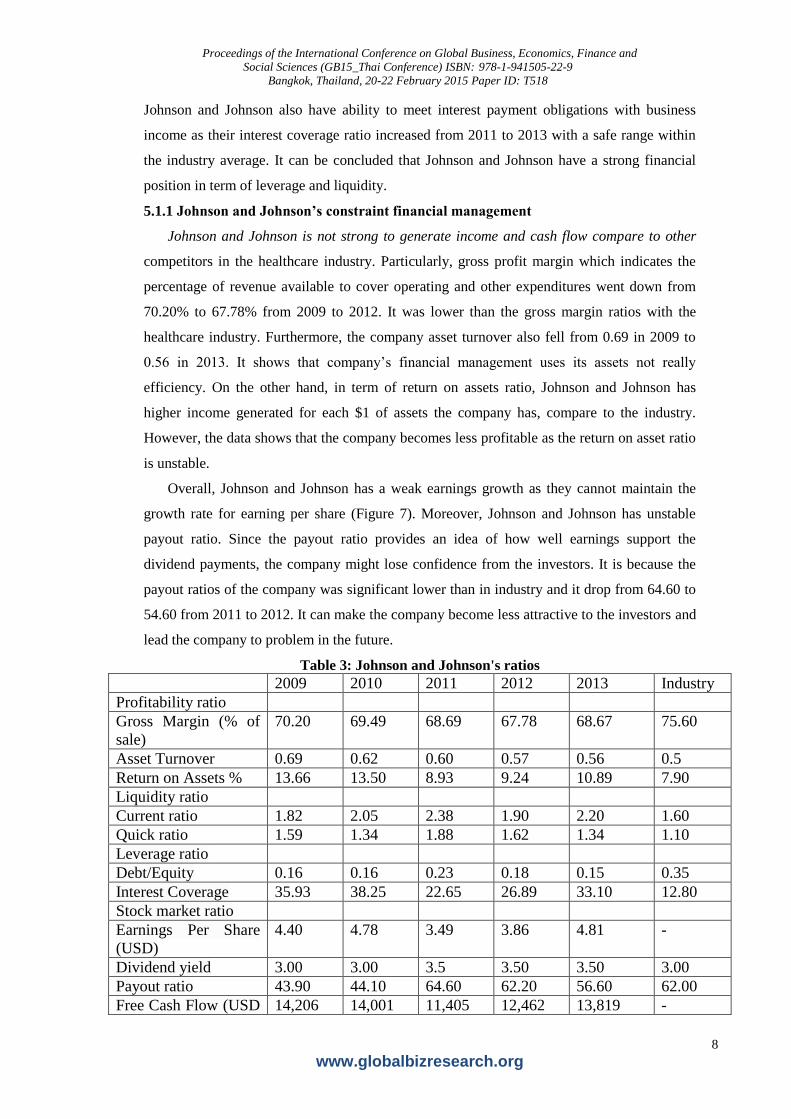
Johnson and Johnson also have ability to meet interest payment obligations with business
income as their interest coverage ratio increased from 2011 to 2013 with a safe range within
the industry average. It can be concluded that Johnson and Johnson have a strong financial
position in term of leverage and liquidity.
5.1.1 Johnson and Johnson’s constraint financial management
Johnson and Johnson is not strong to generate income and cash flow compare to other
competitors in the healthcare industry. Particularly, gross profit margin which indicates the
percentage of revenue available to cover operating and other expenditures went down from
70.20% to 67.78% from 2009 to 2012. It was lower than the gross margin ratios with the
healthcare industry. Furthermore, the company asset turnover also fell from 0.69 in 2009 to
0.56 in 2013. It shows that company’s financial management uses its assets not really
efficiency. On the other hand, in term of return on assets ratio, Johnson and Johnson has
higher income generated for each $1 of assets the company has, compare to the industry.
However, the data shows that the company becomes less profitable as the return on asset ratio
is unstable.
Overall, Johnson and Johnson has a weak earnings growth as they cannot maintain the
growth rate for earning per share (Figure 7). Moreover, Johnson and Johnson has unstable
payout ratio. Since the payout ratio provides an idea of how well earnings support the
dividend payments, the company might lose confidence from the investors. It is because the
payout ratios of the company was significant lower than in industry and it drop from 64.60 to
54.60 from 2011 to 2012. It can make the company become less attractive to the investors and
lead the company to problem in the future.
Table 3: Johnson and Johnson's ratios
2009 2010 2011 2012 2013 Industry
Profitability ratio
Gross Margin (% of
sale)
70.20 69.49 68.69 67.78 68.67 75.60
Asset Turnover 0.69 0.62 0.60 0.57 0.56 0.5
Return on Assets % 13.66 13.50 8.93 9.24 10.89 7.90
Liquidity ratio
Current ratio 1.82 2.05 2.38 1.90 2.20 1.60
Quick ratio 1.59 1.34 1.88 1.62 1.34 1.10
Leverage ratio
Debt/Equity 0.16 0.16 0.23 0.18 0.15 0.35
Interest Coverage 35.93 38.25 22.65 26.89 33.10 12.80
Stock market ratio
Earnings Per Share
(USD)
4.40 4.78 3.49 3.86 4.81 -
Dividend yield 3.00 3.00 3.5 3.50 3.50 3.00
Payout ratio 43.90 44.10 64.60 62.20 56.60 62.00
Free Cash Flow (USD 14,206 14,001 11,405 12,462 13,819 -
Proceedings of the International Conference on Global Business, Economics, Finance and
Social Sciences (GB15_Thai Conference) ISBN: 978-1-941505-22-9
Bangkok, Thailand, 20-22 February 2015 Paper ID: T518
9 www.globalbizresearch.org
Million) Source: Morningstar, Inc., 2014
5.1.2 Johnson and Johnson‘s location Strategies
As Johnson and Johnson Company represent 0.2% of the world’s consumption of palm
oil, they support the production of sustainable palm oil (Solidaridad, 2013). Johnson and
Johnson plans to invest in palm oil plantation in Malaysia through small plantation business,
smallholders as well as private estates. In 2013, Johnson and Johnson used their dedicated
palm oil fund through many projects to increase the global awareness of sustainable palm oil,
increase smallholder yields and optimize land use in Malaysia (Solidaridad, 2013). Therefore,
the company has the ability to connect with the smallholders for this investment. In addition,
the major private sector holding is 60% palm oil industry in Malaysia (Punch, 2013).
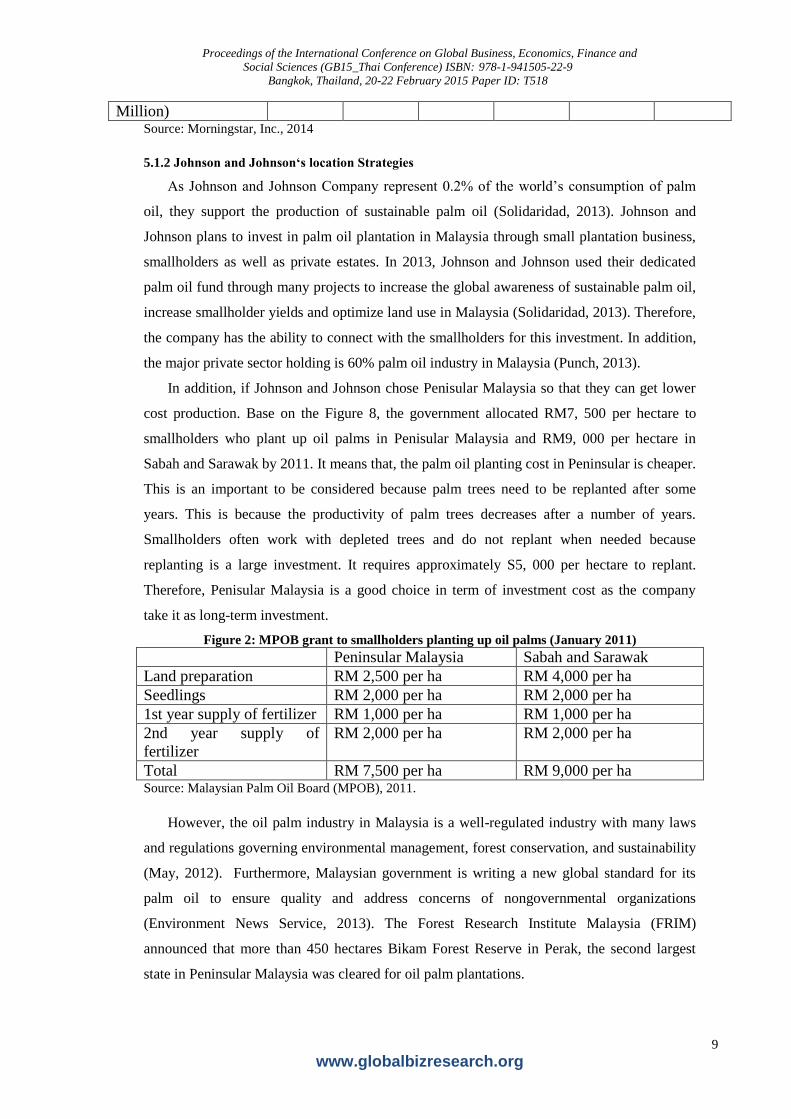
In addition, if Johnson and Johnson chose Penisular Malaysia so that they can get lower
cost production. Base on the Figure 8, the government allocated RM7, 500 per hectare to
smallholders who plant up oil palms in Penisular Malaysia and RM9, 000 per hectare in
Sabah and Sarawak by 2011. It means that, the palm oil planting cost in Peninsular is cheaper.
This is an important to be considered because palm trees need to be replanted after some
years. This is because the productivity of palm trees decreases after a number of years.
Smallholders often work with depleted trees and do not replant when needed because
replanting is a large investment. It requires approximately S5, 000 per hectare to replant.
Therefore, Penisular Malaysia is a good choice in term of investment cost as the company
take it as long-term investment.
Figure 2: MPOB grant to smallholders planting up oil palms (January 2011)
Peninsular Malaysia Sabah and Sarawak
Land preparation RM 2,500 per ha RM 4,000 per ha
Seedlings RM 2,000 per ha RM 2,000 per ha
1st year supply of fertilizer RM 1,000 per ha RM 1,000 per ha
2nd year supply of
fertilizer
RM 2,000 per ha RM 2,000 per ha
Total RM 7,500 per ha RM 9,000 per ha Source: Malaysian Palm Oil Board (MPOB), 2011.
However, the oil palm industry in Malaysia is a well-regulated industry with many laws
and regulations governing environmental management, forest conservation, and sustainability
(May, 2012). Furthermore, Malaysian government is writing a new global standard for its
palm oil to ensure quality and address concerns of nongovernmental organizations
(Environment News Service, 2013). The Forest Research Institute Malaysia (FRIM)
announced that more than 450 hectares Bikam Forest Reserve in Perak, the second largest
state in Peninsular Malaysia was cleared for oil palm plantations.
Proceedings of the International Conference on Global Business, Economics, Finance and
Social Sciences (GB15_Thai Conference) ISBN: 978-1-941505-22-9
Bangkok, Thailand, 20-22 February 2015 Paper ID: T518
10 www.globalbizresearch.org
Johnson and Johnson can invest more in Sarawak instead of Peninsular Malaysia to
reduce availability of land in peninsular Malaysia, government encourages palm oil private
sector to move to Sabah and Sarawak. Moreover, Malaysian Government is continuing an
expansionary palm oil production policy based on new land development in Sabah and
Sarawak. However, it is reported that the land available for oil palm plantations in Sabah is
almost exhausted. Then, The Sarawak state government has grand visions for boosting its
current area of 0.9 million hectares to two million hectares of oil palm by 2020 (Malaysian
Palm Oil Board 2010). Therefore, Sarawak is the best choice for the company as they need to
follow Malaysian government.
5.2 Malaysian government view of FDI
FDI helps boost the growth of economies by allowing for more markets and a larger
channel for each market (Graham and Jeffrey, 2005). Malaysia is a developing country and
they are in between developed and developing level (Trade Chakra, 2008). To become a
developed country, FDI has worked in Malaysian government’s favour because it has helped
to improve the national economy. Among the Southeast Asian countries, Malaysia has keenly
attracted FDI. Particularly, Malaysia has been the most successful Asian country to adopt the
FDI because the country combines FDI into the economic development strategy which helps
Malaysia to take up to date technology, capital, and skills (Trade Chakra, 2008).
Malaysia’s FDI inflows dropped sharply in 2009 because of economic downturn and the
global financial crisis. However, net FDI inflow of Malaysia recovered and increased
significantly after Global Financial Crisis in 2009. It leads to 25% increase in Malaysian
ringgit’s (Colombo, 2014). According to Sulong and Harjito (2005), Malaysia attracts more
foreign investors by making upgrade the level of national infrastructure and the development
of telecommunication. The better the infrastructure of the host country, the more attractive it
is to FDI (Wong, 2005). Moreover, Malaysian government offer a tax holiday for up to ten
years but only for investments made in new industries (Malaysia, 2012). Other than that, the
government offered promotion of investment act that was born in 1986. It allowed 100% of
the foreign ownership if a company would export 50% of the product. However, in keeping
with long-standing public policies and domestic economic, Malaysian government
encourages or requires joint ventures between Malaysian and foreign companies as well as
limits foreign equity and employment in many cases (Amerasinghe and Modesto, 2006).
5.3 Capital Budgeting
Capital budgeting is the process of identifying and selecting investment in the long-term
assets that will maximize owner’s benefits for more than one year (Peterson and Fabozzi,
2011). For every investment projects, capital budgeting tell the investors whether the
investment can create value or not. In addition, capital budgeting provides the managers a

Proceedings of the International Conference on Global Business, Economics, Finance and
Social Sciences (GB15_Thai Conference) ISBN: 978-1-941505-22-9
Bangkok, Thailand, 20-22 February 2015 Paper ID: T518
11 www.globalbizresearch.org
method to analyze potential business opportunities then decide which investments are worth
undertaking. Cash flows are discounted back at the discount rate to cash flows from a project
exceeds the cost of the project in present value. If the project has a positive NPV, it should be
accepted because it adds value. Free cash flow represents how much real cash available for
Johnson and Johnson. Free cash flow used to pay its dividends, make acquisitions, develop
new products, invest in new projects and reduce debt. Therefore, free cash flow shows how
much the c capacity is to develop further. Johnson and Johnson have a strong cash flow with
$13,819 million in 2013 (Table 4).
Even though, the free cash flow is not stable from 2009 to 2013, Johnson and Johnson
still can generate enough cash for its investment as all the company’s free cash flows are
positive.
Table 4: Free cash flow of Johnson and Johnson
2009 2010 2011 2012 2013
Free cash flow to equity
( USD $ in millions) 14,206 14,001 11,405 12,462 13,819
Change rate (%)
-1.44% -18.54% 9.27% 10.89%
Johnson and Johnson’s revenue is expected to grow at 3.64% in the next five
years shows that Johnson and Johnson have improving performance. In addition,
NWC shows availability of a company's liquid assets. Forecasting NWC shows that
Johnson and Johnson has enough assets to finance for FDI even in the case of
uncertainties.
Table 5: Johnson and Johnson‘s forecast of revenue and net working capital (NWC)
2009 2010 2011 2012 2013
Revenue (USD $ in
millions) 61,897 61,587 65,030 67,224 71,312
Growth rate (%)
-0.50% 5.59% 3.37% 6.08%
Average growth rate (%) 3.64%
2013 2014 2015 2016 2017 2018
Forecast Revenue
(USD $ in millions) 71,312 73,908 76,598 79,386 82,276 85,271
2009 2010 2011 2012 2013
Total Current Assets
(USD $ in Billions) 39.54 47.31 54.32 46.12 56.41
Total Current Liabilities
(USD $ in Billions) 21.73 23.07 22.81 24.26 25.68
Net working capital (NWC)
(USD $ in Billions) 17.81 24.24 31.51 21.86 30.73
NWC growth rate (%)
36.10% 29.99% -
30.63% 40.58%

Proceedings of the International Conference on Global Business, Economics, Finance and
Social Sciences (GB15_Thai Conference) ISBN: 978-1-941505-22-9
Bangkok, Thailand, 20-22 February 2015 Paper ID: T518
12 www.globalbizresearch.org
NWC average growth rate
(%) 19.01%
2013 2014 2015 2016 2017 2018
Forecast NWC
(USD $ in Billions) 30.73 36.57 43.52 51.80 61.64 73.36
5.4 Political Risk Management
Political risk is the risk of actions taken by the host country that have negative
implications on the performance of the business in the host country. In addition,
Malaysia has moderate levels of economic and political risk. At the same time find
political risk is significant in both industrialized and developing countries (Baek and
Qian, 2011). Overall, dynamic political risk has also significantly improved since
2010 in Malaysia (Marsh&McLennan Companies, 2013).
The Barisan Nasional (BN) coalition’s dominance through 52 years in power was
dented as it lost control (The Malaysian Insider, 2010). Moreover, uncertainty over
the timing of the vote could harm the national economy. The companies hold back on
spending during election time (Sithraputhran and Grudgings, 2012). In term of
economic reform, Malaysian government is implementing a $444 billion initiative,
called the Economic Transformation Program. They aim to propel the country to
developed nation by 2020. However, corruption and a perceived lack of judicial
independence are damaging investment. At the same time, race and religion are other
problems in Malaysian politics.
Malaysia has high political risk for international transaction policy, government
stability, religion stability and social stability compare to the world average.
Therefore, for Johnson and Johnson, they need to concern on these four areas when
they want to invest to Malaysia. However, the company also can have some benefits
as Malaysia has low political risk on monetary policy, fiscal policy, labour flexibility
and legal system.
A recent World Bank study indicated that believe that political risk will be the
most important constraint on investment in emerging markets more than half of all
firms. However, most of those companies do not have any method to measuring
political risk and do not integrate it into their approach to risk management. For
Johnson and Johnson, in order to manage political risk in Malaysia, they can seek for
independent consultants to have statistic about factors affecting the political
environment in Malaysia. In addition, Johnson and Johnson risk managers identify the

Proceedings of the International Conference on Global Business, Economics, Finance and
Social Sciences (GB15_Thai Conference) ISBN: 978-1-941505-22-9
Bangkok, Thailand, 20-22 February 2015 Paper ID: T518
13 www.globalbizresearch.org
main political risks in the particular states in Malaysia by collecting the data from
high-quality political risk consultants, local subsidiaries and partners, the public
domain, other companies, industry associations, local organizations, and other
sources. Then, risk manager can have a scenario set which provides a basis to define
their data requirements. Following that, risk managers should analyze the impact of
each scenario on the business.
The company can determine the changes that will affect in the firm’s cash flow if
one of the events in political risk occurs. If political risk increases, the company can
decide not to invest Malaysia or withdraw from the market in which the companies is
currently operating, and/or use the “counteractive response”, that is, try to gain a
competitive advantage based on MNC strengths and the needs of the host government.
5.5 Principles of MNC taxation in Malaysia
Malaysian government applies the same tax rate which is 25% for both local and foreign
enterprises from 2008. Profits are only taxed at the company level; so there is no tax for
dividend. Moreover, MNC in Malaysia are given 70% exemption of income taxes for 5 years
(Bureau of Economic and Business Affairs, 2013).
Figure 11: Malaysian corporation tax rate
Source: Trading Economics, 2014.
Taxation in Malaysia is attractive for Johnson and Johnson because the tax rate is reduced
and remains stably (Figure 11). Therefore, Johnson and Johnson can settle a long-term
investment without any uncertainties about taxation in Malaysia. Moreover, taxation principle
in Malaysia can helps the company reduce cost and earn more profit as they will pay less tax
for the first five years. In addition, they also can get more capital by declaring high dividends
to attract more shareholders in Malaysia because Malaysian government avoids double-tax.
5.6 Inflation
The inflation rate is one of the most important economic factors to be considered because
it affects the value of a nation's currency. Inflation is defined as a sustained increase in the

Proceedings of the International Conference on Global Business, Economics, Finance and
Social Sciences (GB15_Thai Conference) ISBN: 978-1-941505-22-9
Bangkok, Thailand, 20-22 February 2015 Paper ID: T518
14 www.globalbizresearch.org
general level of prices for goods and services. In January 2014, the inflation rate in Malaysia
was recorded at 3.40%. Compare to 1.2% in January 2013, Malaysian inflation rate has been
increasing significantly (Figure 11). However, the inflation rate is expected to increase further
in the coming months (The Star, 2014).
Johnson and Johnson can face some problems when inflation rate increase in Malaysia.
Particularly, the purchasing power of customers is reduced as people buy fewer goods and
services with the same unit of currency. Moreover, Johnson and Johnson might lower profit
then expectation for setting their investment in Malaysia. For example, higher prices for food,
transport, petrol and electricity lead to higher cost of manufacturing. In addition, employees
also demand higher wages at the time of high inflation. Then, fluctuated inflation rate in
Malaysia makes it difficult for Johnson and Johnson to predict the future of prices and returns
from investments.
Figure 3: Malaysia Inflation Rate (2012-2014)
Source: Trading Economics (2014)
5.7 Exchange rate
Figure 12 shows the exchange rate between Malaysian ringgit and U.S dollar. Compare to
January 2013, Malaysian ringgit has depreciated against the U.S. dollar in January 2014. It
means that the value of Malaysian ringgit is reducing. This factor can influence the Johnson
and Johnson’s FDI in Malaysia. According to Shahrudin et al. (2010), exchange rate is also
one of determinants for FDI. He mentioned that when currency value depreciated, it reduces
the cost of capital. Then, it leads to higher profit for foreign investors by making a larger
investment in terms of the domestic currency. In this case, Johnson and Johnson can get
advantage from the exchange rate to get higher return.

Proceedings of the International Conference on Global Business, Economics, Finance and
Social Sciences (GB15_Thai Conference) ISBN: 978-1-941505-22-9
Bangkok, Thailand, 20-22 February 2015 Paper ID: T518
15 www.globalbizresearch.org
Figure 4: Malaysian - U.S exchange rate (MYR/USD)
Source: Trading Economics (2014)
6. Conclusion
There are many benefits and challenges to stand firm in FDI Market. Investing in palm oil
plantations in Malaysia, the company can get more land resources, new market and efficiency
in the Malaysia. However, Johnson and Johnson need to consider many factors in order to
make the investment decision in Malaysia. First of all, the financial capacity and the
limitation in the company’s financial management is analysed to guarantee that the Johnson
and Johnson has enough capital for the investment. As Johnson and Johnson is a foreign
company, they have to follow Malaysian policy and regulation for all their actions including
setting the location strategy. Then, Johnson and Johnson also have to understand Malaysian
political risk, taxation, inflation rate and exchange rate.
References
A.M. Best Company, Inc. (2013). Malaysia. [Online]. Retrieved from:
http://www3.ambest.com/ratings/cr/reports/malaysia.pdf [Accessed 15th March 2014].
Accenture (2013). Managing Political Risk: Controlling Loss, Finding Opportunity. [Online].
Retrieved from: http://apps.olin.wustl.edu/faculty/chib/techrep/AhnChibKangNov2012.pdf
[Accessed 15th March 2014].
Ahn, H.D., Chib., B. and Kang, K.H. (2012). International Diversification Gains by Bond
Maturity: Evidence from an Ane Term Structure Model with Regime Shifts. [Online].
Retrieved from: http://www.accenture.com/SiteCollectionDocuments/PDF/Accenture-
Managing-Political-Risk-Controlling-Loss-Finding-Opportunity.pdf [Accessed 15th March
Amerasinghe, N. and Modesto, J. (2006). Foreign Direct Investment in Asia: Lessons of
Experience. [Online]. Retrieved from: http://www.aim.edu/files/download/132 [Accessed
15th March 2014].

Proceedings of the International Conference on Global Business, Economics, Finance and
Social Sciences (GB15_Thai Conference) ISBN: 978-1-941505-22-9
Bangkok, Thailand, 20-22 February 2015 Paper ID: T518
16 www.globalbizresearch.org
Ang, S.H. (2007). International Diversification: A “Quick Fix” For Pressures in Company
Performance?. Business review of The University of Auckland. Vol.9, No.1, pp.17-33.
Baek, K. and X. Qian. (2011). An Analysis on Political Risks and the Flow of Foreign Direct
Investment in Developing and Industrialized Economies. Economics, Management, and
Financial Markets. Vol.6, No.4, pp.2-35.
Bitzenis, A., Tsitouras , A. and Vlachos , V.A. (2007). Motives for FDI in a Small Emu
Member State: The Case of Greece. Journal of Economics and Business. Vol. 10, No. 2, pp.
12-42.
Buckley, P., and Casson, M. (2009). The Internalisation Theory of the Multinational
Enterprise: A Review of The Progress of a Research Agenda after 30 Years. Journal of
International Business Studies. Vol. 40, pp. 1563–1580.
Bureau of Economic and Business Affairs (2013). Investment Climate Statement – Malaysia.
[Online]. Retrieved from http://www.state.gov/e/eb/rls/othr/ics/2013/204686.htm [Accessed
15th March 2014].
Cappiello, L., Engle, R. F., and Sheppard, K. (2006), Asymmetric Dynamics in the
Correlations of Global Equity and Bond Returns?. Journal of Financial Econometrics. Vol.4,
No.4, pp. 537-572.
Centers for Medicare and Medicaid Services (2013). Historical. [Online]. Retrieved from:
http://www.cms.gov/Research-Statistics-Data-and-Systems/Statistics-Trends-and-
Reports/NationalHealthExpendData/NationalHealthAccountsHistorical.html [Accessed 11th
March 2014].
China Briefing (2012). China Facing Increasing Competition from Asian Neighbors On Tax
Rates and Costs. [Online]. Retrieved from:
http://www.china-briefing.com/news/2012/12/21/china-facing-increasing-competition-from-
asian-neighbors-on-tax-rates-and-costs.html [Accessed 8th March 2014].
Chowdhury, A. and Mavrotas,G. (2005). FDI and Growth: A Causal Relationship. WIDER
.Research Paper
Colombo, J. (2014). Why Southeast Asia's Boom Is A Bubble-Driven Illusion. [Online].
Retrieved from: http://www.forbes.com/sites/jessecolombo/2014/01/23/why-southeast-asias-
economy-is-a-giant-bubble-waiting-to-pop/ [Accessed 15th March 2014].
Denisia, V. (2010). Foreign Direct Investment Theories: An Overview of the Main FDI
Theories. European Journal of Interdisciplinary Studies. Vol. 2, No. 2, pp.104-110.
Dividend Monk (2013). Johnson & Johnson: Let It Dip To A 3% Yield. [Online]. Retrieved
from:
http://www.gurufocus.com/news/233296/johnson--johnson-let-it-dip-to-a-3-yield [Accessed
15th March 2014].

Proceedings of the International Conference on Global Business, Economics, Finance and
Social Sciences (GB15_Thai Conference) ISBN: 978-1-941505-22-9
Bangkok, Thailand, 20-22 February 2015 Paper ID: T518
17 www.globalbizresearch.org
Duasa, J. (2007). Malaysian Foreign Direct Investment and Growth: Does Stability Matter?,
The journal of Economic Cooperation. Vol. 28, No. 2, pp. 83-98.
Environment News Service (2013). Malaysia to Increase Palm Oil Component of Biodiesel.
[Online]. Retrieved from: http://ens-newswire.com/2013/10/28/malaysia-to-increase-palm-
oil-component-of-biodiesel/ [Accessed 15th March 2014].
Faeth, I. (2009). Determinants of Foreign Direct Investment –A Tale of Nine Theoretical
Models. Journal of Economic Surveys. Vol. 23, No.1, pp. 165-196.
Goel, D. and Chaudhary, M.H. (2013). Advantages of International Portfolio Diversification.
International Journal of Marketing, Financial Services & Management Research. Vol.2, No.
4, pp. 17-27.
Graham, P. and Jeffrey, R. (2005). Understanding Foreign Direct Investment. [Online].
Retrieved from:
http://www.going-global.com/articles/understanding_foreign_direct_investment.htm
[Accessed 15th March 2014].
Invest in Malaysia (2013). Why Malaysia?. [Online]. Retrieved from:
http://etp.pemandu.gov.my/Invest_In_Malaysia-@-Why_Malaysia%5E.aspx [Accessed 8th
March 2014].
Iqbal, M. (2004). Foreign Direct Investment: Decisions, Determinants, And the Role of
Taxation-a survey. The Conference Board of Canada. [Online]. Retrieved from:
www.conferenceboard.ca/e-Library/document.aspx?did=646&goal1=AUTHN [Accessed 8th
March 2014].
Istituto nazionaleper il Commercio Estero (2012). Medical Devices Industry in Malaysia.
[Online]. Retrieved from:
http://www.ice.gov.it/paesi/asia/malaysia/upload/173/Medical%20Devices%202012.pdf
[Accessed 8th March 2014].
Johnson and Johnson (2012a). 2012 Contribution Report. [Online]. Retrieved from:
https://www.jnj.com/sites/default/files/pdf/2012-Johnson-Johnson-Contributions-
Report.pdf [Accessed 10th March 2014].
Johnson and Johnson (2012b). 2012 Data Summary Report. Retrieved from: [Accessed 10th
March 2014].
Johnson and Johnson (2013). Johnson & Johnson Pharmaceuticals Segment Poised to
Continue Driving Growth with More than 10 Potential New Product Filings by 2017.
[Online]. Retrieved from:
http://www.investor.jnj.com/releasedetail.cfm?ReleaseID=766844 [Accessed 7th March
2014].

Proceedings of the International Conference on Global Business, Economics, Finance and
Social Sciences (GB15_Thai Conference) ISBN: 978-1-941505-22-9
Bangkok, Thailand, 20-22 February 2015 Paper ID: T518
18 www.globalbizresearch.org
Johnson and Johnson (2014). Raw Material Sourcing. [Online]. Retrieved from:
https://www.jnj.com/caring/citizenship-sustainability/strategic-framework/raw-material-
sourcing [Accessed 8th March 2014].
Johnston, K. (2014). Advantages & Disadvantages to Corporate Strategy Diversification.
[Online]. Retrieved from: http://smallbusiness.chron.com/advantages-disadvantages-
corporate-strategy-diversification-62119.html [Accessed 11th March 2014].
Karimi, M.S. and Yusop, J. (2009). FDI and Economic Growth in Malaysia. [Online].
Retrieved from: http://mpra.ub.uni-muenchen.de/14999/ [Accessed 8th March 2014].
Kudina, A. and Jakubiak, J. (2008). The Motives and Impediments to FDI in the CIS. Online].
Retrieved from: http://www.oecd.org/investment/gfi-7 [Accessed 7th March 2014].
Malaysia (2012). Malaysia - Foreign Investment. [Online]. Retrieved from:
http://www.nationsencyclopedia.com/Asia-and-Oceania/Malaysia-FOREIGN-
INVESTMENT.html [Accessed 15th March 2014].
Malaysian Palm Oil Board (MPOB) (2011). Overview of the Malaysian Oil Palm Industry
2010. [Online]. Retrieved from: http://econ.mpob.gov.my/economy/Overview_2010_final.pdf
[Accessed 15th March 2014].
Marsh&McLennan Companies. (2013). Political Risk Trends and Hotspots for 2014. Online].
Retrieved from: [Accessed 15th March 2014].
May, C.Y. (2012). Malaysia: Economic Transformation Advances Oil Palm Industry.
[Online]. Retrieved from:
http://www.aocs.org/Membership/FreeCover.cfm?itemnumber=18340 [Accessed 15th
March 2014].
Morningstar, Inc. (2014). Johnson & Johnson. [Online]. Retrieved from:
http://financials.morningstar.com/ratios/r.html?t=JNJ [Accessed 15th March 2014].
MPO (2013). Johnson & Johnson. [Online]. Retrieved from: http://www.mpo-
mag.com/contents/view_top30/2013-07-31/1-johnson-amp-johnson-551818/ [Accessed 7th
March 2014].
Naw, H. (2013). Malaysia Rising. [Online]. Retrieved from:
http://www.pharmaasia.com/article/malaysia-rising/9916 [Accessed 8th March 2014].
Newth, A. (2014). Investment Opportunities. [Online]. Retrieved from:
http://www.wisegeek.com/what-is-international-diversification.htm [Accessed 8th March
2014].
Njau, B. (2012). Johnson & Johnson Takes Outsourcing Route to Business Growth. [Online].
Retrieved from: http://www.fdiintelligence.com/Sectors/Pharmaceuticals/Johnson-Johnson-
takes-outsourcing-route-to-business-growth?ct=true [Accessed 7th March 2014].
Proceedings of the International Conference on Global Business, Economics, Finance and
Social Sciences (GB15_Thai Conference) ISBN: 978-1-941505-22-9
Bangkok, Thailand, 20-22 February 2015 Paper ID: T518
19 www.globalbizresearch.org
OECD (2008). Foreign Direct Investment Glossary. [Online]. Retrieved from:
http://www.oecd.org/daf/inv/investmentstatisticsandanalysis/40193734.pdf [Accessed 7th
March 2014].
OECD (2014). FDI in Figure. [Online]. Retrieved from:
www.oecd.org/investment/statistics.htm [Accessed 7th March 2014].
Peterson and Fabozzi (2011). Capital Budgeting: Theory and Practice. Canada: John Wiley
and Sons, Inc.
Porter, M., and Rivkin, J. (2012). Choosing the United States. Harvard Business Review. Vol.
90, No.3, pp. 80-93.
Punch (2013). Tackling Palm Oil Importation. [Online]. Retrieved from:
http://www.punchng.com/editorial/tackling-palm-oil-importation/ [Accessed 15th March
2014].
Riddix, M. (2011). 3 Advantages of Diversification as Part of your Investment Strategy.
[Online]. Retrieved from: http://www.benzinga.com/economics/11/09/1897071/3-advantages-
of-diversification-as-part-of-your-investment-strategy [Accessed 8th March 2014].
Shahrudin, N., Yusof, Z. and Mohd. Safar, N.H (2010). Determinants of Foreign Direct
Investment in Malaysia: What Matters Most?. [Online]. Retrieved from:
www.bizresearchpapers.com/18.%20Zarinah.pdf [Accessed 15th March 2014].
Sithraputhran, S. and Grudgings, S. (2012). FACTBOX-Key Political Risks to Watch in
Malaysia. [Online]. Retrieved from: http://articles.chicagotribune.com/2012-08-06/news/sns-
rt-malaysia-risks-factboxriskmy-20120806_1_factbox-key-political-risks-najib-razak-stuart-
grudgings [Accessed 15th March 2014].
Solidaridad (2013). Johnson & Johnson supports Palm Oil Programme of Solidaridad.
[Online]. Retrieved from: http://www.solidaridadnetwork.org/johnson-johnson-supports-
palm-oil-programme-solidaridad [Accessed 15th March 2014].
Sulong, Z. and Harjito, D.A. (2005). Linkages between Foreign Direct Investment and its
Determinants in Malaysia. Jurnal Ekonomi Pembangunan. Vol. 10 No. 1, pp.1-11.
The New York Times Company (2013). Johnson & Johnson. [Online]. Retrieved from:
http://dealbook.on.nytimes.com/Public/Deals?symbol=JNJ [Accessed 7th March 2014].
The Star (2014). StanChart: Inflation Rate May Rise to 3.4% in First Nine Months 2014.
[Online]. Retrieved from:
http://www.thestar.com.my/Business/Business-News/2014/01/09/STANCHART-
INFLATION-RATE-MAY-RISE-TO-3-PCT-IN-FIRST-9-MONTHS-0F-2014/ [Accessed
15th March 2014].
Trade Chakra (2008). FDI in Malaysia. [Online]. Retrieved from:

Proceedings of the International Conference on Global Business, Economics, Finance and
Social Sciences (GB15_Thai Conference) ISBN: 978-1-941505-22-9
Bangkok, Thailand, 20-22 February 2015 Paper ID: T518
20 www.globalbizresearch.org
http://www.tradechakra.com/economy/malaysia/fdi-in-malaysia-198.php [Accessed 15th
March 2014].
Trading Economics (2014). Malaysia Corporate Tax Rate. [Online]. Retrieved from:
http://www.tradingeconomics.com/malaysia/corporate-tax-rate [Accessed 15th March 2014].
Wadhwa, K. and Reddy, S. (2011). Foreign Direct Investment into Developing Asian
Countries: The Role of Market Seeking, Resource Seeking and Efficiency Seeking Factors.
International Journal of Business and Management. Vol. 6, No. 11, pp. 219-226.
Wong, H.T. (2005). The Determinant of Foreign Direct Investment in the Manufacturing
Industry in Malaysia. Journal of Economic Cooperation. Vol. 26, No.2 , pp.91-110.
Yang, L. (2013). Foreign Firms Look West to Boost Success. [Online]. Retrieved from:
http://www.chinadaily.com.cn/bizchina/2013-12/28/content_17202160.htm [Accessed 7th
March 2014].
Yang, T.H. and Huan, D.S. (2011). Multinational Corporations, FDI and the East Asian
Economic Integration. [Online]. Retrieved from:
http://ideas.repec.org/p/eti/dpaper/11071.html [Accessed 8th March 2014].
Bibliography
Adams, S. (2009). Can foreign direct investment (FDI) help to promote growth in Africa?
African Journal of Business Management. Vol.3, No.5, pp. 178-183.
Hooi, H.L. (2008). The Impact of Foreign Direct Investment on the Growth. International
Applied Economics and Management Letters. Vol. 1, No.1, pp. 41-45.
Kahai, S. K. (n.d.). Traditional And Non-Traditional Determinants Of Foreign Direct
Investment In Developing Countries. Journal Of Applied Business Research. Vol. 20, No.1.
Katerina, L., John, P. and Athanasios, V. (2004). Foreign Direct Investment And Economic
Growth. South Eastern Europe Journal of Economics. Vol.1 , pp. 97-110.
Khan, R.E.A. and Nawaz, M.A. (2010).Economic Determinants of Foreign Direct Investment
in Pakistan. J Economics. Vol. 1, No.2, pp. 99-104.
Sulong, Z. and Harjito, D.A. (2005). Linkages Between Foreign Direct Investment and its
Determinants in Malaysia. Jurnal Ekonomi Pembangunan. Vol. 10 No. 1, pp. 1-11.