the banking challenges and opportunities in central and eastern europe
TRANSCRIPT

THE BANKING CHALLENGES AND OPPORTUNITIES IN CENTRAL AND EASTERN EUROPE
Robert Wright Chief Executive Officer Raiffeisen Bank Kosovo November 26th 2015

Agenda
• Current environment
- who, where, what?
- macro economic data
• The banking challenges and opportunities
- costs
- competition
- customers
• Q & A
11/24/2015 Chapter 2

Geographic Footprint
3
Leading regional player
with CEE presence of over 25
years
Covering 16 markets (incl.
Austria), of which nine are EU
members and Serbia and
Albania have candidate status
Top 5 market position in
10 countries
Strong market position with
Austrian corporates focusing
on CEE
Note: Position based on loans and advances to customers as of Q3 2014. All loan data in EUR.
Additionally, RBI operates leasing units in Moldova and Kazakhstan.
Croatia, #4
Loans: 3.2 bn
Customers: 463,552
Business Outlets: 77
Bosnia & Herzeg., #2
Loans: 1.2 bn
Customers: 499,973
Business Outlets:
96
Albania, #1
Loans: 0.9 bn
Customers: 723,451
Business Outlets: 92
Kosovo, #1
Loans: 0.5 bn
Customers: 278,432
Business Outlets:
52
Romania, #4
Loans: 4.3 bn
Customers: 2,089,544
Business Outlets: 529
Poland, #8
Loans: 9.8 bn
Customers: 689,676
Business Outlets: 351
Czech Republic, #5
Loans: 6.3 bn
Customers: 481,804
Business Outlets: 127
Hungary, n.a.
Loans: 4.7 bn
Customers: 580,052
Business Outlets: 114
Austria, #3
Loans: 23.5 bn
Customers: 8,040
Business Outlets: 3
Slovenia, #12
Loans: 0.8 bn
Customers: 63,426
Business Outlets: 14
Bulgaria, #6
Loans: 2.2 bn
Customers: 761,894
Business Outlets: 156
Serbia, #5
Loans: 1.1 bn
Customers: 640,337
Business Outlets: 85
Russia, #10
Loans: 8.4 bn
Customers: 2,940,532
Business Outlets: 212
Belarus, #6
Loans: 1.0 bn
Customers: 744,935
Business Outlets: 97
Ukraine, #5
Loans: 2.7 bn
Customers: 2,940,593
Business Outlets: 671
Slovakia, #3
Loans: 7.5 bn
Customers: 926,903
Business Outlets: 178
Central Europe (CE)
Southeastern Europe (SEE)
Russia
CEE Other
Corporate Presentation 011/24/2015

CE /SEE/EE Countries
Central Europe South East Europe Eastern Europe
Hungary Poland Czech Republic Slovakia Slovenia
Romania Bulgaria Croatia Bosnia and Herzogovina Serbia Albania Kosovo
Russia Ukraine Belarus
11/24/2015 Chapter 4
Market data from Thomson Research and Raiffeisen Bank
International Research (June 2015)

Loans
11/24/2015 Chapter 5
-10
-6
-2
2
6
10
14
2010 2011 2012 2013 2014
CE household loans (% yoy) CE corporate loans (% yoy)
%
Central Europe loan growth - household and business segments

Loans
11/24/2015 Chapter 6
-8
-6
-4
-2
0
2
4
6
8
10
12
2010 2011 2012 2013 2014
SEE household loans (% yoy) SEE corporate loans (% yoy)
%
South East Europe loan growth household and business segments

Loans
11/24/2015 Chapter 7
0
15
30
45
60
75
HU PL RO BG HR RS AL RU UA BY
CE SEE EE
2013 V 2014
Foreign Currency Loans (% of total)

Non Performing Loans
11/24/2015 Chapter 8
0
5
10
15
20
25
30
35
40
HU RO SI BH BG HR RS AL UA*
CEE: Markets with NPLs < 10% CEE: Markets with NPLs > 10%
0
1
2
3
4
5
6
7
8
9
10
BY SK RU** CZ PL

Non Performing Loans
11/24/2015 Chapter 9
0
5
10
15
20
04 05 06 07 08 09 10 11 12 13 14
Central Europe Southeastern Europe Eastern Europe
CEE: NPLs (% of total loans)
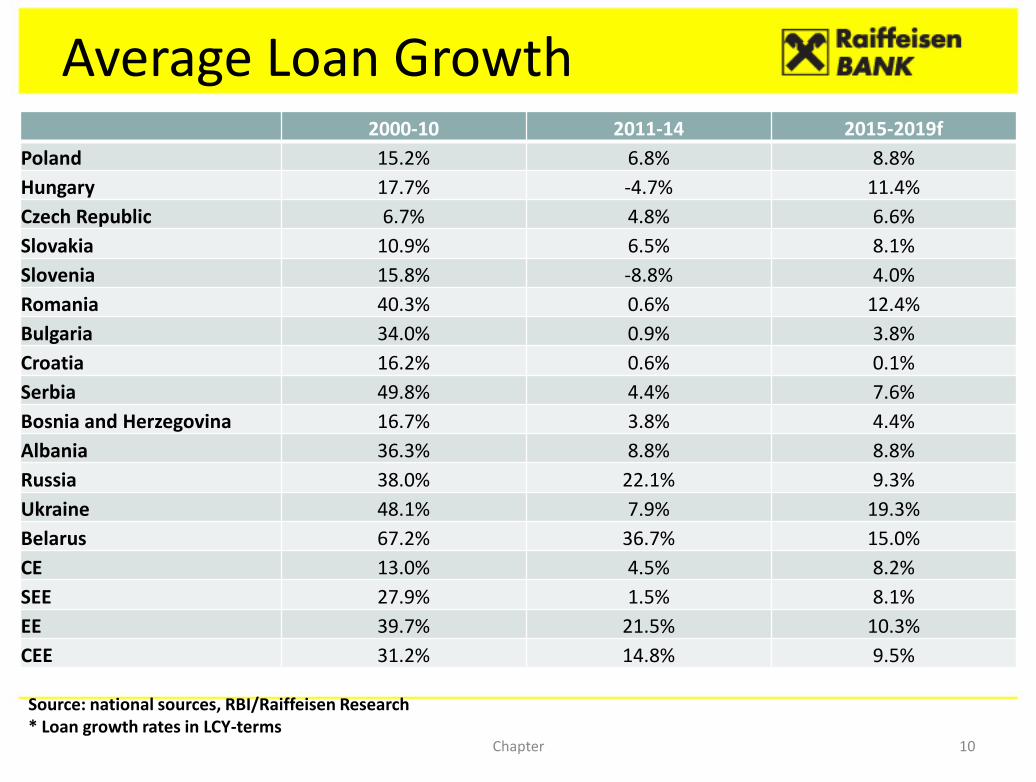
Average Loan Growth
11/24/2015
Chapter 10
2000-10 2011-14 2015-2019f
Poland 15.2% 6.8% 8.8%
Hungary 17.7% -4.7% 11.4%
Czech Republic 6.7% 4.8% 6.6%
Slovakia 10.9% 6.5% 8.1%
Slovenia 15.8% -8.8% 4.0%
Romania 40.3% 0.6% 12.4%
Bulgaria 34.0% 0.9% 3.8%
Croatia 16.2% 0.6% 0.1%
Serbia 49.8% 4.4% 7.6%
Bosnia and Herzegovina 16.7% 3.8% 4.4%
Albania 36.3% 8.8% 8.8%
Russia 38.0% 22.1% 9.3%
Ukraine 48.1% 7.9% 19.3%
Belarus 67.2% 36.7% 15.0%
CE 13.0% 4.5% 8.2%
SEE 27.9% 1.5% 8.1%
EE 39.7% 21.5% 10.3%
CEE 31.2% 14.8% 9.5%
Source: national sources, RBI/Raiffeisen Research * Loan growth rates in LCY-terms

Return on Equity
11/24/2015 Chapter 11
-15%
-10%
-5%
0%
5%
10%
15%
20%
HU SI** SK PL CZ
2013 2014
Central Europe
-15%
-10%
-5%
0%
5%
10%
15%
RO RS HR BH BG AL
2013 2014
South East Europe
-10%
-5%
0%
5%
10%
15%
20%
UA** RU BY
2013 2014
Eastern Europe

Return on Equity
11/24/2015 Chapter 12
0
2
4
6
8
10
12
2013 2014
CEE CE/SEE Euro area
CEE vs Euro area profitability (RoE, %)

Reduced income
• Regulation on capital, liquidity and structure is also causing shrinkage and distraction. Basel III 200 pages Basel IV 1000 pages!
• EBA – EUR 800bn reduction in loans outstanding 2011 – 2014 and EUR 1trn reduction in RWAs*
• Return on Equity 3.6% December 2014* – better but still too low.
• Non performing loans - NPLs peaked in 2013 at 13.8% in CEE. 9.5% Q1 2014 but forbearance introduced by EBA and IFRS9 may necessitate more provisions.
• Foreign currency loans – haircuts – Poland, Hungary, Croatia, Serbia.
*(EBA Risk Assessment Of The European Banking System June 2015)
11/24/2015 Chapter 13

Reduced income
• Narrowing net interest margins
11/24/2015 Chapter 14
% 2011 2012 2013 2014
SEE 6.6 6.2 6.5 6.4
CE 3.4 4.0 3.9 3.4
EE 4.1 1.3 2.4 2.9
(World Bank Report - Interest Rate Spread for PI customers)

Cost reduction • Revenue decline drives a faster move to digital banking, branch
closures (5300 shut or sold in 2013), 65,000 more branches closed by 2020 (40%). Head Office downsizing. 80,000 staff (3.6%) reduction in 2013. (Cap Gemini June 2014)
• Is the region overbanked? 201 banks in SEE.
• Banks are focusing on cost reduction as RoEs fall – expansion is stopped. Retrench to core markets and core competencies.
• Interest rates will rise in the next few years making the cost of funding more expensive and banks are not always able to pass this on in higher loan rates.
• A decade of under investment due to distractions and costs of the crisis. Back office systems are struggling.
11/24/2015 Chapter 15

Change….
• Customer trust - Libor rigging, illegal FX dealing, PPI miss selling, CEO bonuses. Lack of punishment and penalties. Tax payer bail outs.
• Staff quality deteriorating – experienced bankers retiring or leaving the industry and bright young graduates not interested.
• Millennial generation (18 – 34) do everything on the internet.
• New entrants - have lower barriers to entry
- no branches, no back office operations, no legacy systems diverting attention and resources.
- smart phones and cheap data processing
• Competition with positive brand images – Apple, Google. P2P. Fintechs – flexible systems, lower costs, can operate with narrower margins.
• 1.5bn euros invested by FinTechs in 2014 ($12bn in the US)
11/24/2015 Chapter 16
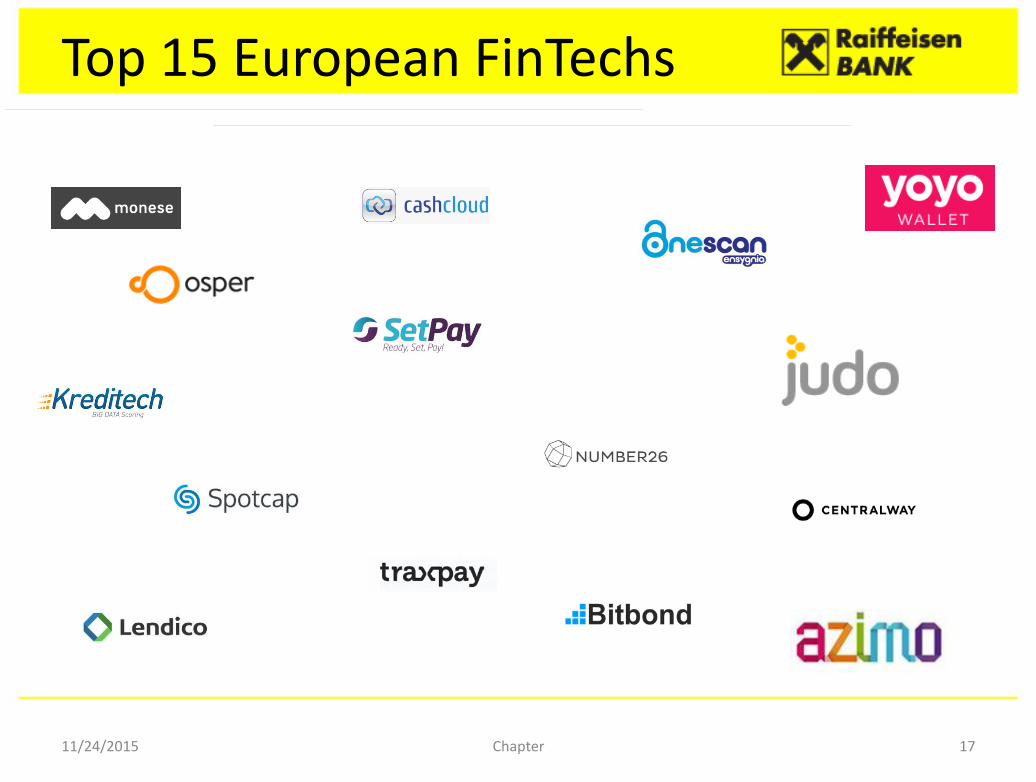
Top 15 European FinTechs
11/24/2015 Chapter 17

It’s not all doom and gloom…
• Traditional banks have brand strength and heritage.
• Regulation will come to the new players.
• New entrants yet to experience an economic downturn.
• Traditional banks still get the salaries – the primary relationship.
• Banks will have the savings relationship as new entrants don’t want the regulatory obligations.
• Loans and investments need to be face to face.
• The banks will respond – compete or cooperate with the new players and specialist suppliers.
• Customer peace of mind with longevity and bricks and mortar.
11/24/2015 Chapter 18
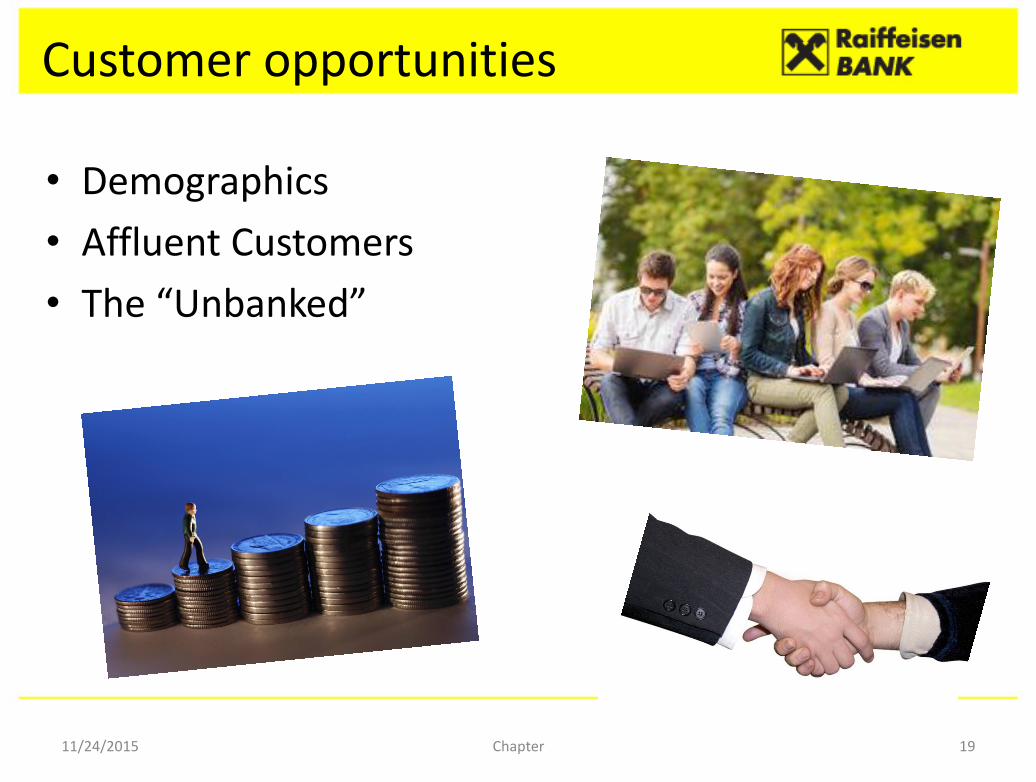
Customer opportunities
• Demographics
• Affluent Customers
• The “Unbanked”
11/24/2015 Chapter 19

Demographics
11/24/2015 Chapter 20

Generation Y
• Born mid 80s to mid 90s
• Deloitte refers to them as ‘catalysts of change’,
• KPMG predicts that they will be “tomorrow’s accumulators of
wealth” and “the generation that banks cannot afford to ignore.”
• Banks will need to use an approach distinctly different from
anything that they have been accustomed to in the past.
• Gen Y use internet and mobile technologies in their daily lives
and demand that these be used for banking as well.
• The use of social media is also key – facebook, Twitter etc.
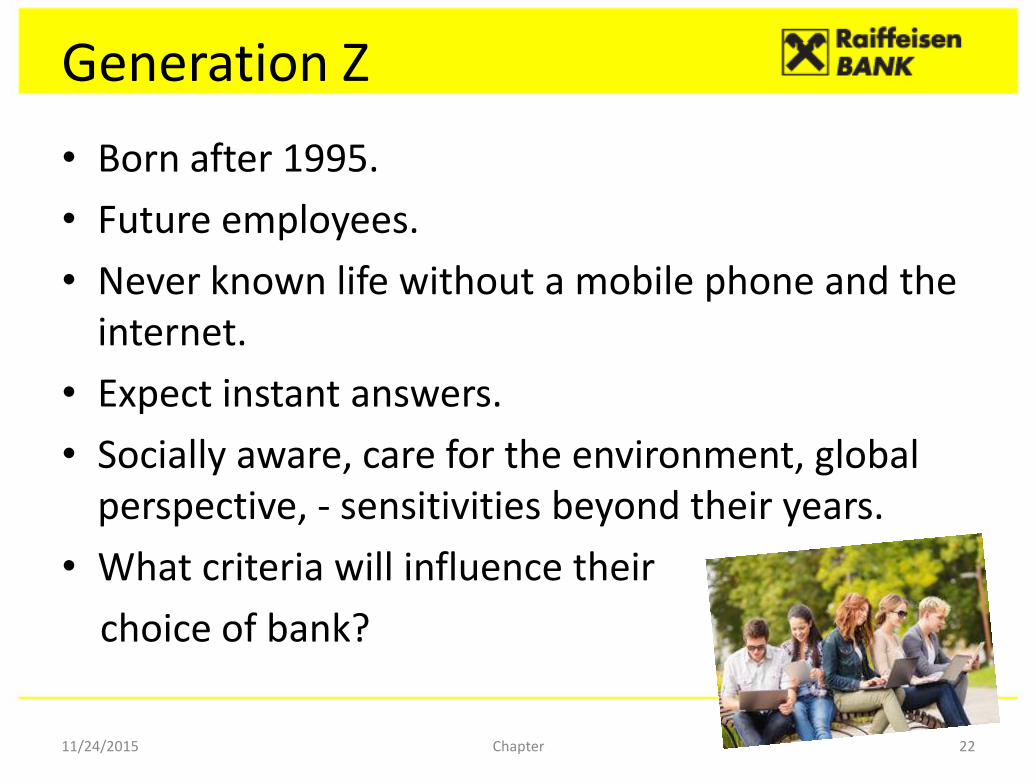
Generation Z
• Born after 1995.
• Future employees.
• Never known life without a mobile phone and the internet.
• Expect instant answers.
• Socially aware, care for the environment, global perspective, - sensitivities beyond their years.
• What criteria will influence their
choice of bank?
11/24/2015 Chapter 22

Affluent Banking
11/24/2015 Chapter 23
• A growth segment in CEE in the next decade
• Expectations of a truly distinctive experience which cannot be branch based.
• Re-invent the proposition – digital, branch minimal
• “Cash rich, time poor”
- they will pay for convenience
- not price sensitive
- multiple product relationship
- recognise and acknowledge the relationship

The Unbanked
• 19m people between the age of 18 and 65 (approximately 18% of the adult population) in CEE do not have a banking relationship. (Standard Chartered 2014)
• Challenge for customers and banks.
• Need to serve profitably and with full Know Your Customer process.
• Banks want electronic banking solutions but
are they accessible for the target
market?
11/24/2015 Chapter 24

In summary….
• The “golden” days of 2003 – 2007 are gone for good. Regulation, supervision, bank management and customer awareness will not permit repetition.
• Through the worst but NPLs still need resources and attention.
• We need to make up for lost time – systems, products, customer experience, reputation.
• Watch out for Fin Techs and new entrants with strong brands and no legacy systems / baggage. If you can’t beat them join them.
• Traditional banks still have a lot of positives.
• New and significant opportunities are out there.
11/24/2015 Chapter 25

11/24/2015 Chapter 26