the australian gold miner - for global investors
TRANSCRIPT

The Australian Gold Miner - For Global Investors
KCGM Site Visit - May 2021

2
Forward Looking Statements, Reserves and ResourcesForward Looking Statements
Northern Star Resources Limited has prepared this announcement based on information available to it. No representation or warranty, express or implied, is made as to the fairness, accuracy, completeness or correctness of the information, opinions and conclusions contained in this announcement. To the maximum extent permitted by law, none of Northern Star Resources Limited, its directors, employees or agents, advisers, nor any other person accepts any liability, including, without limitation, any liability arising from fault or negligence on the part of any of them or any other person, for any loss arising from the use of this announcement or its contents or otherwise arising in connection with it.
This announcement is not an offer, invitation, solicitation or other recommendation with respect to the subscription for, purchase or sale of any security, and neither this announcement nor anything in it shall form the basis of any contract or commitment whatsoever. This announcement may contain forward looking statements that are subject to risk factors associated with gold exploration, mining and production businesses. It is believed that the expectations reflected in these statements are reasonable but they may be affected by a variety of variables and changes in underlying assumptions which could cause actual results or trends to differ materially, including but not limited to price fluctuations, actual demand, currency fluctuations, drilling and production results, Resource or Reserve estimations, loss of market, industry competition, environmental risks, physical risks, legislative, fiscal and regulatory changes, economic and financial market conditions in various countries and regions, political risks, project delay or advancement, approvals and cost estimates.
ASX Listing Rules Disclosures
The information in this announcement that relates to the ore reserves and mineral resources, and production targets of Northern Star has been extracted from the ASX release by Northern Star entitled “Resources, Reserves and Exploration Update” dated 3 May 2021 available at www.nsrltd.com and www.asx.com (Northern Star Announcement).
Northern Star confirms that it is not aware of any new information or data that materially affects the information included in the Northern Star Announcement and, in relation to the estimates of Northern Star's ore reserves and mineral resources, that all material assumptions and technical parameters underpinning the estimates in the Northern Star Announcement continue to apply and have not materially changed. Northern Star confirms that the form and context in which the Competent Person's findings are presented have not been materially modified from that announcement.
*Statements in this ASX Announcement comparing Northern Star’s 31 March 2021 Ore Reserves and Northern Star’s 31 March 2021 Mineral Resources to previously announced Ore Reserves and Mineral Resources, are comparisons to the combined production guidance profile of Northern Star post-merger implementation date of 12 February 2021, as disclosed in the Scheme Booklet issued by Saracen Mineral Holdings Ltd dated 10 December 2020 at sections 7.1 to 7.3. Production is the sum of company guidance and AISC is the weighted average of company guidance. Refer to Northern Star’s ASX Announcement dated 13 August 2020 entitled “Resources and Reserves, Production and Cost Guidance Update (ex KCGM)”, Saracen’s ASX Announcement dated 4 August 2020 entitled “Carosue Dam and Thunderbox only - Reserves rise to 3.7Moz” and joint Northern Star and Saracen ASX Announcement dated 18 August 2020 entitled “KCGM Reserves, Resources and Guidance Update”, available at www.asx.com and www.nsrltd.com.
Rounding is applied in this ASX Announcement for the percentage comparisons and for the 31 March 2021 Ore Reserves and Mineral Resources figures.
All currency conversions in this document were converted at a spot conversion rate of AUD/USD of $0.78.
Authorised to release to the ASX by Bill Beament, Executive Chair.

3
Contents
▪ INTRODUCTION Stuart Tonkin - Chief Executive Officer 1
▪ ASSET OVERVIEW Kous Kirsten - General Manager 5
▪ ESG Dave McCutcheon - HSEC Manager 12
▪ MINE GEOLOGY Emma Murray-Hayden - Geology Manager 15
▪ RESOURCES AND RESERVES Emma Murray-Hayden - Geology Manager 20
▪ OPEN PIT MINING Justin Foster - Open Pit Manager 25
▪ UNDERGROUND MINING Rob Parsons - Underground Manager 32
▪ PROCESSING Greg Sheppard - Processing Manager 38
▪ EXPLORATION Michael Mulroney - Chief Geological Officer 41

4
A business first, mining company secondCore Values

5
ASSET OVERVIEW
6
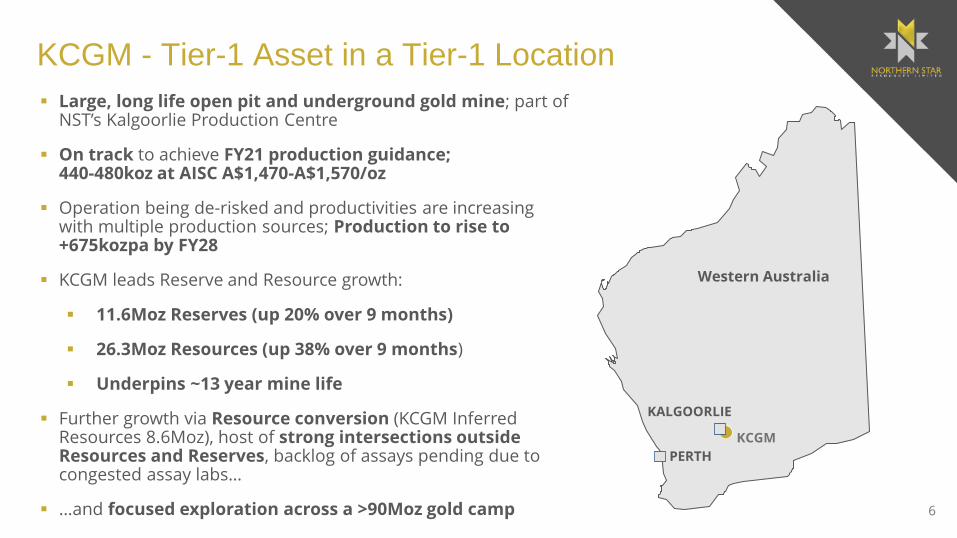
KCGM - Tier-1 Asset in a Tier-1 Location
▪ Large, long life open pit and underground gold mine; part of NST’s Kalgoorlie Production Centre
▪ On track to achieve FY21 production guidance; 440-480koz at AISC A$1,470-A$1,570/oz
▪ Operation being de-risked and productivities are increasing with multiple production sources; Production to rise to +675kozpa by FY28
▪ KCGM leads Reserve and Resource growth:
▪ 11.6Moz Reserves (up 20% over 9 months)
▪ 26.3Moz Resources (up 38% over 9 months)
▪ Underpins ~13 year mine life
▪ Further growth via Resource conversion (KCGM Inferred Resources 8.6Moz), host of strong intersections outside Resources and Reserves, backlog of assays pending due to congested assay labs…
▪ …and focused exploration across a >90Moz gold camp
Western Australia
KALGOORLIE
PERTH
KCGM

7
A dominant player in a Tier-1 Location
▪ KCGM 55% of Group Reserves, 77% of Kalgoorlie production centre
▪ KCGM 47% of Group Resources, 70% of Kalgoorlie production centre
▪ KCGM 30% of Group production FY21 to date, 50% of Kalgoorlie production centre
15.0Moz
4.5Moz
1.5Moz
Kalgoorlie Yandal North America
Reserves by production centre
37.6Moz
10.1Moz
6.9Moz
Kalgoorlie Yandal North America
Resources by production centre Kalgoorlie production centre(excluding Carosue Dam)
8
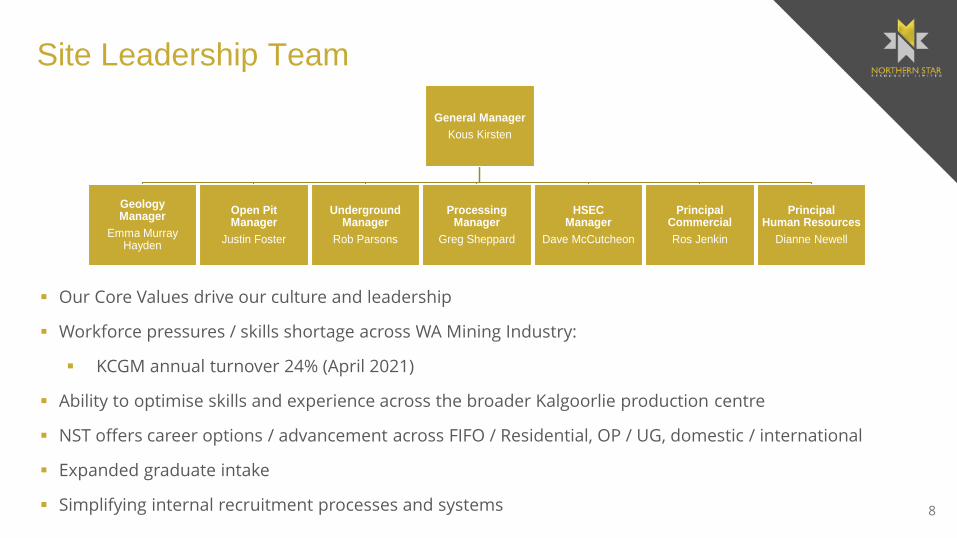
Site Leadership Team
General Manager
Kous Kirsten
Geology Manager
Emma Murray Hayden
Open Pit Manager
Justin Foster
Underground Manager
Rob Parsons
Processing Manager
Greg Sheppard
HSEC Manager
Dave McCutcheon
Principal Commercial
Ros Jenkin
Principal Human Resources
Dianne Newell
▪ Our Core Values drive our culture and leadership
▪ Workforce pressures / skills shortage across WA Mining Industry:
▪ KCGM annual turnover 24% (April 2021)
▪ Ability to optimise skills and experience across the broader Kalgoorlie production centre
▪ NST offers career options / advancement across FIFO / Residential, OP / UG, domestic / international
▪ Expanded graduate intake
▪ Simplifying internal recruitment processes and systems
9
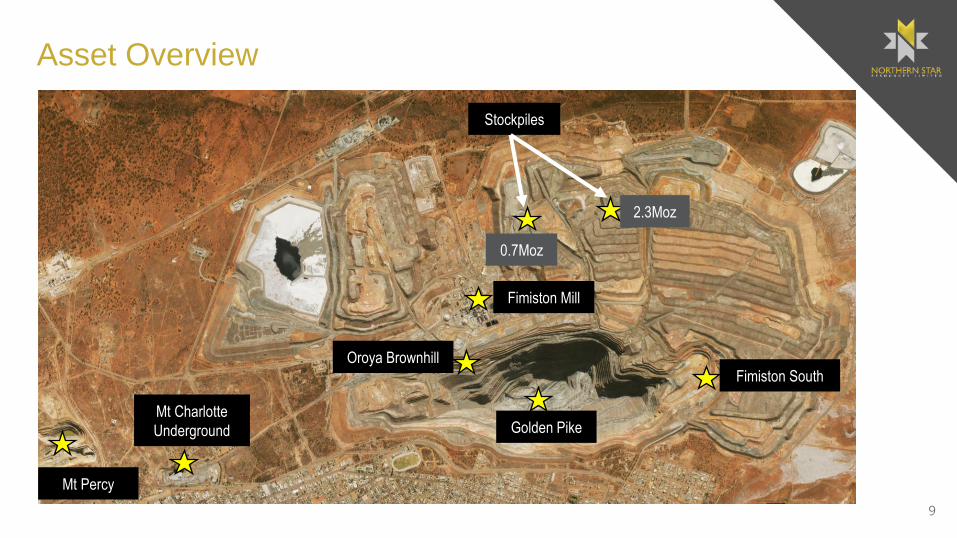
Asset Overview
Fimiston South
Mt Charlotte
Underground
Fimiston Mill
Oroya Brownhill
Golden Pike
Stockpiles
0.7Moz
2.3Moz
Mt Percy

10
Robust plan to deliver profitable growth
▪ Focus on large, low-cost mining areas that maximise fleet productivity
▪ Fimiston South ramp-up (baseload supply, Reserve 5.4Moz)
▪ Increased access to Golden Pike (high grade, low strip ratio, Reserve 1.5Moz)
▪ East wall remediation:
▪ Integrated with the expedited Oroya Brownhill (OBH)
▪ Additional ounces offset remediation cost
▪ Displacing lower grade stockpile feed
▪ Fimiston Underground Resource of 4Moz -A$10M allocated in FY21 to support exploration activities
0
100
200
300
400
500
600
700
800
FY21 FY22 FY23 FY24 FY25 FY26 FY27 FY28
Bottom Mid-point Top
Production (koz)
Production to rise to +675,000ozpa by FY28

11
Long life assetProduction profile
▪ 13-year mine life visibility, 100% in Reserves (11.6Moz at 31 March 2021)
▪ Gross growth capital A$119M for FY21 FYTD (9 months to 31 March 2021)
▪ Multi year capex guidance to be updated and provided at Annual Strategy Day in late July 2021
KCGM Production Profile FY21 FY22 FY23 FY24 FY25 FY26 FY27 FY28 FY29 FY30 FY31 FY32 FY33 FY34
Open Pit
Oroya Brownhill
Fimiston South Stage 1
Golden Pike South
Fimiston South Stage 2
Golden Pike North
Underground
Mount Charlotte
Stockpiles
Marginal
Sub-grade

12
ENVIRONMENT, SOCIAL RESPONSIBILITY & GOVERNANCE
13
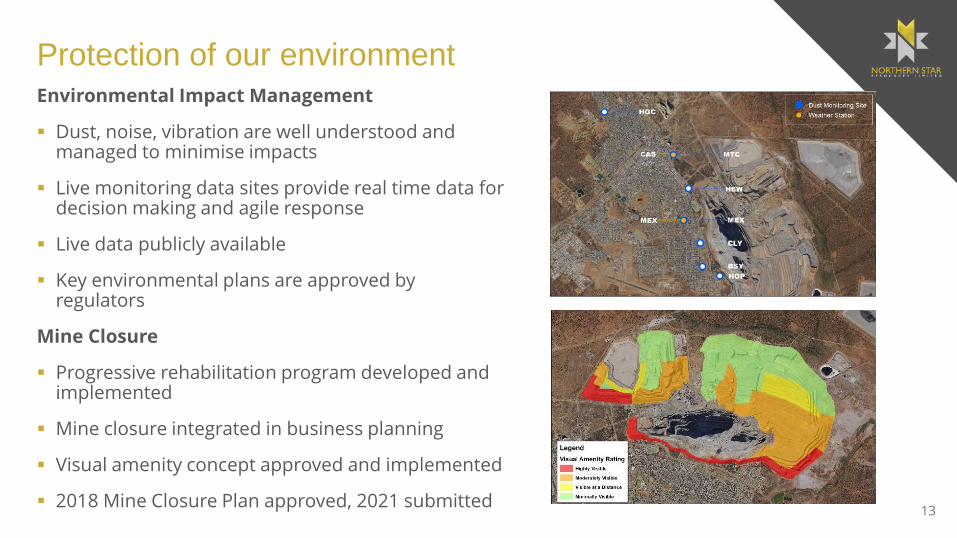
Protection of our environmentEnvironmental Impact Management
▪ Dust, noise, vibration are well understood and managed to minimise impacts
▪ Live monitoring data sites provide real time data for decision making and agile response
▪ Live data publicly available
▪ Key environmental plans are approved by regulators
Mine Closure
▪ Progressive rehabilitation program developed and implemented
▪ Mine closure integrated in business planning
▪ Visual amenity concept approved and implemented
▪ 2018 Mine Closure Plan approved, 2021 submitted

14
Mitigating social risk and creating valueProtect and Grow our Social Licence
▪ “Local Voices” engagement tool that is used to track and trend community perception over time (developed by CSIRO)
▪ Data publicly available
▪ Agile response to emerging community issues and opportunities
▪ Increased trust in KCGM Operations
▪ Strong long-term relationship between KCGM Operations and the community of Kalgoorlie-Boulder
Public information and interaction tools
Trust the Company to act responsibly
Extremely
Not at all
Extremely
Not at all
The Company’s activities will support the region’s future prosperity
“Local Voices is an amazing initiative that shows the community and myself that KCGM is definitely caring/courteous and also mindful of all opinions to the local and land holders of this community” – sourced from recent Local Voices survey

15
MINE GEOLOGY

16
Mine-scale geological overview of KCGM

17
Fimiston growth potential
47,700mN cross section of Fimiston showing mine geology 47,600mN E-W cross section through the Fimiston deposit, with select intersections shown. Note that intersection widths shown are down hole lengths.
▪ Recent drilling at Fimiston South has defined further mineralisation within the current open pit Resource envelope, with a particular focus on the “Saddle” between the East and West lode systems at the southern end
▪ Drilling has successfully defined additional largely unmodelled lodes within the planned mining areas
Significant upside potential both within and outside of current Resources

18
Mount Charlotte
▪ Despite mining continuously since the 1960s, discoveries continue to be made in close proximity to existing workings - strong emphasis on increasing exploration in and around Mt Charlotte operations
▪ Existing development provides a strong platform for future growth - underground infrastructure has been upgraded to provide capacity for additional drill rigs
▪ Committed to drill drive development to enable testing of high quality targets at optimum drill orientations
The gift that keeps on giving

19
RESOURCES AND RESERVES

20
Future underpinned by strong Reserve growth
▪ Investment in drilling unlocks strong increase in Ore Reserves
▪ Fimiston South the key driver, now 5.4Moz (v 3.9Moz 9 months earlier)
▪ Global leading endowment continues to respond well to drilling investment
▪ Outstanding drill results outside current Reserves point to further upside at:
▪ Fimiston South
▪ Fimiston Underground
▪ Mt Percy
▪ Little Wonder
ORE RESERVES as at 31 March 2021
Tonnes Grade Ounces Tonnes Grade Ounces Tonnes Grade Ounces
NST ATTRIBUTABLE RESERVE (000's) (gpt) (000's) (000's) (gpt) (000's) (000's) (gpt) (000's)
JUNDEE GOLD PROJECT
Surface 1,290 1.1 44 998 1.3 43 2,288 1.2 87
Underground 119 1.2 5 14,126 4.0 1,824 14,245 4.0 1,829
Stockpiles 597 1.1 21 - - - 597 1.1 21
Gold in Circuit - - 6 - - - - - 6
Sub-Total Jundee 2,007 1.2 75 15,124 3.8 1,867 17,131 3.5 1,942
BRONZEWING PROJECT
Surface 3,600 2.0 234 11,891 1.5 557 15,491 1.6 791
Underground - - - - - - - - -
Stockpiles - - - - - - - - -
Gold in Circuit - - - - - - - - -
Sub-Total Bronzewing 3,600 2.0 234 11,891 1.5 557 15,491 1.6 791
THUNDERBOX PROJECT
Surface 1,471 1.1 54 19,605 1.5 957 21,076 1.5 1,011
Underground 3,636 1.9 219 7,983 1.9 485 11,619 1.9 704
Stockpiles 1,445 0.8 37 - - - 1,445 0.8 37
Gold in Circuit - - 4 - - - - - 4
Sub-Total Thunderbox 6,552 1.5 314 27,588 1.6 1,442 34,140 1.6 1,756
YANDAL PROJECT 12,159 1.6 622 54,603 2.2 3,866 66,762 2.1 4,489
POGO GOLD PROJECT
Surface - - - - - - - - -
Underground - - - 5,852 7.9 1,491 5,852 7.9 1,491
Stockpiles - - - - - - - - -
Gold in Circuit - - 7 - - - - - 7
Sub-Total Pogo - - 7 5,852 8 1,491 5,852 8 1,498
KCGM
Surface - - - 131,932 1.8 7,697 131,932 1.8 7,697
Underground 106 2.1 7 13,561 2.1 912 13,667 2.1 919
Stockpiles 124,669 0.7 2,941 - - - 124,669 0.7 2,941
Gold in Circuit - - 29 - - - - - 29
Sub-Total KCGM 125,272 0.7 3,000 145,493 1.8 8,609 270,766 1.3 11,609
KANOWNA GOLD PROJECT
Surface 4 2.1 0 830 2.6 69 834 2.6 69
Underground 2,131 3.0 206 4,265 2.6 353 6,396 2.7 559
Stockpiles 147 2.1 10 - - - 147 2.1 10
Gold in Circuit - - 7 - - - - - 7
Sub-Total Kanowna 2,282 3.0 223 5,095 2.6 422 7,377 2.7 645
KUNDANA GOLD PROJECT
Surface - - - - - - - - -
Underground 147 5.1 24 1,336 4.3 184 1,483 4.4 208
Stockpiles 49 3.1 5 - - - 49 3.1 5
Gold in Circuit - - 1 - - - - - 1
Sub-Total Kundana Gold 195 4.8 30 1,336 4.3 184 1,531 4.4 214
EAST KUNDANA JOINT VENTURE
Surface - - - 124 3.9 16 124 3.9 16
Underground 607 4.9 96 949 5.5 169 1,555 5.3 265
Stockpiles RHP 43 3.0 4 - - - 43 3.0 4
Stockpiles Raleigh 0 1.7 0 - - - 0 1.7 0
Stockpiles GEM (100%) 5 3.9 1 - - - 5 3.9 1
Gold in Circuit - - - - - - - - -
Sub-Total East Kundana JV 656 4.8 101 1,073 5.4 185 1,729 5.1 286
SKO GOLD PROJECT
Surface - - - - - - - - -
Underground 177 4.0 23 2,254 3.4 248 2,431 3.5 270
Stockpiles 38 3.1 4 - - - 38 3.6 4
Gold in Circuit - - 1 - - - - - 1
Sub-Total SKO 215 4.0 28 2,254 3.4 248 2,469 3.5 276
CAROSUE DAM PROJECT
Surface 1,323 1.3 56 15,948 1.4 734 17,271 1.4 790
Underground - - - 10,782 3.0 1,023 10,782 3.0 1,023
Stockpiles 734 1.5 34 - - - 734 1.5 34
Gold in Circuit - - 7 - - - - - 7
Sub-Total Carosue Dam 2,056 1.5 97 26,731 2.0 1,757 28,787 2.0 1,855
CARBINE PROJECT
Surface - - - 1,241 2.0 78 1,241 2.0 78
Underground - - - - - - - - -
Stockpiles - - - - - - - - -
Sub-Total Carbine - - - 1,241 2.0 78 1,241 2.0 78
TOTAL KALGOORLIE 130,676 1 3,479 183,222 2 11,484 313,899 1 14,963
PAULSENS PROJECT
Surface - - - - - - - - -
Underground 186 5.1 31 84 4.0 11 269 4.8 41
Stockpiles 11 1.6 1 - - - 11 1.6 1
Gold in Circuit - - - - - - - - -
Sub-Total Paulsens 197 4.9 31 84 4.0 11 281 4.6 42
ASHBURTON PROJECT
Surface - - - - - - - - -
Stockpiles - - - - - - - - -
Sub-Total Ashburton - - - - - - - - -
CENTRAL TANAMI PROJECT JV
Underground - - - - - - - - -
Stockpiles - - - - - - - - -
Sub-Total Central Tanami JV - - - - - - - - -
WESTERN TANAMI PROJECT
Underground - - - - - - - - -
Stockpiles - - - - - - - - -
Sub-Total Western Tanami - - - - - - - - -
NORTHERN STAR TOTAL 143,033 0.9 4 ,139 243,761 2.2 16,852 386,794 1.7 20,992
Note:
2. Ore Reserves are reported at various gold price guidelines :a. A$1,750/oz Au - All Australian assets except Bronzewing; b. AUD $1,850 /oz Au - Bronzewing; US$1,350/oz Au - USA assets.
2. Rounding may result in apparent summation differences between tonnes, grade and contained metal content.
3. Ounces are estimates of metal contained in the Ore Reserve and do not include allowances for processing losses.
4. Numbers are 100 % NST attributable.
Competent Persons:
1. Jeff Brown
2. Stephen King
PROVED PROBABLE TOTAL RESERVE
0
2
4
6
8
10
12
14
CY13 CY14 CY15 CY16 CY17 CY18 CY19 FY20 FY21
Moz
Ore Reserves (Moz)
11.6Moz Reserves at 31 March 2021 (v 9.7Moz 30 June 2020)

21
▪ 32% more gold at KCGM; Mined tonnes and ounces have outperformed forecasts for the 9 months ended 31 March 2021
▪ Key driver = Previously unmodelled linking structures between the major Fimiston Resource lodes
▪ Long term benefits include reduced depletion of the ~1.0g/t stockpile while growing the large ~0.7g/t “sub-grade” stockpile
Geology model surprises on the upside
Fimiston Open Pit Mining Reconciliation (9 months ended 31 March 2021)
Fimiston Linking Structures (black)
Free gold
Decre
asin
g lin
kin
g s
tructu
res
-D
rill
density d
riven

22
ORE RESERVESAs at 31 March 2021
Tonnes Grade Ounces
('000t) (gpt) ('000 ozs)
KCGM
Surface
Brown Hill 17,170 1.4 754 44
Golden Pike 22,779 2.0 1,465 (24)
Fimiston South 90,643 1.8 5,389 1,460
Morrison 1,341 2.1 89 89
Subtotal - Surface 131,932 1.8 7,697 1,570
Underground
Mount Charlotte 13,667 2.1 919 407
Subtotal - Underground 13,667 2.1 919 407
Stockpiles - Mt Charlotte 35 1.5 2 2
Stockpiles - Fimiston 267 1.6 14 14
Stockpiles - Crushed Ore 196 1.1 7 7
Stockpiles - Marginal 19,637 1.0 652 (169)
Stockpiles - Sub-Grade 105,032 0.7 2,289 60
Gold in Circuit - - 29 29
Sub-Total KCGM 270,766 1.3 11,609 1,919
TOTAL RESERVES9 month Δ
Ounces
Future underpinned by strong Reserve growth

23
0
5
10
15
20
25
30
CY13 CY14 CY15 CY16 CY17 CY18 CY19 FY20 FY21
Moz▪ Significant growth at Fimiston South
through an extensive drill program
▪ Fimiston underground Resources of 4.0Moz highlights ongoing growth opportunity
▪ Size increase in Resource at Mt Charlotte underground to 2.5Moz
▪ Future Mineral Resource growth potential across a plethora of projects within trucking distance of the mill
MINERAL RESOURCES as at 31 March 2021
Tonnes Grade Ounces Tonnes Grade Ounces Tonnes Grade Ounces Tonnes Grade Ounces
NST ATTRIBUTABLE INCLUSIVE OF RESERVE (000's) (gpt) (000's) (000's) (gpt) (000's) (000's) (gpt) (000's) (000's) (gpt) (000's)
JUNDEE GOLD PROJECT
Surface 1,290 1.1 44 5,441 1.3 234 3,489 1.2 131 10,220 1.2 409
Underground 119 1.2 5 39,046 3.2 3,963 12,469 2.6 1,025 51,634 3.0 4,992
Stockpiles 597 1.3 21 - - - - - - 597 1.3 21
Gold in Circuit - - 6 - - - - - - - - 6
Sub-Total Jundee 2,007 1.2 75 44,488 2.9 4,197 15,957 2.3 1,156 62,452 2.7 5,428
BRONZEWING PROJECT
Surface 2,800 2.6 237 17,116 1.9 1,045 5,310 1.5 263 25,226 1.9 1,545
Underground - - - - - - - - - - - -
Sub-Total Bronzewing 2,800 2.6 237 17,116 1.9 1,045 5,310 1.5 263 25,226 1.9 1,545
THUNDERBOX
Surface 1,795 1.3 77 28,104 1.7 1,538 2,752 1.6 140 32,651 1.7 1,755
Underground 5,503 2.1 365 11,606 2.1 802 2,381 2.4 180 19,490 2.2 1,347
Stockpiles 1,664 1.4 41 - - - - - - 1,664 1.4 41
Gold in Circuit - - 4 - - - - - - - - 4
Sub-Total Thunderbox 8,961 1.7 483 39,710 1.8 2,340 5,133 1.9 321 53,805 1.8 3,144
CONSOLIDATED YANDAL PROJECT 13,769 1.8 799 101,314 2.3 7,582 26,401 2.1 1,740 141,483 2.2 10,121
POGO PROJECT
Surface - - - - - - 354 12.0 136 354 12.0 136
Underground - - - 12,864 9.5 3,949 9,679 9.0 2,814 22,543 9.3 6,764
Stockpiles - - - - - - - - - - - -
Gold in Circuit - - 7 - - - - - - - - 7
Sub-Total Pogo - - 7 12,864 9.5 3,949 10,033 9.1 2,951 22,897 9.4 6,907
KCGM
Surface - - - 206,004 1.8 12,110 103,458 1.4 4,715 309,462 1.7 16,825
Underground - - - 40,757 2.0 2,603 51,316 2.4 3,878 92,073 2.2 6,481
Stockpiles 124,669 0.7 2,964 - - - - - - 124,669 0.7 2,941
Gold in Circuit - - 29 - - - - - - - - 29
Sub-Total KCGM 125,166 0.7 2,993 246,762 1.9 14,713 154,774 1.7 8,593 526,702 1.6 26,299
KANOWNA GOLD PROJECT
Surface 1 1.4 0 1,065 2.5 86 3,756 1.5 176 4,823 1.7 262
Underground 3,424 3.1 344 13,106 2.7 1,118 8,459 2.7 725 24,989 2.7 2,186
Stockpiles 147 2.1 10 - - - - - - 147 2.1 10
Gold in Circuit - - 7 - - - - - - - - 7
Sub-Total Kanowna 3,572 3.1 360 14,171 2.6 1,204 12,216 2.3 901 29,958 2.6 2,464
KUNDANA GOLD PROJECT
Surface - - - - - - - - - - - -
Underground 541 4.2 73 4,074 4.4 571 3,267 3.8 403 7,882 4.1 1,047
Stockpiles 49 3.3 5 - - - - - - 49 3.1 5
Gold in Circuit - - 1 - - - - - - - - 1
Sub-Total Kundana Gold 590 4.2 80 4,074 4.4 571 3,267 3.8 403 7,931 4.1 1,053
EAST KUNDANA JOINT VENTURE
Surface 1 9.3 0 125 5.3 21 26 3.7 3 153 5.1 25
Underground 1,071 6.3 218 2,751 5.2 464 2,032 4.5 292 5,854 5.2 974
Stockpiles RHP 43 3.0 4 - - - - - - 43 3.0 4
Stockpiles Raleigh 0 1.7 0 - - - - - - 0 1.7 0
Stockpiles GEM (100%) 5 3.9 1 - - - - - - 5 3.9 1
Gold in Circuit - - - - - - - - - - - -
Sub-Total East Kundana JV 1,121 6.2 223 2,876 5.2 485 2,058 4.5 295 6,056 5.2 1,003
SKO GOLD PROJECT
Surface - - - - - - - - - - - -
Underground 1,932 2.8 174 11,681 2.9 1,085 9,148 2.9 860 22,761 2.9 2,119
Stockpiles - - - - - - - - - - - -
Jubilee ROM stocks 38 3.6 4 - - - - - - 38 3.6 4
Gold in Circuit - - 1 - - - - - - - - 1
Sub-Total SKO 1,970 2.8 180 11,681 2.9 1,085 9,148 2.9 860 22,799 2.9 2,125
CAROSUE DAM GOLD PROJECT
Surface 3,123 1.5 149 24,270 1.6 1,278 9,670 1.4 429 37,062 1.6 1,856
Underground 6,522 2.9 602 13,968 2.6 1,184 6,583 2.9 546 27,074 2.8 2,332
Stockpiles 3,212 2.0 81 - - - - - - 3,212 2.0 81
Gold in Circuit - - 7 - - - - - - - - 7
Sub-Total Carosue Dam 12,857 2.0 838 38,238 2.0 2,463 16,253 2.0 975 67,348 2.0 4,275
CARBINE PROJECT
Surface - - - 2,136 1.8 123 537 1.5 26 2,673 1.7 149
Underground - - - 753 3.7 90 1,334 3.4 148 2,087 3.5 238
Sub-Total Carbine - - - 2,889 2.3 213 1,871 2.9 174 4,760 2.5 387
CONSOLIDATED KALGOORLIE PROJECT 145,276 1.0 4,673 320,691 2.0 20,733 199,587 1.9 12,201 665,553 1.8 37,606
PAULSENS PROJECT
Surface - - - 129 3.1 13 1,766 1.9 106 1,895 2.0 119
Underground 341 5.8 64 88 5.6 16 43 6.6 9 473 5.8 89
Stockpiles 11 1.6 1 - - - - - - 11 1.6 1
Gold in Circuit - - 0 - - - - - - - - 0
Sub-Total Paulsens 353 5.7 65 217 4.1 29 1,809 2.0 115 2,379 2.7 209
ASHBURTON PROJECT
Surface - - - 98 1.6 5 444 1.2 17 542 1.3 22
Stockpiles - - - - - - - - - - - -
Sub-Total Ashburton - - - 98 1.6 5 444 1.2 17 542 1.3 22
CENTRAL TANAMI PROJECT JV
Surface/Underground 2,502 2.9 232 4,430 2.8 400 4,842 2.9 453 11,774 2.9 1,085
Stockpiles 560 0.7 13 - - - - - - 560 0.7 13
Sub-Total Central Tanami JV 3,062 2.5 245 4,430 2.8 400 4,842 2.9 453 12,334 2.8 1,097
WESTERN TANAMI PROJECT
Surface/Underground 107 7.8 27 1,079 6.0 208 1,449 5.8 271 2,635 6.0 506
Stockpiles 375 1.4 17 - - - - - - 375 1.4 17
Sub-Total Western Tanami 482 2.8 44 1,079 6.0 208 1,449 5.8 271 3,010 5.4 523
NORTHERN STAR TOTAL 162,941 1.1 5,832 440,693 2.3 32,907 244,565 2.3 17,748 848,199 2.1 56,486
Note:
1. Mineral Resources are inclusive of Ore Reserves.
2. Mineral Resources are reported at various gold price guidelines :a. A$2,250/oz Au - All Australian assets except Ashburton; b. AUD $1,850 /oz Au - Ashburton; US$1,500/oz Au - USA assets.
2. Rounding may result in apparent summation differences between tonnes, grade and contained metal content.
3. Numbers are 100 % NST attributable.
Competent Persons:
1. Michael Mulroney
2. Daniel Howe
MEASURED INDICATED INFERRED TOTAL RESOURCES
Mineral Resources (Moz)
26Moz Resources at 31 March 2021 (v 19Moz at 30 June 2020)
Future underpinned by strong Resource growth

24
MINERAL RESOURCES As at 31 March 2021
Tonnes Grade Ounces
(000's) (gpt) (000's)
KCGMSurface
Mt Percy 8,091 1.2 317 317
Croesus 10,534 1.7 588 215
Oroya Brownhill 30,332 1.4 1,324 408
Golden Pike 100,173 1.8 5,786 1,231
Fimiston South 160,331 1.7 8,811 2,707
Subtotal - Surface 309,462 1.7 16,825 4,878
Underground
Fimiston 49,755 2.5 3,986 1,747
Mount Charlotte 42,318 1.8 2,495 630
Subtotal - Underground 92,073 2.2 6,481 2,377
Stockpiles - Mt Charlotte 35 1.5 2 2
Stockpiles - Fimiston 267 1.6 14 14
Stockpiles - Crushed Ore 196 1.1 7 7
Stockpiles - Marginal 19,637 1.0 652 (169)
Stockpiles - Sub-Grade 105,032 0.7 2,289 60
Gold in Circuit - - 29 29
Sub-Total KGM 526,702 1.6 26,299 7,197
TOTAL RESOURCES9 month Δ
Ounces
Future underpinned by strong Resource growth

25
OPEN PIT MINING

26
Open Pit Mining
▪ Mining areas doubling from two to four:
▪ Golden Pike South - Underway
▪ Morrison (Fimiston South starter) -Underway
▪ OBH - Underway
▪ Fimiston South - Underway
Open pit make-over
KCGM Production Profile FY21 FY22 FY23 FY24 FY25 FY26 FY27 FY28 FY29 FY30 FY31 FY32 FY33 FY34
Open Pit
Oroya Brownhill
Fimiston South Stage 1
Golden Pike South
Fimiston South Stage 2
Golden Pike North

27
Open Pit Mining
▪ Targeting total material movements of 70-100Mtpa in line with historical volumes:
▪ Early wins - Total material mined increased by >200% in 12 months
▪ April total material mined >6Mt
▪ Mining cost down 45% in 12 months
▪ April mining cost <A$3/t
▪ Using the same large face shovels and trucks
▪ Fleet renewal underway, improving productivity
▪ Between three and four cutbacks are available at any given time
Open Pit Total Material Mined (Mt)
0
10
20
30
40
50
60
70
80
CY10 CY11 CY12 CY13 CY14 CY15 CY16 CY17 CY18 CY19 FY21F FY22F
Mt
Outstanding productivity gains

28
Open Pit Mining
▪ 2 x Komatsu PC8000 Shovels - 1 completed, second by March 2022
▪ 34 x Caterpillar 793F Dump trucks - September 2021 to April 2022
▪ 3 x Caterpillar D10T dozers - 2 completed, third by end of 2021
▪ 2 x Caterpillar 18 Graders - End of 2021
▪ 1 x Caterpillar 994K Loader - End of 2021
Fleet renewal underway

29
Open Pit Mining - Fimiston South
▪ Two stages, Stage 1 underway
▪ 12 year mine life
▪ 10:1 average strip ratio
▪ 850Mt total material movement
▪ Project economics get better every day:
▪ Strip ratio declines
▪ Grade increases
▪ Market update at Annual Strategy Day late July 2021
Super Pit Cutbacks
KCGM’s largest cutback in a decade

30
Open Pit Mining - Golden Pike
▪ High grades - Reserves 23Mt @ 2.0g/t for 1.5Moz
▪ Low strip ratio of 1.6:1
▪ Waste pre-stripping completed in the preceding ~10 years by former owners
▪ Mining continues at the Golden Pike South cutback
▪ The Golden Pike North cutback will commence in FY24, once the East Wall remediation work is completed under the new Oroya Brownhill plan
▪ Opportunities to fast-track mining will be assessed…
▪ …but not at the detriment of quality ore mining
Golden Pike Cutback
Priority mining front

31
Open Pit Mining - Oroya Brownhill (OBH)
▪ Mining underway, eight years of mining planned in two stages
▪ Average strip ratio 6.2:1 (including pre-strip)
▪ Average grade 1.4g/t
▪ On track to achieve remediation timeframe ~3.5 years (from October 2020)
▪ East wall remediation integrated with the Brownhill cutback - Additional ounces offset remediation cost
▪ Plan is based on rigorous geotechnical investigation
OBH cutback looking south
East wall remediation on track

32
UNDERGROUND MINING

33
Underground Mining - Mount Charlotte
▪ Historic production of >5.5Moz at an average grade of 3.6g/t
▪ Resources of 42Mt @1.8g/t for 2.5Moz v 1.9Moz 9 months earlier
▪ Reserves of 14Mt @ 2.1g/t for 0.9Moz v 0.4Moz 9 months earlier
▪ Significant progress has been made in upgrading infrastructure including:
▪ Power
▪ Ventilation
▪ Pumping
▪ Ground support in the decline
Mt Charlotte Section
The gift that keeps on giving

34
Underground Mining - Mount Charlotte
Underground Ore Mined (Mt)▪ Strong increases in underground
productivities - April 2021 production >115kt ore
▪ This follows several productivity-focused initiatives including:
▪ Opening new mining fronts
▪ Operating under Northern Star Mining Services
▪ Ore mined from Mt Charlotte is planned to hit 1.5Mt in FY21…
▪ …substantially higher than prior years
Outstanding productivity gains
0
0.2
0.4
0.6
0.8
1
1.2
1.4
1.6
CY10 CY11 CY12 CY13 CY14 CY15 CY16 CY17 CY18 CY19 FY21FFY22F
Mt
35
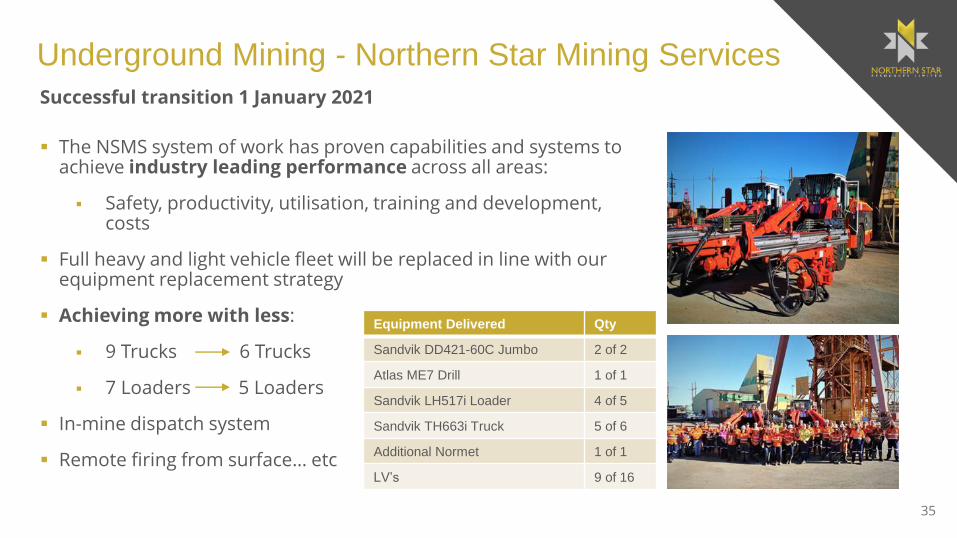
Underground Mining - Northern Star Mining Services
▪ The NSMS system of work has proven capabilities and systems to achieve industry leading performance across all areas:
▪ Safety, productivity, utilisation, training and development, costs
▪ Full heavy and light vehicle fleet will be replaced in line with our equipment replacement strategy
▪ Achieving more with less:
▪ 9 Trucks 6 Trucks
▪ 7 Loaders 5 Loaders
▪ In-mine dispatch system
▪ Remote firing from surface… etc
Successful transition 1 January 2021
Equipment Delivered Qty
Sandvik DD421-60C Jumbo 2 of 2
Atlas ME7 Drill 1 of 1
Sandvik LH517i Loader 4 of 5
Sandvik TH663i Truck 5 of 6
Additional Normet 1 of 1
LV’s 9 of 16

36
Underground Mining - Fimiston
▪ World-class Fimiston deposit has produced >65Moz at a mined grade of 5.0g/t since 1893
▪ Historic underground workings extend to ~1,400m below surface
▪ Historic drilling intersects mineralisation at depths of >2km
▪ Underground Resource 50Mt @ 2.5 g/t for 4.0Moz v 2.2Moz 9 months earlier
Fimiston Underground long section
Sleeping giant

37
Underground Mining - New Portal
▪ Re-establish underground access beneath the open pit
▪ Provide drill platforms to infill and extend the current Resource
New portal successfully cut

38
PROCESSING

39
Processing Overview
▪ Processing primarily sulphides ore
▪ Crush, grind, flotation and CIL
▪ The majority of flotation concentrate is processed through ultra fine grinding (UFG) followed by CIL at Gidji.
13Mtpa capacity

40
Processing OverviewKey focus:
▪ District milling optimisation commenced with Mt Charlotte ore treated at Kanowna Belle
▪ March quarter included one-off planned 14 day mill shutdown to modernise the control systems
▪ Overall Kalgoorlie hub milling solution is under review… stay tuned for the Annual Strategy Day in late July 2021
Summary March Q (3mths) FYTD (9mths)
Throughput 2.8Mt 9.4Mt
Head Grade 1.4g/t 1.3g/t
Recovery 86% 84%
Gold Recovered 111koz 341koz

41
EXPLORATION

42
Exploration and Growth
▪ Multiple opportunities within trucking distance of the Fimiston mill
▪ Mt Percy - Maiden Resource 8.1Mt @ 1.2g/t for 317koz - Near surface growth potential, ongoing drilling
▪ Little Wonder - Large shallow stockwork just 500m in the footwall of Mt Charlotte underground mine, outcrops at surface, recent drilling included an outstanding 182m @ 2.3g/t
▪ Croesus - Resource 10.5Mt @ 1.7g/t for 588koz, adjacent to Sam Pearce decline, drilling later this year
▪ Jack’s Reward - Regional prospect extending over 1km, recent drilling results include 72.0m @ 1.0g/t and 15.9m @ 3.2g/t
“Golden Mile” extended

43
Exploration and Growth
World Class Growth Potential
▪ 297km2 of tenure, hosting +30km of the Boulder-Lefroy structural corridor
▪ Limited focus on regional exploration potential on KCGM tenure over the past 20 years (opportunity)
▪ Strong progress made on key growth opportunities since new ownership
FIMISTON
UNDERGROUND
Mineralisation not extracted by previous underground mining. This includes
parallel structures, high grade pillars and fill materials around historic workings,
in addition to unmined lodes beneath the historic workings
FIMISTON
SOUTH
Open pit and underground potential on the south-eastern part of the open pit. JORC-compliant Mineral Resource open pit now 9Moz; underground Mineral Resource 4Moz
MT CHARLOTTE
AREA
Mt Charlotte area underground potential, including extensions to Mt Charlotte main orebody, Hidden Secret, Mt Ferrum and Kalgoorlie East Lodes
STOCKWORKSCharlotte-style stockwork mineralisation in Golden Mile Dolerite throughout the Golden Mile (e.g., Golden Pike Stockwork, Central Corridor, Mt Percy)
REGIONAL
EXPLORATION
Advancement of early to intermediate stage exploration projects, including Mt Percy, Central Corridor and Hannan’s South etc.

44
Near Mine Exploration Potential
Mature world class system, however, drill data is surprisingly sparse at depth
~4,500oz per vertical
metre average mined
to date
~44,000oz per vertical
metre average mined
to date

45
Exploration - Mt Percy
▪ Located 4km north of the Fimiston processing plant and less than 1km north of Little Wonder
▪ Multiple mineralisation styles
▪ Drilling has targeted bulk potential of the stockwork mineralisation

46
Exploration - Little Wonder
▪ Emerging area sitting only 500m in the footwall of the analogous Mt Charlotte mine
▪ Large body of shallow stockwork mineralisation
▪ Outcrops at surface
▪ 182.4m @ 2.3g/t less than 300m from surface

47
Exploration - Jack’s Reward
▪ Regional prospect located 5km south of the Fimiston mill
▪ Drilling has identified strong Mt Charlotte style veining
▪ Moderate to strong sericite, ankerite and pyrite alteration associated with quartz veining

48
Exploration - Hannan’s South and Shae▪ RC drill testing two targets:
▪ The supergene and hypogene mineralisation along strike / plunge of the Hannan’s South open pit
▪ Stockwork veined porphyry intrusions at Shae
▪ Early outcomes:
▪ Abundant sulphides and epidote alteration intersected at Hannan’s South
▪ Sulphides, sericite and fuchsite alteration at Shea
N
Hannan’s South
Shea
Jack’s Reward
Super Pit

49
KCGM Project Pipeline
▪ Strong pipeline of quality targets across all project stages
▪ A$12M committed in FY21 to test early-stage projects

50
Northern Star Resources LimitedASX Code: NST
The Australian gold miner – for global investors
Investor Enquiries:
Troy Irvin
Level 1, 388 Hay Street, Subiaco 6008 Western Australia
T: +61 8 6188 2100
W: www.nsrltd.com