an australian gold miner for global investors · an australian gold miner –for global investors...
TRANSCRIPT

An Australian gold miner – for global investorsMacquarie Securities Conference May 2017
Disclaimer
Competent Persons Statements
The information in this announcement that relates to mineral resource estimations, exploration results, data quality and geological interpretations for the Company’s Paulsens and Jundee Project areas is based on information compiled by Brook Ekers, a
Competent Person who is a Member of the Australian Institute of Geoscientists and a full-time employee of Northern Star Resources Limited. Mr Ekers has sufficient experience that is relevant to the style of mineralisation and type of deposit under
consideration and to the activity being undertaken to qualify as a Competent Person as defined in the 2012 Edition of the "Australasian Code for Reporting of Exploration Results, Mineral Resources and Ore Reserves" for the Group reporting. Mr Ekers
consents to the inclusion in this announcement of the matters based on this information in the form and context in which it appears.
The information in this announcement that relates to mineral resource estimations, exploration results, data quality and geological interpretations for the Company’s Kanowna, EKJV, Kundana and Carbine Project areas is based on information compiled
by Nicholas Jolly, a Competent Person who is a Member of the Australasian Institute of Mining and Metallurgy and a full-time employee of Northern Star Resources Limited. Mr Jolly has sufficient experience that is relevant to the style of mineralisation
and type of deposit under consideration and to the activity being undertaken to qualify as a Competent Person as defined in the 2012 Edition of the "Australasian Code for Reporting of Exploration Results, Mineral Resources and Ore Reserves". Mr Jolly
consents to the inclusion in this announcement of the matters based on this information in the form and context in which it appears.
Forward Looking Statements
Northern Star Resources Limited has prepared this announcement based on information available to it. No representation or warranty, express or implied, is made as to the fairness, accuracy, completeness or correctness of the information, opinions
and conclusions contained in this announcement. To the maximum extent permitted by law, none of Northern Star Resources Limited, its directors, employees or agents, advisers, nor any other person accepts any liability, including, without limitation,
any liability arising from fault or negligence on the part of any of them or any other person, for any loss arising from the use of this announcement or its contents or otherwise arising in connection with it.
This announcement is not an offer, invitation, solicitation or other recommendation with respect to the subscription for, purchase or sale of any security, and neither this announcement nor anything in it shall form the basis of any contract or commitment
whatsoever. This announcement may contain forward looking statements that are subject to risk factors associated with gold exploration, mining and production businesses. It is believed that the expectations reflected in these statements are reasonable
but they may be affected by a variety of variables and changes in underlying assumptions which could cause actual results or trends to differ materially, including but not limited to price fluctuations, actual demand, currency fluctuations, drilling and
production results, Reserve estimations, loss of market, industry competition, environmental risks, physical risks, legislative, fiscal and regulatory changes, economic and financial market conditions in various countries and regions, political risks, project
delay or advancement, approvals and cost estimates.
All currency conversions in this presentation have been converted at a currency of AUD/USD conversion rate of A$0.75.
(1) EBITDA is earnings before interest depreciation, amortisation and impairment and is calculated as follows: Profit before Income tax plus depreciation, amortisation, impairment and finance costs less interest income.
(2) Free Cash Flow is calculated as operating cash flow minus investing cash flow.
(3) Underlying Free Cash Flow is calculated as follows: 31 Dec 2016 - free cash flow ($12.8 million) plus bullion awaiting settlement ($10.6 million), plus stamp duty paid on prior acquisitions ($1.7 million), plus investments in Available for sale assets ($0.8 million), plus FY2016 tax ($33.6
million), less working capital adjustment ($3.4 million). 31 Dec 2015 - free cash flow ($66.4 million) plus bullion awaiting settlement ($9 million), plus acquisition and exploration of Central Tanami Project ($17.3 million), plus stamp duty paid on prior period acquisitions ($5.0 million), less
working capital adjustment ($1.0 million).
EBITDA, Underlying Free Cash Flow and All-in Sustaining Costs (AISC) are unaudited non IFRS measures.
* All Data from Bloomberg referenced sources has had all N.A. and erroneous data points removed in the associated sector comparisons and all GDX data point comparisons have had streaming company data removed for a better reflection of the producing companies within the indices
2
Introduction – Globally Relevant Gold Miner with Tier 1 Assets
Jundee Operations+7Moz Gold Camp
Paulsens Operations+3Moz Gold Camp
Kalgoorlie Operations+12Moz Gold Camp
Central Tanami Project+5Moz Gold Camp
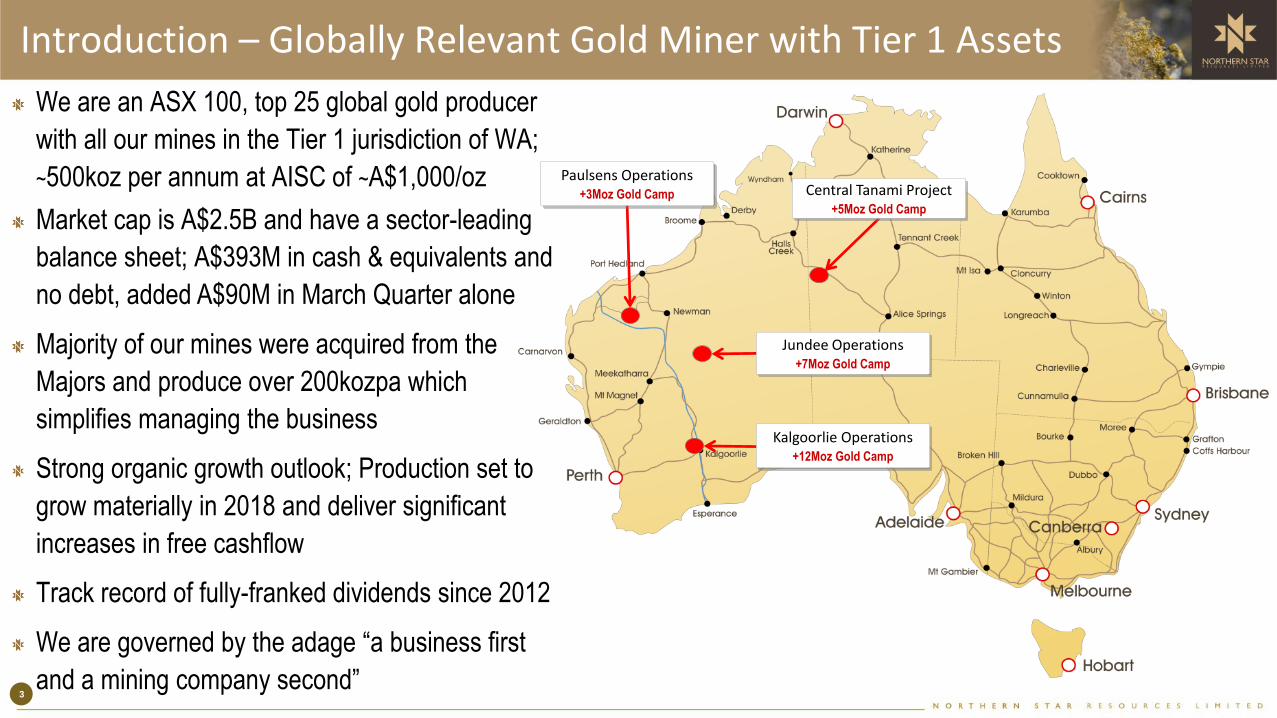
We are an ASX 100, top 25 global gold producer
with all our mines in the Tier 1 jurisdiction of WA;
~500koz per annum at AISC of ~A$1,000/oz
Market cap is A$2.5B and have a sector-leading
balance sheet; A$393M in cash & equivalents and
no debt, added A$90M in March Quarter alone
Majority of our mines were acquired from the
Majors and produce over 200kozpa which
simplifies managing the business
Strong organic growth outlook; Production set to
grow materially in 2018 and deliver significant
increases in free cashflow
Track record of fully-franked dividends since 2012
We are governed by the adage “a business first
and a mining company second”3

$25.4
$62.3
$148.3$165.6
$180.6
$216.4 $218.8
50
100
150
200
250
1H14 2H14 1H15 2H15 1H16 2H16 1H17
A$
(m
)
EBITDA
35%
28%
36% 38%42%
47%53%
0%
10%
20%
30%
40%
50%
60%
1H14 2H14 1H15 2H15 1H16 2H16 1H17
EBITDA Margin
A strong track record of growing earnings and margins
EBITDA is up 21% EBITDA margins are up 24%
NST has been able to grow earnings, profit margins and payouts to Shareholders consistently
2.5
1.0
2.5 2.0
3.0 3.0
4.0
3.0*
0
1
2
3
4
5
6
7
8
1H14 2H14 1H15 2H15 1H16 2H16 1H17A
$cp
s
Dividends per Share
* During the 1H FY2017 NST divested the Plutonic operation and paid a A3¢ special dividend.
Since 2014 NST has been able to increase
dividends as earnings grow
$7.6$14.3
$36.4
$55.5$65.1
$86.3
$104.6
20
40
60
80
100
120
1H14 2H14 1H15 2H15 1H16 2H16 1H17
A$
(m)
Net Profit After Tax
NPAT up 61% in 1H17
to a record A$104.6M
4

Over the last five years NST has averaged a Return on Equity of 30% and a Return on Invested Capital of 27%
which compares favourably to the ASX 100 Materials index average of 9.9% and 6.5% respectively
Consistently generating sector leading Returns
Source: * Bloomberg
27%
Sector Average 6.5%
-10%
-5%
0%
5%
10%
15%
20%
25%
30%
NS
T
DL
X
FM
G
AB
C
AM
C
BH
P
CS
R
IPL
RIO
OR
I
BL
D
ILU
AW
C
EV
N
BS
L
NC
M
5 Year Average Return on Invested Capital
30%
9.9% Sector Average
-20%
-10%
0%
10%
20%
30%
40%
50%
DL
X
NS
T
FM
G
AM
C
AB
C
BH
P
IPL
RIO
CS
R
OR
I
BL
D
ILU
AW
C
EV
N
BS
L
NC
M
5 Year Average Return on Equity
Source: * Bloomberg 5

Delivering consistent value creation in uncertain times
According to the Boston Consulting Group 2016 study “Delivering value in times of uncertainty”, NST ranked 6th
on the list for the 5 year Total Shareholder Return of ASX 200 companies, generating an average yearly TSR of
60.4% and was the first ranked mining company
Future NST valuation multiple drivers▪ Continuing to meaningfully extend mine lives
▪ Grow production organically across the Tier 1 asset base with an industry leading low level of capital intensity
▪ Internal focus to continue to achieve sector leading ROE and ROIC within the business
▪ Continuing to optimise existing production across the portfolio
Increased Cashflow
contribution
= TOTAL SHAREHOLDER RETURN “TSR”
Change in valuation
multipleProfit Growth
Source:* Boston Consulting Group paper on “Delivering value in times of uncertainty”6

Substantial reduction in major discoveries world wide; in 2015 greenfield discoveries cost US$189 per ounce,
NST costs were US$14 per ounce for the same period
Exploration is becoming more focussed around the mine site due to a lack of greenfield discoveries
Majority of future gold production is heading underground, in Australia 56% of production is now from
underground sources vs 44% from open pit*
Source: SNL
Source: *Centre of Exploration Targeting Research
Exploration budgets are being focussed around the mine siteGold discoveries have decreased despite a rising gold price
Source: SNL
Peak Discovery
7
Global Gold Trends: Gold discoveries & exploration

Northern Star continues to buck the global trend
Since 2012 Reserve life of the top five global producers has declined by 37%; whilst NST’s Reserves have grown
by 67% in just two years by investing into successive multi year exploration programs
With NST’s current investment into exploration, Reserve and Resource growth is set to continue at mid year
Production from the top five producers is also forecast to decline by 20% from 2015 to 2021*, whilst NST is
growing production by 20% to a 600koz per annum run rate in 2018
Source: * RBC Estimates
440
357
317291 278
0
100
200
300
400
500
2012A 2013A 2014A 2015A 2016A
Re
serv
es
(Mo
z)
Top 5 Producer Gold Reserves
Reserves have fallen by 37% since 2012 Production is set to decline by 20% to 2021
Source: Company announcements 8

Growth around our Tier 1 Assets is the core focus
Globally there are only 30 mines producing over 200kozpa in Tier 1 mining jurisdictions; production is declining in
these regions due to a lack of discoveries and significant Reserve depletion
Overlaying an EBITDA margin of over 50% on these mines significantly decreases the peer group
NST’s Tier 1 Operations operate at an EBITDA margin of over 55%
NST is focused on materially lifting production and increasing mine lives at these Operations
Tier 1 mining jurisdictions
Source: SNL, Investec9

Growth around our Tier 1 assets is the core focus
By the end of FY2017, NST will have invested A$250M
in exploration and expansionary capex since the
acquisition of its Tier 1 portfolio of assets 3 years ago
In FY2016, NST invested A$61M into exploration
This investment saw a 33% increase in Group
Reserves to 2Moz, at a cost of just A$50/oz
In FY2017, A$60M has been budgeted to organically
grow reserve and resource life across our assets
This investment is predicted to result in a material
update to the Company’s Resources and Reserves at
mid-year and form the key to a clear road map for the
future of the business
10

Production set to grow materially in 2018 and deliver significant increases in Company free cashflow
NST has a competitive advantage from having one of the lowest levels of capital intensity in the industry
Development plans and studies are well underway to grow production across the Tier 1 operating centres
This low level of capital intensity is one of the key drivers that will continue to see NST deliver sector leading returns
to Shareholders
Organic Production Growth with a low level of capital intensity
Source: * Bloomberg
0.97x
Sector Average 3.95x
2x
4x
6x
8x
10x
12x
RS
G
NS
T
SB
M
ZIJ
IN
RR
L
SA
R
SN
GL
EV
N
AU
KD
X
CD
E
ED
V
HM
Y
KG
I
GU
Y K
GF
I
CE
Y
PA
A
FV
I
SS
O
AB
X
SM
F
OG
C
FR
NE
M
AE
M
GO
LD
NC
M
BT
O
IMG
CG
DG
C
HL
AK
G
TX
G
TH
O
BV
N
IGO
YR
I
ZH
AO
AG
I
NG
D G
MU
X
EL
D
Capital Intensity Ratio
NST is benefited from having one of the lowest
levels of capital intensity in the industry
11
$0
$2
$4
$6
$8
$10
$12
NST Actual 8.3x EV/EBITDA 6x EV/EBITDA
Australian Gold Producers trading on low multiples
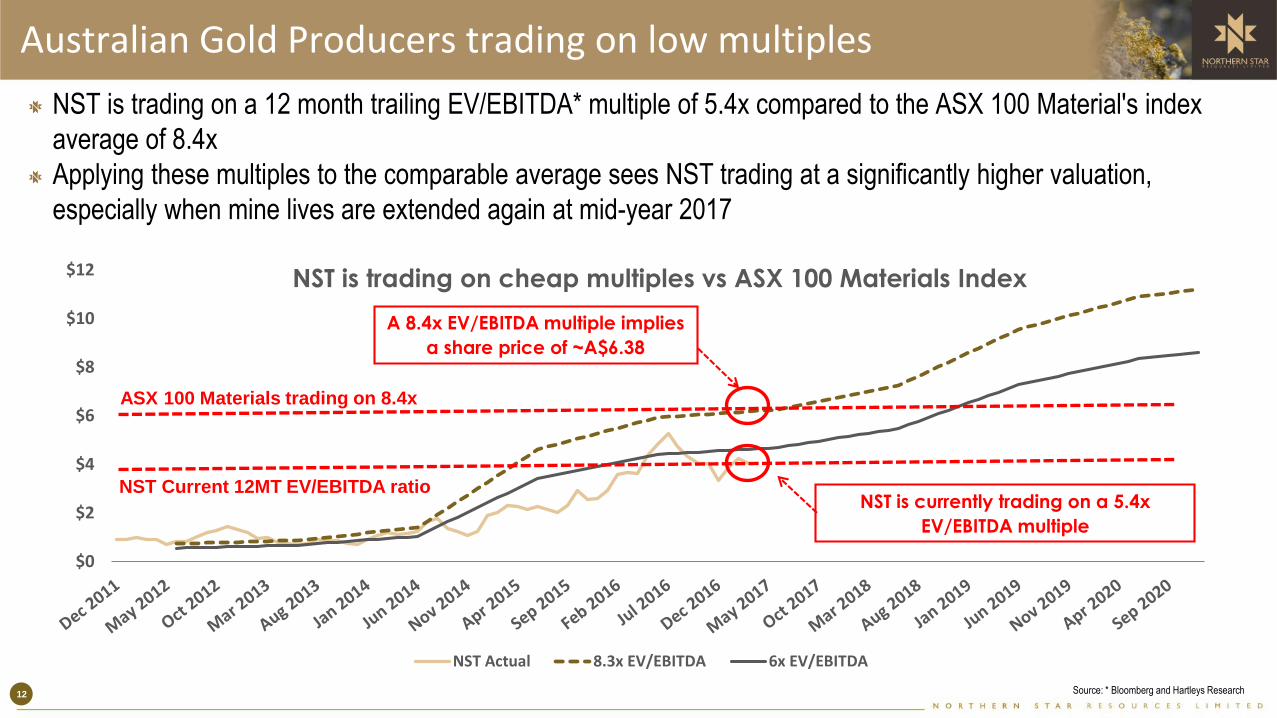
NST is trading on a 12 month trailing EV/EBITDA* multiple of 5.4x compared to the ASX 100 Material's index
average of 8.4x
Applying these multiples to the comparable average sees NST trading at a significantly higher valuation,
especially when mine lives are extended again at mid-year 2017
Source: * Bloomberg and Hartleys Research
NST is trading on cheap multiples vs ASX 100 Materials Index
A 8.4x EV/EBITDA multiple implies
a share price of ~A$6.38
ASX 100 Materials trading on 8.4x
NST Current 12MT EV/EBITDA ratioNST is currently trading on a 5.4x
EV/EBITDA multiple
12
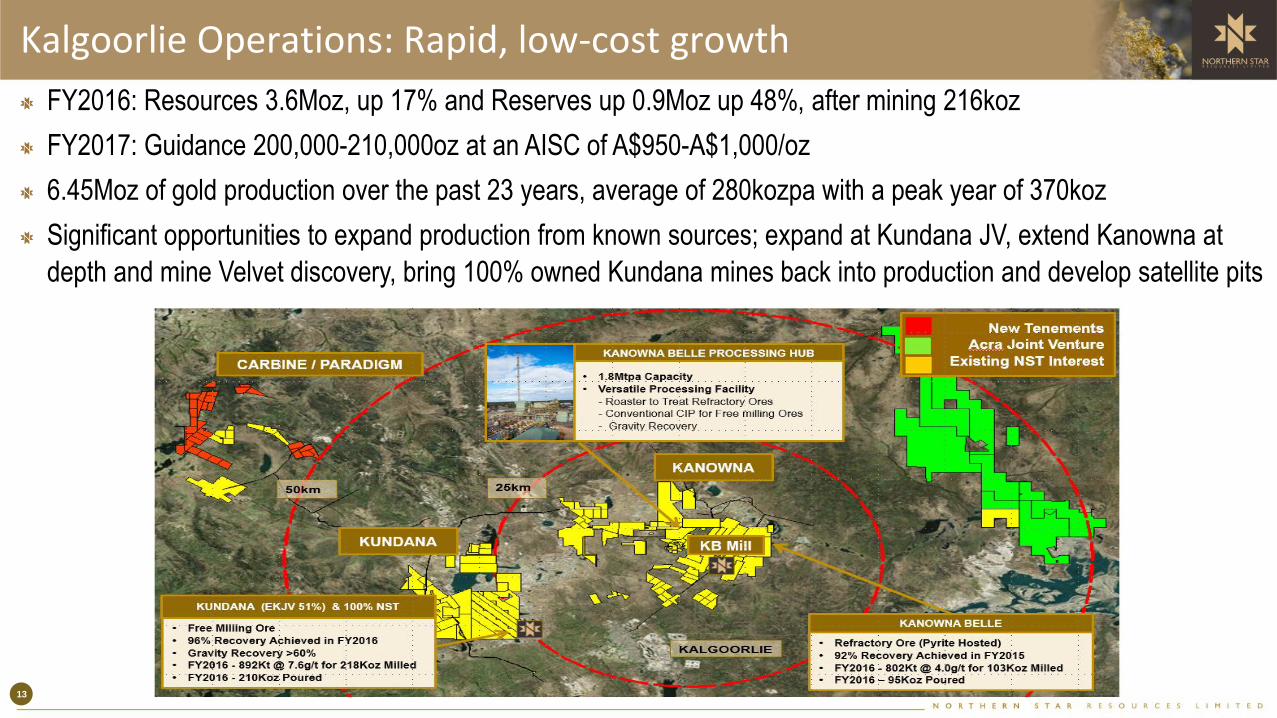
FY2016: Resources 3.6Moz, up 17% and Reserves up 0.9Moz up 48%, after mining 216koz
FY2017: Guidance 200,000-210,000oz at an AISC of A$950-A$1,000/oz
6.45Moz of gold production over the past 23 years, average of 280kozpa with a peak year of 370koz
Significant opportunities to expand production from known sources; expand at Kundana JV, extend Kanowna at
depth and mine Velvet discovery, bring 100% owned Kundana mines back into production and develop satellite pits
Kalgoorlie Operations: Rapid, low-cost growth
13
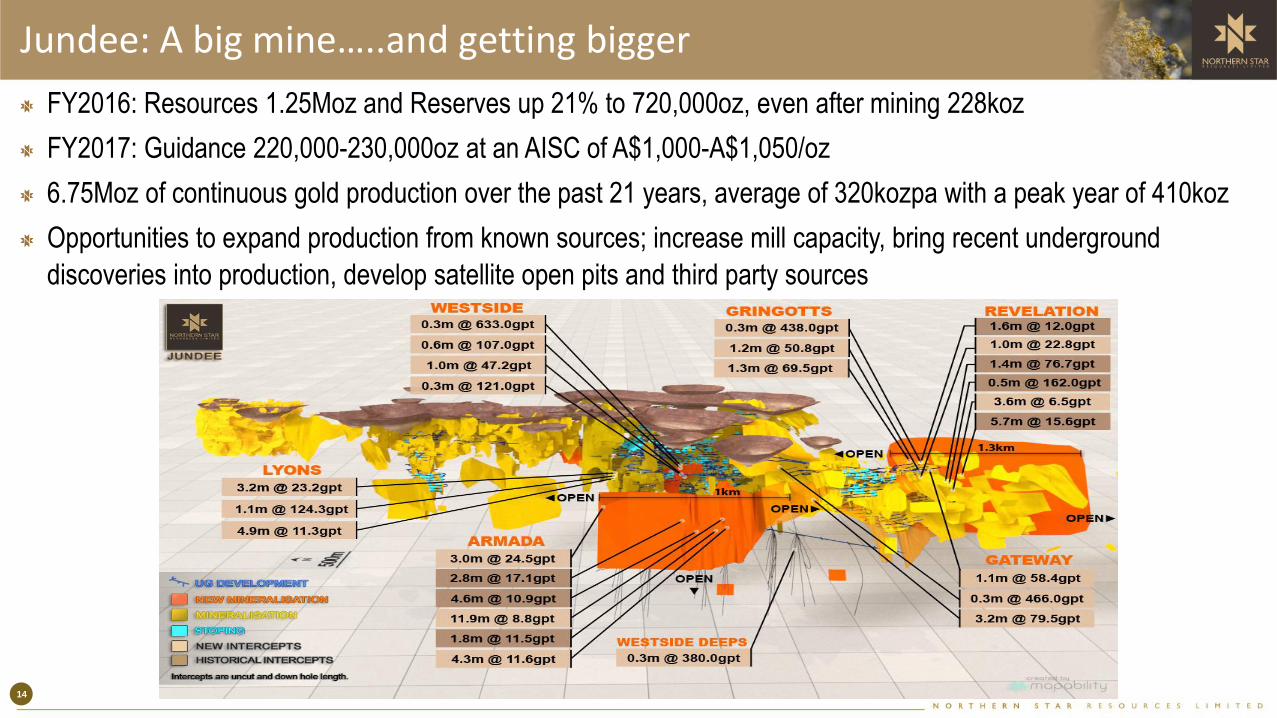
Jundee: A big mine…..and getting bigger
FY2016: Resources 1.25Moz and Reserves up 21% to 720,000oz, even after mining 228koz
FY2017: Guidance 220,000-230,000oz at an AISC of A$1,000-A$1,050/oz
6.75Moz of continuous gold production over the past 21 years, average of 320kozpa with a peak year of 410koz
Opportunities to expand production from known sources; increase mill capacity, bring recent underground
discoveries into production, develop satellite open pits and third party sources
14

FY2016: Resources 0.3Moz and Reserves 0.1Moz, after mining 91koz
FY2017: Guidance 65,000-75,000oz at AISC of A$1,200-A$1,250/oz
0.85Moz of continuous gold production over the past 11 years, averaged of 75kozpa with a peak year of 100koz
Record cash flow achieved in FY2016 since the mine commenced in 2005
15
Paulsens: The Founding Asset

The Tanami region is an exciting new area that is rapidly
developing a reputation for major gold discoveries
NST operations are contiguous to the world class
Newmont Callie mine, endowment 13Moz, Reserves of
4.5Moz at 6gpt, production ~480kozpa at A$966/oz*
Central Tanami Project was divested by Newmont in 2010
before they “unlocked” the geology at Callie Mine
Previous produced 2.1Moz, averaged 120kozpa; only
mined mineralisation via pits to a depth of <125m
Production ceased after mining of the Groundrush pit,
where 610koz at 4.3gpt were recovered over a 4 yr period
Past 5 years has seen A$40M invested at CTP in drilling
and feasibility studies with a current Resource of 1.1Moz
Recently acquired a substantial strategic land position to
complement existing operations
Has the potential to be a 120-150kozpa producer (100%)NST Interests
Newmont
Mining•Gold Occurrence•Significant Gold Deposit
150km
100km
Endowment >13Moz
Past Production >6Moz
Annual Production: 425-
480koz
AISC: US$700-$750 oz
YE 2016 Reserve: 23.2Mt
at 6.0g/t for 4.5Moz
YE 2016 Resource
(ex.RSV): 5.8Mt at 5.7g/t
for 1.1Moz
Extensive Mineral
Inventory
CALLIE (Newmont)
Open Pit Production
(Newmont) of 610koz
Tanami Gold Resource of
6.5Mt at 4.8g/t for 1Moz
GROUNDRUSH
(NST Earning to 60%)
53 Historic Open Pits
Tanami Gold Resource of
25Mt at 2.1g/t for 1.7Moz
1.2Mtpa Processing Plant
CENTRAL TANAMI
(NST Earning to 60%)
Source: * NEM Investor BMO Presentation 16
Central Tanami Project “CTP”: Emerging Growth Region

Why Invest in Northern Star
Highly profitable: Record half year net profit after tax of A$104.6M, up 61%; EBITDA margin
of 53%; track record of dividends, paid A10¢ps in 2016 (up 100% from 2015)
Strong balance sheet: no debt; A$393M in cash & equivalents (31 March 2017)
Emphasis on financial returns: Past 5 years avg TSR* +60%, ROE of 30% and ROIC 27%
One of the few ASX-listed gold miners with critical mass and asset diversity: FY2017
production of 485koz-515koz at an AISC of A$1,000-1,050/oz
Record of strong growth – with much more to come: Focused on our Tier 1 operations to
drive increased production and a simplified business model, increasingly more valuable
Aggressive exploration strategy delivering outstanding results; Reserves grew 33% in
FY2016 (after depletion) at average cost of just A$50/oz; A$60M spend this year has the
potential to significantly increase Reserves and underpin a clear road map for the future
Committed A$70M to expansion capital this year; this will underpin growth in production and
cashflow from 2018 onwards
Strong management team, track record of delivering operational and corporate objectives
which in turn have consistently achieved sector leading returns to NST Shareholders Source:* Boston Consulting Group paper on “Delivering value in times of uncertainty”17
Northern Star ResourcesAn Australian Mid Cap gold miner – for global investors
Contact Details:Luke Gleeson – Investor Relations +61 8 6188 2100Email – [email protected] – www.nsrltd.com

Appendix
Northern Star ResourcesAn Australian gold miner – for global investors
Appendix

Page 20
Kanowna Belle is a +5Moz orebody, averaging 4koz per
vertical metre with limited exploration below E block
NST will be drilling over 61,000m at Kanowna Belle with 4
rigs focused on Velvet, E Block and Lowes Extension
NST has also aggressively cut costs that has allowed the
current mine plan to be reviewed to bring existing resources
into production (blue areas on long section)
The Velvet deposit remains open up dip, along strike and
down plunge back towards the main Lowes ore body
Lowes ore body remains open along E Block with
exploration success at Lowes West and E Block East
Only 12 historic holes have been drilled below the base of E
Block; Lowes Extension exploration is currently targeting
this area from the 9245 drill drive with two drill rigs
Mineralisation has been encountered up to 450m below the
existing E Block production area
Velvet
Open
Open
Open
Kalgoorlie Operations: Rapid, low-cost production growth
KB in mine drilling
focussing on E block
and Lowes Extension
9245
Drill Drive
Resources currently outside of mine plan
Troy and Sims Lodes
Lowes Mineralisation
Stopes - 5Moz Produced
20

NST is targeting over 33,000m of exploration drilling on the EKJV ground with up to 4 UG drill rigs
This drilling will provide the next Resource and Reserve update across the mining complex
The new 2.1km drill drive to date is 630m from the Hornet decline and 30% complete, this drive will provide the
next long term drill platform to explore the depth potential of these deposits
Page 21
22
Kalgoorlie Operations: Rapid, low-cost production growth
Current Link Drive Development
21

Past production on the 100% NST ground has yielded 1.25Moz at 6gpt between 1990-2004
NST is drilling over 38,000m across these historic deposits to increase the resources at: Barkers, Strzelecki and
Pope John; each of these ore surfaces has historically produced 50-60kozpa
Current development at Millennium is ahead of schedule, first development ore due in 1Q FY2018
Exploration success will drive multiple development decisions in FY2018 to drive organic growth
Page 22
Kalgoorlie Operations: Rapid, low-cost production growth
Current Millennium Development22

Applying the BCG TSR drivers to the NST business model
NST has ticked all the boxes to deliver consistent returns above the peer group and is positioning itself to continue
this over the coming years and is looking to achieve a change in valuation multiple by extending mine lives
TSR is the product of multiple factorsTSR drivers
Cashflow contribution
Profit Growth
TSR
Change in valuation
multiple
Management levers
▪ Portfolio Growth Asset purchases
▪ Innovation that drives market share
▪ Changes in pricing mix and productivity that
drive margins
▪ Acquisitions (as a growth driver)
▪ Portfolio Profile (value added, commercial risk,
cyclicality)
▪ Debt Leverage and Financial risk
▪ Investor confidence in sustainability of
earnings
▪ Investor confidence in managements capital
▪ Return of cash (via dividends & share
repurchases) after:
▪ Re-investment requirements (Capex & R&D)
▪ Liability management
▪ Acquisitions (as a use of cash)
NST value drivers
▪ Asset acquisitions of Paulsens, Kalgoorlie & Jundee
▪ Improved productivities in under 6 months with a
15-25% reduction in head count
▪ Within 6 months cut cost base by 20-50%
▪ Continuing to meaningfully extending mine lives, grow
production organically across the asset base
▪ Used debt to grow twice, paid back in under 9 months
▪ Consistency of free cash flow generation over the last 11
quarters post acquisition
▪ 5 year average of 27% ROIC and 30% ROE
▪ Doubled dividends to Shareholders in the last 2 years
▪ Generated over A$525M of free cash flow since
acquisition
▪ Generated well over a 100% IRR on our operating assets
from capital employed on inorganic growth
Source: BCG “Delivering value in times of uncertainty”23