the artists and the economic recession survey: a report
TRANSCRIPT

The Artists and the Economic Recession Survey: A Report Comparing Main Survey Artists and Artists Who Live or Work in the Bay Area Princeton Survey Research Associates International for Helicon Collaborative and Leveraging Investments in Creativity February 2010

ACKNOWLEDGEMENTS
This report is funded in part by: the Ford Foundation, National Endowment for the Arts, Doris Duke Charitable Foundation, and the Nathan Cummings Foundation.
LEVERAGING INVESTMENTS IN CREATIVITY
Leveraging Investments in Creativity is a 10-year initiative to improve artists’ ability to make work, build social capital and contribute to democratic values. LINC builds on recent research by the Urban Institute that identifies more than 5,000 programs and services for artists but points to the need for new efforts that:
• Expand financial supports for artists’ work; • Improve artists’ access to essential material supports such as live-work space and insurance; and • Bolster knowledge, collaborations, and public policies that affect the work of artists and their
contributions to communities.
Launched in July 2003, LINC seeks to assist the people, organizations, and communities already at work in supporting artists, and to address needs not being served. Efforts include funding community-wide strategies to improve conditions for artists; building online information concerning live-work spaces and health insurance for artists; and working with field leaders to advance knowledge and best practices. For more information, go to: www.LINCnet.net and www.ArtsinaChangingAmerica.net.
HELICON COLLABORATIVE
Helicon seizes opportunities presented by times of change to encourage creativity, adaptability and fresh approaches to organizational evolution and progressive social change. In our view, culture and creativity abound in every community, and are essential to the health, vitality and resilience of individuals and society as a whole. We are a for-benefit enterprise comprised of professionals with diverse backgrounds in the arts, humanities and sciences. We collaborate with artists, cultural organizations, philanthropies and other imaginative groups and people to achieve shared goals. Find us on the web at www.heliconcollab.net.
PRINCETON SURVEY RESEARCH ASSOCIATES INTERNATIONAL
Princeton Survey Research Associates International is an independent firm dedicated to high-quality research providing reliable, valid results for clients in the United States and around the world. PSRAI has designed and implemented complex research efforts for clients ranging from foundations, nonprofits and news organizations, to major international corporations. For details, go to www.psra.com.

LOCAL REPORT ON THE FINDINGS – ARTISTS AND THE ECONOMIC RECESSION SURVEY – FEBRUARY 2010 PRINCETON SURVEY RESEARCH ASSOCIATES INTERNATIONAL
TABLE OF CONTENTS INTRODUCTION .................................................................................................................................................................. 3
THE SURVEY DESIGN AND REPORTING IN BRIEF ............................................................................................................ 4
FINANCIAL CIRCUMSTANCES OF ARTISTS IN THE RECESSION ...................................................................................... 6
Demographic Profile of Artists in the Survey ........................................................................................ 6 Work Profile of Artists in the Survey ..................................................................................................... 7
Years as an Artist and Work Habits ................................................................................................... 8 Current Financial Circumstances of Artists ........................................................................................... 8
Income from Art Work ......................................................................................................................... 8 Current Financial Circumstances Compared to One Year Ago .................................................... 10
Changes in Other Critical Financial Resources ............................................................................. 10 The “Day Job” and Its Impact on Artists’ Current Financial Circumstances ............................... 11
Artists’ Other Jobs ............................................................................................................................... 11 Non-Arts Related Income .................................................................................................................. 11
MARKETING AND CONNECTIVITY DURING THE RECESSION ..................................................................................... 13
Resources Artists Use to Promote Their Art Work ....................................................................... 13 Artists’ Use of E-Communications to do Arts-Related Activities ................................................. 14
Use of Social Networking for Arts-Related Activities ................................................................. 14 FACING THE EFFECTS OF THE RECESSION ...................................................................................................................... 15
Artists Find Creative Opportunities in the Financial Reality of the Recession ........................... 15 Artists’ Concerns about Personal Setbacks as a Result of the Recession ................................... 15
Most Artists Currently Have Health Insurance but Many Fear Losing It ................................ 16 Resources that Have Helped Artists Ride Out the Recession So Far .......................................... 16 Resources that Would Help Artists Recover from the Recession ................................................ 17
WHAT THE RECESSION MEANS FOR ARTISTS IN PARTICULAR - NOW AND IN THE FUTURE ............................... 18
Artists Have a Positive Outlook Even in the Midst of the Recession ........................................... 18 Most Artists Are Civically Active in Their Communities ............................................................ 19
Artists Say Changes Will be Necessary in the Wake of the Recession ....................................... 19 APPENDICES: ................................................................................................................................................................... 21
APPENDIX 1: TOPLINE QUESTIONNAIRE ............................................................................................................ 23
APPENDIX 2A: MAIN SURVEY METHODOLOGY ............................................................................................... 45
SUMMARY .................................................................................................................................................. 45 DESIGN AND DATA COLLECTION PROCEDURES.................................................................... 45
Sample Design ....................................................................................................................................... 45 Contact Procedures ............................................................................................................................. 47
WEIGHTING AND ANALYSIS ............................................................................................................. 47 MAIN SURVEY RESPONSE .................................................................................................................... 49
Attachment A ........................................................................................................................................ 51 APPENDIX 2B: SNOWBALL SURVEY METHODOLOGY ................................................................................... 53
SUMMARY .................................................................................................................................................. 53 DESIGN AND DATA COLLECTION PROCEDURES.................................................................... 53
Sample Design ....................................................................................................................................... 53 Contact Procedures ............................................................................................................................. 54

LOCAL REPORT ON THE FINDINGS – ARTISTS AND THE ECONOMIC RECESSION SURVEY – FEBRUARY 2010 PRINCETON SURVEY RESEARCH ASSOCIATES INTERNATIONAL
Attachment B ......................................................................................................................................... 55 APPENDIX 3: PROFILE OF NATIONAL ARTISTS FROM THE MAIN SURVEY BY ART FORM ................ 56
APPENDIX 4: ZIP CODES IN THE BAY AREA........................................................................................................ 58

LOCAL REPORT ON THE FINDINGS – ARTISTS AND THE ECONOMIC RECESSION SURVEY – FEBRUARY 2010 PRINCETON SURVEY RESEARCH ASSOCIATES INTERNATIONAL
3
INTRODUCTION
The recession has been hard for everyone, and artists are no exception. As of 2001, there were more than 2 million working artists in the United States, representing a critical part of the entrepreneurial, independent workforce. Yet the way in which artists live, work and support themselves means they are not always accounted for by traditional economic indicators or supported by the usual safety nets. Artists often have irregular working patterns and unusual career paths. Many work multiple part-time or freelance jobs in other sectors in addition to their artistic practice. And for some, while they may define themselves professionally first and foremost as an artist, artmaking is not how they make the majority of their income.
Leveraging Investments in Creativity (LINC), in partnership with Helicon Collaborative, developed the Artists and the Economic Recession Survey to provide high-quality and timely information to funders and artist service organizations about the experiences and needs of artists in the current economic climate. This research is part of LINC’s efforts to improve conditions for artists. (www.LINCnet.net)
The primary goals of this two-survey study were to provide information about artists’ financial circumstances more than a year into the recession, capture artists’ coping strategies, and identify artists’ needs and concerns as a result of the economic downturn.
• For the main national survey, which was fielded from July 20 to August 17, 2009, more than 35 arts service organizations across the U.S. partnered with LINC on this project, inviting their members to take the survey.1 The survey was supervised by Princeton Survey Research Associates International (PSRAI). The response was phenomenal. Thousands of artists took the survey within days of receiving it, and more than 5,300 interviews were completed nationally. This response makes this one of the largest online surveys PSRAI has conducted among a select population like artists.
• The snowball survey, identical to the main survey, was initiated following the conclusion of the main survey and wrapped up on November 23, 2009. For this survey, LINC recruited help to launch the survey by tapping into the social networks of designated informants who were not part of the main survey sample. Practicing artists who were invited by LINC to take the snowball survey were then asked to distribute the survey information to other practicing artists to encourage participation. Those artists in turn were also asked to pass along the survey information to practicing artists they knew, and so on, creating a “snowball” effect resulting in over 1,500 completed interviews. The survey was programmed by Helicon Collaborative and jointly supervised by Helicon and Princeton Survey Research Associates International (PSRAI).
This study was designed to examine the experiences of artists, but given that flexible, independent and opportunistic working arrangements are becoming more common for people working in all industries, the findings may be relevant to other sectors of the workforce as well.
1 A list of these organizations is provided in the Main Survey Methodology in Appendix 2A of this report.

LOCAL REPORT ON THE FINDINGS – ARTISTS AND THE ECONOMIC RECESSION SURVEY – FEBRUARY 2010 PRINCETON SURVEY RESEARCH ASSOCIATES INTERNATIONAL
4
THE SURVEY DESIGN AND REPORTING IN BRIEF
This report focuses solely on comparing results from artists from the main survey at the national level to results from a subset of the combined main survey and snowball survey samples, namely artists who live or work in the Bay Area.2 Discussed are the effects of the current recession on practicing Bay Area artists as they relate to views and experiences voiced by U.S. practicing artists in general.3
The survey was initiated by Leveraging Investments in Creativity (LINC), with the assistance of Helicon Collaborative, and in partnership with arts organizations nationwide and artists’ personal networks. Supervised jointly by Helicon and Princeton Survey Research Associates International (PSRAI), the two-survey study obtained 5,389 completed interviews nationally from the main survey and 1,563 completed interviews using the snowball method. Of the interviews completed in either survey, 456 interviews were obtained with practicing artists who live or work in the Bay Area. Interviewing was conducted between July 20 and November 23, 2009. Surveys were self-administered using an online interview that was available in both English and Spanish.
Securing broad participation by a diverse representation of artists was an important aspect of the project. To that end, several steps were taken to ensure that the survey be made available to as wide a range of artists as possible. For the main survey, LINC reached out to more than 35 arts organizations nationwide to solicit their help in contacting artists from diverse disciplines, in a broad range of geographic locations. Special attention was given to including organizations that serve racial and ethnic minorities, and artists who are sometimes underrepresented in arts research because of their relatively small number or different working styles. The survey was provided in Spanish and English to reduce the incidence of language as a barrier to participation. As a result of these efforts, the group of artists who completed the main survey includes sufficient numbers for reliable comparisons by age, race/ethnicity, educational attainment, arts discipline, percent of income from art work and several other important background characteristics. The snowball survey that followed the main survey was implemented to gather interviews from artists who may not have been sampled in the first phase of the study but whose opinions are just as valuable to a fuller understanding of the challenges artists face in this country today.
The report includes the results of survey analysis for key substantive questions, providing a summary of the topline results. Differences between main sample artists surveyed nationally and Bay Area artists are noted only if they are statistically significant at the 95% confidence level.4
These surveys reflect the views of a sample of individuals affiliated with LINC and its community partners as well as the views of artists’ personal networks. Because of the sampling process for the main survey and the snowball method of the second survey, the artists who participated in this study might not reflect the opinions and experiences of the entire population of practicing artists in the United
2 For a list of zip codes used to define the Bay Area, please see Appendix 4. 3 For the Bay Area analysis, Bay Area artists from both the main survey and the snowball survey were combined. This
combined Bay Area data were weighted so that the basic sample demographics matched the weighted Bay Area data from the main survey alone. This was done so that the demographic profile of the combined Bay Area data would match the weighted demographic profile of Bay Area artists from the main survey.
4 Should any difference not be statistically significant at this level, but is reported for other reasons, that will be noted.

LOCAL REPORT ON THE FINDINGS – ARTISTS AND THE ECONOMIC RECESSION SURVEY – FEBRUARY 2010 PRINCETON SURVEY RESEARCH ASSOCIATES INTERNATIONAL
5
States. The views of artists without access to the Internet, for example, are not represented. However, considerable effort was made to ensure that the survey results reflect the views of the vast number of artists in the U.S.
More detailed descriptions of the survey methodologies, including explanations of how the samples for each survey were compiled, are included in Appendix 2A and Appendix 2B of this report.

LOCAL REPORT ON THE FINDINGS – ARTISTS AND THE ECONOMIC RECESSION SURVEY – FEBRUARY 2010 PRINCETON SURVEY RESEARCH ASSOCIATES INTERNATIONAL
6
Financial Circumstances of Artists in the Recession
The artists who participated in the Artists and the Economic Recession Survey practice a variety of art forms, range from nascent to seasoned artists and work at their art for as little as five hours per week up to more than 40 hours. They include the very young and the elders of the artist community, artists from different racial and ethnic backgrounds, and artists with varying levels of formal education.
Yet, for all their diversity there is a great deal of commonality in their experiences as artists in the current economic recession. For most artists in the LINC survey, opportunities related to their art work have been stagnant or decreased in the past year, no doubt a ripple effect of the recession on other related industries. And while a majority has a job in addition to working on their art, most also have seen their incomes stay the same or decrease, including those with a day job. Most practicing artists would acknowledge there is generally a degree of uncertainty with respect to their art-related opportunities and income, but more than half of the artists surveyed experienced greater fluctuation than usual in their income and other resources in the past year.
Overall, artists who live or work in the Bay Area have many similar experiences and needs to artists surveyed nationally in the main survey.
Demographic Profile of Artists in the Survey For all the parallels that exist between Bay Area artists and main survey artists, there are also a number of key differences in the demographic makeup across these two groups. There is a larger share of female artists in the Bay Area than there are in the nation as a whole (56% v. 46% main). More Bay Area artists who participated in the survey are age 65 or older, an age bracket customarily considered to be close to or already in the retirement phase (9% v. 6% main).
When it comes to educational attainment, artists overall tend to be a very well-educated crowd. But those in the Bay Area are even more learned than the average artist. Seventy-one percent of Bay Area artists report having at least a four-year college degree, nearly a 10-percentage point edge over the 62% of national artists from the main survey who say the same.
Known to be a racially diverse section of the country, the Bay Area also sees its share of diversity in the racial and ethnic composition of its artists. Sixty-nine percent of Bay Area artists are Caucasian, compared with over three-quarters of main survey artists. While there are actually fewer African-American artists in the Bay Area, artists of Asian or Hispanic descent are more common to the area than artists nationwide. Roughly three times as many artists in the Bay Area are Asian (6% v. 2% main) or Hispanic (14% v. 5% main).
With such racial and ethnic diversity in the Bay Area, it is unsurprising that citizenship status of artists in this region is also varied. Ten percent of Bay Area artists are foreign-born, naturalized U.S. citizens, twice the amount reported by artists in the country as a whole. In fact, this ratio is maintained when looking at non-citizens, where 6% of Bay Area artists are not U.S. citizens compared with 3% of main survey artists.

LOCAL REPORT ON THE FINDINGS – ARTISTS AND THE ECONOMIC RECESSION SURVEY – FEBRUARY 2010 PRINCETON SURVEY RESEARCH ASSOCIATES INTERNATIONAL
7
Bay Area artists are also firmly planted in this culturally rich region of the U.S. Fifty-six percent of Bay Area artists have lived in the county of their current residence for more than 10 years. Just under half (49%) of artists nationwide have lived there as long. Having such strong roots in their communities, Bay Area artists are also more likely than main survey artists to have received any art-related training in the area where their current primary artistic workspace is located (67% v. 58% main).
Work Profile of Artists in the Survey Artists were asked to indicate on which art form they spend the most hours per week. Among Bay Area artists and main sample artists surveyed nationally, the largest share report that they are visual artists, such as painters, sculptors, or craft artists. (See Table 1)
A few differences between Bay Area artists and national artists from the main survey do appear:
• A larger share of Bay Area artists say they are dancers or choreographers (18% v. 7% main);
• Only half as many Bay Area artists as main survey artists say they are actors or directors (8% v. 16% main).
Apart from these two art forms, findings for artists in the Bay Area are similar to overall main survey results.
Table 1: Art Form on Which Most Hours Spent Per Week
Bay Area Main
% %
Visual artist (painter, sculptor, craft artist, etc.) 46 50
Media artist (filmmaker, photographer, video-maker, animator, digital media artist, etc.) 24 19
Musician (composer, instrumentalist, singer, conductor, DJ/mixer, producer, etc.) 20 19
Dancer or choreographer 18* 7
Literary Artist (fiction and non-fiction writers, playwrights, screenwriter, poet, storyteller, journalist, etc.) 12 16
Designer (lighting, scenography, costume, fashion, graphic, commercial, industrial, game, interior, floral, etc.) 10 9
Actor or director 8* 16
Performance artist 8 7
Architect * 1
Other 7 6
Note: With the exception of the result for Bay Area Architect, an asterisk indicates a percentage that is significantly higher or lower than percentages for that same category, compared with artists nationally.

LOCAL REPORT ON THE FINDINGS – ARTISTS AND THE ECONOMIC RECESSION SURVEY – FEBRUARY 2010 PRINCETON SURVEY RESEARCH ASSOCIATES INTERNATIONAL
8
Years as an Artist and Work Habits The LINC survey includes many artists with decades of experience but novices are represented as well. Equal shares of Bay Area artists and artists in the main sample have been practicing their art forms for more than 10 years. In fact, about four in 10 artists in each sample say they have been a practicing artist for over 20 years. Looking at all other stages of time in their careers, similar numbers of both samples report that they have been practicing for six to 10 years (19% Bay Area and 20% main), and roughly one in 10 for each group reports just one to five years experience. Less than one percent of Bay Area artists and main survey artists say they have been a practicing artist for less than one year. (See Graph 1)
Current Financial Circumstances of Artists Most artists have relatively modest incomes which is notable given that large majorities are college graduates and have at least one additional paying job on top of being a practicing artist. Six in ten Bay Area artists (62%) report that in 2008, their total individual income was less than $40,000, similar to the 63% share of main sample artists surveyed nationally. About one-quarter of both the Bay Area and main survey samples report their income is between $40,001 and $80,000, while no more than one in ten say they make more than $80,000.
Income from Art Work Similar to the national findings from the main sample, Bay Area artists surveyed tend to earn either very little of their overall income from their work as an artist or practically all of it. Statistically similar shares of Bay Area artists (48%) and main survey artists (43%) say they get 20% or less of their annual income from their artistic work. Conversely, fewer Bay Area artists earn 61% or more of their income from that work – six percentage points less than the main survey figure. (See Graph 2) Relatively few artists indicate that their income is evenly divided between earnings generated from their art work and from another job or source.

LOCAL REPORT ON THE FINDINGS – ARTISTS AND THE ECONOMIC RECESSION SURVEY – FEBRUARY 2010 PRINCETON SURVEY RESEARCH ASSOCIATES INTERNATIONAL
9

LOCAL REPORT ON THE FINDINGS – ARTISTS AND THE ECONOMIC RECESSION SURVEY – FEBRUARY 2010 PRINCETON SURVEY RESEARCH ASSOCIATES INTERNATIONAL
10
Current Financial Circumstances Compared to One Year Ago As with many other professions, a major financial impact for artists during the recession is stagnant or decreased income. A majority of Bay Area artists (51%) report a decrease in their art-related income from 2008 to 2009, including one in five who say it decreased by 50% or more. This is the same as the national finding where 51% of main sample artists also say their art income has dropped in the last year. About one-third of each sample report their income is about the same now as it was in 2008, while less than 20% say their art-related income has increased.
Changes in Other Critical Financial Resources Artists rely on many streams of revenue for their income and financial viability. There are a variety of opportunities for artists to earn their income. Many artists say there are fewer opportunities to generate revenue. (See Table 2)
Overall, similar shares of Bay Area artists and nationally surveyed artists from the main sample say opportunities are harder to come by than they were a year ago. Of the 12 types of resources or opportunities asked about in the survey, the one most noted by artists are the reduced opportunities for the sale of artists’ work. In addition to just fewer chances to sell their artwork, artists both in the Bay Area and main survey report that they are unable to charge as much now as they could this time last year for the work that they can manage to sell.
Bay Area artists do have different experiences from artists nationwide when it comes to the monetary amount of grants. While similar shares in both groups say they have fewer grant opportunities than before, more Bay Area artists than main survey artists report that the monetary amount of those grant awards is less now than in 2008 (43% Bay Area v. 37% main).
Most artists in the Bay Area and the main national survey report that opportunities to sell their work and the prices they charge for their work are down from this time last year. Though scarce overall, more artists nationally than in the Bay Area say they have more sale opportunities and can charge higher prices for their work:
• Sales of your work (3% Bay Area v. 9% main)
• Fees/rates you can charge for your work (6% Bay Area v. 9% main)
Table 2: Changes in Art-Related Resources/Opportunities in the Last Year – Less Opportunity Bay Area Main % % Sales of your work 52 48 Fees/rates you can charge for your work 47 44 Monetary amount of grant awards 43* 37 Number of grant awards 41 36 Bookings for exhibition/performance/ presentation of your work 39 38 Grant opportunities 39 35 Teaching opportunities 34 30 Services available to you by nonprofits 33 31 Opportunities to exhibit/perform/ present your work 32 35 Artist residency opportunities 31 27 Payment schedules (delays, renegotiated contracts, etc.) 25 24
Opportunities to trade/barter work and services 20 20
Note: An asterisk indicates a percentage that is significantly higher or lower than percentages for that same category, compared with artists nationally.

LOCAL REPORT ON THE FINDINGS – ARTISTS AND THE ECONOMIC RECESSION SURVEY – FEBRUARY 2010 PRINCETON SURVEY RESEARCH ASSOCIATES INTERNATIONAL
11
The “Day Job” and Its Impact on Artists’ Current Financial Circumstances People across professions often take on an extra job to supplement their income, particularly in these trying times when very few industries have been left unaffected by the economic downturn. This is especially true among artists. Seven in 10 Bay Area artists have at least one job in addition to their art work; this is a similar finding to the national figure (66%). About four in 10 in each sample say they have one job. Comparable shares of both samples report having two jobs (25% Bay Area and 21% main).
Artists’ Other Jobs Two-thirds of Bay Area artists who have at least one job in addition to their art work report that this supplemental job is in the arts as well, with nearly one-half saying they only have another art-related job and another 17% having additional jobs in arts- and non-arts fields. A significantly higher percentage of Bay Area artists report additional jobs in the arts field, as compared to artists nationally (66% Bay Area v. 59% main). Half in both the Bay Area and main samples say they have another job in a field unrelated to the arts (49% Bay Area and 50% main).
Among artists who have an additional job in an arts-related field, Bay Area artists are more likely than nationally surveyed artists to work for a non-profit (51% Bay Area v. 42% main). In addition, about half of each sample says they work in academics. Approximately four in 10 report working in the commercial arts arena and just a handful say they work in government or for a foundation.
Non-Arts Related Income Artists with jobs outside of the arts rely heavily on their income from non-arts related jobs to make a living. Majorities of both the Bay Area sample and the main sample who have an additional non-arts job say they earn over 60% of their individual annual income from their non-arts related employment. There are no differences between Bay Area artists and national artists on this particular measure. (See Graph 3)

LOCAL REPORT ON THE FINDINGS – ARTISTS AND THE ECONOMIC RECESSION SURVEY – FEBRUARY 2010 PRINCETON SURVEY RESEARCH ASSOCIATES INTERNATIONAL
12
While similarly large shares of each group tend to rely a great deal on their non-arts income, Bay Area artists who have a non-arts job have seen their non-arts income take a harder economic hit than their nationally surveyed counterparts in the main sample. Forty-eight percent of Bay Area artists with a non-arts job state that their income has decreased over the past 12 months, compared to one-third of artists nationally. (See Graph 4a)
Nationally sampled artists from the main survey are also more likely to say their non-arts income has increased compared to this time in 2008. Equal amounts of artists in both samples state their non-arts income has stayed about the same. (See Graph 4b)
LOCAL REPORT ON THE FINDINGS – ARTISTS AND THE ECONOMIC RECESSION SURVEY – FEBRUARY 2010 PRINCETON SURVEY RESEARCH ASSOCIATES INTERNATIONAL
13
MARKETING AND CONNECTIVITY DURING THE RECESSION
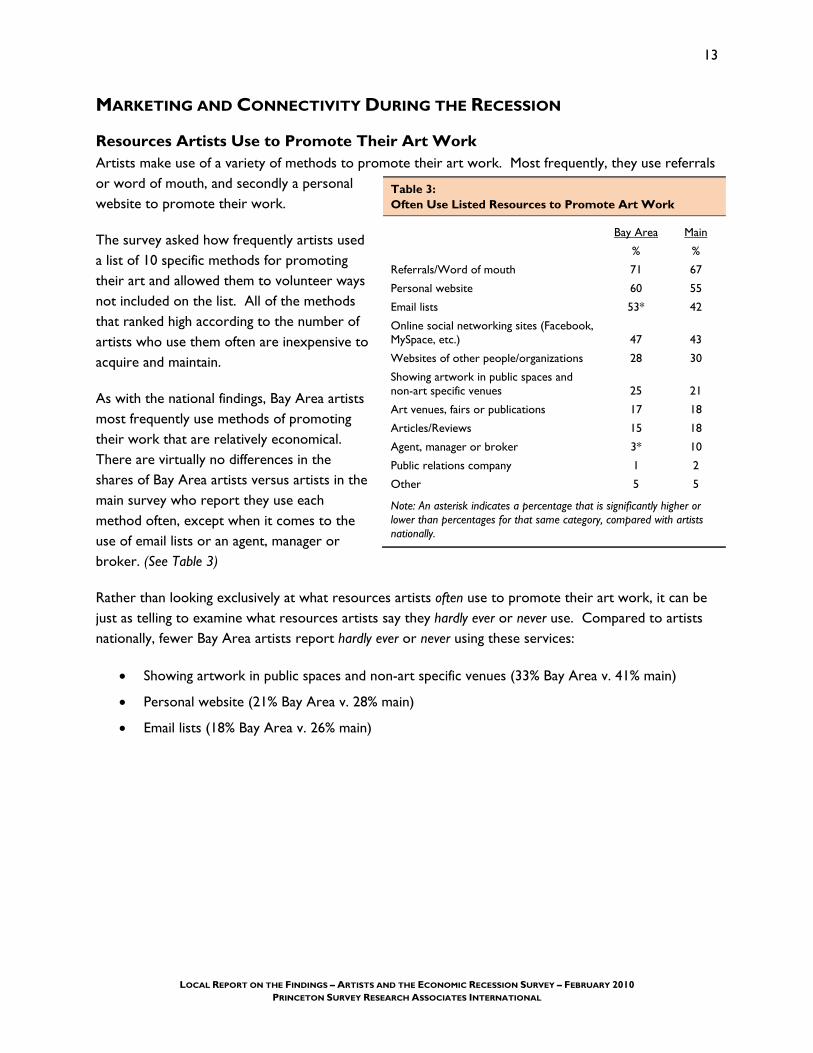
Resources Artists Use to Promote Their Art Work Artists make use of a variety of methods to promote their art work. Most frequently, they use referrals or word of mouth, and secondly a personal website to promote their work.
The survey asked how frequently artists used a list of 10 specific methods for promoting their art and allowed them to volunteer ways not included on the list. All of the methods that ranked high according to the number of artists who use them often are inexpensive to acquire and maintain.
As with the national findings, Bay Area artists most frequently use methods of promoting their work that are relatively economical. There are virtually no differences in the shares of Bay Area artists versus artists in the main survey who report they use each method often, except when it comes to the use of email lists or an agent, manager or broker. (See Table 3)
Rather than looking exclusively at what resources artists often use to promote their art work, it can be just as telling to examine what resources artists say they hardly ever or never use. Compared to artists nationally, fewer Bay Area artists report hardly ever or never using these services:
• Showing artwork in public spaces and non-art specific venues (33% Bay Area v. 41% main)
• Personal website (21% Bay Area v. 28% main)
• Email lists (18% Bay Area v. 26% main)
Table 3: Often Use Listed Resources to Promote Art Work
Bay Area Main
% %
Referrals/Word of mouth 71 67
Personal website 60 55
Email lists 53* 42
Online social networking sites (Facebook, MySpace, etc.) 47 43
Websites of other people/organizations 28 30
Showing artwork in public spaces and non-art specific venues 25 21
Art venues, fairs or publications 17 18
Articles/Reviews 15 18
Agent, manager or broker 3* 10
Public relations company 1 2
Other 5 5
Note: An asterisk indicates a percentage that is significantly higher or lower than percentages for that same category, compared with artists nationally.
LOCAL REPORT ON THE FINDINGS – ARTISTS AND THE ECONOMIC RECESSION SURVEY – FEBRUARY 2010 PRINCETON SURVEY RESEARCH ASSOCIATES INTERNATIONAL
14
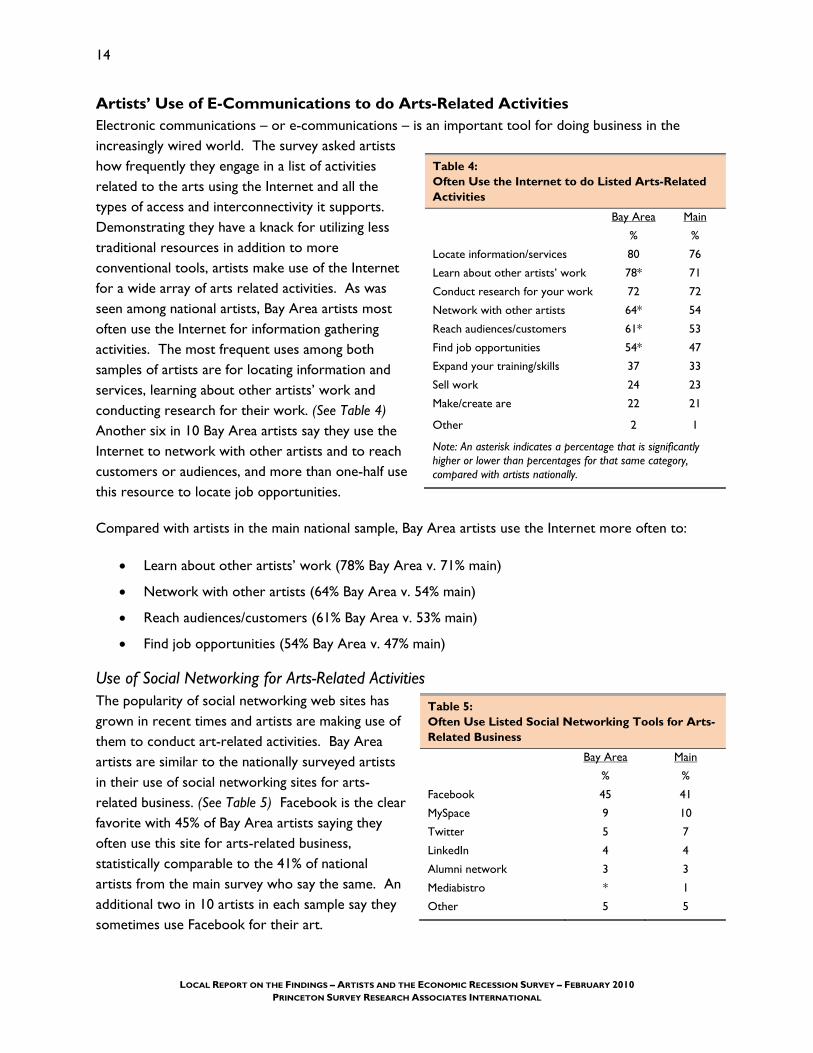
Artists’ Use of E-Communications to do Arts-Related Activities Electronic communications – or e-communications – is an important tool for doing business in the increasingly wired world. The survey asked artists how frequently they engage in a list of activities related to the arts using the Internet and all the types of access and interconnectivity it supports. Demonstrating they have a knack for utilizing less traditional resources in addition to more conventional tools, artists make use of the Internet for a wide array of arts related activities. As was seen among national artists, Bay Area artists most often use the Internet for information gathering activities. The most frequent uses among both samples of artists are for locating information and services, learning about other artists’ work and conducting research for their work. (See Table 4) Another six in 10 Bay Area artists say they use the Internet to network with other artists and to reach customers or audiences, and more than one-half use this resource to locate job opportunities.
Compared with artists in the main national sample, Bay Area artists use the Internet more often to:
• Learn about other artists’ work (78% Bay Area v. 71% main)
• Network with other artists (64% Bay Area v. 54% main)
• Reach audiences/customers (61% Bay Area v. 53% main)
• Find job opportunities (54% Bay Area v. 47% main)
Use of Social Networking for Arts-Related Activities The popularity of social networking web sites has grown in recent times and artists are making use of them to conduct art-related activities. Bay Area artists are similar to the nationally surveyed artists in their use of social networking sites for arts-related business. (See Table 5) Facebook is the clear favorite with 45% of Bay Area artists saying they often use this site for arts-related business, statistically comparable to the 41% of national artists from the main survey who say the same. An additional two in 10 artists in each sample say they sometimes use Facebook for their art.
Table 4: Often Use the Internet to do Listed Arts-Related Activities
Bay Area Main
% %
Locate information/services 80 76
Learn about other artists’ work 78* 71
Conduct research for your work 72 72
Network with other artists 64* 54
Reach audiences/customers 61* 53
Find job opportunities 54* 47
Expand your training/skills 37 33
Sell work 24 23
Make/create are 22 21
Other 2 1
Note: An asterisk indicates a percentage that is significantly higher or lower than percentages for that same category, compared with artists nationally.
Table 5: Often Use Listed Social Networking Tools for Arts-Related Business
Bay Area Main
% %
Facebook 45 41
MySpace 9 10
Twitter 5 7
LinkedIn 4 4
Alumni network 3 3
Mediabistro * 1
Other 5 5

LOCAL REPORT ON THE FINDINGS – ARTISTS AND THE ECONOMIC RECESSION SURVEY – FEBRUARY 2010 PRINCETON SURVEY RESEARCH ASSOCIATES INTERNATIONAL
15
FACING THE EFFECTS OF THE RECESSION
Artists Find Creative Opportunities in the Financial Reality of the Recession Although the recession has hurt artists in terms of income and some opportunities to showcase their art, many artists say that the recession has afforded them opportunities to focus on their art. In both the Bay Area and main national samples, roughly four in ten artists say the recession has allowed them to spend more time on their art work. (See Table 6) A similar share of both samples (37% Bay Area and 32% main) also says there is more openness to collaboration. One-third of Bay Area and main survey artists say they now have the ability to experiment more than before the economic downturn. Nearly two in 10 Bay Area artists say that the community having a greater need for artists’ services has emerged as an opportunity.
Artists’ Concerns about Personal Setbacks as a Result of the Recession Artists surveyed were asked to what extent they are worried about 14 specific issues they might face as a result of the recession – very worried, somewhat worried, not too worried or not at all worried. Results for artists’ top concerns, ranked according to the percentages who say they are very worried about these issues, show that artists’ top concerns are a mix of outcomes threatening the general public and those unique to artists.
Bay Area artists face many of the same challenges during the recession as nationally surveyed artists from the main sample. For the most part, their levels of concern are similar to artists nationwide. Loss of income is the top concern among both groups. About one-third of both Bay Area and national artists are very worried about possible outcomes that are more specific to artistic industry: fewer sales or commissions and fewer grants. (See Table 7)
Table 6: Opportunities Emerged During Economic Recession
Bay Area Main
% %
Able to spend more time on art work 39 37
More openness to collaboration 37 32
Able to experiment more 32 32
Community has greater need for my services 17 14
Cheaper work space 8 10
Table 7: Level of Concern Regarding Possible Results of the Economic Recession – Very Worried
Bay Area Main
% %
Loss of income 49 45
Difficulty fundraising for future projects 42* 34
Fewer sales/commissions 37 36
Fewer grants 34 28
Rising amount of debt 32 36
Loss of health insurance 30 31
Retirement plans derailed 26 28
Low morale (of self and others) 26 26
Fewer exhibition/presentation opportunities 26 25
Losing my non-arts job 20 16
Delayed payments for work completed 19 19
Loss of studio/workspace 16 15
Inability to pay student loans 13 16
Loss of home 10* 14
Other 5 4
Note: An asterisk indicates a percentage that is significantly higher or lower than percentages for that same category, compared with artists nationally.
LOCAL REPORT ON THE FINDINGS – ARTISTS AND THE ECONOMIC RECESSION SURVEY – FEBRUARY 2010 PRINCETON SURVEY RESEARCH ASSOCIATES INTERNATIONAL
16
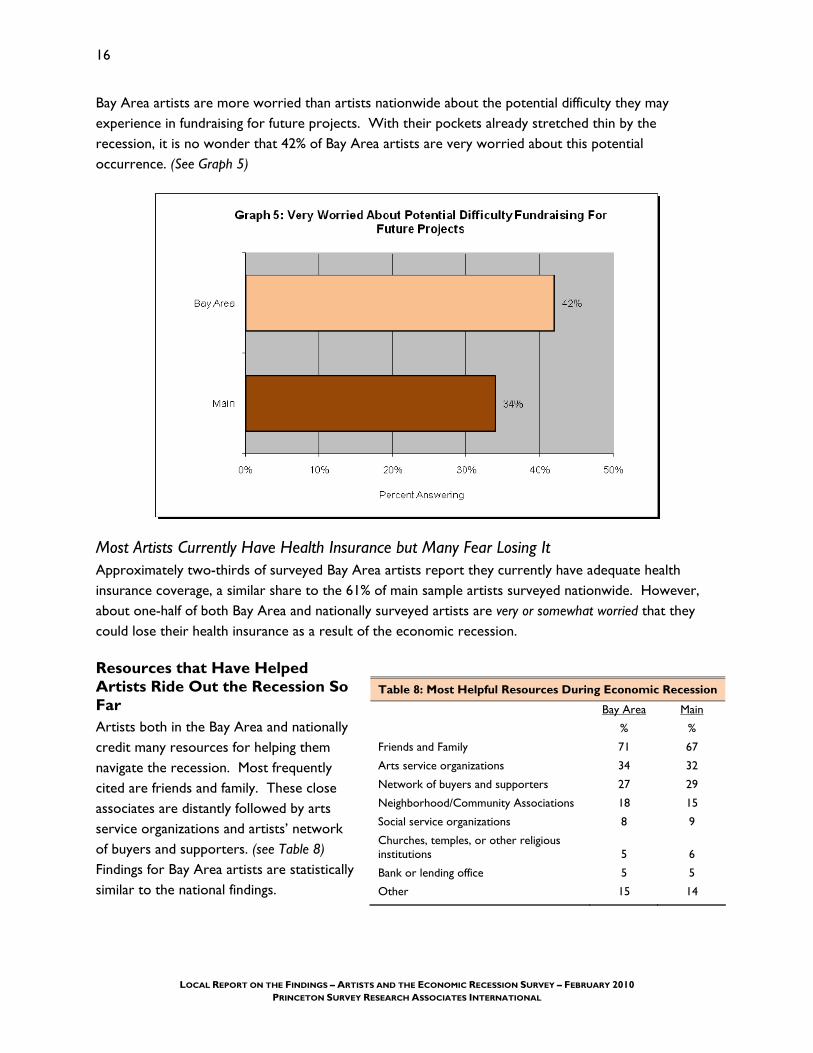
Bay Area artists are more worried than artists nationwide about the potential difficulty they may experience in fundraising for future projects. With their pockets already stretched thin by the recession, it is no wonder that 42% of Bay Area artists are very worried about this potential occurrence. (See Graph 5)
Most Artists Currently Have Health Insurance but Many Fear Losing It Approximately two-thirds of surveyed Bay Area artists report they currently have adequate health insurance coverage, a similar share to the 61% of main sample artists surveyed nationwide. However, about one-half of both Bay Area and nationally surveyed artists are very or somewhat worried that they could lose their health insurance as a result of the economic recession.
Resources that Have Helped Artists Ride Out the Recession So Far Artists both in the Bay Area and nationally credit many resources for helping them navigate the recession. Most frequently cited are friends and family. These close associates are distantly followed by arts service organizations and artists’ network of buyers and supporters. (see Table 8) Findings for Bay Area artists are statistically similar to the national findings.
Table 8: Most Helpful Resources During Economic Recession
Bay Area Main
% %
Friends and Family 71 67
Arts service organizations 34 32
Network of buyers and supporters 27 29
Neighborhood/Community Associations 18 15
Social service organizations 8 9
Churches, temples, or other religious institutions 5 6
Bank or lending office 5 5
Other 15 14

LOCAL REPORT ON THE FINDINGS – ARTISTS AND THE ECONOMIC RECESSION SURVEY – FEBRUARY 2010 PRINCETON SURVEY RESEARCH ASSOCIATES INTERNATIONAL
17
Resources that Would Help Artists Recover from the Recession Many organizations and individuals would like to assist artists through the recession. The challenge for those who would help is to determine what services would be most useful. As compared to national artists from the main survey, Bay Area artists give similar ratings to the potential helpfulness of resources asked about in the survey. Seven in ten Bay Area and national artists say grants/fellowships/scholarships would be very helpful in helping them navigate through the economic recession. This item is followed by majorities who say that opportunities to showcase their art work, public relations or marketing assistance, networking opportunities, supplies/equipment and health services would be helpful to them. (See Table 9)
Bay Area artists are more likely than nationally surveyed artists to find the following resources very helpful:
• Public Relations/Marketing assistance (56% Bay Area v. 49% main)
• Workspace assistance (41% Bay Area v. 31% main)
• Technology training (40% Bay Area v. 31% main)
Bay Area artists are less likely than artists nationwide to find venture capital (17% Bay Area v. 24% main) and loans (15% Bay Area v. 19% main) as very helpful resources.
Table 9: Helpfulness of Listed Resources in Dealing With the Effects of the Recession – Very Helpful
Bay Area Main
% %
Grants/Fellowships/Scholarships 72 71
Opportunities to showcase work 64 62
Public Relations/Marketing assistance 56* 49
Networking opportunities 53 52
Supplies/equipment 52 51
Health services 50 48
Workspace assistance 41* 31
Technology training 40* 31
Artistic training/skill development 38 34
Business counseling 37 35
Legal assistance (copyright, taxation, contracts, etc.) 36 33
Administrative support/shared services 33 29
Opportunities to barter 32 30
Housing assistance 27 26
Venture capital that seeks a return on the investment 17* 24
Loans 15* 19
Other 3 3
Note: An asterisk indicates a percentage that is significantly higher or lower than percentages for that same category, compared with artists nationally.

LOCAL REPORT ON THE FINDINGS – ARTISTS AND THE ECONOMIC RECESSION SURVEY – FEBRUARY 2010 PRINCETON SURVEY RESEARCH ASSOCIATES INTERNATIONAL
18
WHAT THE RECESSION MEANS FOR ARTISTS IN PARTICULAR - NOW AND IN THE FUTURE
Artists Have a Positive Outlook Even in the Midst of the Recession Bay Area artists have a positive outlook on being an artist, even in the midst of the current recession. While a majority of all artists see a role for artists in strengthening their communities, artists in the Bay Area are more likely than artists nationwide to completely agree that artists have a special role in strengthening communities in this economic climate (68% Bay Area v. 62% main). Equal shares of Bay Area and national artists completely agree that this is an inspiring time to be an artist (40% Bay Area and 42% main). (See Graph 6)

LOCAL REPORT ON THE FINDINGS – ARTISTS AND THE ECONOMIC RECESSION SURVEY – FEBRUARY 2010 PRINCETON SURVEY RESEARCH ASSOCIATES INTERNATIONAL
19
Most Artists Are Civically Active in Their Communities With such large majorities saying that artists play an important role in strengthening their communities, it is not surprising that artists surveyed are very active in volunteer activities. At least four in five artists in both the Bay Area sample and main sample say they have done some type of volunteer work or community service in the past two years. Bay Area artists appear to be especially community-minded, devoting more time to volunteering than artists across the country as a whole (87% Bay Area v. 80% main). However, when it comes to average weekly hours spent volunteering or doing community service, there are no differences between Bay Area artists and artists across the nation.
Artists serve their communities in many respects, including helping their fellow artists. Bay Area artists are more likely than artists nationally to have volunteered in areas related to artist issues (63% Bay Area v. 52% main). Across all other types of volunteer activities listed in the survey, these two groups of artists show no statistically significant differences. (See Table 10)
Artists Say Changes Will be Necessary in the Wake of the Recession Artists’ attitudes towards the future show that they are cognizant of the long-term impact of the current economic recession. Large shares of both Bay Area artists and main sample artists who were surveyed nationally say they agree that even after the economy stabilizes, future success as an artist will require a new outlook and approach. Bay Area artists are particularly oriented toward adaptation, with 59% saying they completely agree that their future as artists will require a new outlook and approach after the economy stabilizes, compared to 50% of artists nationally. (See Graph 7)
Table 10: Volunteer Activities in the Past Two Years
Bay Area Main
% %
Artist issues 63* 52
Education 46 41
Youth development 37 36
Community organizations/Citizen boards 37 36
Political campaigns, candidates or parties 19 23
Environment 19 21
Civil rights 17 19
Hunger/Poverty 12 15
Homelessness 11 10
Senior care/issues 9 11
Note: An asterisk indicates a percentage that is significantly higher or lower than percentages for that same category, compared with artists nationally.

LOCAL REPORT ON THE FINDINGS – ARTISTS AND THE ECONOMIC RECESSION SURVEY – FEBRUARY 2010 PRINCETON SURVEY RESEARCH ASSOCIATES INTERNATIONAL
20

LOCAL REPORT ON THE FINDINGS – ARTISTS AND THE ECONOMIC RECESSION SURVEY – FEBRUARY 2010 PRINCETON SURVEY RESEARCH ASSOCIATES INTERNATIONAL
21
APPENDICES: Appendix 1: Topline Results
Appendix 2A: Main Survey Methodology
Appendix 2B: Snowball Survey Methodology
Appendix 3: Demographic Profile of Main Survey Artists by Art Form
Appendix 4: A List of Zip Codes in the Bay Area


LOCAL REPORT ON THE FINDINGS – ARTISTS AND THE ECONOMIC RECESSION SURVEY – FEBRUARY 2010 PRINCETON SURVEY RESEARCH ASSOCIATES INTERNATIONAL
23
APPENDIX 1: TOPLINE QUESTIONNAIRE
Final Local Topline Questionnaire
Artists and the Economic Recession – Main and Snowball Surveys
Prepared by Princeton Survey Research Associates International for Helicon Collaborative and Leveraging Investments in Creativity
February 2010
Total N = 456 practicing artists who live or work in the Bay Area Field dates: July 20 – November 23, 2009 Fieldhouse for main survey: PSRAI (programming & host – online only) Fieldhouse for snowball survey: Helicon (programming & host – online only) Interview language: English and Spanish NOTES: 1) Because percentages are rounded, they may not total 100%.
2) An asterisk indicates a value of less than 1%. TITLE OF SURVEY FOR GATEWAY/LOGIN SCREEN: Artists and the Economic Recession MAIN SURVEY – INTRODUCTION SCREEN 1: Welcome to the Artists and the Economic Recession Survey. How are you being affected by the global recession? As an artist, the conditions you face in this current economic climate should be heard and addressed. This survey has been developed to collect hard data in order to help all of us advocate for the changes that will need to take place in policy, funding, and information dissemination to improve the working lives of artists nationwide. Who We Are and What We’ll Do Leveraging Investments in Creativity (LINC) is a ten-year national initiative to improve the conditions through which artists can shape their careers. LINC is working with organizations around the country to distribute the survey and share the aggregate results with a broad network of artist-service organizations, cultural organizations, and grantmakers who can be important resources for addressing the challenges you may be facing now and in the future. Now What? Please take 15 minutes to complete this survey. (And just to grease the wheel a little, when you complete the survey, you will have the opportunity to enter a drawing for one of four $100 prizes.) Thank you in advance for sharing your time and perspective. We'll keep you posted... Visit us at www.lincnet.net .

LOCAL REPORT ON THE FINDINGS – ARTISTS AND THE ECONOMIC RECESSION SURVEY – FEBRUARY 2010 PRINCETON SURVEY RESEARCH ASSOCIATES INTERNATIONAL
24
MAIN SURVEY – INTRODUCTION SCREEN 2: This survey is being administered by LINC and other artist service organizations nationwide. Princeton Survey Research Associates International is assisting in collecting the results. MECHANICS OF THE SURVEY: LINC would like you to answer each question, but if you do not want to answer a given question you can skip it and move on to the next one. If you decide you want to change the answer to a previous question, you can do so using the “previous” button on the screen. Please do not use the back button on your browser. The survey must be completed in one sitting. For this reason, please do not exit the survey until you have answered all of the questions. CONFIDENTIALITY NOTICE: LINC and its research partners are committed to your privacy and will not share your individual responses with any outside companies or use them for commercial purposes. Answers will be analyzed collectively, and not linked to the individual person completing the survey. If you have any problems with the mechanics of the survey, please contact PSRAI: [email protected] . If you have any questions about this survey, or concerns about confidentiality, please contact LINC representative XXXX XXXXXX: [email protected] . For more information on LINC, visit www.lincnet.net.

LOCAL REPORT ON THE FINDINGS – ARTISTS AND THE ECONOMIC RECESSION SURVEY – FEBRUARY 2010 PRINCETON SURVEY RESEARCH ASSOCIATES INTERNATIONAL
25
SNOWBALL SURVEY – INTRODUCTION SCREEN 1: Welcome to the Artists and the Economic Recession Survey. How are you being affected by the global recession? As an artist, the conditions you face in this current economic climate should be heard and addressed. The Artists and the Economic Recession Survey invites you to share your experience. This survey is being conducted by Leveraging Investments in Creativity (LINC), a ten-year national initiative to improve conditions for artists, and supervised by Helicon Collaborative and Princeton Survey Research Associates International. There is strength in numbers. LINC has been working with organizations around the country to distribute the survey…but we want to make sure we reach the widest range of artist voices possible, especially artists who may not be part of formal organizational networks. Reaching as many artists as possible improves the quality of this important research, and better equips everyone who advocates for artists and the arts. In addition to completing the survey yourself, could you forward this to every artist you know? Completing the survey takes about 15 minutes, and it is offered in both English and Spanish. All responses will be completely anonymous. If you complete the survey, you will have the opportunity to enter a drawing for one of four $100 prizes. Thank you in advance for sharing your time and perspective. We'll keep you posted... Visit us at www.lincnet.net .

LOCAL REPORT ON THE FINDINGS – ARTISTS AND THE ECONOMIC RECESSION SURVEY – FEBRUARY 2010 PRINCETON SURVEY RESEARCH ASSOCIATES INTERNATIONAL
26
SNOWBALL SURVEY – INTRODUCTION SCREEN 2: MECHANICS OF THE SURVEY: LINC would like you to answer each question, but if you do not want to answer a given question you can skip it and move on to the next one. If you decide you want to change the answer to a previous question, you can do so using the "back" button on your browser. If you do so, you will need to re-enter your answers from that point forward. The survey must be completed in one sitting. For this reason, please do not exit the survey until you have answered all of the questions. If you have any problems with the mechanics of the survey, please contact Helicon technical support. CONFIDENTIALITY NOTICE: LINC and its research partners are committed to your privacy and will not share your individual responses with any outside companies or use them for commercial purposes. Answers will be analyzed collectively, and not linked to the individual person completing the survey. If you have any questions about this survey, or concerns about confidentiality, please contact LINC representative XXXX XXXXXX: [email protected] . For more information on LINC, visit www.lincnet.net.

LOCAL REPORT ON THE FINDINGS – ARTISTS AND THE ECONOMIC RECESSION SURVEY – FEBRUARY 2010 PRINCETON SURVEY RESEARCH ASSOCIATES INTERNATIONAL
27
ARTISTIC WORK
1. On what art form do you spend the most hours per week?
Please indicate by typing the number “1” next to that category. If you also spend a significant amount of time working on another art form, please indicate by typing the number “2” next to the second category. (If you ‘do not practice any art form,’ please type the number “1” next to that category and leave all other categories blank.)
BAY AREA MAIN1
46 50 Visual artist (painter, sculptor, craft artist, etc.)
24 19 Media artist (filmmaker, photographer, video-maker, animator, digital media artist, etc.)
20 19 Musician (composer, instrumentalist, singer, conductor, DJ/mixer, producer, etc.)
18 7 Dancer or choreographer
12 16 Literary Artist (fiction and non-fiction writers, playwrights, screenwriter, poet, storyteller, journalist, etc.)
10 9 Designer (lighting, scenography, costume, fashion, graphic, commercial, industrial, game, interior, floral, etc.)
8 16 Actor or director
8 7 Performance artist * 1 Architect 7 6 Other (please specify)
0 0 I do not practice any art form
Note: Total may exceed 100% due to multiple responses. IF ‘I DO NOT PRACTICE ANY ART FORM,’ END INTERVIEW TEXT: Thank you for agreeing to participate. This survey is limited to practicing artists. 2. How long have you been a practicing artist?
BAY AREA MAIN * * Less than 1 year 9 11 1-5 years
19 20 6-10 years 31 30 11-20 years 40 39 21 years or more 0 * No answer
1 Main Survey trends are based on the “Artists and the Economic Recession – A National Survey” study conducted
and supervised by PSRAI for Helicon Collaborative and Leveraging Investments in Creativity from July 20 – August 17, 2009. A total of 5,389 interviews nationally were obtained with practicing artists recruited from LINC partner organizations. Survey was available in both English and Spanish. Statistical results were weighted to correct known demographic discrepancies.

LOCAL REPORT ON THE FINDINGS – ARTISTS AND THE ECONOMIC RECESSION SURVEY – FEBRUARY 2010 PRINCETON SURVEY RESEARCH ASSOCIATES INTERNATIONAL
28
3. On average, how many hours per week do you spend on your artistic activity (including planning, creating, training and the business side of art)?
BAY AREA MAIN 3 3 Less than 5 hours per week
13 12 5-10 hours 18 19 11-20 hours 24 20 21-30 hours 16 18 31-40 hours 25 28 More than 40 hours 1 * No answer
4. In 2008, what percent of your individual annual income did you earn from all your artistic work
combined? (Your best estimate without reviewing records is fine.)
BAY AREA MAIN
48 43 0-20% 11 12 21-40% 11 8 41-60% 4 7 61-80%
25 28 81-100% * * No answer * * A practicing artist for less than 1 year
5. How does your current art-related income compare to this time last year in 2008?
BAY AREA MAIN
14 16 (NET) Increased by about… 5 5 10% 3 4 20% 1 2 30% 1 1 40% 4 4 50% or more
51 51 (NET) Decreased by about… 8 7 10%
11 10 20% 8 9 30% 6 7 40%
18 18 50% or more 35 32 About the same
* * No answer * * A practicing artist for less than 1 year
LOCAL REPORT ON THE FINDINGS – ARTISTS AND THE ECONOMIC RECESSION SURVEY – FEBRUARY 2010 PRINCETON SURVEY RESEARCH ASSOCIATES INTERNATIONAL
29
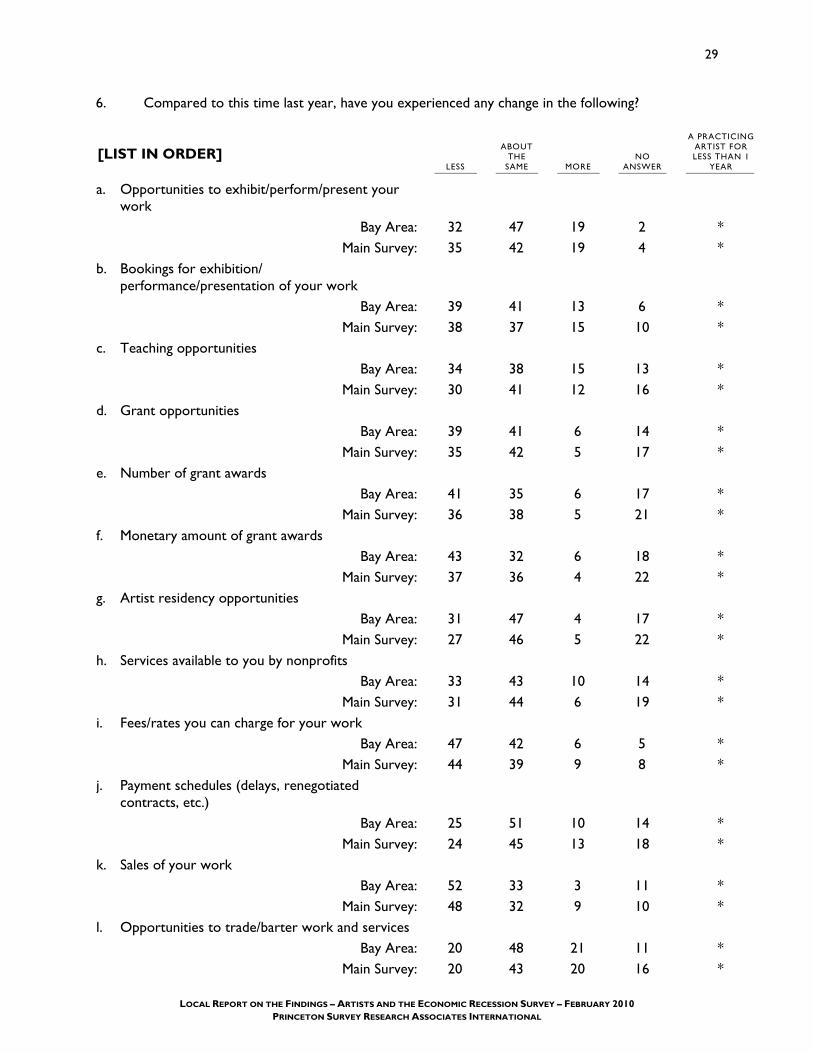
6. Compared to this time last year, have you experienced any change in the following?
[LIST IN ORDER] LESS
ABOUT THE
SAME MORE NO
ANSWER
A PRACTICING ARTIST FOR LESS THAN 1
YEAR
a. Opportunities to exhibit/perform/present your work
Bay Area: 32 47 19 2 * Main Survey: 35 42 19 4 *
b. Bookings for exhibition/ performance/presentation of your work
Bay Area: 39 41 13 6 * Main Survey: 38 37 15 10 *
c. Teaching opportunities Bay Area: 34 38 15 13 *
Main Survey: 30 41 12 16 * d. Grant opportunities
Bay Area: 39 41 6 14 * Main Survey: 35 42 5 17 *
e. Number of grant awards Bay Area: 41 35 6 17 *
Main Survey: 36 38 5 21 * f. Monetary amount of grant awards
Bay Area: 43 32 6 18 * Main Survey: 37 36 4 22 *
g. Artist residency opportunities Bay Area: 31 47 4 17 *
Main Survey: 27 46 5 22 * h. Services available to you by nonprofits
Bay Area: 33 43 10 14 * Main Survey: 31 44 6 19 *
i. Fees/rates you can charge for your work Bay Area: 47 42 6 5 *
Main Survey: 44 39 9 8 * j. Payment schedules (delays, renegotiated
contracts, etc.) Bay Area: 25 51 10 14 *
Main Survey: 24 45 13 18 * k. Sales of your work
Bay Area: 52 33 3 11 * Main Survey: 48 32 9 10 *
l. Opportunities to trade/barter work and services Bay Area: 20 48 21 11 *
Main Survey: 20 43 20 16 *

LOCAL REPORT ON THE FINDINGS – ARTISTS AND THE ECONOMIC RECESSION SURVEY – FEBRUARY 2010 PRINCETON SURVEY RESEARCH ASSOCIATES INTERNATIONAL
30
7. Would you say that the fluctuations in your income and other resources from 2008 to now are typical of your experience as an artist, or was there greater fluctuation or less fluctuation than usual?
BAY AREA MAIN
40 40 Typical of my experience as an artist 55 55 Greater fluctuation than usual 4 4 Less fluctuation than usual 1 1 No answer * * A practicing artist for less than 1 year
8. Do you have one or more jobs in addition to your art work?
BAY AREA MAIN 45 45 Yes, I have one additional job 25 21 Yes, I have two or more additional jobs 29 34 No, I don’t have any other jobs 1 * No answer
9a. Is your other job: 9b. Are your other jobs:
Based on artists who have one or more additional jobs
BAY AREA MAIN
49 45 Other job(s) in a field related to the arts 32 36 Other job(s) in a field unrelated to the arts 17 14 Both related to the arts and unrelated to the arts 3 5 No answer
[n=337] [n=3,653] 10. Please indicate the ARTS-RELATED areas in which you work. (Please mark all that apply)
Based on artists who have an additional arts-related job
BAY AREA MAIN 51 42 Nonprofit 48 50 Academic 35 43 Commercial 8 5 Foundation 4 6 Government 1 1 None/No answer
[n=225] [n=2,267]
Note: Total may exceed 100% due to multiple responses.

LOCAL REPORT ON THE FINDINGS – ARTISTS AND THE ECONOMIC RECESSION SURVEY – FEBRUARY 2010 PRINCETON SURVEY RESEARCH ASSOCIATES INTERNATIONAL
31
11. In 2008, what percent of your individual annual income did you earn from all your NON-ARTS RELATED jobs? (Your best estimate without reviewing records is fine.)
Based on artists who have an additional non-arts related job
BAY AREA MAIN
12 13 0-20% 9 10 21-40%
14 13 41-60% 23 21 61-80% 43 43 81-100% 0 * No answer
[n=158] [n=1,661] 12. How does your NON-ARTS RELATED income compare to this time last year in 2008?
Based on artists who have an additional non-arts related job
BAY AREA MAIN
15 23 (NET) Increased by about… 5 9 10% 4 4 20% 3 3 30% 1 1 40% 2 6 50% or more
48 34 (NET) Decreased by about… 17 7 10% 8 7 20%
10 7 30% 4 3 40% 9 10 50% or more
39 43 About the same 0 * No answer
[n=158] [n=1,661]

LOCAL REPORT ON THE FINDINGS – ARTISTS AND THE ECONOMIC RECESSION SURVEY – FEBRUARY 2010 PRINCETON SURVEY RESEARCH ASSOCIATES INTERNATIONAL
32
MARKETS
13. How frequently do you use each of the following resources to promote your art work?
[RANDOMIZE a-j] OFTEN SOME-TIMES
HARDLY EVER NEVER
NO ANSWER
a. Online social networking sites (Facebook, MySpace, etc.)
Bay Area: 47 27 9 16 1 Main Survey: 43 26 11 17 4
b. Personal website Bay Area: 60 17 5 16 2
Main Survey: 55 15 6 22 3 c. Websites of other people/
organizations Bay Area: 28 41 19 9 3
Main Survey: 30 37 15 13 4 d. Email lists
Bay Area: 53 27 9 9 2 Main Survey: 42 28 12 14 4
e. Art venues, fairs or publications Bay Area: 17 39 25 15 4
Main Survey: 18 33 20 23 6 f. Agent, manager or broker
Bay Area: 3 10 13 69 5 Main Survey: 10 12 11 61 6
g. Public relations company Bay Area: 1 8 12 74 5
Main Survey: 2 6 12 73 6 h. Referrals/Word of mouth
Bay Area: 71 22 4 2 1 Main Survey: 67 27 3 1 2
i. Articles/Reviews Bay Area: 15 37 30 15 3
Main Survey: 18 38 20 19 5 j. Showing artwork in public spaces
and non-art specific venues Bay Area: 25 37 21 12 4
Main Survey: 21 32 21 20 6 k. Other (please specify)
Bay Area: 5 3 1 0 91 Main Survey: 5 2 1 1 91

LOCAL REPORT ON THE FINDINGS – ARTISTS AND THE ECONOMIC RECESSION SURVEY – FEBRUARY 2010 PRINCETON SURVEY RESEARCH ASSOCIATES INTERNATIONAL
33
INTERNET USE
14. How frequently do you use the Internet for your artistic activity to:
[RANDOMIZE a-i] OFTEN SOME-TIMES
HARDLY EVER NEVER
NO ANSWER
a. Make/create art Bay Area: 22 23 22 30 3
Main Survey: 21 25 23 27 4 b. Reach audiences/customers
Bay Area: 61 25 9 3 2 Main Survey: 53 27 11 6 3
c. Sell work Bay Area: 24 24 25 23 4
Main Survey: 23 29 23 21 4 d. Locate information/services
Bay Area: 80 14 4 2 1 Main Survey: 76 18 2 2 1
e. Find job opportunities Bay Area: 54 23 12 10 1
Main Survey: 47 27 14 10 3 f. Conduct research for your work
Bay Area: 72 21 3 2 1 Main Survey: 72 20 4 2 2
g. Learn about other artists’ work Bay Area: 78 20 * * 1
Main Survey: 71 24 3 1 1 h. Network with other artists
Bay Area: 64 26 7 2 1 Main Survey: 54 31 9 4 2
i. Expand your training/skills Bay Area: 37 33 19 8 2
Main Survey: 33 34 19 10 3 j. Other (please specify)
Bay Area: 2 1 0 0 97 Main Survey: 1 1 * * 98

LOCAL REPORT ON THE FINDINGS – ARTISTS AND THE ECONOMIC RECESSION SURVEY – FEBRUARY 2010 PRINCETON SURVEY RESEARCH ASSOCIATES INTERNATIONAL
34
15. How frequently do you use each of the following social networking mechanisms for art-related business?
[RANDOMIZE a-f] OFTEN SOME-TIMES
HARDLY EVER NEVER
NO ANSWER
a. Facebook Bay Area: 45 22 10 22 *
Main Survey: 41 25 8 24 1 b. MySpace
Bay Area: 9 12 19 58 3 Main Survey: 10 13 17 57 4
c. LinkedIn Bay Area: 4 17 24 53 2
Main Survey: 4 14 18 59 5 d. Alumni network
Bay Area: 3 12 14 66 4 Main Survey: 3 12 15 64 5
e. Twitter Bay Area: 5 11 8 73 3
Main Survey: 7 9 9 70 5 f. Mediabistro
Bay Area: * 1 3 90 5 Main Survey: 1 2 4 87 6
g. Other (please specify) Bay Area: 5 4 1 1 89
Main Survey: 5 2 * 1 92 OVERALL EXPERIENCE AND FORECAST
16. What resources have helped you the most in navigating the recession so far? (Please mark up to three responses)
[RANDOMIZE 1-7] BAY AREA MAIN
71 67 Friends and family 34 32 Arts service organizations 27 29 Network of buyers and supporters 18 15 Neighborhood/Community associations 8 9 Social service organizations 5 6 Churches, temples or other religious institutions 5 5 Bank or lending office
15 14 Other (please specify) 6 7 None/No answer
Note: Total may exceed 100% due to multiple responses.

LOCAL REPORT ON THE FINDINGS – ARTISTS AND THE ECONOMIC RECESSION SURVEY – FEBRUARY 2010 PRINCETON SURVEY RESEARCH ASSOCIATES INTERNATIONAL
35
17. What opportunities have emerged for you as an artist during this recession? (Please mark all that apply)
[RANDOMIZE 1-5] BAY AREA MAIN
39 37 Able to spend more time on art work 37 32 More openness to collaboration 32 32 Able to experiment more 17 14 Community has a greater need for my services 8 10 Cheaper work space
14 13 Other (please specify) 18 22 None/No answer
Note: Total may exceed 100% due to multiple responses. 18. To what extent are you worried about the following as a result of the recession?
[RANDOMIZE a-n] VERY WORRIED
SOME-WHAT
WORRIED NOT TOO WORRIED
NOT AT ALL
WORRIED NO
ANSWER
a. Rising amount of debt Bay Area: 32 31 20 13 4
Main Survey: 36 25 17 16 6 b. Loss of income
Bay Area: 49 37 9 3 2 Main Survey: 45 32 12 7 3
c. Loss of home Bay Area: 10 22 32 28 7
Main Survey: 14 18 27 32 9 d. Loss of studio/workspace
Bay Area: 16 27 26 25 6 Main Survey: 15 19 23 33 11
e. Loss of health insurance Bay Area: 30 23 22 18 8
Main Survey: 31 19 17 24 9 f. Inability to pay student loans
Bay Area: 13 11 7 55 14 Main Survey: 16 9 8 52 15
g. Losing my non-arts job Bay Area: 20 23 17 29 11
Main Survey: 16 20 17 33 14 h. Retirement plans derailed
Bay Area: 26 26 17 21 9 Main Survey: 28 24 18 21 8
Q18 continued…

LOCAL REPORT ON THE FINDINGS – ARTISTS AND THE ECONOMIC RECESSION SURVEY – FEBRUARY 2010 PRINCETON SURVEY RESEARCH ASSOCIATES INTERNATIONAL
36
Q18 continued… 18. To what extent are you worried about the following as a result of the recession?
[RANDOMIZE a-n] VERY WORRIED
SOME-WHAT
WORRIED NOT TOO WORRIED
NOT AT ALL
WORRIED NO
ANSWER
i. Fewer exhibition/presentation opportunities
Bay Area: 26 44 18 9 4 Main Survey: 25 34 20 13 7
j. Fewer sales/commissions Bay Area: 37 38 10 10 4
Main Survey: 36 34 12 10 7 k. Fewer grants
Bay Area: 34 39 13 8 7 Main Survey: 28 31 15 16 10
l. Difficulty fundraising for future projects
Bay Area: 42 34 14 6 5 Main Survey: 34 33 12 13 8
m. Delayed payments for work completed
Bay Area: 19 29 28 17 7 Main Survey: 19 29 25 18 8
n. Low morale (of self and others) Bay Area: 26 42 20 10 2
Main Survey: 26 33 19 16 5 o. Other (please specify)
Bay Area: 5 1 * * 93 Main Survey: 4 1 * 1 94

LOCAL REPORT ON THE FINDINGS – ARTISTS AND THE ECONOMIC RECESSION SURVEY – FEBRUARY 2010 PRINCETON SURVEY RESEARCH ASSOCIATES INTERNATIONAL
37
19. How helpful would each of the following resources be to you in dealing with the effects of the recession?
[RANDOMIZE a-p] VERY HELPFUL
SOME-WHAT
HELPFUL
NOT TOO
HELPFUL
NOT AT ALL
HELPFUL NO
ANSWER
a. Business counseling Bay Area: 37 29 17 10 7
Main Survey: 35 30 14 10 10 b. Artistic training/skill development
Bay Area: 38 34 15 8 6 Main Survey: 34 31 16 10 9
c. Networking opportunities Bay Area: 53 34 7 2 4
Main Survey: 52 32 6 3 7 d. Workspace assistance
Bay Area: 41 20 19 13 7 Main Survey: 31 23 18 17 11
e. Housing assistance Bay Area: 27 19 22 23 9
Main Survey: 26 16 19 28 11 f. Supplies/equipment
Bay Area: 52 25 11 5 7 Main Survey: 51 25 10 6 9
g. Technology training Bay Area: 40 29 15 9 7
Main Survey: 31 29 18 13 10 h. Health services
Bay Area: 50 15 13 14 8 Main Survey: 48 17 12 13 10
i. Legal assistance (copyright, taxation, contracts, etc.)
Bay Area: 36 28 17 11 8 Main Survey: 33 29 17 11 10
j. Administrative support/shared services
Bay Area: 33 32 17 9 8 Main Survey: 29 29 18 12 12
k. Opportunities to barter Bay Area: 32 31 21 9 7
Main Survey: 30 32 18 10 10 Q19 continued…

LOCAL REPORT ON THE FINDINGS – ARTISTS AND THE ECONOMIC RECESSION SURVEY – FEBRUARY 2010 PRINCETON SURVEY RESEARCH ASSOCIATES INTERNATIONAL
38
Q19 continued…. 19. How helpful would each of the following resources be to you in dealing with the effects of the
recession?
[RANDOMIZE a-p] VERY HELPFUL
SOME-WHAT
HELPFUL
NOT TOO
HELPFUL
NOT AT ALL
HELPFUL NO
ANSWER
l. Opportunities to showcase work Bay Area: 64 26 5 1 4
Main Survey: 62 22 6 3 7 m. Loans
Bay Area: 15 21 26 28 10 Main Survey: 19 21 24 25 11
n. Venture capital that seeks a return on the investment
Bay Area: 17 20 29 23 10 Main Survey: 24 22 22 20 12
o. Grants/Fellowships/Scholarships Bay Area: 72 16 4 3 5
Main Survey: 71 14 3 5 7 p. Public Relations/Marketing
assistance Bay Area: 56 24 10 4 6
Main Survey: 49 27 9 6 8 q. Other (please specify)
Bay Area: 3 0 0 0 97 Main Survey: 3 * * * 97

LOCAL REPORT ON THE FINDINGS – ARTISTS AND THE ECONOMIC RECESSION SURVEY – FEBRUARY 2010 PRINCETON SURVEY RESEARCH ASSOCIATES INTERNATIONAL
39
20. Please indicate the extent to which you agree or disagree with the following statements?
[RANDOMIZE a-c] COMPLETELY AGREE
SOME-WHAT AGREE
SOME-WHAT
DISAGREE COMPLETELY
DISAGREE NO
ANSWER
a. This is an inspiring time to be an artist.
Bay Area: 40 40 12 7 2 Main Survey: 42 33 15 6 4
b. There is a special role for artists in helping to strengthen their communities in these times.
Bay Area: 68 25 4 2 1 Main Survey: 62 27 5 2 4
c. Even after the economy stabilizes, future success as an artist will require a new outlook and approach.
Bay Area: 59 31 7 2 2 Main Survey: 50 36 7 2 4
21. In the past two years, have you done any type of volunteer work or community service?
“Volunteer work” or “community service” means you spent time helping an organization or cause without being paid for it.
BAY AREA MAIN
87 80 Yes 13 17 No
* 3 No answer 22. During the last two years, on average how many hours per week did you spend volunteering or
doing community service? (Your best estimate is fine.)
BAY AREA MAIN 53 49 1-4 hours 20 17 5-10 hours 5 6 11-20 hours 6 7 More than 20 hours 2 1 No answer
13 20 Did not volunteer in the past two years

LOCAL REPORT ON THE FINDINGS – ARTISTS AND THE ECONOMIC RECESSION SURVEY – FEBRUARY 2010 PRINCETON SURVEY RESEARCH ASSOCIATES INTERNATIONAL
40
23. During the last two years, in what areas did you volunteer?
[LIST IN ORDER] YES NO
NO ANSWER
DIDN’T VOLUNTEER IN
PAST 2 YRS.
a. Artist issues Bay Area: 63 17 7 13
Main Survey: 52 14 15 20 b. Civil rights
Bay Area: 17 51 19 13 Main Survey: 19 33 28 20
c. Community organizations/ Citizen boards
Bay Area: 37 35 15 13 Main Survey: 36 21 22 20
d. Education Bay Area: 46 28 13 13
Main Survey: 41 19 20 20 e. Environment
Bay Area: 19 47 21 13 Main Survey: 21 30 29 20
f. Homelessness Bay Area: 11 55 21 13
Main Survey: 10 38 32 20 g. Hunger/Poverty
Bay Area: 12 54 21 13 Main Survey: 15 35 30 20
h. Political campaigns, candidates or parties
Bay Area: 19 48 20 13 Main Survey: 23 30 27 20
i. Senior care/issues Bay Area: 9 56 22 13
Main Survey: 11 37 31 20 j. Youth development
Bay Area: 37 33 17 13 Main Survey: 36 22 22 20

LOCAL REPORT ON THE FINDINGS – ARTISTS AND THE ECONOMIC RECESSION SURVEY – FEBRUARY 2010 PRINCETON SURVEY RESEARCH ASSOCIATES INTERNATIONAL
41
DEMOGRAPHICS
The last few questions are to help us describe the artists who took part in the survey. D1. What is your age?
BAY AREA MAIN 1 * Under 18 4 6 18-24
21 23 25-34 32 26 35-44 20 22 45-54 11 12 55-64 9 5 65-74 * 1 75 or older 0 3 No answer
D2. What is your gender?
BAY AREA MAIN 44 50 Male 56 46 Female 1 * Transgender * 3 No answer
D3. What is the highest level of schooling you have completed?
BAY AREA MAIN 1 1 Grade school 1 1 Some high school (grades 9-11) 3 6 High school graduate (grade 12 or GED certificate)
25 26 Some college, conservatory or post-secondary certificate (includes associates degree)
36 36 College graduate (BA, BS or other four-year degree) 11 7 Some graduate school but no degree 24 19 Graduate degree (including an MA, MS, PhD, JD or MD) 0 3 No answer
D4. Do you currently have adequate health insurance coverage?
BAY AREA MAIN 63 61 Yes 37 36 No 0 3 No answer

LOCAL REPORT ON THE FINDINGS – ARTISTS AND THE ECONOMIC RECESSION SURVEY – FEBRUARY 2010 PRINCETON SURVEY RESEARCH ASSOCIATES INTERNATIONAL
42
D5. What is your primary race/ethnic identity?
BAY AREA MAIN 69 78 Caucasian, White 2 5 African-American/African descent 6 2 Asian, Asian American, Pacific Islander
14 5 Latino, Hispanic, Chicano 1 2 Native American, Native Alaskan, Native Hawaiian 5 2 Multi-racial * * Other (please specify) 3 5 Refused/No answer
D6. What is your citizenship status?
BAY AREA MAIN 83 88 U.S. born 10 5 Foreign born U.S. citizen (naturalized) 6 3 Not a U.S. citizen * 4 No answer
D7. In 2008, approximately what was your total individual income from all sources (including both
art and non-art-related income), before taxes? (Your best estimate without reviewing records is fine.)
BAY AREA MAIN 8 6 $5,000 or less 5 7 $5,001 - $10,000
18 18 $10,001 - $20,000 31 32 $20,001 - $40,000 20 17 $40,001 - $60,000 8 7 $60,001 – $80,000 6 3 $80,001 - $100,000 2 2 $100,001 - $150,000 1 1 $150,001 - $200,000 1 * More than $200,000 3 7 No answer

LOCAL REPORT ON THE FINDINGS – ARTISTS AND THE ECONOMIC RECESSION SURVEY – FEBRUARY 2010 PRINCETON SURVEY RESEARCH ASSOCIATES INTERNATIONAL
43
The next few questions in the survey are used only for classification purposes. You cannot be personally identified or contacted based on this information. D8. What state do you live in?
BAY AREA MAIN 84 13 California 0 9 New York 0 4 Washington state 0 n/a Minnesota 0 7 Pennsylvania 0 n/a Wisconsin 0 n/a Texas 0 8 Illinois 0 3 Montana 0 30 Misc. other
16 25 No answer Note: States broken out only if 3% or more of Total.
D9. What is the five-digit zip code of your current primary residence?
(If you would rather not give this information, please type in five zeros.)
BAY AREA MAIN 97 79 Provided zip code of primary residence 3 21 No answer
D10. For how many years have you lived in the COUNTY of your current residence?
BAY AREA MAIN 4 5 Less than 1 year
17 20 1-4 years 23 22 5-10 years 56 49 More than 10 years
* 5 No answer D11. What is the five-digit zip code of your current primary artistic workspace?
(If you would rather not give this information, please type in five zeros.)
BAY AREA MAIN 90 73 Provided zip code of primary artistic workspace 10 27 No answer

LOCAL REPORT ON THE FINDINGS – ARTISTS AND THE ECONOMIC RECESSION SURVEY – FEBRUARY 2010 PRINCETON SURVEY RESEARCH ASSOCIATES INTERNATIONAL
44
D12. Have you received any art-related training in this city or region?
BAY AREA MAIN 67 58 Yes 33 37 No
* 5 No answer WRAP. If you have any comments or ideas about what would help you and other artists you
know, please type them in the space below. PRIZE. Would you like your name entered into the drawing for one of the four $100 prizes? CLOSING:
REPORT That is the end of the survey. When the survey project is complete, we would like to send you the report on the findings. Please indicate whether you would prefer to receive the report by email or through regular U.S. Post mail.
BAY AREA MAIN
81 77 Email address (please specify) 3 5 Regular U.S. Post mail2 5 12 Do not want a copy of the report
11 6 No answer THANK YOU/EXIT SCREEN: Your survey is complete. Thank you so much for taking the time to share your insights. CREGION Census regions created from self-reported state or from state in which the partner
organization headquarters resides if applicable.
BAY AREA MAIN 0 26 Northeast 0 21 Midwest 0 21 South
100 32 West * 0 No answer
2 In the snowball survey, artists were not offered the option of receiving the report findings by US Post Mail.

LOCAL REPORT ON THE FINDINGS – ARTISTS AND THE ECONOMIC RECESSION SURVEY – FEBRUARY 2010 PRINCETON SURVEY RESEARCH ASSOCIATES INTERNATIONAL
45
APPENDIX 2A: MAIN SURVEY METHODOLOGY
Detailed Survey Methodology
Artists and the Economic Recession – A National Survey
Prepared by Princeton Survey Research Associates International for Helicon Collaborative and Leveraging Investments in Creativity
September 2009
SUMMARY The Artists and the Economic Recession Survey, jointly sponsored by Helicon Collaborative and Leveraging Investments in Creativity (LINC), obtained interviews with 5,389 practicing artists. Survey participants were sampled from the membership lists of various arts service organizations across the United States that agreed to partner with LINC for this study. The survey was supervised by Princeton Survey Research Associates International (PSRAI). Data were collected via online English- or Spanish-language administration from July 20 to August 17, 2009. Statistical results are weighted to correct known demographic discrepancies.
Details on the design, execution and analysis of the survey are discussed below.
DESIGN AND DATA COLLECTION PROCEDURES
Sample Design Sample was compiled by Helicon Collaborative. A total of 38 arts organizations throughout the United States agreed to send email invitations to their members to participate in the artist survey. Random samples were not drawn from organization lists. Rather email invitations were sent to the lists in their entirety. Table 1 shows the arts organizations that participated in this research, the state in which each organization is based, and the size of each organization’s sample list.

LOCAL REPORT ON THE FINDINGS – ARTISTS AND THE ECONOMIC RECESSION SURVEY – FEBRUARY 2010 PRINCETON SURVEY RESEARCH ASSOCIATES INTERNATIONAL
46
TTaabbllee 11:: LLIINNCC ppaarrttnneerr oorrggaanniizzaattiioonnss ((MMaaiinn SSuurrvveeyy)) State Sample size New York State Council on the Arts (NYSCA) NY 22,200 Chicago Department of Cultural Affairs (Chicago DCA) IL 12,000 The Actors Fund NY 9,624 Leeway Foundation PA 6,915 Center for Cultural Innovation (CCI) CA 5,000 New York Dept of Cultural Affairs (New York DCA) NY 4,589 Miami Light Project FL 4,408 MusicCares Foundation CA 3,100 Artist Trust WA 2,855 Movimiento de Arte y Cultura Latino Americana (MACLA) CA 2,724 Durfee Foundation CA 2,500 Queens Council on the Arts NY 2,500 Alliance for California Traditional Arts CA 1,747 Asian Arts Initiative PA 1,556 Cultural Development Corp. DC 1,500 Montana Arts Council MT 1,500 DiverseWorks TX 1,300 Japanese American Cultural and Community Center CA 1,200 Fractured Atlas NY 1,000 Arts Council of Metropolitan Kansas City KS 877 Pew Fellowships in the Arts PA 706 Rasmuson Foundation AK 700 Stockton Rush Bartol Foundation PA 700 Alternate ROOTS GA 673 The Longhouse Education and Cultural Center of Evergreen State College WA 600 Massachusetts Cultural Council MA 500 Creative Capital NY 400 The Charlotte Street Foundation MO 320 Community Partnership of Arts and Culture (CPAC) OH 314 Washington State Arts Commission WA 272 National Performance Network, Inc. (NPN) LA 256 Alaska State Council on the Arts AK 250 Houston Arts Alliance TX 150 The Richard H. Driehaus Foundation IL 150 Diaspora Vibe Cultural Arts Incubator FL 145 The Boston Foundation MA 61 First Peoples Fund SD 55 ArtHome NY 1
TOTAL 95,348
AGREED TO PARTICIPATE/YIELDED NO COMPLETES State Sample size Chicago Public Art Group IL 60 Getty Foundation CA n/a

LOCAL REPORT ON THE FINDINGS – ARTISTS AND THE ECONOMIC RECESSION SURVEY – FEBRUARY 2010 PRINCETON SURVEY RESEARCH ASSOCIATES INTERNATIONAL
47
Contact Procedures Data were collected from July 20 to August 17, 2009. Requests for participation were sent to 95,348 individuals, with a link to an online web address where the survey was hosted by PSRAI. Each LINC partner organization had a unique identification username with which its members could log in to the survey; each individual respondent, however, did not have a unique username. The organization username allowed PSRAI to identify the organization each interview came from, but kept individual respondents anonymous.
Data collection involved two email prompts to everyone in the sample. Using email texts crafted by PSRAI and approved by both Helicon and LINC, each partner organization disseminated both the initial email invitations and the follow-up email reminders according to a schedule set by Helicon and LINC. On July 20-21, 2009, the email invitations were distributed by each partner organization to artists on their membership lists. On July 28-29, 2009, email reminders were sent to the same groups of artists who received the initial email contact. All email communications contained a link to the web survey, named LINC as the survey sponsor and identified PSRAI as the research partner. A copy of the email invitation and the follow-up email reminders can be found in Attachment A of this methodology.
The online survey was programmed and hosted by PSRAI. Data were monitored and downloaded regularly and checked for accuracy. Since respondents were allowed to skip questions without answering them, only cases with at least 70% of the substantive questions answered were considered completed interviews. Cases for which less than 70% of the questions were answered were not included in the dataset.
At the end of each interview, respondents were given the opportunity to enter their contact information into a drawing for one of four $100 prizes. Drawings and prize disbursements were handled by LINC.
WEIGHTING AND ANALYSIS The final data were weighted (or raked) to match sample demographics to population parameters of sex, age, race/ethnicity, education and region. Population parameters for sex, age, race/ethnicity and education came from an analysis of 2000 Census data performed by the Project on Regional and Industrial Economics at the University of Minnesota for LINC. The region parameter came from the National Endowment for the Arts’ Artists in the Workforce, 1990-2005 research report #48.
Weighting was accomplished using Sample Balancing, a special iterative sample weighting program that simultaneously balances the distributions of all variables using a statistical technique called the Deming Algorithm. Weights were trimmed to prevent individual interviews from having too much influence on the final results. The use of these weights in statistical analysis ensures that the demographic characteristics of the sample closely approximate the demographic characteristics of the national population of artists. Table 2 compares weighted and unweighted sample distributions to population parameters.

LOCAL REPORT ON THE FINDINGS – ARTISTS AND THE ECONOMIC RECESSION SURVEY – FEBRUARY 2010 PRINCETON SURVEY RESEARCH ASSOCIATES INTERNATIONAL
48
TTaabbllee 22:: SSaammppllee DDeemmooggrraapphhiiccss ((MMaaiinn SSuurrvveeyy))
Population Parameter
Unweighted Sample
Weighted Sample
Sex Male 56.3 37.8 51.9 Female 43.7 62.2 48.1
Age 16-24 10.4 2.4 6.9 25-34 23.5 21.6 24.1 35-44 27.2 22.2 27.3 45-54 22.8 25.7 22.8 55-64 10.2 21.7 12.1 65+ 6.0 6.4 6.7
Race/Ethnicity White, not Hispanic 83.9 75.4 82.6 Black, not Hispanic 5.2 6.7 5.6 Hispanic 5.4 5.2 5.3 Other, not Hispanic 5.5 12.7 6.5
Education HS grad or less 15.7 2.5 8.3 Some college (incl. certificates/2-yr. degree) 29.7 12.4 26.9 Bachelors degree 38.6 41.5 45.0 Graduate degree (Masters+) 15.9 43.7 19.8
Region Northeast (minus NY) 12.3 10.4 12.9 Midwest 19.2 17.2 21.1 South 29.4 7.8 21.1 West (Minus CA) 10.9 13.9 12.8 CA 17.6 19.0 19.0 NY 10.6 31.7 13.2

LOCAL REPORT ON THE FINDINGS – ARTISTS AND THE ECONOMIC RECESSION SURVEY – FEBRUARY 2010 PRINCETON SURVEY RESEARCH ASSOCIATES INTERNATIONAL
49
MAIN SURVEY RESPONSE For this survey, the response rate is defined simply as the proportion of sampled artists who completed the survey. Overall 5.7% of the sample responded to the survey.3 Survey response varied across participating organizations. The maximum response came from Community Partnership of Arts and Culture (CPAC) where 40.4% of the membership list participated in the survey while a minimum response of .1% came from the Japanese American Cultural and Community Center.4 Table 3 summarizes response across the participating organizations.
3 The two organizations that agreed to participate that yielded no completes and for which sample sizes were
unknown were excluded from response rate calculations. 4 Unlike the other participating arts organizations, ‘ArtHome’ did not send out any email invitations to its membership
list. Instead, an ArtHome executive completed the survey.

LOCAL REPORT ON THE FINDINGS – ARTISTS AND THE ECONOMIC RECESSION SURVEY – FEBRUARY 2010 PRINCETON SURVEY RESEARCH ASSOCIATES INTERNATIONAL
50
TTaabbllee 33:: RReessppoonnssee RRaatteess ((MMaaiinn SSuurrvveeyy))
State Sample Size No. of completes
Response Rate
ArtHome NY 1 1 100.0% Community Partnership of Arts & Culture (CPAC) OH 314 127 40.4% Washington State Arts Commission WA 272 99 36.4% The Charlotte Street Foundation MO 320 98 30.6% Creative Capital NY 400 115 28.8% Pew Fellowships in the Arts PA 706 156 22.1% First Peoples Fund SD 55 11 20.0% The Boston Foundation MA 61 12 19.7% Houston Arts Alliance TX 150 29 19.3% Arts Council of Metropolitan Kansas City KS 877 154 17.6% National Performance Network, Inc. (NPN) LA 256 44 17.2% Alaska State Council on the Arts AK 250 40 16.0% Rasmuson Foundation AK 700 107 15.3% Montana Arts Council MT 1,500 202 13.5% The Longhouse Education and Cultural Center of Evergreen State College WA 600 70 11.7% Cultural Development Corp. DC 1,500 163 10.9% Stockton Rush Bartol Foundation PA 700 72 10.3% NY Dept. of Cultural Affairs (New York DCA) NY 4,589 459 10.0% Center for Cultural Innovation (CCI) CA 5,000 496 9.9% Alternate ROOTS GA 673 54 8.0% The Richard H. Driehaus Foundation IL 150 12 8.0% Artist Trust WA 2,855 216 7.6% Alliance for California Traditional Arts CA 1,747 131 7.5% Durfee Foundation CA 2,500 172 6.9% Diaspora Vibe Cultural Arts Incubator FL 145 9 6.2% Chicago Dept. of Cultural Affairs (Chicago DCA) IL 12,000 513 4.3% The Actors Fund NY 9,624 394 4.1% Massachusetts Cultural Council MA 500 19 3.8% DiverseWorks TX 1,300 48 3.7% New York State Council on the Arts (NYSCA) NY 22,200 814 3.7% Fractured Atlas NY 1,000 36 3.6% Queens Council on the Arts NY 2,500 82 3.3% Leeway Foundation PA 6,915 223 3.2% MusicCares Foundation CA 3,100 98 3.2% Movimiento de Arte y Cultura Latino Americana (MACLA) CA 2,724 76 2.8% Asian Arts Initiative PA 1,556 19 1.2% Miami Light Project FL 4,408 17 0.4% Japanese American Cultural & Community Center CA 1,200 1 0.1% TOTAL 95,348 5,389 5.7%

LOCAL REPORT ON THE FINDINGS – ARTISTS AND THE ECONOMIC RECESSION SURVEY – FEBRUARY 2010 PRINCETON SURVEY RESEARCH ASSOCIATES INTERNATIONAL
51
Attachment A Below is the initial email invitation that was sent to all sampled artists in the main survey:
Greetings,
How are you being affected by the global recession? As an artist, the conditions you face in this current economic climate should be heard and addressed.
You are among a select group of artists being asked to participate in the Artists and the Economic Recession Survey. The survey is being conducted by Leveraging Investments in Creativity (LINC), a ten-year national initiative to improve conditions for artists. «Organization Name» is working with LINC and other organizations around the country to distribute the survey. Your input about your experiences will add immense value to the study. The survey is being supervised by Princeton Survey Research Associates International and is now available online. It will take about 15 minutes to complete and is offered in both English and Spanish. If you complete the survey, you will have the opportunity to enter a drawing for one of four $100 prizes.
Please click on the link below to complete the survey or type the survey website address in your browser. Once you are on the survey page, enter your User Name to begin the survey.
Survey web site: http://survey.confirmit.com/wix/p938893825.aspx
Your User Name: «userid»
Your participation in our survey is completely voluntary. If you have any questions about this survey, please contact [email protected].

LOCAL REPORT ON THE FINDINGS – ARTISTS AND THE ECONOMIC RECESSION SURVEY – FEBRUARY 2010 PRINCETON SURVEY RESEARCH ASSOCIATES INTERNATIONAL
52
A few days into interviewing, artists were then sent an email reminder, encouraging them to take the survey if they had not already done so:
Greetings,
Recently we sent you an email asking you to participate in the Artists and the Economic Recession Survey. So far almost 4,000 artists have completed surveys nationwide, and we want to make sure we’ve heard from you too! Your input is critical to our understanding of the experiences and needs of artists at this time. If you have not yet had a chance to take the survey, it is not too late!
Please click on the link below to complete the survey or type the survey website address in your browser. Once you are on the survey page, enter your User Name to begin the survey.
Survey web site: http://survey.confirmit.com/wix/p938893825.aspx
Your User Name: «userid»
The survey is being conducted by Leveraging Investments in Creativity (LINC), a ten-year national initiative to improve conditions for artists. «Organization Name» is working with LINC and other organizations around the country to distribute the survey. The survey is being supervised by Princeton Survey Research Associates International and is now available online. It will take about 15 minutes to complete and is offered in both English and Spanish. If you complete the survey, you will have the opportunity to enter a drawing for one of four $100 prizes.
Your participation in our survey is completely voluntary. If you have any questions about this survey, please contact [email protected].

LOCAL REPORT ON THE FINDINGS – ARTISTS AND THE ECONOMIC RECESSION SURVEY – FEBRUARY 2010 PRINCETON SURVEY RESEARCH ASSOCIATES INTERNATIONAL
53
APPENDIX 2B: SNOWBALL SURVEY METHODOLOGY
Detailed Survey Methodology
Artists and the Economic Recession – A Snowball Survey
Prepared by Princeton Survey Research Associates International for Helicon Collaborative and Leveraging Investments in Creativity
January 2010
SUMMARY The Artists and the Economic Recession Survey, jointly sponsored by Helicon Collaborative and Leveraging Investments in Creativity (LINC), obtained interviews with a snowball sample of 1,563 practicing artists. In order to reach beyond the artists listed on LINC’s and its partner organizations’ email lists, which were used to build the sample for the main survey, LINC and Helicon created a “snowball survey” that was disseminated virally through artists’ own networks. The survey was jointly supervised by Helicon Collaborative and Princeton Survey Research Associates International (PSRAI). Data were collected via online English- or Spanish-language administration from August 19 to November 23, 2009. Statistical results are not weighted.
Details on the design and execution of the survey are discussed below.
DESIGN AND DATA COLLECTION PROCEDURES
Sample Design The snowball sample consisted of a self-selection procedure where LINC began by inviting artists who had not been selected for the main survey and then asked those artists to forward the survey web address to other artists in their network, and so on. To further encourage dissemination, LINC developed a widget that periodically updated itself with new data from the snowball survey and could be posted on any website. LINC also developed a Facebook application to distribute the survey information. The questions asked in this snowball effort were identical to ones asked in the main survey.
The snowball survey data were kept separate from the main survey data in order to enable the main survey data to be statistically validated and also to allow comparison of the two surveys – that is, to see whether this snowball dissemination method would actually reach a cohort of artists with substantially different characteristics and needs than those of participants in the main survey. Helicon programmed this snowball survey using the Zoomerang survey hosting website.

LOCAL REPORT ON THE FINDINGS – ARTISTS AND THE ECONOMIC RECESSION SURVEY – FEBRUARY 2010 PRINCETON SURVEY RESEARCH ASSOCIATES INTERNATIONAL
54
Contact Procedures Data were collected from August 19, 2009 to November 23, 2009. Emails were sent by LINC to artists and arts organizations that were not included in the main survey sample, asking them to take the survey and forward it to other artists they know. All email communications contained a link to the Zoomerang web survey, named LINC as the survey sponsor and identified PSRAI as the research partners. A copy of the email invitation can be found in Attachment B of this methodology.5
Since respondents were allowed to skip questions without answering them, only cases with at least 70% of the substantive questions answered were considered completed interviews. Cases for which less than 70% of the questions were answered were not included in the data for analysis.
At the end of each interview, respondents were given the opportunity to enter their contact information into a drawing for one of four $100 prizes. Drawings and prize disbursements were handled by LINC.
5 To launch the snowball survey, LINC distributed email invitations to both individual artists and arts organizations.
Attachment B is the email invitation that was sent to individual artists.

LOCAL REPORT ON THE FINDINGS – ARTISTS AND THE ECONOMIC RECESSION SURVEY – FEBRUARY 2010 PRINCETON SURVEY RESEARCH ASSOCIATES INTERNATIONAL
55
Attachment B Below is the email invitation that was disseminated for the snowball survey:
Dear <NAME>:
As you may know, LINC in partnership with Helicon Collaborative and Princeton Research Survey Associates has been conducting a survey to poll the experiences of individual artists within the recession. Thanks to the efforts of organizational partners from across the country who helped to spread the word, over 5000 artists have already responded…but we know there are more voices who have not yet weighed in.
To ensure that a wide range of artists have the opportunity to register both the successes and challenges they have experienced in this current economic climate, we are hoping for your help.
Would you be willing to send the survey to every artist you know and ask them to do the same?
Our goal is to expand the distribution of this survey far and wide. We are especially interested in reaching artists who may not be part of formal organizational networks but who are no less on the frontlines of creative workforce. To aid this process, we are including a url to the survey here:
http://www.zoomerang.com/Survey/?p=WEB229J8EUDWA8
Shortly, we will also forward a widget that can be posted on your website, blog, or Facebook page. The widget not only links folks to the survey directly, but will also update automatically with current statistics pulled from the survey itself.
Please feel free to distribute the survey far and wide to all the artists in your network. Our only request is that you confirm your participation by sending a message to [email protected] by September 4. (This is for statistical purposes only.) Participation in the survey itself is anonymous, and LINC will only contact those participants who have requested a free copy of the report findings which will be available by pdf to anyone who participates.
Thank you in advance!

LOCAL REPORT ON THE FINDINGS – ARTISTS AND THE ECONOMIC RECESSION SURVEY – FEBRUARY 2010 PRINCETON SURVEY RESEARCH ASSOCIATES INTERNATIONAL
56
APPENDIX 3: PROFILE OF NATIONAL ARTISTS FROM THE MAIN SURVEY BY ART FORM
Demographic Profile of Artists Surveyed by Art Form
Artists and the Economic Recession – A National Survey
Prepared by Princeton Survey Research Associates International for Helicon Collaborative and Leveraging Investment in Creativity
September 2009
For the purposes of the Artist and the Economic Recession Survey, artists surveyed were categorized into nine disciplines based on self-reported art form or forms they practice for a significant amount of time on a weekly basis: 1) visual artist (painter, sculptor, craft artist, etc.); 2) media artist (filmmaker, photographer, video-maker, animator, digital media artist, etc.); 3) musician (composer, instrumentalist, singer, conductor, DJ/mixer, producer, etc.); 4) actor or director; 5) literary artist (fiction and non-fiction writers, playwrights, screenwriter, poet, storyteller, journalist, etc.); 6) designer (lighting, scenography, costume, fashion, graphic, commercial, industrial, game, interior, floral, etc.); 7) dancer or choreographer; 8) performance artist; 9) architect. For the survey analysis, certain similar categories of artists were combined because of the relatively small numbers of artists that chose those art forms as ones on which they regularly spend a significant amount of time. Specifically, “dancer or choreographer” and “performance artist” are combined, and “designer” and “architect” are combined.6
The demographic profile of artists by discipline is provided as an easy reference tool for the readers of this report. Because the results are not based on a random sample of practicing artists in the U.S., the demographic profile is truly representative only of those artists surveyed. Because of the sampling process, the types of artists that ultimately participated in the survey may not reflect the actual distribution across disciplines of the entire population of practicing artists in the United States. At the same time, the weighting applied to the main survey data prevents any one group of artists from having too much influence on the results and helps to ensure that comparisons by discipline, like other key variables, are valid.
(See Table A on the following page.)
6 Artists were also allowed to specify a type of art form not listed in the survey.

LOCAL REPORT ON THE FINDINGS – ARTISTS AND THE ECONOMIC RECESSION SURVEY – FEBRUARY 2010 PRINCETON SURVEY RESEARCH ASSOCIATES INTERNATIONAL
57
TTaabbllee AA:: AA DDeemmooggrraapphhiicc PPrrooffiillee ooff AArrttiissttss SSuurrvveeyyeedd bbyy SSeellff--RReeppoorrtteedd AArrtt FFoorrmm ((MMaaiinn SSuurrvveeyy))
TOTAL Actor/
Director
Dancer/ Choreographer/
Performance Artist
Media Artist Musician
Visual Artist
Literary Artist
Designer/ Architect
Number of Interviews 5,389 538 383 622 582 2,328 567 182
% % % % % % % % Sex
Male 50 48 33 55 72* 47 45 57 Female 46 49 62* 42 25 50 49 41
Age Under 18/18-24 6 16* 10 9 4 4 4 7 25-34 23 35* 37* 27 20 19 16 25 35-44 26 23 25 28 29 24 30 36 45-64 34 21 21 31 40* 39 35 24 65+ 6 3 4 3 4 9* 9* 6
Education College graduates (incl. post-graduates) 62 75* 62 68 49 61 63* 68* Some college/ Conservatory 26 20 27 22 36* 26 27 24 No college 8 3 48 7 13* 9 4 6
Income $40,001 or more 31 25 26 31 32 31 29 42 $20k-$40,000 32 39 38 34 31 30 31 26 $20,000 or less 30 33 30 28 29 32 31 28
Race White/Caucasian 78 82 68 77 76 80 77 76 African-American/ African descent 5 6 9 6 9 3 7 7 Asian/Asian-American/ Pacific Islander 2 3 5 2 2 1 1 2 Latino/Hispanic /Chicano 5 4 6 6 5 5 5 9 Multi-racial/Other7 4 3 4 4 3 5 4 3
Region Northeast 26 29 25 32 28 21 34 25 Midwest 21 9* 18 22 15 27* 16 32* South 21 38* 28 16 26 17 17 6* West 32 24 29 30 31 35 33 36
Years a Practicing Artist 0-10 31 39 29 46 12* 30 32 35 11-20 30 32 38 27 29 28 31 38 21+ 39 29 33 27 58* 41* 37 27
Note: An asterisk indicates a * that is significantly higher/lower than * for that same category, compared with most or all other categories of artists.
7 Racial/ethnic groups in the “other” category are Native American, Native Alaskan and Native Hawaiian. The
relatively small numbers of interviews collected among these racial/ethnic groups separately make results from them less reliable than others and so they are not treated as separate groups in analysis.

LOCAL REPORT ON THE FINDINGS – ARTISTS AND THE ECONOMIC RECESSION SURVEY – FEBRUARY 2010 PRINCETON SURVEY RESEARCH ASSOCIATES INTERNATIONAL
58
APPENDIX 4: ZIP CODES IN THE BAY AREA
Detailed List of Zip Codes in the Bay Area
Artists and the Economic Recession – Main and Snowball Surveys
Prepared by Princeton Survey Research Associates International for Helicon Collaborative and Leveraging Investments in Creativity
January 2010
For the purposes of the Artist and the Economic Recession Survey, artists surveyed were categorized as Bay Area sample if they self-reported living or working in a zip code within the Bay Area. A list of zip codes that define the Bay Area can be seen in the table that follows (See Table B on the following page):

LOCAL REPORT ON THE FINDINGS – ARTISTS AND THE ECONOMIC RECESSION SURVEY – FEBRUARY 2010 PRINCETON SURVEY RESEARCH ASSOCIATES INTERNATIONAL
59
TTaabbllee BB:: AA DDeettaaiilleedd LLiisstt ooff ZZiipp CCooddeess UUsseedd ttoo DDeeffiinnee tthhee BBaayy AArreeaa
Column 1
Column 2
Column 3
Column 4
Column 5
Column 6
Column 7
Column 8
Column 9
Column 10
Column 11
94002 94064 94125 94188 94527 94570 94620 94903 94974 95071 95140
94005 94065 94126 94199 94528 94572 94621 94904 94976 95101 95141
94010 94066 94127 94301 94529 94575 94622 94912 94977 95103 95148
94011 94070 94128 94302 94530 94577 94623 94913 94978 95106 95150
94013 94074 94129 94303 94531 94578 94624 94914 94979 95108 95151
94014 94080 94130 94304 94536 94579 94649 94915 94998 95109 95152
94015 94083 94131 94305 94537 94580 94659 94920 95002 95110 95153
94016 94085 94132 94306 94538 94582 94660 94924 95008 95111 95154
94017 94086 94133 94309 94539 94583 94661 94925 95009 95112 95155
94018 94087 94134 94401 94540 94586 94662 94929 95011 95113 95156
94019 94088 94137 94402 94541 94587 94666 94930 95013 95115 95157
94020 94089 94139 94403 94542 94588 94701 94933 95014 95116 95158
94021 94101 94140 94404 94543 94595 94702 94937 95015 95117 95159
94022 94102 94141 94497 94544 94596 94703 94938 95020 95118 95160
94023 94103 94142 94501 94545 94597 94704 94939 95021 95119 95161
94024 94104 94143 94502 94546 94598 94705 94940 95026 95120 95164
94025 94105 94144 94505 94547 94601 94706 94941 95030 95121 95170
94026 94107 94145 94506 94548 94602 94707 94942 95031 95122 95172
94027 94108 94146 94507 94549 94603 94708 94945 95032 95123 95173
94028 94109 94147 94509 94550 94604 94709 94946 95035 95124 95190
94030 94110 94151 94511 94551 94605 94710 94947 95036 95125 95191
94035 94111 94153 94513 94552 94606 94712 94948 95037 95126 95192
94037 94112 94154 94514 94553 94607 94720 94949 95038 95127 95193
94038 94114 94156 94516 94555 94608 94801 94950 95042 95128 95194
94039 94115 94158 94517 94556 94609 94802 94956 95044 95129 95196
94040 94116 94159 94518 94557 94610 94803 94957 95046 95130
94041 94117 94160 94519 94560 94611 94804 94960 95050 95131
94042 94118 94161 94520 94561 94612 94805 94963 95051 95132
94043 94119 94162 94521 94563 94613 94806 94964 95052 95133
94044 94120 94163 94522 94564 94614 94807 94965 95053 95134
94060 94121 94164 94523 94565 94615 94808 94966 95054 95135
94061 94122 94171 94524 94566 94617 94820 94970 95055 95136
94062 94123 94172 94525 94568 94618 94850 94971 95056 95138
94063 94124 94177 94526 94569 94619 94901 94973 95070 95139

LOCAL REPORT ON THE FINDINGS – ARTISTS AND THE ECONOMIC RECESSION SURVEY – FEBRUARY 2010 PRINCETON SURVEY RESEARCH ASSOCIATES INTERNATIONAL
60
Any artist who lives or works in any of the above zip codes is considered a Bay Area artist. The following map pictorializes the geographic locations of the 456 Bay Area artists who participated in the study, pinpointed by self-reported zip code.