century artists’ oil paints: a chemical-physical survey
TRANSCRIPT

Università Ca’ Foscari Venezia
Scuola di dottorato in Scienze e Tecnologie
Dottorato di Ricerca in Scienze Chimiche XXIII ciclo
20TH CENTURY ARTISTS’ OIL PAINTS:
A CHEMICAL-PHYSICAL SURVEY
Tesi di Dottorato di
FRANCESCA CATERINA IZZO Matricola 955473
Direttore della Scuola di Dottorato: Prof. Paolo Ugo
Tutor: Prof. Guido Biscontin
Anno accademico 2009-2010
Settore scientifico-disciplinare di afferenza: CHIM/12

CONTENTS
page
AIM OF THE THESIS 1
CHAPTER 1: INTRODUCTION TO THE 20TH CENTURY ARTISTS’ OIL PAINTS
2
1.1.Review on studies and researches on artists’ oil paint 2 1.1.1 Introduction to lipidic binders in paint technology 3 1.1.2 Composition of traditional drying oils 4 1.1.3 Drying oils refining treatments 7 1.1.4 Drying mechanisms 8 1.1.5 Ageing and degradation 13 1.1.6 Oil paints 15 1.1.7 The role of pigments and driers 16 1.1.8 The presence of anti-oxidants 16
1.2 Modern and contemporary oil paints 17 1.2.1 The industrialisation of artists’ oils 18 1.2.2 The invention of the collapsible tube for oil paints 18 1.2.3 Drying, semi- and non-drying oils in industrial formulations 19 1.2.4 Oil processing and refining treatments 22 1.2.5 Additives in modern oil formulations 23 1.2.6 The personal touch of the artist 25
1.3 The state of the art of the studies on modern and contemporary oils 27 1.4 The goals of the current study 28
CHAPTER 2: INVESTIGATION TECHNIQUES 32
2.1 Introduction 33 2.2 Techniques 33
2.2.1 Fourier Transform-Infra Red Spectrometry (FT- IR) 33 2.2.2. X-Ray-Fluorescence (XRF) Spectrometry 34 2.2.3 Thermal analyses 35 2.2.4 Gas Chromatography-Mass Spectrometry (GC-MS) 35 2.2.5 Solubility and extraction tests 37 2.2.6 Accelerated ageing 39 2.2.7 Multivariate statistical analysis 39

CHAPTER 3: MATERIALS AND METHODS
41
3.1 Reference oil paints: reconstructions 41 3.2 Manufactured oil paints 44 3.3 Analytical techniques: experimental conditions and instrumental details
49
3.3.1 Fourier Transform-Infra Red Spectrometry (FT- IR) 49 3.3.2. X-Ray-Fluorescence (XRF) Spectrometry 49 3.3.3 Thermal analyses 49 3.3.4 Accelerated ageing 49 3.3.5 Solubility and extraction tests 50 3.3.6 Gas Chromatography-Mass Spectrometry (GC-MS) 50
3.4 Improvement of a gas chromatography-mass spectrometric methodology for 20th century artists’ oil paints
51
3.4.1 State of the art of GC-MS analysis on artists’ oils 51 3.4.2 Choice of the reagent 52
CHAPTER 4: RESULTS
73
4.1 Reconstructions 73 4.1.1 Observations during film preparation, casting and drying 74 4.1.2 FT-IR studies 77 4.1.3 Thermal analyses 85 4.1.4 GC-MS investigations 93
4.2 Manufactured oil paints 112 4.2.1 Royal Talens 112 4.2.2 Old Holland 118 4.2.3 Claus&Fritz 121 4.2.4 Haagsche Kunstschilderveven Fabriek (HKF) 123 4.2.5 Gimborn 125 4.2.6 Winsor&Newton (W&N) 127 4.2.7 Maimeri 132 4.2.8 Le Franc 137
4.3 Multivariate statistical analysis 139 4.4 Summary 143
CHAPTER 5: CASE STUDIES 144
5.1 Introduction 144 5.2 Olii, Fine di Dio and Concetto Spaziale by Lucio Fontana 146 5.3 Jasper Johns, Untitled 1964-65, 1965 162 5.4 Karen Appel, La Grande Fleur de la Nuit, 1954 171 5.5 Willem De Kooning, Rosy-Fingered Dawn at Louse Point, 1963 178 5.6 Salvador Dalì, Landscape with girl skipping a rope, 1936 183 5.7 Isabel Lambert-Rawsthorne, Male Baboon, c.1950 186 5.8 Ethel Walker, Models resting, c.1950 191 5.9 F. Breton, Three Urchin Boys, c.1920 199

5.10 Summary 204
CONCLUDING REMARKS & FUTURE PERSPECTIVES 205
GLOSSARY 207
BIBLIOGRAPHY
210
ACKNOWLEDGEMENTS 226

AIM OF THE THESIS
This thesis wishes to contribute to a better understanding of the chemical-physical aspects of the manufactured formulation in the 20th century artists’ oil paints. When we talk about modern and contemporary art, the attention of speaker and audience is focused on the aesthetic appeal, the inner meaning and the artist’s intentions in producing the work of art. According to a romantic-idealistic concept of Art, the painting techniques have been usually just mentioned, without taking into consideration the deep link between Art creation and choice of materials and techniques. In this vision, the contents and the messages conveyed by the art object neglect the material aspect. But as far as for ancient production, modern and contemporary art should be investigated in order to know more about its technology. This is of fundamental importance for most aspects of conservation of the works of art, since it has been noticed that modern art already needs restoration treatments. And that means, of course, conservation of the Idea, conservation of the Creativity and conservation of the Materials. The knowledge of 20th century art technology is also essential to understand the relation between (art)society and industry and the development of technological aspects. In recent years the synthetic media introduced in the art market around the 1930-50s have been more and more studied, while artists’ oils are in most cases still considered “traditional” painting materials and mistaken for them. On the contrary oil paints have experienced new production methods from the late 18th century and their developments should be studied as well. Moreover very vague labels have been used to design modern and contemporary artistic techniques: “oil”, “synthetic medium”, “mixed technique” are very general terms. This study aims to provide a piece of information in the complex world of contemporary oil paints, in which many subjects (technology, industry, tradition and art) have an essential role.

CHAPTER 1
INTRODUCTION TO THE 20TH CENTURY ARTISTS’ OIL PAINTS
Abstract This chapter provides an introduction to artists’ oil paints, discussing briefly traditional oils and focusing on modern and contemporary formulations. It starts with a review of the literature on traditional drying oils, describes their composition and outlines the reactions which occur during curing. In particular, a description o the chemistry of drying and ageing of linseed oil is given. It then overviews chemical and technological innovations anddevelopments in artists’ oil paint manufacture during 19th-20th century, pointing out the differences between traditional hand-making and manufactured production of oil colours. The state of the art of previous researches on contemporary oil paints is presented with afocus on recent results from the Modern Oil Paints Project.
f
t f r
r
The last part is reserved to the aims and the goals of the current research, with the hope that this thesis could enrich he knowledge about modern oil o mulations and behaviours. 1.1 REVIEWS ON STUDIES AND RESEARCHES ON TRADITIONAL ARTISTS’ OIL PAINTS In the last one-hundred years many studies have been dedicated to the properties, the chemical and physical processes and the ageing of traditional oils, linseed oil being the most investigated. Pioneering researches date back to the 1850s, when a more scientific and industrial approach was also adopted on the manufacture of artists’ oil paints (see Chapter 1.2). The German Journal Technische Mitteilungen fü Malerei, which was first published in 1884 by Adolf Keim, contains much technical information about painting materials and techniques used by contemporary artists; in particular, it provides good
2

examples of studies about oils and drying processes through multidisciplinary discussions between chemists, artists and restorers [van den Berg K. J., 2008]. From there onwards, even more researches on drying oils have been performed and very important results have been achieved thanks, in particular, to the availability of modern and innovative analytical instrumentation. The brief summary which follows does not have the pretention to explain everything about drying oils, the technology of producing drying oils and the processes occurring during drying (although not everything is completely known!), but simply gives an idea of the complicated paints systems, in which oil medium and pigments are not the only actors.
1.1.1 Introduction to lipidic binders in paint technology Since remote times, drying oils have been used as painting media because of their main property: they solidify over time and bind pigments permanently to the ground. The first use of a drying oil recalls ancient civilisations, such as Egyptians and Greeks [Piva G., 1985]: vegetal oils, such as linseed, walnut or poppy seed oils were known to them, but no precise indication on regarding their use in painting can be found. We owe the first written source about the preparation of linseed oil to a medical writer called Aetius in the 5th century [Laurie A. P., 1910]. Besides, more detailed and famous manuscripts and treatises illustrated and taught artists on how to deal with pictorial materials. The German monk Theophilus wrote his treatise in the 12th century [Marrifield M. P., 1967], while in the 14th century Cennino Cennini presented a new painting procedure with tempera and oil media [Cennino C., 2004]. Moreover, Giorgio Vasari (1511-1574) in his Le vite de piu eccelenti pittori, scultori e architetti, [Vasari G., 1568] declared that the technique of painting with oil was invented (or better was re-invented) in Europe around 1410 by the Flemish painter Jan van Eyck (1390-1441). The portrait of Giovanni Arnolfini and his wife (National Gallery, London), painted in 1434 by van Eyck, is considered one of the first and the best example of the new technique. He probably kept the secret almost until his death. After him, the Italian Antonello da Messina (1430-1479) improved the new method by adding a lead oxide (litharge, PbO) in the pigment-oil mixtures: in this way it was discovered that the siccative properties of oil increased. Later on Leonardo da Vinci (1452-1519) and several Italian painters also improved this technique, which was still kept secret in the ateliers. Finally, Rubens went to Italy to study the Masters’ techniques and their material and made his own improvements in oil painting. Since then, oil painting technology has remained unaltered, except slight modifications, as this sentence by Maroger claims: "Painting had received a rapid and strong impulsion which finally led to the great painting of the Renaissance. But the technique is not enough alone to create a near perfect art, and many improvements would be yet achieved. Each following generation will bring his brick to the building" [Maroger J., 1948].
3

1.1.2 Composition of traditional drying oils The most common drying oils used in painting are linseed, poppy seed and walnut. These oils are extracted from vegetable seeds: linseed oil from flax (Linum usitatissimum), poppy oil from the seeds of Papaver somniferum and the last from walnuts. The extraction is performed either by solvent extraction or through the pressure method, after cleaning, heating and grinding the seeds. These production methods have been unchanged for centuries [Laisney J., 1996], giving a sense of the importance of the traditional and technological aspects in the preparation of drying oils. Chemically drying oils are mixtures of triacylglycerols (TAG) or triglycerides, which are esters of the trihydric alcohol glycerol (1,2,3-propanetriol) with a range of possible saturated or unsaturated long-chain fatty acids. The variety of fatty acids which can be found in triglycerides after hydrolysis is extremely large: they may be arranged in more than forty possible ways. Researches on the composition of triglycerides in linseed oil outlined the presence of at least one unsaturated fatty acid [Sonntag N., 1979]. Not only the arrangement, but also the proportions and the kinds of fatty acids entering into the triglyceride composition are the direct responsible factors of the physical and chemical properties of an oil. Fatty acids mainly present in drying oils exist in a limited number: they are listed in Table 1.1.
Table 1. 1: The most abundant fatty acids in drying oils, after [Mills J. S., 1987]: *refers to the degree of unsaturation
Systematic name trivial name Formula Short name m.p. (°C)Nonanoic Nonanoic C9H18O2 C9 12.5
Dodecanoic Lauric C12H24O2 C12 44 Tetradecanoic Myristic C14H28O2 C14 54 Hexadecanoic Palmitic C16H32O2 C16 63
9-Hexadecanoic Palmitoleic C16H30O2 C16:1* 0.5 Octadecanoic Stearic C18H36O2 C18 70
9-octadecenoic oleic C18H34O2 C18:1* 16 (cis) 9,12-octadecadienoic linoleic C18H32O2 C18:2* -5
(cis) 9,12,15-octadecatrienoic linolenic C18H30O2 C18:3* -11 Cis,trans,trans-9,11,13-octadecatrienoic α-eleostearic C18H30O2 αC18:3* 49
12-hydroxy-9-octadecenoic ricinoleic C18H34O3 - 5.5
High proportions of the longer saturated fatty acids (C18-C22) result in a melting point above 25 °C, which determines the viscosity of oil at room temperature. The shorter fatty acids (C9-C14) and the longer unsaturated fatty acids (C18:1, C18:2, C18:3 in cis-configuration) with bends in the carbon atom chain produced by the rigid double bonds, do interact and are liquid at room temperature. Consequently, drying oils, as they contain high proportions of unsaturated and shorter fatty acids, are generally liquid.
4
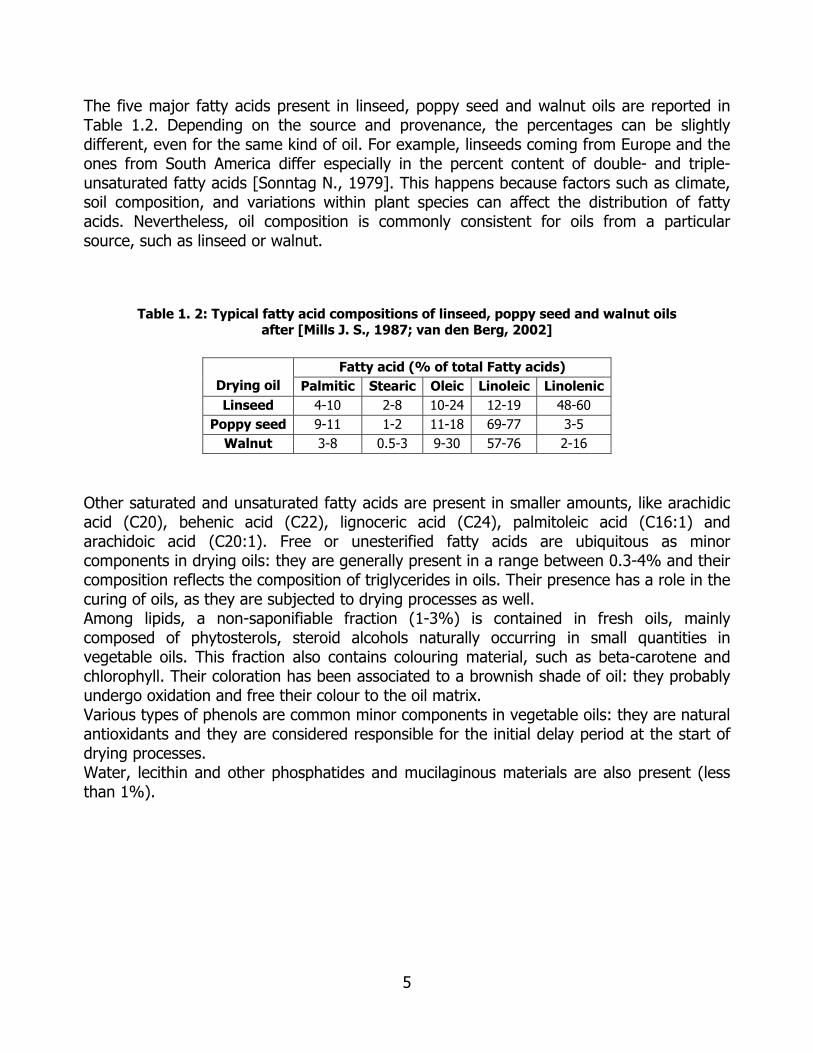
The five major fatty acids present in linseed, poppy seed and walnut oils are reported in Table 1.2. Depending on the source and provenance, the percentages can be slightly different, even for the same kind of oil. For example, linseeds coming from Europe and the ones from South America differ especially in the percent content of double- and triple-unsaturated fatty acids [Sonntag N., 1979]. This happens because factors such as climate, soil composition, and variations within plant species can affect the distribution of fatty acids. Nevertheless, oil composition is commonly consistent for oils from a particular source, such as linseed or walnut.
Table 1. 2: Typical fatty acid compositions of linseed, poppy seed and walnut oils after [Mills J. S., 1987; van den Berg, 2002]
Fatty acid (% of total Fatty acids)
Drying oil Palmitic Stearic Oleic Linoleic Linolenic Linseed 4-10 2-8 10-24 12-19 48-60
Poppy seed 9-11 1-2 11-18 69-77 3-5 Walnut 3-8 0.5-3 9-30 57-76 2-16
Other saturated and unsaturated fatty acids are present in smaller amounts, like arachidic acid (C20), behenic acid (C22), lignoceric acid (C24), palmitoleic acid (C16:1) and arachidoic acid (C20:1). Free or unesterified fatty acids are ubiquitous as minor components in drying oils: they are generally present in a range between 0.3-4% and their composition reflects the composition of triglycerides in oils. Their presence has a role in the curing of oils, as they are subjected to drying processes as well. Among lipids, a non-saponifiable fraction (1-3%) is contained in fresh oils, mainly composed of phytosterols, steroid alcohols naturally occurring in small quantities in vegetable oils. This fraction also contains colouring material, such as beta-carotene and chlorophyll. Their coloration has been associated to a brownish shade of oil: they probably undergo oxidation and free their colour to the oil matrix. Various types of phenols are common minor components in vegetable oils: they are natural antioxidants and they are considered responsible for the initial delay period at the start of drying processes. Water, lecithin and other phosphatides and mucilaginous materials are also present (less than 1%).
5

H2C O
HC
C
H2C
OR1
O CO
R2
O R3
O
Generic triglyceride
OHOHHO
O
OH
Glycerol Linolenic acid
COOH
O
OH
Linoleic acid Oleic acid
OH
O
OH
O
Stearic acid Palmitic acid
Figure 1. 1: graphical representations of a generic triglyceride and the major constituents of
drying oils The ability of oils to dry (also defined as siccativity) is the capability of polymerising and forming a semi-solid film and is linked to the presence (or not) of unsaturated fatty acids. Precisely, when it contains at least 66% of unsaturated fatty acids, an oil is considered siccative: in theory an oil should contain at least 66% of only linoleic acid, but in practice both linoleic and linolenic contribute to the sum of the degree of unsaturation [Mills J. S, 1987]. Linseed oil, for example, contains less than 20% of linoleic acid but more than 50% of linolenic acid, while linoleic acid is present in more than 70% in poppy seed oil. The siccativity is also related to the drying index, expressed as follows:
D.I.= (% linoleic acid) + 2 (% linolenic acid)
For drying oils the D.I. is generally greater than 70 [van den Berg J.D., 2002].
6

On the contrary, semi-drying oils form a tacky film and non-drying oils are not able to form a viscous film. This is the case of, respectively: cottonseed oil and castor oil (which contains approximately only 5% of polyunsaturated fatty acids). The siccativity of an oil is also defined by the iodine value (I.V.), that is to say the measure of the degree of unsaturation of oils, fats, or waxes and corresponds to the grams of iodine necessary to saturate the double bonds: according to this definition, for drying oils I.V.>140 for semi-drying oil is 125<I.V.<140 for non-drying oils I.V.<125 Drying oils are also classified as non-conjugated and conjugated oils: this distinction depends on whether double bonds can be separated by a methylene group or not. Conjugated linoleic acids (CLA) are a family of isomers of linoleic acid; as the name implies, the double bonds of CLAs are conjugated, with only one single bond between them. Tung oil (also called Chinese wood oil or simply wood oil) is an oil composed of about 80% of alfa-eleostearic acid (Figure 1.2), which is a conjugated linolenic acid (CLnA). Moreover, since the degree of unsaturation is quite high, Tung oil has good properties as a drying oil and it has been used for centuries as principal component of finishes for wooden objects (such as altarpieces, musical instrument, etc).
Figure 1. 2: alpha- eleostearic acid
1.1.3 Drying oils refining treatments Many of the physical, chemical, and optical properties of oil paints prepared are influenced by the processing and treatments which oils are subjected to. After extraction from seeds, oils are usually purified and/or submitted to heat treatments. Several handbooks for artists [Mayer R., 1940; Doerner M., 1945] documented that these refining operations are necessary to achieve good quality oil paint: all the materials which could show negative aspects in the oil production and/or in drying processes, must be eliminated or at least reduced drastically. Different production technologies and refining methods in oil preparation lead to differentiate into three main categories of oils:
7

1. Raw or cold-pressed oils: the procedure consists of warming up the crude oil slightly and then let it rest in order to allow mucilaginous material to sediment. The oil obtained after purification has a pale colour and used as highest-quality medium for oil paint. The film ages properly and maintains a rather good flexibility.
2. Oils heated in presence of oxygen: the oil is thickened or bodied through oxidation by blowing air into the oil or heated with driers and thickened. This method leads to the creation of a viscous and heavy oil medium.
3. Oils heated in absence of oxygen or stand oil: this is the name given to a drying oil which is refined by heating it at 300°C in anaerobic condition. This causes the oil to pre-polymerize, making it effectively thicker.
1.1.4 Drying mechanisms Physically the hardening of drying oils consists of the change of oils into dry, (semi)solid, hard, resinous material with good mechanic and optic properties, that is to say the paint film [Wexler H., 1964]. Chemically, the drying process involves the radical polymerisation which is conveyed by two fundamental factors: oxygen and heat. Both lead to the formation of the allylic radical which is the first and the main responsible of the drying of oils [De Lucchi O., 2010]. The reactivity of the double bonds –C=C- towards oxygen and heat is fundamental in the transformations occurring during drying. To better understand the extreme reactivity of double bonds, some experiments have been carried out on linolenic, linoleic and oleic acid. Figure 1.3 illustrates linolenic acid behaviour after being subjected to an oxygen flux at 110°C for a certain amount of hours (1,2,4,8 hrs). This O2 and heat treatment show that after only 8 hours under experimental conditions, C=C bounds in linolenic acid have reacted with oxygen leading to the formation of hydroperoxides (OOH) and peroxides (OO). These sub-products are the ones which determine the radical-chain reactions propagation. As a matter of fact, the mechanism of drying is the consequence of free radical-chain reactions, which are influenced by many factors, such as: the availability of oxygen, thermal treatments, the influence of light, the thickness of the oily film, the presence of metallic ions from the pigments, the presence of driers and antioxidants, etc [Mills J. S.,1987]. Given that drying oils are mixtures of complex compounds and that concurrent reactions occur simultaneously (such as polymerisation and degradation reactions), the mechanism of drying is thus very complicated and not fully explainable with simple and uniform reaction schemes. The two mechanisms related to aerobic and anaerobic conditions are described separately in the following chapters.
8

0 hr 2 hrs
4 hrs 8 hrs
Figure 1.3: Total ion current chromatograms of standard linolenic acid (analytical grade) after oxygen- and heat treatment, methylation and GC-MS analysis: GC-MS analyses have been
performed after 0, 2, 4, 8 hours on 2 ul the methylated acid: the highest peak at around 8.90 min refers to the methylated form of linolenic acid; after 8 hours the peaks at 9.45-9.51-9.54-
9.80-9.99 min refer to by-products though oxidation
1.1.4.1 Aerobic mechanism of drying The progressive drying of oils normally occurs in aerobic conditions, that is to say in presence of oxygen. Oxygen can exist in different states: the triplet oxygen (3O2) is the ground state of the oxygen molecule, while the singlet oxygen (1O2) is the excited state. In this chapter only the triplet oxygen will be considered. The reactivity of unsaturated bounds in drying oils and the triplet oxygen is also called radical autoxidation [De Lucchi O., 2010]. Autoxidation is the most important chemical reaction and occurs spontaneously: the double bonds in unsaturated glycerides of linolenic (C18:3), linoleic (C18:2) and oleic (C18:1) acids naturally combine with the oxygen present in the atmosphere and start a chain-reaction. Autoxidative reactions are autocatalytic: as the process starts, the rate of autoxidation increases. Hereinafter, a scheme of possible reactions taking place during drying in aerobic mechanism is provided: initiation, propagation, oxidative polymerisation and degradation are the reaction steps.
9
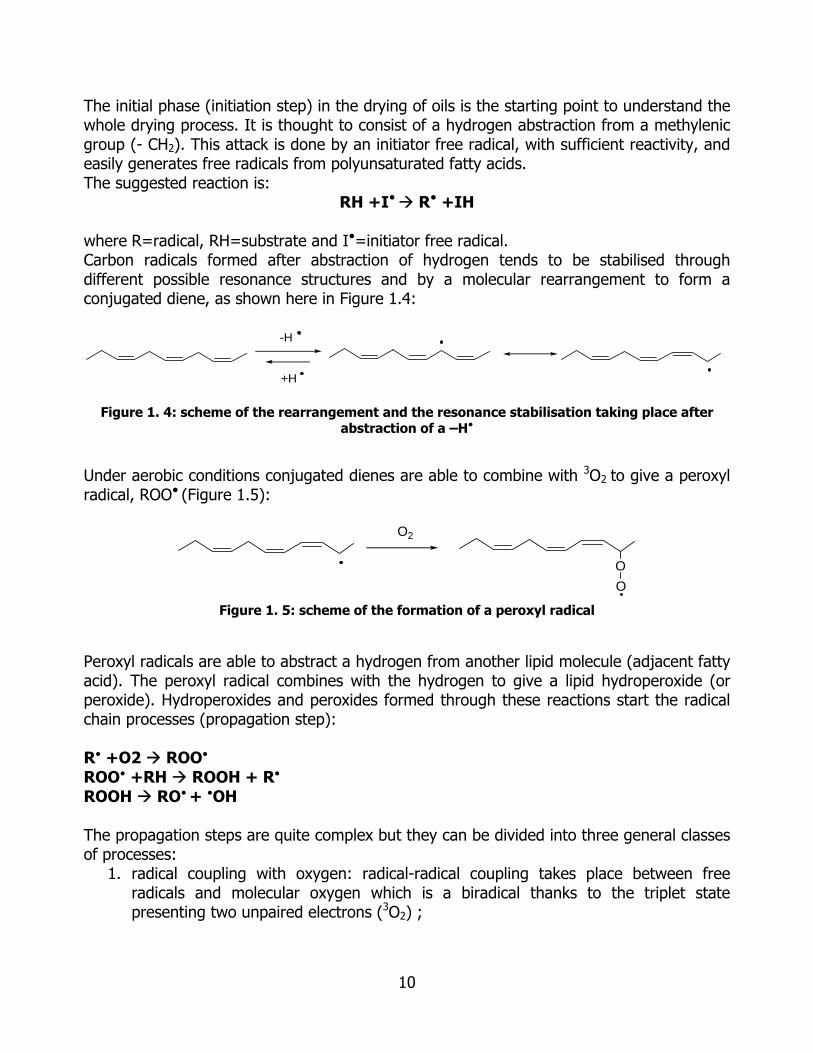
The initial phase (initiation step) in the drying of oils is the starting point to understand the whole drying process. It is thought to consist of a hydrogen abstraction from a methylenic group (- CH2). This attack is done by an initiator free radical, with sufficient reactivity, and easily generates free radicals from polyunsaturated fatty acids. The suggested reaction is:
RH +I● R● +IH
where R=radical, RH=substrate and I●=initiator free radical. Carbon radicals formed after abstraction of hydrogen tends to be stabilised through different possible resonance structures and by a molecular rearrangement to form a conjugated diene, as shown here in Figure 1.4:
-H
+H
Figure 1. 4: scheme of the rearrangement and the resonance stabilisation taking place after abstraction of a –H●
Under aerobic conditions conjugated dienes are able to combine with 3O2 to give a peroxyl radical, ROO● (Figure 1.5):
OO
O2
Figure 1. 5: scheme of the formation of a peroxyl radical
Peroxyl radicals are able to abstract a hydrogen from another lipid molecule (adjacent fatty acid). The peroxyl radical combines with the hydrogen to give a lipid hydroperoxide (or peroxide). Hydroperoxides and peroxides formed through these reactions start the radical chain processes (propagation step): R● +O2 ROO●
ROO● +RH ROOH + R● ROOH RO● + ●OH The propagation steps are quite complex but they can be divided into three general classes of processes:
1. radical coupling with oxygen: radical-radical coupling takes place between free radicals and molecular oxygen which is a biradical thanks to the triplet state presenting two unpaired electrons (3O2) ;
10

2. atom transfer: the atom transfer reaction is caused by the abstraction of hydrogen from the organic substrate by the peroxyl radicals;
3. fragmentation, rearrangement and cyclisation: the peroxyl radicals encounter fragmentation when they are stabylised radicals; then, they rearrange forming allyl radical-dioxygen caged pair; finally an intramolecular ring addition giving 5- or 6-carbon rings. Probable alternative fates of peroxyl radicals are to be transformed into cyclic peroxides or even cyclic endoperoxides (from polyunsaturated fatty acids such as arachidonic or eicosapentaenoic acids) [Alfassi Z. B., 1997]. The peroxyl radical cyclisation plays an important role in the autoxidation process in drying oils containing at least three double bonds [van den Berg J. D., 2002].
Peroxyl groups, which produce very reactive radicals, spark off the second step of the drying process, the oxidative polymerisation. Radicals combine to form cross-linked compounds, as shown in Figure 1.6. At this point, polymerisation yields to the formation of new bonds among the different glyceride molecules, terminating the radical chain reactions (termination step). The time course of fatty acids autoxidation is depicted in Figure 1.7. The results of polymerisation is a three-dimensional cross-linked network (Figure 1.8) , in which triglyceride polymer chains are linked together and loose partially their ability to move as individual polymer chains. Even though, after the formation of a triglyceride dimer, the dimer has still unsaturated fatty acid chains to continue the dimerisation process.
CH
CH
CO
CH
CH
CO
OC C
Figure 1. 6: scheme of the formation of new bond occurring in the oxidative polymerisation
Figure 1. 7: schematic representation of the time course of fatty acids autoxidation, after [Gardner H., 1911]
11
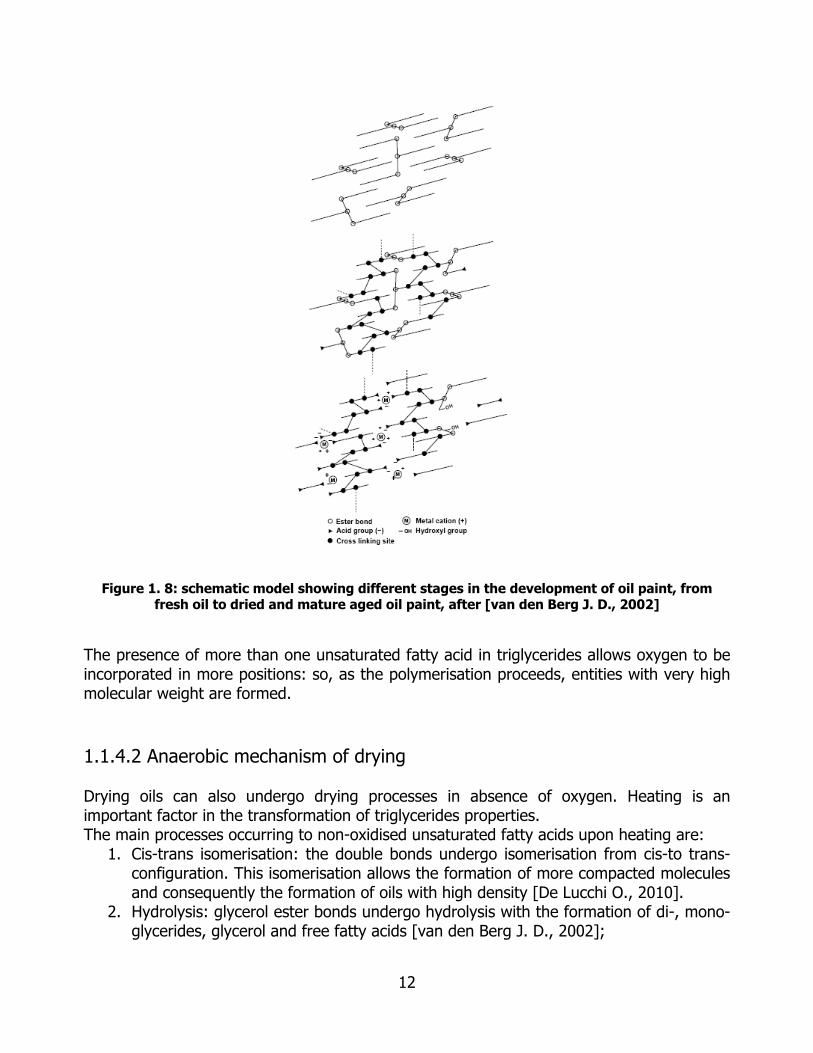
Figure 1. 8: schematic model showing different stages in the development of oil paint, from fresh oil to dried and mature aged oil paint, after [van den Berg J. D., 2002]
The presence of more than one unsaturated fatty acid in triglycerides allows oxygen to be incorporated in more positions: so, as the polymerisation proceeds, entities with very high molecular weight are formed. 1.1.4.2 Anaerobic mechanism of drying Drying oils can also undergo drying processes in absence of oxygen. Heating is an important factor in the transformation of triglycerides properties. The main processes occurring to non-oxidised unsaturated fatty acids upon heating are:
1. Cis-trans isomerisation: the double bonds undergo isomerisation from cis-to trans-configuration. This isomerisation allows the formation of more compacted molecules and consequently the formation of oils with high density [De Lucchi O., 2010].
2. Hydrolysis: glycerol ester bonds undergo hydrolysis with the formation of di-, mono-glycerides, glycerol and free fatty acids [van den Berg J. D., 2002];
12

3. Cyclisation: cyclic acids or Diels-Alder additions are the results of conjugation. During heating of vegetal oils, it was shown that several cyclic fatty acid monomers are formed from linoleic and linolenic acids Cyclic C18 fatty acids compounds resulted into saturated or unsaturated cyclic rings of five or six atoms [Sebedio J. L., 1989].
During drying, the formation of the allylic radical can be obtained only if the provided temperature is high enough to break the C-H bound where the allylic C is. In this way, the formation of a resonance-stabilised radical occurs. The stabilised radical undergoes radical-chain reaction, which propagates and terminates as seen before for the aerobic mechanism of drying. Stand oil is the typical example of oil heated in absence of oxygen. It is also called pre-polymerised oil and it is normally heated at temperature higher than 300°C. It dries more slowly than raw oil as the number of double bounds is smaller: however, it differs from raw oil as it does not turn yellow and slightly varies in volume. 1.1.5 Ageing and degradation With the progressive ageing, other reactions take place in the cross-linked network: ruptures and fragmentations of triglycerides have as a direct consequence the formation of shorter fragments. By autoxidation, in fact, not only the formation of high-molecular weight material is established, but also several low-molecular weight volatile compounds are formed. These events occur at the same time. Primary oxidation products are hydroperoxides and peroxides, represented in Figure 1.9:
RCH
R'
OOH
RCH
R'
OOR"
Figure 1.9: structure of hydroperoxide (left) and peroxide (right)
Peroxide groups are not stable: the O-O bound can be easily be broken and form very reactive radicals, which can propagate or abstract an hydrogen atom. These radicals lead to the formation of the secondary products from the reaction of oxygen: aldehydes, ketones and alcohols (Figure 1.10).
R HC
R'
O
-H
+H
RC
R'
O
R HC
R'
OH
Figure 1.10: formation of aldehydes/ketones by abstraction of H atom (above) and formation of alcohols by termination (below)
13

In particular, hydroperoxides form alkoxy radicals RO● by homolytic cleavage, which evolve by fragmentation of adjacent C-C and C-H bonds producing principally aldehydes and ketones, which tend to evaporate together with the water present in the oil matrix. These volatile compounds are easily detectable as they have a typical acrid smell. The tertiary oxidation products derive from peroxide and hydroxyl radicals and from the secondary products (Figure 1.11). More low-molecular material is produced, which differently remains linked to glyceride molecules but do not take part into the cross-linking: the oxidative scission mainly leads to the formation of dicarboxylic acids (Figure 1.12), dihydroxy acids and hydroxylated monocarboxylic acids.
aldehydes, ketones
ox
R R '
Figure 1.11: formation of tertiary oxidation products from aldehydes, ketones, peroxide and
hydroxyl radicals
HO OH
O O
HO
OHO
O Azelaic acid Suberic acid
HO
OOH
O Sebacic acid
Figure 1. 12: dicarboxylic acids formed during ageing and degradation of a drying oil paint
The exact size of the products depends on the position at which the scission occurs. The major product is azelaic acid, a nine-carbon dicarboxylic acid, which results from oxidative scission of a double bond at C9 in the unsaturated fatty acids (linolenic, linoleic, oleic).This is the closest double bond to the carboxyl group in most unsaturated fatty acids of glycerides. Most of the azelaic acid is still attached to the oil matrix through the original ester linkage of the glyceride. Other products include the eight- and ten-carbon diacids (namely suberic and sebacic acids) as well as even smaller amounts of monocarboxylic acids. Diacids are relatively stable end-products of the autoxidation [van den Berg J. D.,
R HC
R '
O -O
-R'
RCOOHCO H
OH
14

2002]: they are normally presenting dried oil film as witnesses of the original abundant unsaturated fatty acids. Among the dihydroxy acids formed, the most abundant is 9,10-dihydroxyoctadecanoic acid, which results from the hydration of a double bond at C9 as well. The formation of azelaic acid and 9,10-dihydroxyoctadecanoic acid are in fact in competition. Several more components are formed via oxidation and photoxidation: they are normally divided into primary and secondary oxidation products and also include epoxy-, oxo- and hydroxyl- by-products [van den Berg J. D., 2002]. 1.1.6 Oil paints The mechanisms described above take into consideration the chemical aspects of drying and ageing phenomena for a drying oil. Now, a translation of these reactions on a visual and physical point of view is required to understand what happens in the case of oil paints. Immediately after being laid out as a thin film, fresh drying oils start absorbing oxygen present in the atmosphere. This absorption will increase up to 20% of their weight (depending on the quantity of double bonds present in oils). After the film has been exposed a couple of days to atmospheric oxygen, when hydroperoxides and peroxides formation occur through reaction with oxygen and the radical chain processes start, the increase of viscosity and the change in the refraction index are recorded. Curing of oils leads to the formation of a cross-linked network via oxidative polymerisation. Essentially, all of the polyunsaturated fatty acid groups in the triglycerides disappear within a few years. Consequently, the oil finally dries, forming at first a very elastic skin, called linoxyn. This is actually a rigid material, but, because of its content of non-drying constituents which act as plasticisers (such as liquid and/or semi-liquid fractions of saturated triglycerides), the polymeric matrix acquires a particular flexibility. After the formation of dicarboxylic acids and the evaporation of volatile products (aldehydes, ketons, etc), the linoxyn skin becomes very fragile and brittle with the resulting cracks and further powdery consistency. This happens because of the rupture in the polymeric network and the formation of hydrophilic compounds (such as carboxylates and hydroxylates) which help water penetration into the matrix, initially hydrophobic and apolar. In extremely degraded oil films, however, an increase of softness and sensitivity to solvents can be registered because low molecular weight components, present in higher proportions, function as plasticizers and are sensitive to leaching by cleaning. During drying, yellowing of the film and change in the density and refraction index are registered as well. In fact, the index of refraction of linseed oil is about 1.48 [Gettens, 1966] but rises during the drying and aging processes to values as high as 1.57 for aged films [Feller, 1957]. Yellowing of oil-paint films is also related to the oxidative process: in particular, highly unsaturated drying oils (those with the most linolenic), that is to say oils which dry best, tend to yellow the most. This is the reason why poppy-seed and walnut oils were often used to formulate blue and white paints as they yellow less than linseed oil. Yellowing is also affected by the presence of chromophoric groups naturally contained in vegetable seeds, but it is promoted as well by condensation reactions of fatty acids
15

oxidised at more than one position to give structures similar to quinones. Exposure to light promotes oxidation of double bonds in the chromophores that are responsible for the colour. The oxidation may initially yield compounds that are colourless, but such compounds may be capable of producing more coloured compounds through further oxidation or condensation. 1.1.7 The role of pigments and driers For a complete polymerisation of oil films (within the thickness of the oil film and not just superficially) 80-100 years are required. Although drying oils are siccative by definition, the rate of the drying mechanism decreases in time as the superficial layers create a “barrier” for oxygen and the uptake of oxygen is thus slower. But, as they are firstly of all binding materials, they perform their task as media by accompanying pigments and/or colouring dyestuffs. As Old Masters experienced, the speed of polymerisation is influenced by the presence of pigments composed of metals capable of existing in more than one oxidation (valence) state [Mills J. S., 1987]. According to previous studies, metals like cobalt, manganese, lead, copper and iron are considered the best catalysts, in that order. Compounds of these metals have been commonly used as pigments, but could also be added specifically for their effect on the drying process. In this sense, they are called driers. In the initiation step (as seen before) they may easily start a radical-chain reaction:
RH + MN R●+H- +MN-1 Where MN = metal with higher oxidation state, MN-1= metal with lower oxidation state. These metals change their oxidation states via electron transfer. Metal ion catalysts can be described in the following ways:
ROOH +M N ROO● + H- + MN-1 ROOH +M N-1 RO● + OH- + MN
These two simplified reactions provide a reduction-oxidation (redox) mechanism which is able to promote polymerisation even in absence of oxygen. 1.1.8 The presence of anti-oxidants A number of naturally occurring organic compounds can function as antioxidants or inhibit oxidation reactions. Tocopherols, such as Vitamin E (Figure 1.13), have been found as natural antioxidants in vegetable seeds. The period of time necessary for the initiation of oxygen absorption, called induction period, is attributed to the presence of natural antioxidants. These molecules function either by reacting preferentially with oxygen initially
16
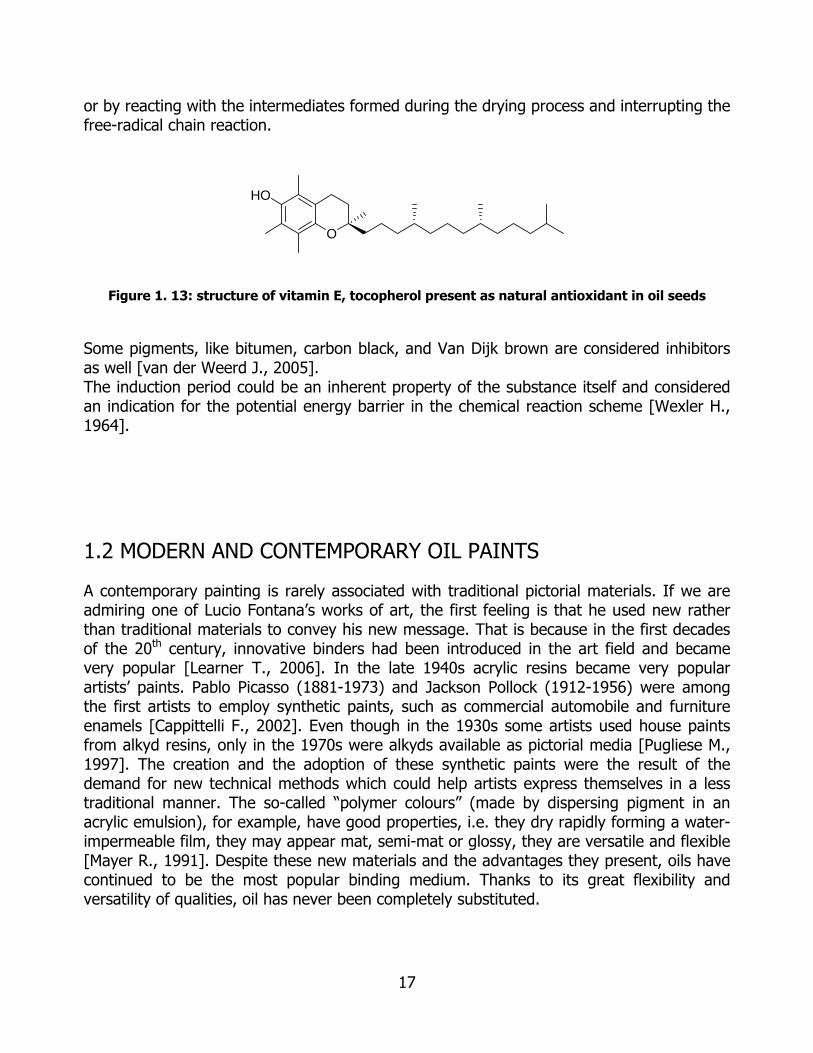
or by reacting with the intermediates formed during the drying process and interrupting the free-radical chain reaction.
O
HO
Figure 1. 13: structure of vitamin E, tocopherol present as natural antioxidant in oil seeds
Some pigments, like bitumen, carbon black, and Van Dijk brown are considered inhibitors as well [van der Weerd J., 2005]. The induction period could be an inherent property of the substance itself and considered an indication for the potential energy barrier in the chemical reaction scheme [Wexler H., 1964]. 1.2 MODERN AND CONTEMPORARY OIL PAINTS A contemporary painting is rarely associated with traditional pictorial materials. If we are admiring one of Lucio Fontana’s works of art, the first feeling is that he used new rather than traditional materials to convey his new message. That is because in the first decades of the 20th century, innovative binders had been introduced in the art field and became very popular [Learner T., 2006]. In the late 1940s acrylic resins became very popular artists’ paints. Pablo Picasso (1881-1973) and Jackson Pollock (1912-1956) were among the first artists to employ synthetic paints, such as commercial automobile and furniture enamels [Cappittelli F., 2002]. Even though in the 1930s some artists used house paints from alkyd resins, only in the 1970s were alkyds available as pictorial media [Pugliese M., 1997]. The creation and the adoption of these synthetic paints were the result of the demand for new technical methods which could help artists express themselves in a less traditional manner. The so-called “polymer colours” (made by dispersing pigment in an acrylic emulsion), for example, have good properties, i.e. they dry rapidly forming a water-impermeable film, they may appear mat, semi-mat or glossy, they are versatile and flexible [Mayer R., 1991]. Despite these new materials and the advantages they present, oils have continued to be the most popular binding medium. Thanks to its great flexibility and versatility of qualities, oil has never been completely substituted.
17

1.2.1 The industrialisation of artists’ oils Until the 18th century, the entire process of paint production (from oil extraction to grinding pigments) was at the basis of the activities in artists’ ateliers: raw materials were purchased watchfully and separately and paints were produced according to traditional (and sometimes secret) recipes. With the introduction of the hydraulic presses in the late 18th century, oil started being extracted in bigger amount from seeds, but very often the quality of the extracted oil was lower due to the facts that the oil was heated up continuously. Acid refining was introduced in 1792, perhaps in response to the increase in hot pressing [Erhardt D., 1994]. In 1793 pre-mixed paste colours were traded: before then, artists used to mix their own paints using oily media and pigments. These paste colours were composed of pigments lightly wetted with oil and they achieved a proper consistency simply by adding more oil [Mayer R., 1991]. From the 19th century onwards, thanks to the scientific and technological industrial developments, artists’ oil paints were increasingly produced on an industrial scale with mechanical mixing systems. Paints, subsequently, became a commercial product. Control of the product (that is to say shelf life, packaging, and production efficiency) shifted from the atelier to the industry, as the artist no longer selected or mixed the raw materials by himself. Paint manufacturers developed formulations open to large-scale production, which include a number of additives, e.g. stabilisers, dispersion agents and driers, since they allowed for faster production, stability, prolonged shelf life and uniform handling properties of the paints [Scicolone G. C., 1993]. Sometimes, resins, fillers and adulterants were added to produce less expensive paints. 1.2.2 The invention of the collapsible tube for oil paints 1841 is a crucial year in the production of artists’ oil paints: the American artist John Goffe Rand (1801-1873) invented the collapsible metal tubes for conserving oils (United States Patent n#2252, September 11, 1841 “Improvement in the construction of Vessels or Apparatus for Preserving Paints”) [Schaefer I., 2008]. Before Rand invented the tin tube, during the 18th and 19th century, oil colours were tied in small parcels of animal bladders or tin foils: bladders were punctured with a bone or ivory pin to squeeze out the colour; then the pins were replaced in the holes to seal them [Mayer R., 1991]. Paints, however, dried very rapidly. Pure tin tubes represented the best option regarding the preservation of the paint: tin didn’t stain or affect tube contents. Rand’s invention was successfully manufactured in England and later exported to the United States. The British manufacturer Winsor&Newton was the first to embark on perfecting tubes to Rand’s design. The French producer Alexandre Lefranc in 1859 invented the screw-cap, to ensure hermetic sealing to the tube. These innovations had a strong positive impact on the manner of painting, ensuring the possibility to always get fresh and ready oil colours. This fact had a fundamental role in the new concept of peindre en plein air embraced by Impressionist painters.
18

Figure 1. 14: Bladders, syringe-tubes and metal tubel as containers for oil paints (from
W&N Museum images)
Figure 1. 15: tin tubes invented by Rand (from the patent)
1.2.3 Drying, semi- and non-drying oils in industrial formulations A variety of oils of vegetable origin had been used by paints manufacturers for the new paints formulations. Besides the traditional siccative oils (linseed, poppy seed and walnut oil), other drying or semidrying binders were employed, often as cheap substitutes for linseed oil [Mayer R., 1991]. It has to be said that in the 20th century (especially after the First World War) walnut oil became harder to find commercially; demand was often low, and stock sometimes became rancid if kept improperly. Instead of walnut oil many artists and stores started selling linseed oil, poppy seed oil, and safflower oil as replacements. Recently, the problem of rancidity has been solved with the introduction of commercial alkali refined walnut oil paints and mediums. The oils employed by the paints’ manufacturers during the 20th century have been numerous (in Table 1.3 the most well known are displayed). Some of them are semi- or non-drying oil, with lower drying properties than the more traditional drying oils. Their extreme slowness to dry has usually been modified by the addition of driers, by heat-treatment or by mixtures with more drying oils paints.
19

Table 1. 3: summary of common oils used by paints manufactures since the 20th century after [Dubois V., 2007; Mayer R., 1991; Doerner M. 1945; Schilling M. 1999]
Name Kind of oil Brief description
Sunflower seed oil
Semi drying
oil
It is the oil extracted from the sunflower (Helianthusannuus) seeds. it contains predominantly linoleic acid in triglyceride form. It has properties resembling those of poppy oil. There are several types of sunflower oils produced, such as high linoleic, high oleic and mid oleic. Mid linoleic sunflower oil typically has at least 69% linoleic acid. High oleic sunflower oil has at least 82% oleic acid. Sunflower oil also contains lecithin, tocopherols, carotenoids and waxes.
Safflower oil
Drying oil
It is obtained from the seeds of Carthamus tinctorius. Safflower oil is flavorless and colorless, and similar to sunflower oil. There are two types of safflower that produce different kinds of oil: one high in monounsaturated fatty acid (oleic acid) and the other high in polyunsaturated fatty acid (linoleic acid). Safflower oil is also used in painting in the place of linseed oil, particularly with white, as it does not have the yellow tint which linseed oil possesses.
Soya bean oil
Drying oil
It comes from soybeans seeds and contains 7% alpha-Linolenic acid (C-18:3); 51% linoleic acid (C-18:2); and 23% oleic acid (C-18:1). For this high degree of unsaturation, it is widely used industrially as a substitute for linseed oil. Although, its properties are inferior. It is normally bleached to a very pale colour, but it requires driers.
Tung oil
Drying oil
Also known as China wood oil or simply wood oil, Tung oil is extracted from the nuts of Aleurites Fordii and A. montana, trees indigenous in China. It contains alfa-eleostearic acid for about 80%. Since the degree of unsaturation is quite high, Tung oil has good properties as a drying oil and it has been used for centuries as principal component of finishes for wooden objects.
Perilla oil
Drying oil
It is obtained from the seeds of perennial herbs of the Perilla frutescens. Perilla oil dries in less time than linseed oil and on drying forms a film that is harder and yellows more than that formed by linseed oil. Though that, its production is not cheap and it is considered a first-class quality oil.
Rapeseed oil
Non drying
oil
It is extracted from the seed of a variety of B assica napus. It contains almost 50% of erucic acid, monounsaturated fatty acid (C22:1).
r
Castor oil Non
drying oil
It is obtained from the seed of the castor plant. It is a thick, yellowish or almost colorless oil When dehydrated, castor oil is converted into a quick-drying oil used extensively in paints and varnishes.
Cottonseed oil
Non-semi
Cottonseed oil is extracted from the seeds of cotton plant of various species. Its fatty acid profile generally consists of 70% unsaturated fatty acids including 18% monounsaturated (oleic), 52% polyunsaturated (linoleic) and 26% saturated (primarily palmitic and stearic).
20

According also to precious interviews from with paints producers [van den Berg K. J., 2009], these oils have been used very often with or without having been mixed with linseed oil. Although there are no indications of them in the labels (except for safflower oil added in blue and white paints), they are generally contained in tube oil colours. Table 1.4 provides an overview of the fatty acids composition in oils also used as paint media in modern formulations: Table 1. 4: Fatty acids content (expressed as percent by weight) of the most common oils used
in oil paint manufacture after [Dubois V., 2007; van den Berg J. D., 2002; Mills J. S., 1987; van Keulen H., 2010]
Fatty Acids, percent by weight Name of the Oil C8 C10 C12 C14 C16 C18 C18:1 C18:2 C18:3 C20 Special fatty acid
Castor Seed Oil 2 1 7 5 Ricinoleic 86-90
9,12-dihydroxy Stearic 0.7
Coconut Oil 5 - 9 6 - 10 44 - 52 13 - 19 8 - 11 1 - 3 5 - 8 0-1.0 0-0.5 Palmitoleic tr -2.5
Cotton Seed Oil 0,4 20 2 35 42
Peanut Oil 6 - 9 3 - 6 52 - 60 13 - 27 2 - 4 Lignoceric 1-3
Behenic acid 1-3
Hemp Seed Oil 5 - 7 1 - 3 11 - 13 54 - 56 24 - 26
Linseed Oil 0.3 0.2 4 - 7 2 - 5 12 - 34 17 - 24 35 - 60 0 - 1
Rape Seed Oil 1,5 0,4 22 14 6,8 Erucic 47.0 Gondoic 2.0
Olive Oil 0.1-1.2 7 - 16 1 - 3 65 - 80 4 - 10 0.1-0.3
Palm Kernal Oil 3-5 3 - 7 40 - 52 14 - 18 7 - 9 1 - 3 11 - 19 0.5 - 2 tr
Palm Oil 0.5 - 2 32 - 45 2 - 7 38 - 52 5 - 11
Perilla Oil 6 - 8 1 - 3 12 - 14 13 - 15 62 - 65
Poppyseed Oil 10 2 11 72 5
Safflower Oil tr. - 0.5 3 - 6 1 - 4 13 - 21 73 - 79 tr. 0,2
Sesame Oil (Til Oil) 7 - 9 4 -5 40 - 50 35 - 45 0.5-1
Soya Bean Oil tr. - 0.5 7 - 11 2 - 6 22 - 34 43 - 56 5 - 11
Sunflower Seed Oil 3 - 6 1 - 3 14 - 35 44 - 75 0.6 - 4 Behenic 0.8
Tung Oil 4 1 8 4 3 Eleostearic 80.0
Walnut Oil 11 5 28 51 5
21

1.2.4 Oil processing and refining treatments The effects due to different oil refining procedures and treatments are numerous: just to have an idea of the complexity of situations caused by the preparation phases in modern oil production, Table 1.5 schematically reports the most common ones.
Table 1. 5: chemical and practical effects of oil processing and treatments, after [Erhardt D., 1994; van den Berg J. D., 2002]
Treatments occurring in oil refining Chemical effect Practical effect
Cold pressing Removes oil and little else, without altering the oil Clean, high-quality oil
Heating before or during oil extraction (includes most modern
processes)
Increased amounts of protein, mucilage, etc., extracted compared
to cold pressing Post extraction refining is required
Addition of chemical driers (lead, manganese, cobalt salts)
Catalyzes oxidative processes (drying and deterioration)
Fast drying on exposure to air; less durable film; lead salts may
darken on exposure to pollutants
Acid refining Increased amounts of free fatty acids Wets pigments well
Alkali refining Reduced amounts of free fatty acids
May require addition of surfactant (such as aluminium stearate) to
wet pigments
Heating after oil extraction with air blown trough (blown oil) Oxidative pre-polymerization of oil
Faster drying that unblown oil, but with similar chemistry; marginal
drying oils can be used
Heating after oil extraction in absence of oxygen (stand oil)
Non oxidative pre-polymerization of oil, some precipitation of
impurities; low temperatures (up to 100° C) yield best quality, high temperatures (up to 260°C) yield
darkened oils
Hard, though film that is less prone to oxidation; heated oil can be thick and difficult to work with; may require thinning with solvent
before use
Developments in drying-oil production and paint manufacture continued through the 19th century and into the 20th. Pre-heated or during pressing treatments became common. Solvent extraction, first proposed in the 1840s, was not immediately adopted as a production method because of problems with the process and the lack of a source of cheap, suitable solvents [Erhardt D., 1994]. The screw expeller, introduced in 1903, was able to extract oil in a continuous process, but produced so much heat during use that no oil produced by it could be considered “cold-pressed.” Steam jacket heating replaced fire boiling or direct heating, so that lower controlled temperatures (less than 100 °C) could be used for post extraction processing to produce thickened stand oil. Alkali refining was introduced in 1923 [Mayer R., 1991]. This produced a very clean oil, but one that did not wet pigments well, and therefore often required the use of additives for the satisfactory
22

preparation of paint. Currently, virtually all oil is obtained from heated seed using solvent or expeller extraction followed by alkali refining. Differences in the physical, mechanical, optical, and chemical properties of dried oil-paint films often result from variations in the methods of pressing, processing, and refining oils, as well as the formulation and preparation of the paints. Modern process of making paint can be summarised in three physical-chemical processes [Tempest H., 2008]: - wetting: the first stage consists of the replacement of air between particles of pigments
by the medium - grinding: pigments particles are mechanically broken to arise the surface activity - dispersion: the formation of a colloidal dispersion which should present stability 1.2.5 Additives in modern oil formulations 1.2.5.1 Addition of dispersion agents For the oily formulations, the aspect related to the dispersion of pigment in oil is fundamental, as it plays an important role in influencing the properties and handling of the paint and the stability in time of the product. According to the definition of perfect dispersion, each individual pigment particle should be coated by the medium in which it is dispersed. Nevertheless ideal dispersion doesn’t mean ideal consistency of a oil paint, since the obtained paint is very fluid but it lacks in body. So, in order to achieve good brushing qualities and adhesion, a certain degree of flocculation of the solid content is needed [Price, 1938; Carr , 1946; Saltmarsh P., 2008]. The amount of oil needed to bind and hold the dry pigment is variable for different pigments, as well as for different grades of the same pigment. Normally, a certain amount of oil is added plus enough extra to give the proper degree of plasticity and protection to the pigment particles [Mayer R., 1991]. But oil in excess means an increase of yellowing of oil paint and a possible cause of failure in the dried film: it is then advisable to keep the oil volume as low as possible. From this problem arose the demand for pigments treated for low oil absorption. Dispersion agents, such as metal stearate (and aluminium stearate in particular), were added ordinarily to treat pigments and coat their particles.
Metal stearates One of the 20th century components in oil paints has been aluminium stearate [Tumosa C., 2001]. In general, metal soaps are a class of compounds deriving from the reaction of alkaline, alkaline-earth or transition metals with monobasic carboxylic acids (C10-30) [Evans D., 1954]. The most commercially important are: aluminium, magnesium, zinc, calcium, lead,
23

manganese, etc. as they are very soluble in organic solvents, their application are numerous: in paint they are employed as driers, lubricant additives, catalyst, gel thickeners, emulsifiers principally. Metal stearates applications in paints include pigment suspension, gelation, lubrication and plasticizing [Weiss J., 1957]. The use of aluminium stearate as aids to grinding pigments and preventing separation of pigment from the medium was patent in 1920 (U.S. patent #1421). Aluminium (di-)stearate (C36H71AlO5) is a metallic soap obtained by precipitation of high quality stearic acid (Octadecanoic acid, C18H36O2). Unlike calcium and zinc, it is not available as 100% pure salt. Metal soaps are soluble in a wide range of organic solvents and yield liquids, gels and dispersion with characteristic colloidal properties, which can be interpreted in terms of micellar theory [Turner J.H., 1958]. The actions of metal soaps on pigments have been studied: stearates have been found to form a coating on the surface of pigment particle since it tends to form larger micelles. The micelles are assumed to be interlinked at a number of junction points, which are continuously breaking and forming [Pilpel N., 1963]. The soaps coat the surface of the pigments and by steric effects keep the particles from aggregating. In aluminium stearate precipitated from aqueous solution are present free fatty acids (2-7% by weight), loosely bound or sorbed fatty acids and firmly bound fatty acids resistant to solvent [Coe R.H., 1948]. In more recent times, maximum 2% AS is add for oil paints, as it has been noticed that an excess of added stearates causes stringiness of paints. Although that, this soap is still a component of oil paints thanks to the fact that it reduces the economic cost of oil production: so it can create a cheaper paint since a lower amounts of pigments is needed.
1.2.5.2 Addition of stabilisers Besides oil, pigments and dispersion agents, manufactured oil paints contains other materials, whose addition aims to keep the pigments in suspension, to provide good stability, prolonged shelf life and uniform handling properties of the paints in and from the tubes. They are also employed to impart to the tube oils the right consistency (buttery or short consistency in contrast to long or stringy one). They are normally called stabilisers and can be divided into three classes [Mayer R., 1991]: - waxes or wax-like materials which form a colloidal suspension in oil-pigment system - water or water solutions which allow the formation of a gelatinous emulsion water-oil - inert pigments, such as alumina hydrate, Al(OH)3 which lead to the production of short
pastes
Hydrogenated Castor Oil It has been found that the best stabilisers for oil paints are thixotropic compounds which are chemically compatible with the oily medium. For example, dehydrated castor oil derivatives, containing ricinoleic acid and its derivatives, are preferred. Hydrogenated castor oil also known as castor wax is a hard, brittle, insoluble wax. It is produced by adding hydrogen in the presence of a nickel catalyst. Its white flakes are extremely insoluble and are water resistant. Castor oil derivatives are normally added up to 2% by weight.
24

1.2.5.3 Addition of driers Oil paints manufactures have normally adjusted the drying rates of colours in order to assure a fast but controlled drying of the film. Drying oils, in fact, are often considered to have too slow drying rate for convenient use. For this reason, metallic salts, called driers, have been added in formulations. Driers are generally divided into: primary driers, secondary driers and auxiliary driers [Mallégol J., 2000]. Primary driers in particular have a catalytic effect on peroxide decomposition. Thus, they provoke acceleration of all reactions involved in the oxidation and the polymerisation of an oil film. Normally, cobalt, vanadium and manganese salts are used as primary driers, lead zirconium or zirconium/calcium salts as secondary driers and calcium/strontium as auxiliary ones. Driers are employed for less than 0.1% in medium-good quality paint formulation, but possibly in higher amounts for cheap-student quality paints. 1.2.5.4 Other additives in oil paints In modern manufactured processes, many other additives have been included in oil formulation. Inclusion of water, waxes, resins, fillers and adulterants in different amounts is quite common especially for less expensive paints. Unfortunately, the industrial secrets do not permit to have a priori knowledge and labels on tube oils are at least approximate. 1.2.6 The personal touch of the artist Last (but not less important) are additions done by artists themselves. Despite their declarations, the use of different material to provide different and particular characteristics to the paint materials is still very common. Addition of resins, essential oil, extra drying or slow-drying oil to tube oil paints normally occurs in ateliers. For example, the Dutch-American artist Willem De Kooning was known to add extra sunflower and safflower oil to his (commercial) paints [Schilling M., Susan L., 2002] to increase drying time and obtain more fluid paints. A voice over is the one of the Italian painter Giorgio de Chirico. He wrote the Piccolo trattato di tecnica pittorica, edited by Giovanni Scheiwiller in 1945. In his treatise, the painter provided information, tips and advises on how to perform a good-quality oil painting. He was very accurate on explaining and painting himself (the results is that his works of art are very well done and resistant), carefully avoiding commercial products that could contains “adulterants” interfering with the final oil film.
25

1.3 THE STATE OF THE ART OF THE STUDIES ON MODERN AND CONTEMPORARY OILS In the last decades, more importance has been attributed to the knowledge of modern and contemporary materials in Art. This strong request was born as an intellectual demand on the knowledge and understanding of how modern technologies and their developments had influenced the art market. Besides that, a conservative issue arose: it has been noticed that modern art showed a bigger need to conservation-restoration treatments than it was expected. In particular, unvarnished oil paintings seem to be quite fragile and very sensitive to cleaning treatments. The cleaning of oil paint films can have several negative effects if it is not carefully carried out [Sutherland K., 2001]. One of the main risk is to remove from the film soluble material leading to changes in both the optical and mechanical properties [Cremonesi P, 2004]. The low-molecular weight components are easily extracted: since they function as plasticizers in oil films [Wexler H., 1964], their removal could lower the elasticity of the film [Tumosa C., 2001]. Loss of material may also result in a matte appearance. During cleaning operations a slight swelling of an oil film due to the use of solvents is largely reversible: differently, excessive swelling leads to disruption of the oil matrix and oil-pigment bonds [Erhardt D., 194]. Cleaning agents which affect pigments or oil-pigment bonds can have similar effects. This is especially true for polar solvent or aqueous mixtures [Cremonesi P., 2004]. Non-volatile solvents or reagents, for example resins soaps, might leave residues which fill in voids and darken the oil film, providing a saturated appearance. Cleaning operations are however very delicate and they should be projected after knowing the materials which constitute both the artistic layers and the dirty layers.
Among the first studies on contemporary paintings, it is worth citing those on Willem De Kooning’s works of art [Lake S., 1999; Schilling M., 1999]. During the late 1940s and into the 1950s De Kooning used a range of house paints and sign painters' enamels along with artists' paints, often mixed with sand, charcoal, plaster of Paris, calcite, wax, and ground glass and applied to inexpensive fiberboard and wood pulp paper supports. On the contrary, in paintings from the early 1960s his paint included linseed oil and castor oil, although during this period he frequently mixed poppy oil into his paints. The earliest evidence for his use of safflower oil occur in paintings from 1964-1965, and it seems that safflower oil mixtures became his medium of choice until the middle of the 1970s, when he learned about the dangers posed by semi-drying oils. As a matter of fact, his paintings including extra safflower oil have remained soft and tacky and are in a vulnerable state. Of fundamental importance in the cleaning of contemporary paintings is the Water sensitive oil Project, part of 20th Century oil paints Project” carried out by the Rijksdienst voor Cultureel Erfgoed/Netherlands Cultural Heritage Agency (formerly ICN-Instituut Collectie Nederland) in collaboration with the Courtauld Institute of Art (CIA), the Getty Conservation Institute (GCI) and the Tate.
26

This project investigates the cause of water sensitivity in well-bound manufactured oil paints used by artists from the late 19th C and the 20th C [Wijnberg L., 2007;Burnstock A., 2007; van den Berg K. J., 2009; Tempest H., 2010]. The water-and solvent sensitivity problem has been identified in a number of paintings and an international phenomenological survey of conservators suggests the problem is prevalent in works made in the 1950s and 60s. Passages of soluble paint present particular problems for surface cleaning and display of these paintings, in particular works that are composed of flat planes of colour. Efflorescence and surface desaturation are other effects that have been noted in relation to the sensitive paints. The project combined investigation of the phenomena and contextualisation of the problem through investigation of case studies, and experimental replication of the effects seen in paintings in contemporary and modern manufactured oil paints. Some of the water sensitive paintings investigated are works of art of artists such as Karel Appel, Jasper Johns, Willem De Kooning, Paula Rego, etc. Many other important studies have been done on many practical conservative aspects in contemporary oil paintings. Nevertheless, there are still many unanswered questions related to modern commercially-produced artists’ oil paints.
27

1.4 THE GOALS OF THE CURRENT STUDY This research activity was conceived within the project Conservazione dell’Arte Contemporanea developed by Ca’ Foscari University of Venice with the aim to improve the knowledge about materials, execution techniques and degradation phenomena of 20th century Cultural Heritage [Biscontin G., 2004; Perusini T., 2004; Zendri E., 2005; Izzo F. C., 2007; Melchiorre Di Crescenzo M.,2008]. This current study is the result of the collaboration with the RCE (Rijksdienst voor Cultureel Erfgoed/Netherlands Cultural Heritage Agency, formerly ICN Instituut Collectie Nederland) and is part of the wider 20th Century oil paints Project carried out by ICN in cooperation with the Courtrauld Institute of Art (CIA), the Getty Conservation Institute (GCI) and the Tate.
It takes into consideration the outcomes of previous researches in the field of conservation of contemporary art, in which conservators, restorers, art curators and conservation scientists faced practical issues and theoretical aspects. The research has also directly involved scientists, conservators and paints’ manufacturers with the intention to deepen the knowledge of modern oils formulations. As it has been shown in the previous chapters, 20th century artists’ oil paints are complex materials which are not completely known. The generic label “oil” hides a huge variety of binding media whose compositions haven’t been deeply investigated yet. This thesis, therefore, wishes to integrate both the conservative and the scientific approaches, trying to find answers to raised and still unresolved questions. The intellectual and analytical challenges are numerous: What was/is in the formulations of 20th century oil paints? What kinds of additives, adulterants, fillers, etc have been used? In which way may additives influence the chemical-physical properties of paintings? Why do several modern and contemporary paintings appear more fragile and sensitive during conservation treatments (i.e. cleaning)? How is it possible to “operate” on a modern deteriorated work of art without knowing its constituents? The philosophy to approach these questions is delineated through the following chapters. It starts with a brief summary of analytical techniques, such as Fourier-Transform Infra-Red spectrophotometry (FT-IR), X-Rays Fluorescence spectrophotometry, Thermogravimetry-Differential Scanning Calorimetry (TG-DSC) and Gas Chromatography-Mass Spectrometry (GC-MS), as tools for characterising the constituents and studying the properties of oil paints. Then a description of the development and the improvement of a specific GC-MS procedure for modern and contemporary oil paints is presented. An innovative combination of extraction and derivatisation methods which reduce the treatments complexity and time has been developed. The extracted solution and the residue have been treated with a transesterification reagent, a methanolic solution of (m-trifluoromethylphenyl) trimethyl ammonium hydroxide (commercially called Meth-Prep II®). It is a one-step reagent with a
28

good capability in the methylation of organic acids without sample pre-treatments, which are sometimes very complicated and imply material loss. This is a very important consideration for paintings samples which are often very little (less than 0.1-1 mg). Meth-PrepII-GC-MS demonstrated to be a very sensitive analysis: thus, 0.05-0.08 mg of sample are sufficient to achieve extremely good results. First, experiments have been performed on reference pictorial materials, studying laboratory-prepared paint films. The paint films were prepared, with the consideration that that “it is preferable to obtain data on films of precisely known composition and origin, than to experiment on films whose past history is uncertain” [Stolow N.,1961]. Furthermore, the use of laboratory-prepared films allows to have massive amounts of samples for developing analytical methods, which couldn’t be set up on real films. Real samples, despite being the final goal of researches, are too precious to be employed in the preliminary phases of studies. Another advantage of working on mock-ups is linked to the possibility of investigating the effects and the influences of many factors, such as the nature of the pigment in the paint formulation, the kind of binders employed, the role of lipidic additives, the film thickness, the storage conditions and so on. All these factors might describe an (ideal) tendency in the behaviours of oil paints, which appears to be very useful in the understanding of the general reactions occurring in films. In 2008, films were prepared ad hoc with variable and known amounts of the same ingredients which are commonly used in modern manufactured artists’ oil paints. The idea was to use to replicate their basic formulations based on present knowledge. In addition to linseed oil considered other drying and semi-drying oils oil were used according to bibliographic sources and manufacturers’ information. While poppy, sunflower, safflower, castor and cottonseed oils were used in the film-making (and study), the traditional drying oil, walnut oil, was not considered. Its exclusion is due to the fact that modern artists’ oils producers stopped using it between the 19th -20th century for economical reasons: other substitutes were considered cheaper, with similar properties and they did not have rancidity problems as walnut oil has. The choice of driers, dispersion agents, and stabilizers was dictated by industrial choices as well. It is well known that since the industrialisation in the production of art materials, manufacturers have been searching for new production methodologies which could reduce costs and provide materials with new characteristics, for example rapid siccative oils, easy-handling colours, non-yellowing media, etc. Three sets of films were prepared, which can be divided into unpigmented, pigmented and additive-containing oil films. The choice to prepare films containing only oils is linked to the fact that it is fundamental to know how they behave by themselves, without any interference linked to pigments, driers, additives, etc. At the same time, it is of fundamental importance to overcome the limitation of the absence of the materials which might very well influence the ageing and more in general the chemistry of oil media. Different pigments were also used in the formulations, appositely to influence the speed of drying in different ways
29

In particular, the films containing additives were prepared at RCE during the Wa er sensitive oil Project, under the supervision of Dr. K. J. van den Berg (RCE) and Dr. A. Burnstock (CIA) [Burnstock A., 2007; Saltmarsh P., 2008; Mills L., 2008]. These mock-ups were prepared with hydrogenated castor oil (HCO) added as a stabilizer and aluminium and zinc stearates added in different percentages to the pigments as dispersion agents.
t
Then, the analytical methodologies have been applied to manufactured artists’ oil paints. To achieve a wider knowledge of 20th century manufactured oil paints, several commercial artists’ oil paints from different brands and different countries were investigated. Collapsible tubes are referable to the period dating between 1920 and 2008: several of them come from historical collections of Dutch museums or institutes of art [Litjiens S., 2010]. Artists’ oil paints selected for this research were commonly used by artists and produced by Winsor & Newton, UK; Maimeri, Italy; Le Franc, France; Old Holland, The Netherlands; Haagsche Kunstschildersverven Fabriek, The Netherlands; Talens, The Netherlands; Gimborn, The Netherlands; Claus&Fritz, The Netherlands. In some cases, producers were contacted and then interviewed: the aim was to obtain more information concerning the recipes and the production methods employed in the modern industrial paint factories and a better understanding of their technological developments. Questions were preferably related to the possible presence of additives [van den Berg K. J., 2010].
The analytical methods successfully answered the question of identifying and quantifying lipidic binders and additives present in industrial oil formulations. In many cases, evidence of the use of specific oils and additives was provided. Data have been treated by different multivariate chemometric techniques, such as cluster analysis and principal component analysis (PCA), in order to compare and classify oil paints on the basis of binders and additives present in their formulations. Finally, several interesting case studies on real samples from modern and contemporary paintings were studied. The analysed works of art are reported in Table 1.6:
Table 1. 6: Modern paintings analysed in this research
Author Name Year Provenance (courtesy of)
Concetto spaziale. Notte d’amore a Venezia (60 O 81) 1960
Concetto spaziale (62 O 66) 1962
Concetto spaziale 1962
Concetto spaziale, La Fine di Dio (64 FD 5) 1963
Lucio Fontana
Concetto spaziale, La Fine di Dio (63 FD 14) 1963
Barbara Ferriani S.r.l- Fondazione Lucio Fontana, Milano
30

Concetto spaziale(63 FD 23) 1963
Jasper Johns Untitled 1964-65 1965
Karel Appel La grande Fleur de la nuit 1954
Willem De Kooning
Rosy-Fingered Dawn at Louse Point 1963
Henri Matisse Odalisque 1923
Stedelijk Museum Amsterdam
Salvador Dalì Landscape with Girl Skipping a Rope 1936 Museum Boijmans van
Beuningen, Rotterdam
Male Baboon c. 1950
Nude (Self-Portrait?) 1949
Dead Hare 1949
Isabel Lambert-Rawsthorne
Still Life with Roses 1953
Ethel Walker Models resting c.1930
F. (?) Breton Three Urchin Boys c.1920
Courtrauld Institute of Art,
London
Paula Rego Tro¢a 1951 Private Conservator, Lissabon
31

CHAPTER 2
INVESTIGATION TECHNIQUES
Abstract This chapter gives a summary of the investigation techniques performed in this research activity. It focuses on how analytical methods work and what kind of information can be gained from them by studying oil paints formulations. It also provides an introduction on multivariate statistical analysis as a tool in data interpretation and comparison. 2.1 INTRODUCTION An exhaustive and appropriate scientific approach to the examination of works of art is usually required: Optical Microscopy (OM), Scanning Electron Microscopy (SEM-EDS), X-Rays Fluorescence Spectroscopy (XRF), Fourier-Transform Infra-Red Spectroscopy (FT-IR), Thermogravimetry (TG), Differential Scanning Calorimetry (DSC), Gas Chromatography – Mass Spectrometry (GC-MS) and many other techniques are commonly in use in the majority of laboratories and allow a specific chemical-physical knowledge of art materials and artistic execution techniques. The data deriving from these techniques are not univocal; results are normally combined to obtain a wider knowledge [Lo Russo S., 1998]. Analytical techniques may be non-destructive or destructive, although it is more correct to talk of micro-destructive where the amount of sample needed is very small, normally in the order of 10-3 g.
The philosophy of sampling in art objects Taking samples is surely a kind of destructive action as it requires the exportation of material fragments from the work of art. Nevertheless, it has to be stressed that the sample’s dimensions are very small normally, in the order of 10-3g (microsamples), often comparable to falling fragments due to the natural degradation processes. So, the “sacrifice” of art samples is one of the most advantageous operations, as it allows the characterization of art production constituents, the determination of the state of conservation of art objects and the identification of degradation causes. Sampling areas must be chosen in a rational way, considering the artistic and historical
32

background as well; a programmed sampling is always related to the purposes of the analytic approach. Sampling cannot damage the reading and the formal content of the work of art. Samples have to be as significant as possible, few in number and tiny. Fragments may be taken by abrading the surface with a scalpel (for example to analyse superficial particulate) or by exporting with a micro-scalpel a sample in its entirety.
2.2 TECHNIQUES 2.2.1 Fourier Transform-Infra Red Spectrometry (FT- IR) FT-IR is an absorption technique which can be used to identify chemical compounds in unknown specimen, providing information about the chemical bonding or molecular structure of material, whether inorganic or organic1. FT-IR allows the identification of a huge variety of materials of Cultural Heritage [Derrick M.R., 2000]. Thanks to the extreme versatility, the high sensitivity and the execution promptness, FT-IR analysis is usually employed for analysing binding media, varnishes, grounds and pigments [Adrover Gracia I., 2001]. The qualitative identification of different substances present in a sample is based on the comparison between the spectra of the analysed sample and those of reference materials, obtained experimentally on pure substances or mixtures. Every molecule, in fact, has its own characteristic IR spectrum which allows its identification. The spectrum consists of peaks of variable breadth and highness, which correspond to the maximum absorption due to the vibrational transitions [Ciliberto E., 2000]. A disadvantage of FT-IR technique is the presence of interferences due to peaks coincidences when analysing complex mixtures [Learner T., 2004]. When the FT-IR analysis is performed on samples composed mainly of inorganic material (grounds, oxide- and carbonate-based pigments), the most frequent problem is the partial (sometimes total) covering of peaks related to organic substances by the inorganic ones which have higher intensity. It is also important to to point out that in samples, the organic fraction is rarely more than 10% (by weight) and sample weight is normally less than 5mg; in some cases this means the quantity of organic materials is close to the detection limit of the instrumentation.
1 The principle on which FT-IR is based is the following: atomic bonds in molecules have vibrational, rotational and bending motion at characteristic frequencies; when a quantum of IR radiation (0.7-500 um) interacts with a molecule, it may absorb the energy and vibrate, rotate and bend. The IR absorption only occurs when the incoming IR radiation has sufficient energy for the transition to the next allowed vibrational energy state. The peak interpretation and attribution are done by identifying the kind of bonds present in the molecules by comparison with reference materials and specific FT-IR libraries. A modulated IR beam passes through the sample and is then detected: the specimen transmittance and reflectance of IR rays at different frequencies is translated into an IR spectrum which consists of several peaks in the region between approximately 4000-400 cm-1
Attenuated total reflectance (ATR) is a sampling technique combined with FT-IR: it permits samples to be directly analysed without further preparation and for this reason it is more versatile. The process is based on a beam of IR radiation which is passed through the ATR crystal, after being reflected at least once off the internal surface in contact with the sample, creating an evanescent wave. This wave is then extended to the specimen. Normally, the beam penetrates into the sample up to 0,5-2 µm. After exiting the crystal, the beam is collected by the detector.
33

Furthermore, some organic compounds - such as binding media in paints - cannot be clearly distinguished from other compounds which belong to the same “family”. Notably, linseed oil and poppy seed oil are not easily distinguished as they contain almost the same entities. Nevertheless, FT-IR technique is of fundamental importance in obtaining information on the chemical nature of the binding media (proteins, lipids, polysaccharides, synthetic binders, etc) and their possible degradation by-products [Matteini M., 1984; Meilunas R. J., 1990; van der Weerd J., 2005]. In this research FT-IR and FT-IR-ATR technique was applied to the study of fresh and aged oil paints, based on modern manufactured formulations. The aim was to focus on the nature of binding media and pigments, the presence of possible additives in paints and the indication of possible degradation phenomena. 2.2.2 X-Ray-Fluorescence (XRF) Spectrometry XRF2 analysis permits the identification of a broad number of periodic table elements from atomic number 11 (sodium) to 92 (uranium) [Bonissoni G., 1977]. Although XRF analysis gives elemental information, it is a very useful tool in identifying pigments thanks to the identification of one or more elements which are characteristic for pigments themselves, in particular for historical pigments mainly composed of inorganic-mineral nature [Matteini M., 1984]. The XRF instrument records a spectrum for every sample consisting of a series of peaks: each peak is linked to the presence of certain elements. Heights and areas of peaks are proportional to the amount of element present in the sample and thus, allow semi-quantitative valuation [Ciliberto E., 2000]. This technique presents a limit: XRF radiation doesn’t stop on superficial layers, but tends to penetrate more deeply. This can lead to some difficulties in interpreting XRF spectra, as they contain information coming out from inner layers too. But this peculiarity may actually be used to obtain information from inner and bottom layers which provide the grounds for painted layers. An advantage of XRF analysis is that it is a non-destructive technique which doesn’t require any pre-treatments on samples. In this study, XRF has been performed on modern oil paints samples to acquire information on pigments (including fillers and extenders in pigment production) and driers, but more generally on inorganic presence which might have a role in drying processes occurring in oil paints.
2 X-ray fluorescence is the emission of characteristic secondary or fluorescent X-ray coming from materials excited by high-energy X-rays. This phenomenon is applied for elemental analysis as each element emits radiation which has characteristic energy of the atom present [Ciliberto E., 2000]. Each element has electronic orbitals of characteristic energy. Following removal of an inner electron by an energetic photon provided by a primary radiation source, an electron from an outer shell drops into its place. There are a limited number of ways in which this can happen. The main transitions are given names: an L→K transition is traditionally called Kα, an M→K transition is called Kβ, an M→L transition is called Lα, and so on. Each of these transitions yields a fluorescent photon with a characteristic energy equal to the difference in energy of the initial and final orbital. The wavelength of this fluorescent radiation can be calculated from Planck's Law:
34

2.2.3 Thermal analyses Thermal analyses encompass a group of analytical techniques which are used to measure the physical properties variations of a substance as a function of time while the substance is subjected to a controlled temperature program [Burmester A., 1992]. These analyses are widely used in the field of Cultural Heritage, as they can measure and study various aspects of organic and inorganic materials constituting the works of art, among them natural and synthetic polymers. The thermal analyses used in this research are Thermogravimetry (TG) and Differential Scanning Calorimetry (DSC). TG is a technique which measures the percentage mass changes of a sample while the temperature is raised as a function of time. The analysed substance undergoes degradation phenomena with elimination of gaseous products due to the increase of temperature. TG allows to monitor the thermal stability of the sample constituents and gives information about the amount of inorganic materials, water, solvents, etc [Ciliberto E., 2000]. DSC is a technique which measures the differences of heat flow between the sample and a reference sample while the temperature is programmed to variate. DSC allows the qualitative and quantitative analysis on physical transitions, such as glass transition (Tg), crystallisation and melting as well as chemical reactions, such as decomposition, oxidation, dehydration [Odlyha M., 1995]. In both cases, it is possible to operate in a reactive atmosphere, such as air (i.e. oxygen, with possible formation of new oxidative species), or in an inert atmosphere, such as nitrogen: the choice depends on the transformations to be investigated [Prati S., 2001]. The two techniques may be coupled and the simultaneous TG-DSC system allows to follow both mass changes and thermal capacity. TG-DSC instrument provides thermograms, graphs in which thermogravimetric curves (percentage weight and masses changes vs. temperature) and calorimetric curves (thermal capacity vs. temperature) are displayed. The ordinate of a DSC curve represents the rate of energy absorption by the test sample in comparison to the reference sample (alumina): this rate naturally depends on the heat capacity of the sample [Pope M. I., 1977]. Thermograms of unknown analysed samples are compared with those of standard references, databases and literature data . This research has obtained much information from thermogravimetric and differential scanning calorimetric analyses, which have been performed to study the stability and the behaviours of oil paints and additives in modern formulations. 2.2.4 Gas Chromatography-Mass Spectrometry (GC-MS) Gas chromatography-mass spectrometry (GC-MS) is a method that combines the features of gas-liquid chromatography and mass spectrometry to identify different substances within a test sample [Mc Nair H., 1969]. These two components, used together, allow a much finer degree of substance identification than either unit used separately [Grob R. 1995]. In the field of Cultural Heritage it is of fundamental importance to study and identify substances present in mixtures: in particular, many studies focus on the identification and quantification of organic materials used in art production [Colombini M.
35

P., 2009]. In general, chromatography is used to separate mixtures of chemicals into individual components. Once isolated, the components can be evaluated individually. Separation occurs when the sample mixture is introduced (injected) into a mobile phase [Perry J., 1981]. In gas chromatography (GC), the mobile phase is an inert gas such as helium. The mobile phase carries the sample mixture through what is referred to as a stationary phase. The stationary phase is usually a chemical which can selectively attract components in a sample mixture. The stationary phase is usually contained in a tube of some sort. This tube is referred to as a column [Hübschmann H., 2009]. The mixture of compounds in the mobile phase interacts with the stationary phase. Each compound in the mixture interacts at a different rate. Those that interact the fastest will exit (elute from) the column first. Those that interact slowest will exit the column last. By changing characteristics of the mobile phase and the stationary phase, different mixtures of chemicals can be separated. Further refinements to this separation process can be made by changing the temperature of the stationary phase or the pressure of the mobile phase [Mc Master M. C., 2008]. The capillary column is held in an oven which can be programmed to increase the temperature gradually: this helps the separation. As the temperature increases, those compounds that have low boiling points elute from the column sooner than those that have higher boiling points. Therefore, there are actually two distinct separating forces: temperature and stationary phase interactions mentioned previously. As the compounds are separated, they elute from the column and enter a detector. The detector is capable of creating an electronic signal whenever the presence of a compound is detected. The greater the concentration in the sample, is the bigger the signal. The signal is then processed by a computer. The time between when the injection is made (time zero) to when elution occurs is referred to as the retention time (RT). While the instrument runs, the computer generates a graph from the signal, called a chromatogram. Each of the peaks in the chromatogram represents the signal created when a compound elutes from the GC column into the detector. The x-axis shows the RT, and the y-axis shows the intensity (abundance) of the signal. As the individual compounds elute from the GC column, they enter the electron ionization (mass spec) detector [Mc Master M. C., 2008]. There, they are bombarded with a stream of electrons causing them to break apart into fragments. These fragments can be large or small pieces of the original molecules. The fragments are actually charged ions with a certain mass. The mass of the fragment divided by the charge is called the mass to charge ratio (m/z). Since most fragments have a charge of +1, the m/z usually represents the molecular weight of the fragment. A group of 4 electromagnets (called a quadropole, focuses each of the fragments through a slit and into the detector. The quadropoles are programmed by the computer to direct only certain m/z fragments through the slit. The rest bounce away. The computer has the quadropoles cycle through different m/z one at a time until a range of m/z are covered. This occurs many times per second. Each cycle of ranges is referred to as a scan. The computer records a graph for each scan. The x-axis represents the m/z ratios. The y-axis represents the signal intensity (abundance) for each of the fragments detected during the scan. This graph is referred to as a mass spectrum. The mass spectrum produced by a given chemical compound is essentially the same every time. Therefore, the mass spectrum is essentially a fingerprint for the molecule. This fingerprint can be used to identify the compound. In the current research, GC-MS analysis has been of fundamental importance in the study of (organic) oil binders. With regard to this, a specific GC-MS method has been opportunely designed.
36

2.2.5 Solubility and extraction tests J.P. Teas introduced in 1960 the Teas chart, a three axes diagram in which are represented the solubility properties of solvents defined by their dispersion force (fd), dipolar force (fp) and hydrogen bonding (fh) (Figure 2.1) [Torraca G., 1984]. It is very useful for obtaining a visual indication of the potentialities of solvents, helping conservators in choose an appropriate solvent for restoration treatments. Nevertheless, the chart has several limitations, like the extreme simplification in defining the relations between solvents. The fractional solubility parameters are derived from dd, dp and dh (Hansen’s solubility parameters), which are the components of Hildebrand solubility parameter. The fractional solubility parameter for fh is obtained through
fh = (fh/(dd+dh+dp) ·100
Figure 2. 1: Teas Chart solubility diagram showing solubility parameters of common solvents and families of solvents with similar properties after [Horie C.V., 1987]
The solubility diagram only gives information on the solubility of a solvent or families of solvents but does not provide any indication about kinetics, leaching properties and conditions [Wolbers R., 2000]. Teas chart is a powerful predictive tool in the field of conservation of Cultural Heritage since it addresses the choice of a solvent or a mixture of solvents in cleaning operations [Cremonesi P.,2004]. The Italian Minister for Cultural Heritage (MiBAC) has finalised the "interactive triangle of solvents and solubility", which is one of the instruments for increasing the safety, selectivity and reproducibility of conservation treatments (Figure 2.2). In recent years, more studies have been performed on extractable components of oil paint films [Sutherland K.,2001]. Swelling and leaching normally occur in oil films when subjected to cleaning treatments.
37

Figure 2. 2: interactive Teas Chart solubility diagram by MiBAC (Italian Minister of Cultural Heritage) [http://iscr.beniculturali.it/flash/progetti/TriSolv/TriSolv.html]
Step-wise extractions with solvents are commonly in use in the laboratory dealing with Cultural Heritage. As it is shown in Figure 2.3, extraction are generally performed using selective solvents to dissolve different components eventually present in the traditional oil paints (which are subsequently analysed to know their composition) [Baumer U., 1993] This extraction scheme has been adapted
Figure 2.3: step-wise extraction by the Doerner Institute, Munchen [KollerJ., 1993] Teas chart and step-wise extraction have been considered during this research in order to choose the appropriate solvent/mixture of solvents to perform extractions on modern (manufactured) oil paint films.
38
2.2.6 Accelerated ageing Accelerated ageing is usually carried out on the field off Culture Heritage for three main reasons. The first is to establish in a convenient short time the state of materials considering their chemical stability and physical durability over time. The second objective is to estimate potential long-term behaviours of the material systems under expected conditions. Finally, processes of deterioration are speeded up in the laboratory in order to achieve a better understanding of the chemical reactions involved for example in the degradation and its physical consequences [Feller R., 1994]. In this last sense, accelerated ageing helps the development of techniques which can monitor the extent of degradation. Nevertheless, accelerated ageing has some limitations due principally to the fact that processes involved in natural ageing are too numerous and unpredictable to be standardised in an ideal behaviour. Accelerated ageing is in any case a good help in evaluating what occurs of samples subjected to particular ageing conditions. According to these reasons, accelerated ageing has been carried out on paints reconstructions containing lipidic binding media, additives and pigments. 2.2.7 Multivariate statistical analysis Several researches in the field of Cultural Heritage conservation require multivariate statistical analysis to optimise the use of the collected data. The main objective is to evaluate and compare artistic materials composition, the state of conservation, the chemical-physical changes over time, the results of conservation treatments and so on. Art materials and especially works of art have two particular characteristics which have to be taken into account in any statistical analysis. They are internally heterogeneous and individually distinct in composition, form, and history [Reedy T., 1988]. This extreme variability has to be considered in the employ of statistical procedures, in particular with multivariate statistical analysis. Chemometrics is the science which uses mathematics and statistics knowledge to explore a complex system and extract information from experimental data. It is a highly interfacial discipline, using methods frequently employed in core data-analytic disciplines such as multivariate statistics, applied mathematics, and computer science, in order to address problems in different fields [Todeschini R., 1998]. Chemometric techniques are applied on data matrix, which describe the analysed system in terms of n objects · p variables. The exploration of a data-structured system involves problems of clustering and classifying [Massart D. L., 2003]. Among several chemometric techniques, cluster analysis and principal component analysis are here decribed. Cluster Analysis or clustering is the assignment of a set of observations into subsets (called clusters) so that observations in the same cluster have a certain similarity, defined in some sense. By clustering, dendrograms (also called tree-charts) are obtained in which it is possible to establish the formation of clusters using a specific definition of distance (for example, the Euclidean distance) and a specific cluster algorithm (for example, the Ward’s metod) [Brereton R., 1992; Massart D. L., 2003]. Principal Components Analysis (PCA) involves a mathematical procedure which transforms a number of possibly correlated variables into a number of uncorrelated variables called principal components (PC). PC are related to the original variables by an orthogonal
39

transformation. This transformation is defined in such a way that the first principal component has variance as high as possible and each succeeding component in turn has the highest possible variance under the constraint that it be orthogonal to the preceding components [Piazza R., 2005]. Once the principal components identified, the weights of each variable are defined in a loadings matrix. This creates the loading plots, bi-dimensional graphs in which it is possible to see how variables are distributed on the PC. Score plots are, however, graphs where the object’s position is represented by the coordinates on the PC space. Cases studied in this research have been considered typical example of complex data systems to be subjected to multivariate statistical analysis. In particular, data coming from GC-MS analysis of oil paint formulations were statistically analysed by clustering and PCA.
40

CHAPTER 3
MATERIALS AND METHODS
Abstract This chapter is focused on materials and methods employed for the study of reference materials and modern oil paints formulations. This study has taken into consideration standards of drying oils and common industrial additives, also used for preparing laboratory-prepared oil films. Subsequently, original tube oil colours from the his orical collections and modern manufacturing dating from the 1920s to the 2000s were studied.
t
r
Details of analytical techniques, experimental and instrumentation conditions are provided. Furthermore, a specific Gas Chromatography- Mass Spectrometry (GC-MS) procedure appositely designed for modern and contemporary lipidic binders and additives in manufactu ed oil paints is described further in detail. 3.1 REFERENCE OIL PAINTS: RECONSTRUCTIONS The reconstructions here described were carried out by using pictorial standard materials, commercial artists’ oils, industrial oil additives and pigments. Drying oils (cold-pressed linseed oil, stand oil, poppy seed oil, castor oil, Tung oil, safflower oil, sunflower oil, cottonseed oil) and pigments caput mortuum, black iron oxide, lead white, zinc white, chrome green, Prussian blue, cobalt blue, cadmium yellow and cadmium orange were purchased from Kremer, Germany. Alkali-refined linseed oil (ARLO), cold-pressed linseed oil (CPLO) and hydrogenated castor oil (HCO) and pigments chrome green pigment (CG), raw sienna pigment (RS), ultramarine pigment (UL) were provided by Old Holland, The Netherlands. Poppy seed oil and alizarin were purchased from Winsor & Newton, UK. Linseed oil and pigments cadmium red and lead white were provided by Schmincke, Germany. Aluminium and zinc stearates were purchased in technical grade from Sigma-Aldrich and provided in commercial grade by Talens, The Netherlands. Hydrogenated castor oil (or castor wax) was provided by Old Holland.
41

The reconstructed oil films were prepared in three sets: unpigmented (Table 3.1), pigmented (Table 3.2) and additives-containing oil films. The unpigmented and pigmented oil films from 2008 were prepared at the University Ca’ Foscari of Venice. Films were applied as 30µm-thick layers on glass slides; they naturally dried under laboratory conditions. The pigmented films from 1982 were prepared at RCE (ex ICN) mixing binder and pigments. The paints were then applied by brush and naturally dried under laboratory conditions.
Table 3. 1: unpigmented laboratory-prepared oil films
Abbreviation Description Year Substrate Ageing
CPLO Cold pressed linseed oil 2008 glass slide Natural (lab conditions)
STOIL Stand oil 2008 glass slide Natural (lab conditions) POP Poppy seed oil 2008 glass slide Natural (lab conditions) TUN Tung oil 2008 glass slide Natural (lab conditions) SAF Safflower oil 2008 glass slide Natural (lab conditions) SUN Sunflower oil 2008 glass slide Natural (lab conditions) COT Cottonseed 2008 glass slide Natural (lab conditions) CAS Castor Oil 2008 glass slide Natural (lab conditions)
Table 3. 2: pigmented laboratory-prepared oil films Abbreviation Description Year Substrate Ageing
CMoil linseed oil + Caput Mortuum 2008 glass slide Natural (lab conditions)
BIoil linseed oil + Black Iron Oxide 2008 glass slide Natural (lab conditions) LWoil Linseed oil + lead white 2008 glass slide Natural (lab conditions) ZWoil Linseed oil+ zinc white 2008 glass slide Natural (lab conditions) CGoil Linseed oil + chrome green 2008 glass slide Natural (lab conditions) PBoil Linseed oil + Prussian Blue 2008 glass slide Natural (lab conditions) CBoil Linseed oil + Cobalt blue 2008 glass slide Natural (lab conditions) CYoil Linseed oil + cadmium yellow 2008 glass slide Natural (lab conditions) COoil Linseed oil +cadmium orange 2008 glass slide Natural (lab conditions) RSoil Linseed oil + raw sienna 2008 glass slide Natural (lab conditions)
PopSic Poppy seed oil + 1% siccative 1982 glass slide Natural (lab conditions) PopAl Poppy seed oil + alizarin 1982 glass slide Natural (lab conditions) CRoil Cadmium Red + linseed oil 1982 glass slide Natural (lab conditions) oilLW Linseed oil +Lead White 1982 glass slide Natural (lab conditions)
42

Table 3. 3: pigment- and additive-containing oil films prepared at RCE and artificially aged
Abbreviation Description Year Substrate Ageing
U2 cold-pressed and alkaline
refined linseed oil + Ultramarine Blue
2008 Melinex Artificial (≈ 45 years)
U2AS2P U2 + 2% Aluminium Stearate 2008 Melinex Artificial (≈ 45 years)
U2AS10P U2 +10% Aluminium Stearate 2008 Melinex Artificial (≈ 45 years)
U2AS20P U2 +20% Aluminium Stearate 2008 Melinex Artificial (≈ 45 years)
U2ZS2P U2 +2% Zinc Stearate 2008 Melinex Artificial (≈ 45 years) U2ZS10P U2 +10% Zinc Stearate 2008 Melinex Artificial (≈ 45 years) U2ZS15P U2 +15% Zinc Stearate 2008 Melinex Artificial (≈ 45 years) U2ZS20P U2 +20% Zinc Stearate 2008 Melinex Artificial (≈ 45 years) U2ZS30P U2 +30% Zinc Stearate 2008 Melinex Artificial (≈ 45 years)
CG cold-pressed and alkaline
refined linseed oil + Chrome oxide Green
2008 Melinex Artificial (≈ 45 years)
CGAS2P CG + 2% Aluminium Stearate 2008 Melinex Artificial (≈ 45 years)
CGAS5P CG +5% Aluminium Stearate 2008 Melinex Artificial (≈ 45 years)
CGAS10P CG +10% Aluminium Stearate 2008 Melinex Artificial (≈ 45 years)
CGAS20P CG +20% Aluminium Stearate 2008 Melinex Artificial (≈ 45 years)
CGAS30P CG +30% Aluminium Stearate 2008 Melinex Artificial (≈ 45 years)
RS cold-pressed and alkaline refined linseed oil + Raw
Sienna 2008 Melinex Artificial (≈ 45 years)
RSAS2P RS + 2% Aluminium Stearate 2008 Melinex Artificial (≈ 45 years)
RSAS5P RS +5% Aluminium Stearate 2008 Melinex Artificial (≈ 45 years)
RSAS10P RS +10% Aluminium Stearate 2008 Melinex Artificial (≈ 45 years)
RSAS20P RS +20% Aluminium Stearate 2008 Melinex Artificial (≈ 45 years)
RSAS30P RS +30% Aluminium Stearate 2008 Melinex Artificial (≈ 45 years)
U2HCO U2 + 2% Hydrogenated castor oil 2008 Melinex Artificial (≈ 45 years)
U5HCO U2 + 5% Hydrogenated castor oil 2008 Melinex Artificial (≈ 45 years)
43

Additive-containing films in Table 3.3 were prepared by P. Saltmarsh and K.J. van den Berg at RCE in 2008. The powdered aluminium and zinc stearates were added to the pigments as a weight percentage of the dry content of the pigment; stearates were added to the pigments prior to the addition of oil binder. Hydrogenated castor was added to the oil binder for 2 and 5% by weight of the binder. Three pigments were chosen for the study based on their various degrees of sensitivity in dried oil paint films: ultramarine, chromium oxide green and raw sienna [Burnstock A., 2007; Mills L., 2008; Tempest H., 2009]. All of the paint samples were mixed with an automatic mill provided by Old Holland, which replicates the action of the industrial three-roller steel mill used in factories. The substrate used for these sample paint films was 100µm-thick melinex. Each painted-out sample was given a flat area and an area of impasto; a draw-down bar with a fixed clearance of 25µm was used for the flat areas and a palette knife was used for the impasto [Saltmarsh P., 2008].
Figure 3. 1: reconstruction paints using
ultramarine, chromium oxide green and raw sienna and variable amounts of drying oils
and additives
Figure 3. 2: automatic mill provided by Old
Holland for the preparation of reconstructed oil films
3.2 MANUFACTURED OIL PAINTS The manufactured oil films can be divided into three cases: historical tube oil paints from Dutch producers; mock-up paints by an oil manufacturer (Winsor&Newton); modern commercial oil paints from different countries. Historical oil paints are reported in Table 3.5. They were sampled directly from tubes, from the external leaking of colours or from the internal part of the tubes. In some cases, when tube caps were impossible to unscrew, paint samples have been taken from the outside of the tube or in correspondence of a hole on the tin covering [Litjens S., 2010]. The conditions of the historical tubes and consequently of the paints varied. Some of the collected samples were dried and with hard consistency, in particular those taken from the outside of tubes. Other samples, mainly those from the internal paste, were still soft and/or tacky.
44

Figure 3. 3: Talens oil colours, original tubes from the 1950s
Figure 3. 4: Gimborn oil colours, original
tubes from the 1940s
Figure3.5: Talens-Rembrandt oil colour,
1920s
Figure 3.6: Talens-Rembrandt oil colour,
1950s
Figure 3.7: Old Holland oil colour, 1950s
Figure 3.8: the art box of the Dutch
conservator Roy Hesterman
45

Table 3. 4: list of oil paints by different manufacturers, which have been analysed taking oil samples directly from tubes
Colour name (as reported on the label*) Series Period of
productionCollection
(provenance)Talens, The Netherlands
Ultramarijn Donker Talens-Rembrandt c.1950 Historisch Museum Rotterdam
Koningsblauw Talens-Rembrandt c.1950 Historisch Museum Rotterdam
Cobaltblauw Licht Talens-Rembrandt c.1950 Historisch Museum Rotterdam
Cadmiumgeel Licht Imit. Talens-Van Gogh c.1950 Historisch Museum Rotterdam
Cadmiumgeel midden Talens-Rembrandt c.1950 Chabot Museum Rotterdam
Zinkwit Talens-Rembrandt c.1950 Chabot Museum Rotterdam
Ultramarijn Donker Talens-Rembrandt c.1950 Chabot Museum Rotterdam
Mangaanblauw Phtl. Talens-Rembrandt c.1950 Mauritshuis Den Haag
Groene Aarde Talens-Rembrandt c.1950 Mauritshuis Den Haag
Cadmiumrood Licht Talens&Zoon c.1940 Privé collectie Oostendorp
Karmijnlak Talens&Zoon c.1940 Privé collectie Oostendorp
Permanentgroen Talens&Zoon c.1940 Privé collectie Oostendorp
Lampenzwart Talens-Van Gogh c.1950 Privé collectie Oostendorp
Gimborn, The Netherlands
Rood 07 Artists’ oil colours c.1950 Privé collectie Oostendorp
Ijsblauw Artists’ oil colours c.1950 Privé collectie Oostendorp
Old Holland, The Netherlands
Cadmium Rood Artists’ oil colours c.1960 Mauritshuis Den Haag
Rauwe Omber Artists’ oil colours c.1960 Mauritshuis Den Haag
Vermiljoen Extra Artists’ oil colours c.1960 Mauritshuis Den Haag
Gebrande Omber Artists’ oil colours c.1960 Mauritshuis Den Haag
Haagsche Kunstschildersverven Fabriek, The Netherlands
Smaragd Groen Artists’ oil colours c.1940 Collectie Old Holland
Goud Oker Artists’ oil colours c.1940 Collectie Old Holland
Cobalt Violet Artists’ oil colours c.1940 Collectie Old Holland
Monastraal Blauw Artists’ oil colours c.1940 Collectie Old Holland
Chrome Groen Artists’ oil colours c.1940 Collectie Old Holland
Claus & Fritz, The Netherlands
Geelgroene Zinnober Artists’ oil colours c.1920 Amsterdam Historisch Museum
Vermiljoen Artists’ oil colours c.1920 Amsterdam Historisch Museum
Lichte Cadmium Artists’ oil colours c.1920 Amsterdam Historisch Museum
Geeloker Artists’ oil colours c.1920 Amsterdam Historisch Museum
Cadmiumgeel Licht Artists’ oil colours c.1920 Amsterdam Historisch Museum
Ultramarijn Artists’ oil colours c.1920 Amsterdam Historisch Museum *translated names are provided in the Chapter 4.2 (Results and discussions)
46

Winsor&Newton produced in 1964-65 a set of mock-ups (Table as part of the production process to check whether the paints were correct. These paints were painted on canvas and let to dry under laboratory conditions. After few months, painted canvases were stored in a dark cupboard [Burnstock A., 2010].
Table 3. 5: list of W&N mock-ups from the series Student Paints 1964-65
Colour name
Series Period of
production Collection (Institute)
Consistency
Titanium White Students’ paints quality 1964-65 CIA Dried, hard Burnt Sienna Students’ paints quality 1964-65 CIA Dried, hard Raw Sienna Students’ paints quality 1964-65 CIA Dried, hard Flake White Students’ paints quality 1964-65 CIA Dried, hard
Ultramarine Blue Students’ paints quality 1964-65 CIA Dried, hard Cobalt Blue Students’ paints quality 1964-65 CIA Dried, hard
Prussian Blue Students’ paints quality 1964-65 CIA Dried, hard
Figure 3.9: W&N oil colours, original paints from 1960s
Figure 3.10: Maimeri artists’ oil colours, 1990s
Figure 3.11: LeFranc and Talens oil paints
Figure 3.12: Laboratory-prepared samples from modern tube oil paints (W&N, Talens and
Old Holland)
47

A selection of tube oil paints from Winsor&Newton, Talens, Old Holland, Louvre and Maimeri were applied on glass or melinex substrate and let to dry naturally under laboratory condition. They are listed in Table 3.6 taking into account the year when the colours were painted out and the period in which the paints were produced.
Table 3. 6 list of oil paints by different manufacturers, which have been painted out and dried
Colour name (as reported on the
label) Series Application
year Production
period Collection (Institute)
Winsor&Newton, UK 1235L (yellow) Artists’ oil 2004 1960s RCE 1285L (yellow) Artists’ oil 2004 1960s RCE
1425L (red) Artists’ oil 2004 1960s RCE Cobalt blue Artists’ oil 2004 1960s RCE
Permanent Blue Artists’ oil 2004 1960s RCE Ultramarine Blue Artists’ oil 2008 2000s RCE Cadmium Yellow Artists’ oil 2008 2000s RCE Chrome Green Artists’ oil 2008 2000s RCE
Talens, The Netherlands Ultramarine Blue Rembrandt 2008 2000s RCE Cadmium Yellow Rembrandt 2008 2000s RCE Chrome Green Rembrandt 2008 2000s RCE
Old Holland, The Netherlands Ultramarine Blue Artists’ oil 2008 2000s RCE Cadmium Yellow Artists’ oil 2008 2000s RCE Chrome Green Artists’ oil 2008 2000s RCE
Maimeri, Italy Titan White Extra fine artists’ oil 2008 2000s UniVe
Cerulean Extra fine artists’ oil 2008 2000s UniVe Mars Brown Extra fine artists’ oil 2008 2000s UniVe Burnt Umber Extra fine artists’ oil 2008 2000s UniVe
Mars Red Fine artists’ oil 2008 2000s UniVe Cadmium yellow Fine artists’ oil 2008 2000s UniVe
Chrome Oxide Green Fine artists’ oil 2008 2000s UniVe Prussian Blue Fine artists’ oil 2008 2000s UniVe
LeFranc, France Sap Green Louvre oil colour 2008 2000s RCE
Orange PY65 Louvre oil colour 2008 2000s RCE Yellow PY74 Louvre oil colour 2008 2000s RCE
48

3.3 ANALYTICAL TECHINIQUES: EXPERIMENTAL CONDITIONS AND INSTRUMENTAL DETAILS 3.3.1 FT-ATR-IR Fourier transform (Attenuated total reflectance) infrared spectrometry (FT- ATR- IR) was applied for the study of constituent materials of reconstructions and tube oil paints. The analysis was carried out in two modes and in two laboratories: - at the University Ca’ Foscari, after preparing samples as KBr micropellets, FT-IR was performed from 4000 to 400 cm-1 for 32-64 scans and a resolution of 4 cm-1 with a Nicolet Nexus 670 instrument. Data was collected and analysed using Omnic 6.0a software. - at RCE1, FT-IR-ATR was performed using a Perkin Elmer Spectrum 1000 FT-IR combined with a Graseby Specac Golden Gate Single Reflection Diamond ATR. 3.3.2 X-Ray-Fluorescence (XRF) spectrometry Samples of reference materials and tube paints were analysed in a non destructive way by X-ray-fluorescence (XRF) spectrometry, which was performed at RCE2 using a Bruker Tracer III-V portable XRF instrument, equipped with a low power Rh-tube operating at 40 kV and 2.2 uA and a peltier cooled Si-PIN detector. 3.3.3 Thermal analyses Thermogravimetry (TG) and Differential Scanning Calorimetry (DSC) were performed simultaneously using a Netzsch 409/C apparatus at the University Ca’ Foscari of Venice. Data was collected with STA Netzsch software and then elaborated with Origin 8 software. The sample weight ranged between 2 and 5 mg; samples were weighted in aluminium crucible by the TG internal balance. The temperature program used was set up experimentally from 30°C, 10°C/min to 550°C (560°C) in air and in N2 atmosphere. 3.3.4 Accelerated ageing Accelerated ageing has been performed to increase the rate of ageing of the laboratory-prepared films and oils from tube paints painted out on different substrates. The list of aged samples in reported in table Table 3.3. Artificial ageing of test paint films was carried out at Stichting Restauratie Atelier Limburg (SRAL), Maastricht. The total ageing time of 2800 hours is calculated to be equivalent to circa 45 years of exhibition in recommended museum conditions, 200 lux, eight hours a day, assuming reciprocity,36 W Philips colour 96.5 fluorescent lamps with UV filtering (transmission 15 Watts/lumen) [Mills L., 2009]. 1 FT-IR analyses were performed in collaboration with Dr. Susan De Groot, who is kindly acknowledged. 2 XRF analyses were performed by Dr. Luc Megens, who is thankfully acknowledged.
49
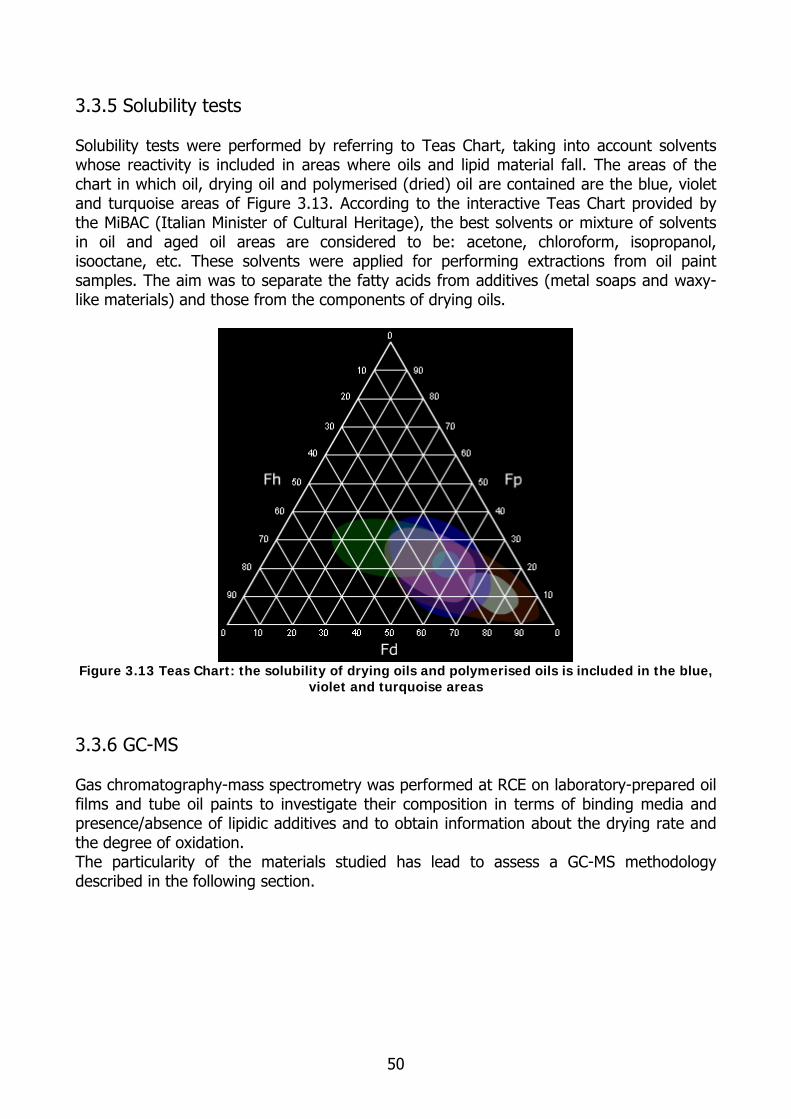
3.3.5 Solubility tests Solubility tests were performed by referring to Teas Chart, taking into account solvents whose reactivity is included in areas where oils and lipid material fall. The areas of the chart in which oil, drying oil and polymerised (dried) oil are contained are the blue, violet and turquoise areas of Figure 3.13. According to the interactive Teas Chart provided by the MiBAC (Italian Minister of Cultural Heritage), the best solvents or mixture of solvents in oil and aged oil areas are considered to be: acetone, chloroform, isopropanol, isooctane, etc. These solvents were applied for performing extractions from oil paint samples. The aim was to separate the fatty acids from additives (metal soaps and waxy-like materials) and those from the components of drying oils.
Figure 3.13 Teas Chart: the solubility of drying oils and polymerised oils is included in the blue,
violet and turquoise areas 3.3.6 GC-MS Gas chromatography-mass spectrometry was performed at RCE on laboratory-prepared oil films and tube oil paints to investigate their composition in terms of binding media and presence/absence of lipidic additives and to obtain information about the drying rate and the degree of oxidation. The particularity of the materials studied has lead to assess a GC-MS methodology described in the following section.
50

3.4 IMPROVEMENT OF A GAS CHROMATOGRAPHY-MASS SPECTROMETRY METHODOLOGY FOR 20TH CENTURY ARTISTS’ OIL PAINTS A particular Gas Chromatography-Mass Spectrometry (GC-MS) procedure has been designed specifically for modern and contemporary oil paints with the aim to investigate lipidic media and additives present in 20th century manufactured oils. An innovative combination of extraction and derivatisation methods that reduces the treatments complexity, time and amount of sample is described. 3.4.1 State of the art of GC-MS analysis on artists’ oils Since the 1960s, GC-MS has been a fundamental tool in the analysis of organic art materials, among them oil paints. The pioneering works of Mills [Mills J. S., 1966] showed the capability of the GC-MS method to determine and differentiate between different kinds of lipidic binders by comparing their fatty acids compositions. For characterising lipidic materials, chemists have employed numerous methodologies to simplify lipids and derivatise their fatty acids (normally as methyl esters, FAMEs, or silyesters) prior to their analysis by GC-MS. Traditional methods for gas-chromatographic oil analysis typically involve alkaline solution to saponify the oil painting samples or acidic hydrolysis, followed by different derivatisation steps [Mills J.S., 1966] The approach of Colombini and colleagues is a multi-step chemical pre-treatment procedure, with solvent extractions and microwave-assisted chemolysis, which allows the identification of lipids, waxes, proteins and resinous materials in the same microsample. In particular, BSTFA (N,O-bis(trimethylsilyl)trifluoroacetamide) containing 1% of TBDMCS (trimethylchlorosilane) is used for the derivatisation of lipidic binders [Andreotti A., 2006]. Baumer and co-workers at the Doerner institute (Munchen) performed as well a multi-step extraction procedure prior GC-MS analysis, to separate different classes of organic materials, including lipids [Baumer U., 2007] Casoli et alii used acidic hydrolysis followed by derivatisation with trifluoroacetic anhydride in order to convert, at the same time, amino acids into N-trifluroacetyl-O-2-propyl esters and fatty acids into 2-propyl esters [Casoli A., 1995]. Marinach and co-workers proposed to dissolve oil samples in dichloromethane-methanol (95:5, v:v) mixture and then derivatise using boretrifluorure (BF3)-methanol (20:80, v:v) [Marinach C., 2004]. Van den Berg’s GC-MS method for oil paint samples involves a two-step analytical procedure, carried out without any further separation: the first step is a transetilation of esterified fatty acid performed with sodium ethoxide, while the second is a trimethylsilylation using BSTFA containing 1% of TBDMCS [v. d. Berg J.D., 2002]. Trimethylsulfonium hydroxide (TMSH) as a methylating agent for carboxylic compounds was recently used by Dron et alii: they suggested a method for the simultaneous analysis of fatty acids and glycerol, with rapid sample preparation and little manipulation [Dron J., 2004].
51

In the majority of cases, the methods described until here refer to analysis of traditional oil paints whose results have normally been compared with reference materials and laboratory-prepared oil films to determine their fatty acid compositions and thus identify them among traditional drying oils (linseed, poppy seed and walnut oil). In the last decades, studies have started to be focused also on modern and contemporary oil paintings, both as a cultural issue (knowledge of materials, technological developments, execution techniques) and conservative matter (degradation problems). Methods and procedures for 20th century paints are analogous to the previous ones, as in both situations the drying oils are identified by comparison of their fatty acid compositions. However, modern manufactured paint formulations contain different sources of lipidic materials (binders, dispersion agents, stabilisers, etc.) and they also need to be studied taking account the (unfortunately little) information available. Schilling and co-workers used different procedures to approach modern paintings, in particular Willem de Kooning’s works of art [Schilling M., 1999]. In the first metod, fatty acids methyl esters and isopropylidene glycerol were produced with sodium methoxide followed by methanolic HCl; the second procedure requires hexamethylene disilazane with trichloromethyl silane catalyst (HMDS/TMCS). The third one, also employed by Pitthard and colleagues, uses quaternary N-methylammonium salts for the preparation of fatty acids in samples from 20th century collapsible tube oils [Pitthard V., 2005]. 3.4.2 Choice of the reagent GC-MS analysis, as previously seen, often requires a complicated sample preparation, involving more steps and different reagents and solvents. Although these processes are trustworthy, they sometimes present problems regarding the health of operators and the manipulation of samples. Samples collected from real paintings are unique, precious and very minute (less than 0.05-0.1 mg) to perform a multistep reaction could be harsh. At the beginning of the current research, different procedures involving several reagents were tested before starting with the assessment of a specific GC-MS methodology. The reagents that seemed to adequately answer the specific needs described above were quaternary N-methyl ammonium salts. These salts allow, in fact, a direct methylation of carboxylic acids and their esters; in particular, with tetramethylammonium hydroxide (TMAH) in combination with heat, the transesterification takes place in situ in three steps [Pitthard V., 2005]: 1. Saponification: formation of acidic functional groups:
RCOOR’ + R’’4N+OH- RCOOH + R’’4N+OR’-
2. Formation of TMA salts: TMAH deprotonation of acidic groups to form tetramethylammonium salts
RCOOH + R’’4N+OH- RCOO- R’’4N+ + H2O ROH + R’’4N+OH- RO- R’’4N+ + H2O
3. Alkylation reactions: formation of methyl esters and trimethylamine as by-product.
RCOO- R’’4N+ RCOOR’’ + R’’3N RO- R’’4N+ ROR’’ + R’’3N
52

Besides TMAH, other aqueous or methanolic solutions of N-methylammonium salts are commonly used. Among them, Meth-Prep II®, which consists of a 0.2 M methanolic solution of (m-trifluoromethylphenyl)trimethylammonium hydroxide, is nowadays quite employed. It was firstly introduced in 1978 but has only recently been applied in the Conservation field [Schilling M., 1999; Pitthard V., 2005; Sutherland K., 2001]. This reagent was designed to simplify the transesterification of triglycerides to methyl esters: in fact, the reaction occurs at room temperature, and no extraction or additional treatments are required prior to GC analysis. In addition, Meth-Prep II® enables the simultaneous identification of lipids, waxes and resinous materials as methyl esters of their components and can be widely used for the study of the organic materials in art samples. More in detail, the reaction with oil polymers can be summarised as follows:
1. H3C(CH2)16COOH + H3C(CH2)16COO-R + 2R’N(CH3)3+OH- 2H3C(CH2)16COO-
R’N(CH3)3+ + R-OH
2. H3C(CH2)16COO-R’N(CH3)3+ H3C(CH2)16COOCH3 + R’N(CH3)2
where R represents the oil polymer, while R’ represents the trifluoromethylphenyl group. In the last reaction, methyl esters are formed together with (trifluoromethyl)aniline as a by-product. 3.4.3 Experimental After choosing Meth-Prep II® as the reagent, tests were carried out to optimise and assess the GC-MS method. Firstly, it was tested on a mixture solution composed of free fatty acids and glycerol. The application of the method was then carried out on samples from paints reconstructions and tube oil paints were considered too (but their results are shown in next chapter in a more exhaustive way). 3.4.3.1 Optimisation of the GC-MS method Materials
- Standards Fatty acid standards were purchased in analytical grade from Sigma-Aldrich, namely: monosaturated (nonanoic C9:0, dodecanoic C12:0, tetradecanoic C14:0, hexadecanoic C16:0, octadecanoic C18:0, nonadecanoic C19:0, eicosanoic C20:0, heneicosanoic C21:0), unsaturated (octadecenoic C18:1, octadecadienoic C18:2, octadecatrienoic C18:3) and dicarboxylic (octanedioic 2C8, nonanedioic 2C9, decanedioic 2C10) acids. Glycerol (1,2,3-propan-triol) was purchased in analytical grade from Fluka. Anthracene (99.9% pure) was purchased from Sigma-Aldrich. 12-hydroxy-octadecanoic acid was purchased in analytical grade from Sigma-Aldrich. Aluminium and zinc stearates were purchased in technical grade from Sigma-Aldrich.
53

- Transesterification reagent
Meth-Prep II® 0.2 M methanolic (trifluoromethylphenyl)trimethylammonium hydroxide (TFTMAH) was purchased from Alltech Associates Inc.
- Organic solvents Methanol, Ethanol, Chloroform, Isoctane, Isopropanol were purchased in ultra-grade from Sigma-Aldrich.
- Pictorial reference materials Drying oils (raw linseed oil, heat-bodied linseed oil, stand oil, poppy seed oil, walnut oil, castor oil, stand castor oil, Tung oil, safflower oil, sunflower oil, etc.) and beeswax were provided by Kremer. Evaluation of the GC-MS method
- GC-MS instrumental conditions The GC-MS analysis was performed by using a Thermo Quest GC-8000 instrument with a Supelco Column equity 5, 30 m, 0.25 mm, 0.5 um interfaced with MS MD-800. The inlet temperature was 300°C, while the MS interface was at 270°C. According to specific literature [Sutherland K, 2001], the temperature programme was set from 120°C to 300°C with a ramp of 10°C/min, held isothermally for 3 minutes; total runtime 20 minutes. For the beeswax sample, the final temperature was increased until 310°C, held for 5 minutes; total runtime 30 minutes. The MS was run is Full Scan mode (m/z 40-600) with a speed of 1.9 scans/sec. Solvent delay was set at 4.5 min. The transferline was at 240°C and the source temperature was 220°C. Electron Ionisation energy was 70eV. Data were processed using Xcalibur 1.2 software and AMDIS.
- Standard solution and internal standards Fatty acid and glycerol standards were analysed individually to obtain the single chromatographic retention time and the correspondent mass spectrum (compared to the literature library). A stock solution containing a mixture of glycerol and fatty acid (See Materials) in isopropanol was prepared at a concentration of 0.5 mmol/l for each fatty acid and 2.5 mmol/l for glycerol. For the calibration tests3, standard solutions at concentrations ranging from 0.1 to 0.4 mmol/l for the fatty acids and 0.5 to 2.0 mmol/l for glycerol were prepared from the stock solution. In order to test the completeness of the reaction, anthracene (C14H10) was used as an “injection” standard (needed for manual injections). The use of anthracene is supported by the fact that it is soluble in methanol; it doesn’t react in the derivatisation steps and produces a recognizable mass spectrum and a well separated component peak in the chromatogram. The four dilutions from the standard
3 The calibration function is constructed from the measurement of known concentration, as the dependence of the height of the signal on the operating parameters and the current state of the mass spectrometer, fixed response factors can only be used to a limited degree in GC/MS. The calibration function generally describes the dependence, the regression calculation gives a straight line for the calibration function, the equation for which contains the blank value a0 and the sensitivity a: f(x)= a0 + ax
54

mixture described above, were analysed by GC-MS after the addition of Meth-Prep II®-anthracene. Their peak areas have been leveled out by the injection standard. The calibration plots showed the relationship between peak areas and concentration for a given compound present in the standard solution. Figure 3.14 displays the calibration test considering palmitic acid methyl ester (a common and abundant fatty acid in drying oils). In all other cases, calibration tests showed completeness of the derivatisation of the free fatty acid (as methyl ester) present in the standard solution. They all exhibited linearity in the calibration tests, following the generic formula y = a0 + ax: the correlation coefficient was higher than 0.99 for all methyl esters. These results were also useful for (further) quantitative GC-MS calculations on oil paint samples, as it was shown that the detector response (i.e. the voltage output for unit change in solute mass passing through the detector) was linear over this range of concentrations. According to this consideration, the use of the injection standard (anthracene) was replaced by two fatty acids used as internal standards, nonadecanoic acid C19 and heneicosanoic acid C21. They were separately prepared in chloroform at a concentration of 1mmol, fixed value. The odd fatty acids C19 and C21 are compound which are not present is a high extend in natural oils, but match closely to the fatty acids present in the standard solution and the paint samples Their GC peaks, which are well recognizable from the other fatty acids, are depicted in Figure 3.15. C19 and C21 were added to correct for the loss of analyte during sample preparation or sample inlet and to quantify fatty acids (see Quantitation).
0
100000
200000
300000
400000
500000
600000
700000
800000
900000
0 0,1 0,2 0,3 0,4 0,5 0,6
mmol/l
peak
are
a
Figure 3.14: Calibration test: results obtained with target solution at different concentration, plotting the peak areas and the concentration for palmitic acid methyl ester
55

RT: 0,00 - 21,19
0 2 4 6 8 10 12 14 16 18 20Time (min)
0
20
40
60
80
100
Rel
ativ
e A
bund
ance
0
20
40
60
80
100R
elat
ive
Abu
ndan
ce16,05
21,0619,4418,718,56 17,0515,685,92 11,819,24 14,066,494,7517,77
5,43 20,1819,3612,56 17,5114,427,566,01 11,649,868,25 15,91
NL:7,58E4Base Peak m/z= 311,50-312,50 F: MS c19+chlor+methii
NL:3,30E4Base Peak m/z= 339,50-340,50 F: MS c21+chlor+methii
Figure 3.15: Total ion current chromatogram of C19 (above) and C21 (below) after transesterification and GC-MS analysis
- Assessment of the use of reagent
The stability of the reagent and the quantity of Meth-Prep II® reagent needed for obtaining a good derivatisation yield were investigated; in the same way, the reaction time and temperature reaction were optimised in order to obtain a good reaction yield.
a) Stability of the reagent Blank runs of reagent solutions with an aliquot of anthracene (0.02 mg/ml) were performed after 1, 2, 4, 24, 36, 48, 120, 168, 336 hours since the solution was prepared. The presence of anthracene was used in this case for evaluating the stability of Meth-Prep II®, since it produces a separated component peak in the chromatogram which can be compared with those eventually occurring after decomposition of the reagent. It was shown that Meth-Prep II® demonstrated good stability in time: in fact, after 336 hrs (two weeks) the formation of by-products was not detected by GC-MS. In Figure 3.16, in fact, the chromatograms of the different time intervals are reported: the only peaks detectable are the ones at approximately 12 minutes, referring to anthracene. Nevertheless, it is preferable to keep the reagent stored under N2 atmosphere in order to avoid the formation of oxidative by-products.
56

Figure 3.16: Stability tests carried out on Meth-Prep II® after (from above) 1, 2, 24, 48, 120,
336 hours: peaks at c.11.90 min refer to anthracene
RT: 6,19 - 13,67NL: 1,13E7
0
3000000
6000000
9000000
0 ul 10ul + 10ultoluene
10ul 30 ul 30ul+30ultoluene
50 ul 100 ul
TFTMTH volume (ul)
Peak
are
as
suberic acidazelaic acidpalmitic acidstearic acidoleic acidnonanoic acid (IS)
Figure 3.17: progress of transesterification of fatty acids as a function of the volume of Meth-
Prep II® (TFTMTH) (expressed in µl). All values come from triplicate experiments.
7 8 9 10 11 12 13Time (min)
0
200
0
200
0
200
0
200
0
TIC F: MS 200Meth_PrepII+11,92Anthracene6,41 8,58 12,34 12,90 13,636,86 7,23 7,80 8,21 8,79 9,26 9,91 10,64 11,26 11,81
0 NL: 1,60E6TIC F: MS 200meth_prepii+11,89anthracene_100106146,43 8,57 12,886,87 7,25 8,207,51 8,77 9,50 9,93 10,63 10,96 11,78 12,01 13,43 1325NL: 1,96E6TIC F: MS
11,80 meth_prepii+8,476,32 12,787,14 8,117,39 8,71 9,05 11,8810,539,61 9,84 11,6910,87 13,62 anthracene_10010711
3633NL: 4,33E6TIC F: MS 11,86meth_prepii+6,38 8,546,84 7,20 7,45 8,18 8,74 9,23 9,89 10,61 11,08 11,75 12,30 12,85 13,42 anthracene_100108095927NL: 8,67E6
12,04 TIC F: MS 8,68 13,026,51 10,76 12,806,97 7,32 7,60 8,31 8,90 9,53 10,32 11,07 11,92 meth_prepii+
anthracene_100115112259NL: 7,39E612,03TIC F: MS 6,51 8,68 13,017,32 8,31 12,456,97 7,91 9,03 9,52 10,05 10,76 11,50 11,92meth_prepii+anthracene_100118090642
57

b) Quantity of TMTFTH
Experimental tests were carried out to determine the optimal quantity of Meth-Prep II® to use in order to reach the highest derivatisation yield. As reported in the specific literature, 10, 30, 50 and 100 µl were tested with 100 µl of solvent mixture (1:2 v/v methanol:toluene) [Pitthard V., 2005] or 1:1 mixture of Meth-Prep II® with benzene [Sutherland K., 2007]. Tests were carried out using six levels of reagent, with three replicates: 10, 30, 50, 100 µl of Meth-Prep II®; 20 and 60 µl of Meth-Prep II®: Toluene (1:1, v:v). The transesterification reagent was added to 10 µl of the target solution (at 0.5 mmol/l of fatty acids concentration). Figure 3.17 displays the progress of transesterification of fatty acids from the solution as a function or the reagent volume. The derivatisation yield of all compounds increases until a volume of 30 µl of reagent is added. Larger volumes of reagents or mixture of reagent and toluene do not increase the derivatisation yield in a significant way. 30 µl was the chosen amount of reagent for sample treatment prior GC-MS analysis.
c) Reaction time and temperature To obtain a most favourable reaction time and temperature, experiments were carried out. As regarding reaction time, it is to point out that a certain stability of the methyl esters formed in the transesterification has to be achieved, samples were not analysed immediately after the reaction. 30 µl of Meth-Prep II® were added to an aliquot of the target solution, then analysed by GC-MS. Tests were performed after 1, 2, 4, 24 and 48 hours since the addition of the reagent. Results for the methyl esters of azelaic, suberic, palmitic and stearic (i.e. the most abundant fatty acids in dried oil films) acids are illustrated in Figure 3.18. The transesterification of fatty acids is apparently incomplete after 1, 2 and 4 hours, while after 24 hours the values of the peak areas increased, without any remarkable further increase after 48 hours. As concerning reaction temperature, the first consideration is linked to the relatively low boiling point of methanol (64°C), which is the Meth-Prep II® solvent. Some authors heated up the reaction mixture to 60°C but other authors indicated that an additional heating step did not notably improve the yields of methyl esters [Sutherland K., 2001]. According to the tests performed, the best derivatisation yield was achieved at room temperature with 24 hours (or overnight) reaction.
- Qualitative Results The total ion current (TIC) chromatogram of the standard solution after transesterification with Meth-Prep II® and GC-MS analysis is illustrated in Figure 3.19 It was obtained adding 30 µl of reagent to 10 µl of (dried) standard solution, let reacting overnight at room temperature. The chromatogram shows the presence of fatty acid- and glycerol-derivatives.
58

0
100000
200000
300000
400000
500000
600000
700000
800000
900000pe
ak a
rea
1 hour 2hous 4 hours 24 hours 48 hours
reaction Time
azelaicsubericpalmiticstearic
Figure 3.18: results for determining reaction time for GC-MS analysis with Meth-Prep II®. All
values come from triplicate experiments.
Figure 3.19: Total ion chromatogram of the standard solution after transesterification and GC-
MS analysis
59

Under the experimental conditions, fatty acids were transesterified into their correspondent methyl esters. Methyl esters of straight-chain fatty acids have characteristic spectra. The mass spectrum of methyl palmitate is shown in Figure 3.20.
Figure 3.20: mass spectrum of palmitic acid methyl ester after [Christie W.W. ,2003]
The molecular ion at m/z=270 is clearly seen, as is an ion at 239 ([M-31]+) representing the loss of a methoxyl group, and confirming that it is indeed a methyl ester. An ion at m/z=227 ([M-43]+) represents the loss of a C3 unit (carbons 2 to 4), via a complex rearrangement, while that at m/z=74 is the McLafferty rearrangement ion. The latter has a special significance as it confirms that the spectrum is that of a methyl ester.
The McLafferty Rearrangement The McLafferty rearrangement involves the migration of an H-atom in a six-membered ring transition state. The following conditions must be fulfilled for the rearrangement to take place:
− The double bond C=X is C=C, C=O or C=N. − There is a chain of three sigma-bonds ending in a double bond. − There is an H-atom in the gamma-position relative to the double bond which can be
abstracted by the element X of the double bond According to convention the McLafferty rearrangement is classified as the loss of neutral particles (alkene elimination with a positive charge remaining on the fragment formed from the double bond).
Figure 3.21: general scheme of McLafferty Rearrangement The characteristic ions formed in the McLafferty rearrangement for methyl esters is at m/z=74 (O-CH3).
60

An ion at m/z=241 ([M-29]+) is also diagnostic and worthy of note. The long homologous series of related ions at m/z=87, 101, 115, 129, 143, 157, 199, etc. of general formula [CH3OCO(CH2)n]+ is evidence that there are improbably other functional groups in the chain. According to these considerations, the fatty acids in the standard solution were identified (Table 3.7). Table 3. 7:FAMEs identified in the standard solution, their formulas, MS spectrum, M+ and m/z
values
Retention time (min)
Fatty acid methyl ester
(FAME)
Formula and MS spectrum M+ m/z values of characteristic
fragment ions (abundance)
4.95 nonanoic C10H20O2 172 74(999), 87(406), 41(144), 43(115),
55(111), 57(94), 75(88),141(83), 129(70)
10 20 30 40 50 60 70 80 90 100 110 120 130 140 150 160 170 1800
50
100
15 29 41 55 69
74
83
87
101 115 129 141 172
O
O
7.85 suberic (di-FAME)
C10H18O4 202 74(999), 129(935), 69 (867),138(812), 97(747), 171(573), 55(537),41(488),
43(435),83(396)
10 20 30 40 50 60 70 80 90 100 110 120 130 140 150 160 170 180 190 200 2100
50
100
15
18
27
4155
59
69
74
83
97
101
111
129
138
171
O
OO
O
8.70 lauric C13H26O2 214 74(999), 87(477), 43(257), 41 (238), 55
(194), 29(152), 75(133), 57 (108),69(82), 5976)
20 30 40 50 60 70 80 90 100 110 120 130 140 150 160 170 180 190 200 210 2200
50
100
2943 55
69
74
83
87
101 115 129 143 171 183 214
O
O
61

Retention time (min)
Fatty acid methyl ester
(FAME)
Formula and MS spectrum
M+
m/z values of characteristic fragment ions (abundance)
9.12 azelaic (di-FAME)
C11H20O4 216152(999), 55(800), 111(800), 74(750), 83(660), 185(610), 143(560), 59(550),
41(440), 87(340)
10 20 30 40 50 60 70 80 90 100 110 120 130 140 150 160 170 180 190 200 210 220 2300
50
100
15
18
29
41
55
59
69
74
83
87 97
111
124
143
152
171
185
O
O
O
O
10.25 sebacic (di-FAME)
C12H22O4
23074(999), 98(804), 55(727), 125(661), 84(583), 157(479), 41(457), 97(437),
43(435), 199(429)
10 20 30 40 50 60 70 80 90 100 110 120 130 140 150 160 170 180 190 200 210 220 230 2400
50
100
15
18
29
41
55
5969
74
84
87
98
111 121
125
138
148
157
166
185
199
OO
O
O
11.32 myristic C15H30O2 24274(999), 87(590), 43(330),41(260), 55(220), 29(160), 75(140), 57(130),
69(110), 143(84)
20 30 40 50 60 70 80 90 100 110 120 130 140 150 160 170 180 190 200 210 220 230 240 2500
50
100
2943
5569
74
83
87
97 111 129 143 157 185 199 211 242
O
O
62

Retention time (min)
Fatty acid methyl ester
(FAME)
Formula and MS spectrum
M+
m/z values of characteristic fragment ions (abundance)
13.65 palmitic C17H34O2 27074(999), 87(697), 43(415), 41(333), 55(300), 75(214), 143(188), 57(167),
29(161),270 (150)
20 40 60 80 100 120 140 160 180 200 220 240 260 2800
50
100
29
4355
74
83
87
97 115 129143
157 171 185 199 213227 239
270
O
O
15.64 stearic C19H38O
2 29874(999), 87(604), 43(430), 41(289), 55(278), 75(218), 57(197), 29(169),
69(143), 143(121)
10 30 50 70 90 110 130 150 170 190 210 230 250 270 290 3100
50
100
1529
4355
74
83
87
97 111 129 143157 185 199 213 255 267 298
O
O
16.67 C19 (internal standard) C20H40O
2
31274 (999), 87(676), 43(465), 41(324), 55(312), 57(261), 75(234), 312(195),
69(189), 143(168)
10 30 50 70 90 110 130 150 170 190 210 230 250 270 290 3100
50
100
18 29
4355
74
83
87
97 111 129143
157 171 185 199 213 241 255 269 281312
O
O
18.45 C21 (internal standard) C22H44O
2
34074(999), 87(630), 340(400), 43(350), 75(280), 55(260), 57(260),18(230),
41(210), 69(190)
10 30 50 70 90 110 130 150 170 190 210 230 250 270 290 310 330 3500
50
100
1829
4355
74
83
87
97 111 129143
157 171 185 199 213 227 241 255 269 283297 309
340
O
O
63
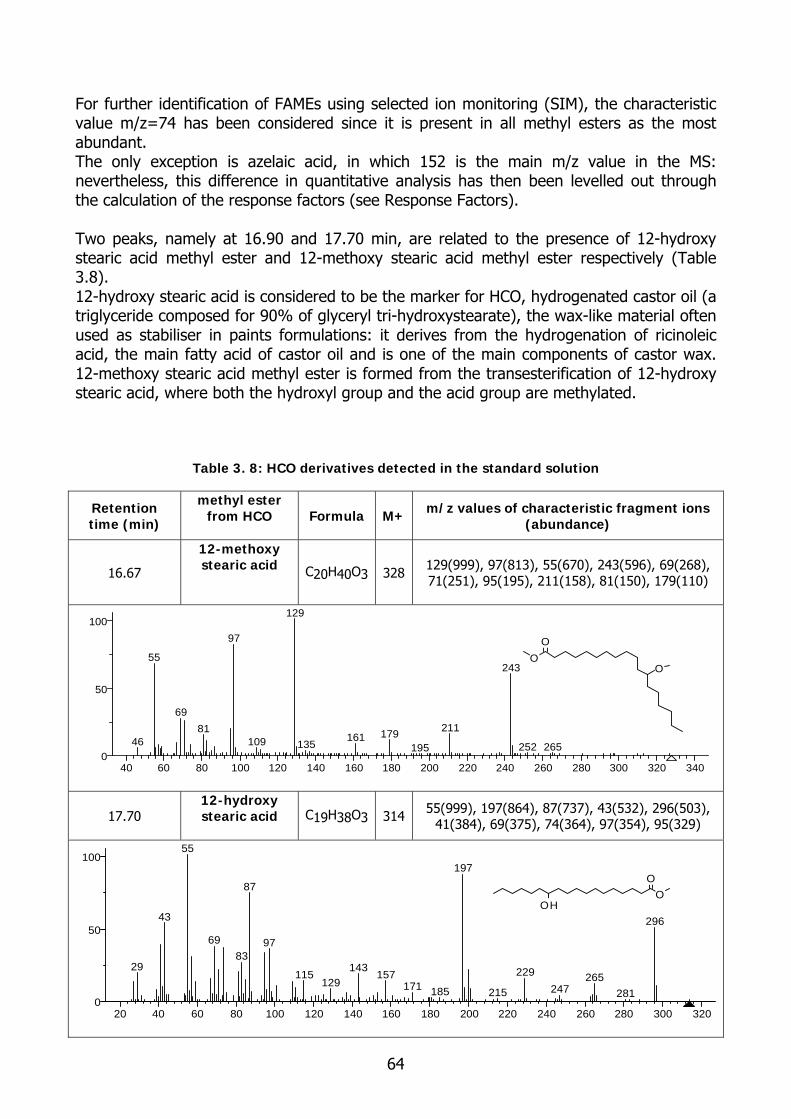
For further identification of FAMEs using selected ion monitoring (SIM), the characteristic value m/z=74 has been considered since it is present in all methyl esters as the most abundant. The only exception is azelaic acid, in which 152 is the main m/z value in the MS: nevertheless, this difference in quantitative analysis has then been levelled out through the calculation of the response factors (see Response Factors). Two peaks, namely at 16.90 and 17.70 min, are related to the presence of 12-hydroxy stearic acid methyl ester and 12-methoxy stearic acid methyl ester respectively (Table 3.8). 12-hydroxy stearic acid is considered to be the marker for HCO, hydrogenated castor oil (a triglyceride composed for 90% of glyceryl tri-hydroxystearate), the wax-like material often used as stabiliser in paints formulations: it derives from the hydrogenation of ricinoleic acid, the main fatty acid of castor oil and is one of the main components of castor wax. 12-methoxy stearic acid methyl ester is formed from the transesterification of 12-hydroxy stearic acid, where both the hydroxyl group and the acid group are methylated.
Table 3. 8: HCO derivatives detected in the standard solution
Retention time (min)
methyl ester from HCO
Formula M+ m/z values of characteristic fragment ions
(abundance)
16.67
12-methoxy stearic acid
C20H40O3 328 129(999), 97(813), 55(670), 243(596), 69(268), 71(251), 95(195), 211(158), 81(150), 179(110)
40 60 80 100 120 140 160 180 200 220 240 260 280 300 320 3400
50
100
46
55
69
81
97
109
129
135161 179
195
211
243
252 265
O
O
O
17.70 12-hydroxy stearic acid
C19H38O3 314 55(999), 197(864), 87(737), 43(532), 296(503),
41(384), 69(375), 74(364), 97(354), 95(329)
20 40 60 80 100 120 140 160 180 200 220 240 260 280 300 3200
50
100
29
43
55
6983
87
97
115129
143157
171 185
197
215
229
247265
281
296OH
OO
64

Being a polyfunctional alcohol, glycerol reacts with Meth-Prep II® in a different way than fatty acids. The reaction, thus, is very complex with the formation of multiple reaction products, translated into numerous peaks which can be observed in Figure 3.22 and summarised in Table 3.9.
6 8 10 12 14 16 18Time (min)
0
20000
0
200000
100000
5000
Inte
nsity
0
0
1000000
16,42 18,258,65 11,11 13,384,85 7,65 8,94 15,467,29 12,81 13,459,605,07 17,5417,54
12,816,70 13,456,835,59 11,11 13,77 18,218,87 17,3610,13 16,18
17,5413,4512,817,296,82 7,484,79 14,088,64 18,259,77 10,48 14,3711,79 16,417,48
12,81 17,547,98 13,457,28 13,905,48 10,029,03 18,3510,86 17,3514,73
13,457,2912,81 17,546,82 7,98 8,196,56 13,889,80 16,3214,6610,47 11,42 18,63
18,2512,81 16,427,29 8,65 11,11 15,4613,384,85 6,82 16,778,94
16,42 18,258,65 11,11 13,38 15,464,85 7,486,82 8,94 12,81 13,44 17,549,60
7,29
7,484,73 9,026,88 10,98 18,2512,77 16,4214,409,11
NL: 1,53E6TIC F: MS TargetSolution23June
NL: 4,95E3Base Peak m/z= 200,50-201,50 F: MS TargetSolution23June
NL: 1,81E4Base Peak m/z= 144,50-145,50 F: MS TargetSolution23June
NL: 6,18E3Base Peak m/z= 161,50-162,50 F: MS TargetSolution23June
NL: 1,07E4Base Peak m/z= 186,50-187,50 F: MS TargetSolution23June
NL: 2,26E4Base Peak m/z= 70,50-71,50 F: MS TargetSolution23June
NL: 4,72E4Base Peak m/z= 74,50-75,50 F: MS TargetSolution23June
NL: 2,50E4Base Peak m/z= 88,50-89,50 F: MS TargetSolution23June
Figure 3.22: TIC chromatogram of standard solution; SIM chromatograms with selected (most abundant) m/z values for glycerol derivatives (See Table 6)
Table 3.9: Glycerol derivatives after transesterification with Meth-Pre; assignation after
[Sutherland K., 2007] except 1,3-methyl diether, 2- (trifluomethyl)phenyl ether *, which was detected for the first time during this research
Retention
time Glycerol derivative name M+ m/z values of characteristic
fragment ions (abundance) 1 17.54 (Trifluoromethyl)phenyl triether 524 201 (999), 175(920), 145(550),
187(320), 362 (200) 2 14.08 1,2-(Trifluoromethyl)phenyl diether 380 145 (999), 162(960), 175(680),
187(400), 218(250) 3 13.90 1,3-(Trifluoromethyl)phenyl diether 380 162(999), 145(350), 189(280),
187(270), 218(110) 4 13.45 1,2-(Trifluoromethyl)phenyl diether, 3-
metyl ether 394 187(999), 145(370), 175(190), 232(70)
5 12.81 1,3-(trifluomethyl)phenyl diether, 2-etyl ether
394 71(999), 175(920), 145(650), 201(610), 187(590)
6 7.98 Methyl monoether, (trifluomethyl)phenyl monoether
250 75(999), 187(510), 159(280), 145(220)
7 7.48 1-methyl ether, 2-(trifluomethyl)phenyl ether
250 162(999), 75(560), 89(450), 145(410), 187(270)
8 7.29 1,2-methyl diether, 3- (trifluomethyl)phenyl ether
264 89(999), 187(850), 159(450), 145(300)
9 6.82 1,3-methyl diether, 2- (trifluomethyl)phenyl ether*
264 71(999), 159 (580), 103(580), 187(450), 145(230)
65

The mass spectrum for the peak referring to glycerol, (trifluoromethyl)phenyl triether is shown in Figure 3.23.
50 100 150 200 250 300 350 400 450 500 550 600m/z
0
10
20
30
40
50
60
70
80
90
100R
elat
ive
Abu
ndan
ce201175
145
187
41
133 159 524202
119959183 50563 525
362207 262253 526348324281 400 429 485449 580 597
Figure 3.23: Mass spectrum for glycerol, (trifluoromethyl)phenyl triether
The characteristic ions are M+ (m/z=524), [M-F]+ (m/z=505), [M-CF3C6H4OH]+ (m/z=362), [CF3C6H4]+ (m/z=145), [CF3C6H4OCH2]+ (m/z=175), [CF3C6H4OC2H2]+ (m/z=187) and [CF3C6H4OC2H2]+ (m/z=201) [Sutherland K., 2007]. Response factors Response factors for GC-MS analysis were determined using the standard solution (fatty acids, glycerol and internal standard of known concentration) according to the formula:
RF = (As/Ais)/(Cis/Cs)
in which A=area C= concentration Is=internal standard (in this case free fatty acid C19) S= target from the standard solution
After analysis of a 1 µL injection of the standard mixture, the ratio for each compound of peak area to the weight of the compound injected (calculated from the concentration in the standard mixture multiplied by the injection volume) was determined. To calculate response factors relative to the internal standard (C19), the area/weight ratios are divided by the area/weight ratio for the standard. Standard solution was injected every day in order to obtain daily response factors and avoid any possible instrumental conditions that could interfere with the quantitation and further calculations (concentration, molarity) for fatty acids and glycerol. In the same way, response factors can be helpful in the understanding of the instrumental conditions.
66

The response factors summarised in Table 3.6 refers to one specific injection (but similar results come from other injections as well). The response factors for methyl palmitate and methyl stearate are very close to that of the C19 standard, but the response factor for dimethyl azelate and other difatty acids is considerably lower. This is consistent with the idea that the response of a flame ionisation detector is roughly proportional to the weight of unoxidised carbon in the compound analysed. This means that the response per unit weight of the esters of dibasic fatty acids (containing two carbonyl carbons per molecule) will be proportionally lower, relative to the esters of monobasic acids (containing one carbonyl carbon per molecule). Response factors have been applied to calculation and quantitative analysis for all fatty acids and glycerol derivatives. Regarding the case of glycerol, it has been decided to sum all areas of glycerol derivatives, selected singularly using their most abundant m/z values (see Table 6). In fact, to consider just one or few of them is not correct as they all contribute in the identification and quantitation of glycerol.
Table 3. 9: Determination of response factors for fatty acid methyl esters
fatty acid (as methyl ester) weight (µg) Select ion for
peak area (m/z) peak area response factor
Glycerol (sum of glycerol derivatives) 2.521 201, 145, 162, 187,
71, 75, 162, 89, 71 1092499 0.25
FA-2C8 0.885 74 393356 0.26
FA-2C9 0.924 74 414212 0.26
FA-2C10 0.901 74 415000 0.27
C9 0.792 74 1222574 0.91
C12 1.011 74 1881596 1.09
C14 1.168 74 2090506 1.05
C16 1.336 74 2435242 1.07
C18 1.399 74 2268728 0.95
12HydroxyC18 1.533 74 92973 0.04
C19 3.034 74 5166324 1.00
- Conclusions The assessment of the GC-MS method by using Meth-Prep II® has lead to good results. Despite the simplicity of sample preparation and the high sensitivity, the method shows a linear detector response, which permits internal standardisation. Furthermore, the novel Meth-Prep II®/GC-MS procedure allows for the identification and the quantitation of (free) fatty acid and glycerol.
67

3.4.3.2 Application of the GC-MS method to oil paint samples After the optimisation of the GC-MS method using the standard solution, the method was applied on the study of oil films (while only sample preparation and calculation issues are provided here, Chapter 4 is focused on the results). GC-MS instrumental conditions, transesterification reagent, reaction time and temperature, identification of fatty acids and glycerol, calculation of response factors are as described above (if not differently stated). The standard solution was run daily to obtain response factors day by day. Samples preparation Prior to GC-MS analysis, samples were prepared following two procedures: the first one on the sample on its own, the latter one requires an extraction step to obtain a residue and an extracted solution. For both procedures less than 0.1mg of samples is needed, thanks to the elevate sensitivity of the method. Each sample was cut into two fragments and subject to both procedures, whenever the amount of sample allowed it.
- Entire sample
10 µl of C19 (internal standard) were added in a 200µl conical vial. The vial was flushed with nitrogen and C19 let dry at 40°C in a heating box. The vial was allowed to cool at room temperature. 0.04-0.1 mg of sample were put in the vial. Samples were not ground to avoid material losses. 30 µl of Meth-Prep II® were then added to the vial. The mixture was let overnight react. With the aid of a micro-syringe 1µl of the transesterified solution was injected into the GC-column.
C19 (internal standard) in chloroform
Figure 3.24: scheme of the preparation for entire sample
- Residue + extracted solution A simplified extraction procedure developed from a method used by the Doerner Institute [Baumer U., 2007] and adapted in the RCE laboratory (Figure 3.25) was combined with Meth-Prep II® derivatisation process. It is important to mention that any varnish compounds have been considered as the majority of modern and contemporary oil paintings are unvarnished. For this reason, the extraction aimed to separate oil components from additives components, in particular from aluminium and zinc stearates. Metal stearates are basically composed of stearates and palmitates: this complicates their distinction from stearic and palmitic acid present in drying oils. Aluminium and zinc stearate are insoluble in water and alcohol and slightly soluble in chlorinated hydrocarbons (such as chloroform) when heated; it was found that, while bounded with pigments as dispersion agents, their solubility is comparable to those of (pigment) metal soaps. In this way, performing an extraction with a mixture of isopropanol and chloroform (2:8, v:v) could lead to a separation between drying oil components and lipidic additives. Chloroform
10 µl GC-MS analysis
Sample, 0.04-0.1 mg
68

is knowingly used on oil samples to obtain the so-called total lipid extract (TLEs) [Colombini M.P., 2009].
Figure 3.25: adapted step-wise extraction from Doerner Institute [v.d.Berg K.J., 2009]
In order to control the extraction rate for fatty acids, 10 µl of the internal standard solution (C21 in chloroform) was added to a 200µl conical vial and was flushed with nitrogen at 40° C in a heating box until dryness. After cooling, to room temperature, 0.04-0.1 mg of paint sample was added to the vial containing the internal standard. 100µl of extractive solution were sufficient to accomplish extraction, which was carried out with in the ultrasonic bath for 1 hour. Then, the solution was centrifuged for 3 minutes and the extracted solution was transferred into another vial. 10 µl of C19 has been added in both vials containing residue and extracted solution in order to allow further quantitation of fatty acid and glycerol present in the oil sample. 30 µl of Meth-Prep II® were then added to both vials. The mixtures was let overnight react. 1µl of both transesterified solutions were injected into the GC-column.
Figure 3.26: scheme of samples preparation for extracted solution and residue
methanol
chloroform/ methanol (7:3)
-
isooctaneStep 1 waxes, shellac wax,,
triglycerides from fresh linseed non polar fatty
natural resins, Step 2 dyes,
polar fatty mono and diglycerides
Step 3 triglycerides from dried shellac wax, steroids
Step 4 fatty acids
metal soaps
C21 (internal standard) in chloroform
Sample, 0.04-0.1 mg
Extraction step, Ultrasonic bath, 1
hour
30 µl Meth-Prep II Overnight reaction
C19 (internal standard) in chloroform
extracted solution
residue
30 µl Meth-Prep II Overnight reaction
69

For each sample from reconstructed films and tube oil paints three replicates were analysed. Qualitatively results showed a good reproducibility in the GC chromatograms, as it is possible to observe in Figure 3.27 for the replicates of the sample U2ZS2P (ultramarine oil paint with 2%of zinc stearate added to the pigment).
5 6 7 8 9 10 11 12 13 14 15 16 17 18 19Time (min)
0
20
40
60
80
1000
20
40
60
80
100
Rel
ativ
e A
bund
ance
0
20
40
60
80
1008,52
12,92 14,9817,08
12,36 12,997,23 11,936,87 15,959,76 13,777,55 17,7411,215,93 18,444,68 8,92
8,53
12,92 14,99 17,0912,36 12,99
7,24 11,936,88 9,76 15,957,56 13,7711,22 17,74 18,455,95 8,934,70
8,52
12,92 14,9817,08
12,36 12,997,23 11,936,87 15,959,76 13,777,55 17,7411,215,93 18,444,68 8,92
Figure 3. 27: Totalion current chomatograms of three replicates for the sample U2ZS2P
Quantitative results: concentration, molar ratios and evaluation of characteristic parameters After linearity of the detector response over the range of sample concentrations analysed and response factors for GC were determined starting from the standard solution, generically concentration of each component in paint samples has been calculated:
Cx= (Ax/Ais)/(Cis/RF)
in which A=area C= concentration RF= response factor Is=internal standard (C19) S= target from the standard solution This value of concentration is however related to the methyl ester form of the correspondent fatty acid.
70

A more correct calculation for obtaining concentration of component fatty acids takes into account the conversion factor from methyl esters to fatty acids:
[FA]= (AME* WMis*MWFA)/(AMis*WS*MWME)
In which [FA]= concentration of fatty acid, expressed in ug of fatty acid per mg paint AME= peak area of the fatty acid methyl ester AMis= peak area of th internal standard (C19) WMis=weight of the internal standard added to the paint sample (ug) WS= weight of the sample (mg) MWFA/MWME= factor (based on the molecular weight of the fatty acid and its corresponding methyl ester) to convert the quantity of methyl ester in the derivatised sample to the quantity of the fatty acid originally presenting the sample. After the calibration, the calculation of response factors and the accurate quantitation of fatty acids and glycerol in terms of concentration, the analytical results of the GC-MS procedure were finally expressed in terms of molar ratios. Ratios between glycerol and fatty acids are preferably expressed as molar ratios: in fact, starting from the rather mixture of triglycerides, it is possible to evaluate the number of moles of fatty acids per moles of glycerol, etc. In this way, oil films have been evaluated by their characteristic ratio values of fatty acid amounts, comparing them with naturally and artificially aged reference paint films. The molar ratios as evaluating values used in this research are: - A/P: the ratio between azelaic and palmitic acids is a parameter which normally
distinguishes between drying oils and egg lipids, being A/P>1 for oils and A/P<0.3 for egg. In fact, high amounts of dicarboxylic acids, and azelaic in particular, are registered in aged drying oil as they are formed during the auto-oxidation of the unsaturated fatty acid (linolenic, linoleic and oleic acids) present in drying oils. A/P ratio is strongly influenced by several factors, such as the rate of oxidation, degradation and polymerisation; the age of the paint; the pre-heating treatments during oil preparation; the presence of pigments and driers.
- D/P: the ratio between the sum of dicarboxylic acids (except azelaic acid) to palmitic
also provides an evaluation of the degree in drying processes, as difatty acids are more abundant in aged films.
- A/Sub (or 2C9/2C8) gives an evaluation of pre-heating processes eventually
occurred in oil preparation, namely if the ratio is> 6 oil it is considered raw, i.e. not pre-heated, while a value ranging between 2 and 3 could refer to a pre-heated oil, i.e. pre-polymerisation of the binding material.
- O/S: the ratio between oleic (C18:1) and stearic (C18:0) acid is helpful to define the
maturity of an oil film. This value is an index of oxidation since the unsaturated acid is particularly reactive to oxygen when oil film is exposed to air. Normally O/S for aged films is around 0.1-0.2, as oleic content is quite low.
71

- P/G and A/G: the ratios of palmitic acid- to glycerol and azelaic acid- to glycerol are useful to understand the chemical transformations that occurred during curing and ageing in paint films. These values can also help in identifying drying oils.
- P/S: the ratio of palmitic- to stearic acid has been conventionally used for the
identification of traditional drying oils [Mills J.S., 1987]: P/S=1.7 for linseed oil, >3 for poppy seed oil and 2.6 for walnut oil. This evaluation was based on the statement that saturated fatty acid, such as palmitic and stearic, do not undergo modifications during the curing of an oil. Recent studies, however, have proven that the possible decrease of P/S with ageing is due to the preferential loss of palmitic acid with respect to stearic. The current research, then, has underlined how the presence of (aluminium and zinc) stearates directly influences the ratio.
- S/G, A/S and D/S: these new parameters have been incorporated in the results as
they could be influenced by the presence of added stearates.
72

CHAPTER 4
RESULTS AND DISCUSSION
Abstract This chapter focuses on the results from the analyses of reference oil paints, both laboratory-prepared and commercial paints. The characterisation and the stability studies were performed by FT-IR, XRF, TG-DSC and GC-MS techniques. Starting with reconstruction oil films this research allowed for the identification of the paint constituents and the understanding of several behaviours in unpigmented, pigmented and additive-containing oil films. The GC-MS method was assessed on reference paints and provided good results in the characterization and quantitation of constituents of lipidic binders and additives.
,
t.
Results from reconstructed and manufac ured oil paints were subjected to multivariate statistical analyses, such as cluster analysis and principal components analysis (PCA) 4.1 RECONSTRUCTIONS Unpigmented, pigmented and additive-containing oil films have been studied to understand the behaviours over time of drying, semi-drying and non-drying oils by themselves and/or in combination with different painting materials. These oil films, prepared in 1982 and 2008, are listed in Chapter 3, Table 3.1-3.2-3.3 (tables also provide the short form of the samples names). The changes in chemical and physical properties of reconstructed oil paints have been followed and studied, focusing on the changes occurring during the preparation of paints, in the period between the application of paints and the “dry-to-touch’’ state, in the ageing processes and in the degradation steps. Although the first two categories seem to be related to a more “empirical” point of view, since they are based on more practical and direct visual observations (i.e. how to prepare a paint, what is possible to observe during film casting and drying), the chemistry involved in these steps is rather complex as it has been theoretically explained in Chapter 1. The ageing and degradation processes have been studied as well, even if the approach might not be considered completely correct. Reconstructions, however, were aged naturally (from few years to almost 30 years) or
73

artificially (equivalent of circa 45 years in museum conditions): ageing time may be considered insufficient if compared with traditional oil paintings, but works of art taken into consideration in Chapter 5-Case Studies are on average 50-60 years old, so the magnitude is more or less the same. Furthermore, some reconstructed oil films after artificial ageing already showed several indications of occurring degradation, such as phase-separation between binder and pigment or superficial efflorescences. 4.1.1 Observations during film preparation, casting and drying Since initial visual observations and physical handling of the oil reference film, differences in colour and mechanical properties were observed between the new films prepared in 2008 and those from 1982-1990. The latter oil samples were prepared at RCE (ex ICN) almost thirty years ago and dried on glass slides under natural laboratory conditions. The resultant films were hard and slightly brittle. When applied on glass slides in 2008, unpigmented fresh lipidic media had a fluid consistency and a lightly-transparent yellow coloration (Figure 4. 1). The most visible changes over time were due to the yellowing of films and the formation of wrinkles on the paint surface (Figure 4. 2). Yellowing was observed after a few months, especially in linseed oil (much more than in poppy oil, which has always been used for this reason as a substitute for linseed in white or pale colours). This change is mainly due to an increase of viscosity and an increase in the refraction index as reported in [Gettens R.J, 1966] and [Feller R.L., 1957].
Figure 4. 1: fresh cold-pressed linseed oil, boiled linseed oil, stand oil, poppy oil and
sunflower oil (from left), 2008
Figure 4. 2: cured cold-pressed linseed oil, boiled linseed oil, stand oil, poppy oil and
sunflower oil, (from left), 2010
The formation of wrinkles in the film is likely due to oxidative cross-linking, which results in an uptake of oxygen by the oil film (approximately 15-20%, by weight) [Wexler H., 1964] and a corresponding increase in volume and possible wrinkling. Oil films increase their weight and volume rapidly since they absorb oxygen; however, in relatively few days the increase is compensated by the loss due to the passing off in gaseous form of by-products of the reaction (carbon dioxide, short chain acids, aldehydes, ketones and alcohols) which can volatilise and contribute to the loss of weight. All these changes have been measured in time as percentage of weight (gained or lost). Monitoring weight changes can provide information on the duration and magnitude of these reactions: it has been proven that weight changes are greatest in the first year and are still detectable up to two years later [Tumosa C., 2001]. Weight changes in the oils
74

were not immediate and started only after an incubation period when the retardation of the free radical oxidation process was finally overcome by naturally occurring antioxidants [Weger M., 1899; Sabin A.H., 1911]. The chemical processing of oils removes these antioxidants and the oxygen uptake, as measured by weight increase, starts earlier even though the rate of oxygen uptake is about the same. These phenomena are evident in Figure 4.3, in which the drying curves are depicted as graphic record of the weight changes occurring in the drying process of linseed, poppy seed, sunflower and castor oil films over a 90 days period. While linseed oil, sunflower and poppy oils were selected because they have been commonly used as drying oils in paints, castor oil was selected as an example of non-drying oil employed more in commercial paint formulations.
02468
1012141618
0 10 20 30 40 50 60 70 80 90days
% g
ain
and
loss
in w
eigh
t
linseed oil
poppy seed oil
sunflow er oil
castor oil
Figure 4.3: Changes in weight over 90 days of four oil films: linseed oil, poppy seed oil,
sunflower and castor oil. The oils showed varying incubation periods because of the differences in natural antioxidants. The trend in the data for drying oils (linseed and poppy seed) exhibited the rapid initial weight increase from oxygen uptake and then a weight loss due to loss of volatiles. For sunflower oil, which is a slow-drying oil and contains higher amounts of lecithin and tocopherol, the initial gain in weight was less rapid, even less for non-drying castor oil. The weight change plot of castor oil also shows that while oxidation first resulted in a moderate weight gain, the final result was a significant weight loss. Linseed oil contains a considerable amount of linolenic acid (48-60%) and thus cross-links or polymerizes with less evident volatile formation: this is reflected in the smaller weight loss after initial oxidation compared to the other oils. Therefore, weight loss depends primarily upon the presence of linolenic acid: the higher the linolenic acid content, the less weight is lost on oxidation. Different drying and ageing behaviours of films made with semi and non-drying oils, as cottonseed oil and castor oil, were observed also considering their “dry-to-touch’’ state: after 2 years of exposure, these films were very viscous but still tacky. Yellowing was not so evident as the wrinkle formation on the film surface. For pigmented oil films, yellowing was more difficult to observe due to the different coloration of the painted layers. Nevertheless, in films containing white pigments, such as
75

zinc oxide ZnO, lead white 2PbCO3·Pb(OH)2 and titanium oxide TiO2, yellowing was observed in particular with linseed oil (Figure 4.4-4.5).
Figure 4. 4: ZnO in cold-pressed linseed oil and in stand oil; 2PbCO3*Pb(OH)2 in cold-pressed linseed oil and in stand oil; TiO2 in stand oil and in cold-pressed linseed oil (from left), 2008
Figure 4. 5: ZnO in cold-pressed linseed oil and in stand oil; 2PbCO3*Pb(OH)2 in cold-pressed linseed oil and in stand oil ; TiO2 in stand oil and in cold-pressed linseed oil (from left), 2010
After a few months, some pigmented painted layers exhibited a visible phase-separation between the pigment and the binding material. This was likely an effect of bad dispersion and/or limited stabilisation of pigments in the medium. These scarce pictorial effects were not observed for additive-containing films. They were prepared at RCE (ex ICN) in 2008 by adding to ultramarine, chrome green and raw sienna pigments varying percentages of metal stearates (aluminium and zinc soaps) as dispersion agents and castor wax (hydrogenated castor oil) as stabiliser. The obtained films had both flat and thick areas; the idea was to recreate an impasto area, similar to the one deliberately created by some modern and contemporary artists. During preparation and casting, several observations about the consistency of paints, the amount of pigments and binders needed, the introduction of additives, etc. were recorded [Saltmarsh P., 2008]. In general, it was noticed that the addition of high amounts of stearates resulted in stringy consistence of the final paint. These painted films were then artificially aged for an equivalent ageing time of 45 years in museum conditions. After artificial ageing, superficial efflorescences were observed in paint films, in particular those with higher amounts of additives. This is likely an effect of the migration to the surface of added metal soaps [De Groot S., 2009].
76

4.1.2 FT-IR studies Fourier transform infrared spectra were recorded for unpigmented, pigmented and additive-containing oil films. FT-IR analyses were helpful in the characterization of lipidic materials, thanks to the comparison with standard references and literature data. The infrared spectroscopic survey was also an important tool to monitor the drying processes and to understand the stability of an oil paint over time, by obtaining information on the degree of oxidation and hydrolysis and changes in double bond conformation. Figure 4. 6 displays the FT-IR spectrum of unpigmented fresh cold-pressed linseed oil (CPLO). In the 3000 cm-1 region, there are four distinctive peaks at 3008, 2958, 2923 and 2853 cm-1 related to the stretching vibrations of C-H bonds. These aliphatic vibrations are linked to the abundant presence of CH2 and CH3 groups in the fatty acids. While the peaks 2923 and 2853 cm-1 present a strong intensity, at 2958 cm-1 only a shoulder is visible. At 1743 cm-1 appears the intense carbonyl band of the ester linkages of triglycerides (C=O). Several bands from fatty acid and carboxylic acid functional groups are present in the region between 1600 and 600 cm-1 (see Table 4. 1). The peak at 1651cm-1 refers to the double bonds C=C in the fatty acids present in fresh oil. The peaks at 1236, 1160 and 1098 cm-1 are absorption bands due to the stretching of the C-O group in ester bonds. The presence of unsaturated bonds is also responsible for the strong absorption at 719 cm-1, assigned to the bending of the (cis) C=C-H group. The evidence of drying and ageing processes occurring in a thin oil film in a relatively short time is shown in Figure 4.7. The FT-IR spectra of a fresh film of cold-pressed linseed oil, the same after one week and after one year are displayed in the selected absorption region 4000-1500 cm-1. It is possible to notice that the small peak at 3009 cm-1, referred to as unsaturated C=C-H bonds disappeared within 7 days, while the absorption peak at 1650 cm-1 was still detectable. At the same time, a new broad vibrational band was registered around 3450 cm-1: this could be assigned to the absorptions of hydroperoxides or hydroxyl groups, which were produced during oxidative processes. Simultaneously, the carbonyl band at 1744 cm-1 broadened, due probably to the formation of aldehydes and ketones. After one year, the formation of a new peak very close to the carbonyl group occurred: this peak at 1713 cm-1, not well resolved, was due to the absorption of carboxylic acids formed as by-products in the drying and degradation phenomena. After one week, in the region in Figure 4. 8, and precisely at 1417 cm-1, another new band linked to the carboxylic acid groups appeared, while the absorption peak around 720 cm-1 was less strong because of oxidation reactions. Despite all the advantages of investigating the drying mechanism by FT-IR, this technique cannot help in the distinction between different oils. In Figure 4. 9 the spectra of three oils are reported: a semi-drying oil, such as cottonseed oil, the preeminent drying oil, cold-pressed linseed oil and the non-drying castor oil. Based on their absorption bands, it is hard to differentiate them, as they chemically belong to the same “family” of vegetal oils. Therefore, FT-IR spectra of unpigmented fresh and aged oil samples were used as a reference for the study of films containing pigments and commercial additives, with the purpose of identify their presence and survey their influence on the processes occurring during drying. Moreover, since the presence of pigments and additives could interfere with the identification of drying oils by partially covering or shifting the relative absorption peaks of oil binders, their identification is useful for correctly characterising unknown media present in real samples.
77

463
586
719
791
868
914
968
1029
1098
1160
1236
1373
1460
1651
1743
2853
2923
3008
0
10
20
30
40
50
60
70
80
90
100
%T
500 1000 1500 2000 2500 3000 3500 4000 Wavenumbers (cm-1)
Figure 4. 6: FT-IR spectrum of fresh unpigmented fresh CPLO
Table 4. 1: absorption band assignment for the peaks observed in Figure 4.4, after [Adrover Gracia I., 2001; Lazzari M., 1999; Erhardt D., 2005; van der Weerd J., 2005]
Wavenumber
(cm-1) Intensity Moiety and vibrational mode Source
3008 medium C-H stretching of C=C-H (cis) Fatty acid
2958 shoulder C-H stretching of CH3 Fatty acid
2923 strong C-H stretching of CH2 Fatty acid
2853 strong C-H stretching of CH2 Fatty acid
1743 strong C=O stretching of ester Ester bond
1651 weak C=C stretching of cis –CH=CH- Fatty acid
C-H asymm. bending of CH31460 strong
C-H scissoring of CH2
Fatty acid
1373 medium CH3 wagging Fatty acid
1236 medium C-O asymm. stretching in ester Ester bond
1160 strong C-O stretching Ester bond
1098 medium C-O asymm. stretching Ester bond
719 strong C=C-H bending (cis) Fatty acid
78

Figure 4. 7: FT-IR spectra of CPLO, when fresh (above), after one week (centre) and after one year (below)
725
979
1099
1169
1243
1381
1417
1464
10
15
20
25
30
35
40
45
50
55
60
65
70
75
80
85
%T
700 800 900 1000 1100 1200 1300 1400 1500 Wavenumbers (cm-1)
Figure 4. 8: FT-IR spectrum of one-week naturally aged CPLO film in the selected region 1550-650 cm-1
79

COTTONSEED OIL
20
40
60
80%
T
COLD-PRESSED LINSEED OIL
60
70
80
90
%T
CASTOR OIL
20
40
60
80
%T
500 1000 1500 2000 2500 3000 3500 4000 Wavenumbers (cm-1)
Figure 4. 9: FT-IR spectra of cottonseed oil (above), cold-pressed linseed oil (centre) and castor oil (below)
Inorganic materials, such as pigments and driers, are knowingly considered to have a role in inhibiting or accelerating the ageing process of paints. Various and exhaustive studies have been published on this topic [Simunkova E., 1985; Meilunas R.J., 1990, Tumosa C., 2005, Luxàn M. P., 1999; van den Berg J. D., 2002; van der Weerd, 2005]: focusing on the influence on long-term changes in the lipidic media, they take into consideration several naturally or artificially aged paints made with different pigments. In the current study, the attention was paid in particular to the modern pigments, i. e. those created, synthesised and introduced in art field since the 19th century, when industrialisation started including artistic materials. They were mainly chrome, titanium, barium, zinc, cadmium-containing pigments. Artificial ultramarine blue and synthetic iron oxides are other examples of the evolutions occurring in pigments production [for more information, see Artists’ Pigments]. In Figure 4. 10-4.11-4.12 several examples of FT-IR results from pigmented oil films are reported: these films were made with cold-pressed linseed oil and synthetic pigments, such as: cadmium yellow (CdS) and cadmium orange (CdS), both absorbing at 270-250 cm-1; zinc white (ZnO) with characteristic wavenumber in the region 500-400 cm-1; green chrome oxide (Cr2O3) which presents two IR peaks at 632 and 566 cm-1; Prussian blue (Fe4[Fe(CN)6]3, whose C=N group absorbs at around 2080 cm-1; cobalt blue (CoAl2O4) absorbing in the oxide region, between 500-200 cm-1. These pigments were chosen as they are not all detectable in the IR region between 4000-400 cm-1 or have a characteristic IR wavenumber which can be distinguished from those of drying oils. The aim was to focus on the influence of pigments in the drying processes of oil media. After a few days (spectra were recorded within one week from the exposure), the broad peak at around 3450 cm-1 (hydroperoxides produced during oxidative processes) was observed, as well as the reduction of the absorption peak around 720 cm-1 because oxidation reactions took place.
80

45
347
059
7
725
97
2
1098
1167
124
2 127
413
80 1
422
1463
163
016
5117
42
2855
2928
3455
0
10
20
30
40
50
60
70
80
90
100
%T
500 1000 1500 2000 2500 3000 3500 Wavenumbers (cm-1)
Figure 4. 10: FT-IR spectra of cadmium yellow (in yellow) and cadmium orange (in red) in CPLO
466
589
725
782
980
1099
116712
411375
141
414
61
163
3
1741
2857
2928
345
4
Zinc white in CPLO
-0
20
40
60
80
%T
466
575
62
464
272
3
777
96
8
1098
1167
124
51376
141
714
62
1643
174428
5729
29
3454
Green ChromeOxide in CPLO
0
20
40
60
80
100
%T
500 1000 1500 2000 2500 3000 3500 Wavenumbers (cm-1)
Figure 4. 11: FT-IR spectra of zinc white (above) and green chrome oxide (below) in CPLO
81
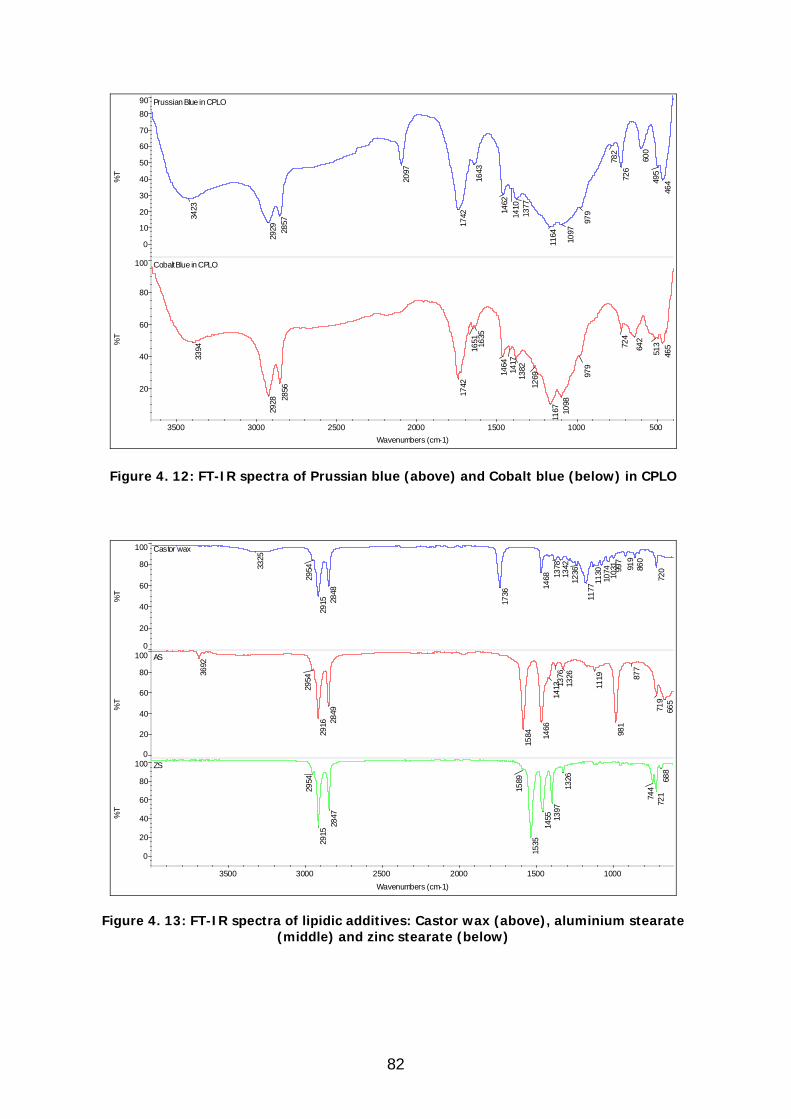
46449
560
0
726
782
979
1097
1164
1377
141014
62
1643
1742
2097
2857
2929
342
3
Prussian Blue in CPLO
0
10
20
30
40
50
60
70
80
90
%T
465
51364
2
724
97
9
1098
1167
126913
821417
1464
1635
1651
1742
2856
2928
3394
Cobalt Blue in CPLO
20
40
60
80
100
%T
500 1000 1500 2000 2500 3000 3500 Wavenumbers (cm-1)
Figure 4. 12: FT-IR spectra of Prussian blue (above) and Cobalt blue (below) in CPLO
72086
091
999
710
3110
7411
3011
77
123613
4213
7814
68
1736
2848
2915
295
43325
Castor wax
0
20
40
60
80
100
%T
665
719
877
981
1119
1326
1376
141
314
66
1584
2849
2916
295
43692
AS
0
20
40
60
80
100
%T
688
72174
41326
1397
1455
1535
158
9
2847
2915
2954
ZS
0
20
40
60
80
100
%T
1000 1500 2000 2500 3000 3500 Wavenumbers (cm-1)
Figure 4. 13: FT-IR spectra of lipidic additives: Castor wax (above), aluminium stearate
(middle) and zinc stearate (below)
82

Since films were extremely young, the presence of formed metal soaps was not detected. Metal soaps, in fact, are compounds containing alkaline earths or heavy metals which are combined with carboxylic acids (7-22 carbon atoms): they can be formed by the reaction of a metal salt, present as a pigment or a drier in oil films, with the lipidic binder [Robinet L., 2003]. Metal soaps can, otherwise, be added initially to oil formulations, as happened since the beginning of the 20th century [Tumosa C., 2001] (See Chapter 1.2). Some reconstructed oil films were prepared by including modern paint additives. To the oil film series labelled as ultramarine blue (U2), raw sienna (RS) and chrome green (CG) were added two kinds of metal soaps, specifically 2-20% of aluminium stearates and 2-30% of zinc stearate, and 2-5% of castor wax (hydrogenated castor oil). The FT-IR- ATR spectra of these dispersion and stabilisation agents are depicted in Figure 4. 13. The reference spectra of aluminium and zinc stearates have peculiar absorption areas, which refer to the typical absorption peak of metal soaps in the region 1580-1390 cm-1 (2954, 2916, 2849, 1584, 1466, 1413, 1119, 982 and 719 cm-1 for aluminium stearate and 2954,2915, 2847, 1589, 1535, 1455, 1397, 1325, 744 and 721cm-1 for the zinc soap). Castor wax is obtained from castor oil (mainly composed of ricinoleic acid) by hydrogenation: the lipidic fraction is well visible across the entire spectrum (2954, 2916, 2848, 1736, 1467, 1377, 1177, 997, 720 cm-1). Because of the detection limit of FT-IR ATR analysis, additives were scarcely or not observed if present in the oil paint formulations in low percentages (2-5%; see Figure 4.14-4.15).
623
65368
8
962
117
31317
1378
1413
1458
1636
1736
2853
2923
U2
0
20
40
60
80
%T
650
720
835
859
919
997
1031
108
011
0211
2911
7712
58129013
4213
771415
1467
17362848
2916
2954
castor wax
40
60
80
%T
652
724
1013
1096
1163
124
6
13751414
1460 1
644
1735
2854
2926
3446
U2HCO5
40
60
80
%T
1000 1500 2000 2500 3000 3500 4000 Wavenumbers (cm-1)
Figure 4. 14: FT-IR spectra of oil films from the series ultramarine: ultramarine (U2)(above), castor wax (middle) and ultramarine with 5% of castor wax (U2HCO5)
83

652688
962
1161
1317
1414 1470
1631
1735
28542923
3409
U2
10
%T
623 653688
961
1317
1414 1470
1628
1734
28532923
3384
U2A
S2P
10
%T
653688720
953
1103
12251297
143114631472
1700 1740
28482915
2956
U2A
S10P
0 50
%T
654689719
961
1103
12251297
14311463
1472
1700 1740
28482916
2960
U2A
S20P
0 50
%T
665719
982
1119
1326 1381
14151466
1584
1740
28492916
2956
AS
0 50
100
%T
100
0 1
500
200
0 2
500
300
0 3
500
400
0
Wav
enum
bers
(cm
-1)
Figure 4. 15: FT-IR spectra of oil films from the series ultramarine: ultramarine (U2), ultramarine with 2% of aluminium stearate (U2AS2P), ultramarine with 10% of aluminium stearate added (U2AS10P), ultramarine with 20% of aluminium stearate added (U2AS20P);
aluminium stearate technical grade (AS)
84

4.1.3 Thermal analyses Thermogravimetric and differential scanning calorimetric analyses were performed on reference materials and reconstruction films cast in 1982 and 2008. TG-DSC technique was used in this study to understand the changes in the thermal behaviours occurring in the oil films with age, pigmentation and introduction of additives. The advantage in performing the two analyses simultaneously is linked to the possibility of studying thermal stability both in terms of mass changes and thermal capacity. In other words, while TG provides information on weight variations as a function of temperature, DSC gives information on the oxidative behaviour and stability of oil samples [Le Parlouer P., 1987] . The TG-DSC thermograms for fresh unpigmented CPLO and one-year old CPLO films are displayed in Figure 4.16-4.17. Their thermal and oxidative behaviours only have few elements in common. The thermal results are similar to those observed by Chiantore and Lazzari for drying and oxidative degradation of linseed oil [Lazzari M., 1999]. The fresh oil TG curve shows a first strong weight loss between 250 and 400°C, followed by a second loss above 400°C. These weight variations are likely related to two oxidative decompositions, the latter leading to combustion and complete volatilisation of the organic fraction. At the same time, the DSC curve presents two exothermic peaks at 382 and 422°C which are possibly related to the same oxidative decompositions [Rudnik E., 2001]. An endothermic event is recorded around 400°C, which may be due to the occurrence of a melting transition in the fresh oil. For the one-year old oil film, weight losses recorded by the thermogravimetric curve occur strongly between 250 and 400°C and above 400°C, raising the same considerations for fresh oil. A slight weight variation is now visible between 100 and 200°C: this is possibly linked to the decomposition of hydroperoxide groups with formation of radicals, whose reactions with double bounds C=C lead to an exothermic process of cross-linking, event occurring around 150°C [Lazzari M.,1999; Ploeger R., 2009]. The slightly evident weight loss associated to this exothermic peak is less than 8%, but was not observed in fresh oil. This is explainable considering that the unsaturated C=C bonds were not exposed to oxygen atmosphere before the analysis, but taken directly from the fresh oil container. During TG-DSC double bonds were subjected to air flow and heat increase, but evidently the operative conditions were not adequate to overcome the period of time necessary for the initiation of oxygen absorption, called induction period, which is attributed to the presence of natural antioxidants [Wexler H., 1964]. This was observed also by FT-I, since the absorption peaks at 3450 cm-1 and 1744 cm-1 were not recorded in fresh oil, but after a week. Another important consideration comes from the comparison between TG-DSC curves of the one-year old CPLO film and those of the stand oil film (Figure 4. 18), the first one being the result of a cold preparation and the latter the results of a heating procedure in absence of oxygen. The weight losses curves are extremely similar, showing three main ranges of weight variations as described before. Both DSC thermograms exhibit the exothermic peak related to hydroperoxides decomposition, at 153°C for CPLO and shifted to 161°C for the pre-polymerised oil film. Both oils undergo a double oxidative decomposition, exothermic events occurring at circa 450 and 470°C. Melting occurs in both cases at 420°C. This could be an indication that the global process of oxidation leads after one year to the formation of the same products, even in films resulting from drying oils subjected to different preparation treatments.
85
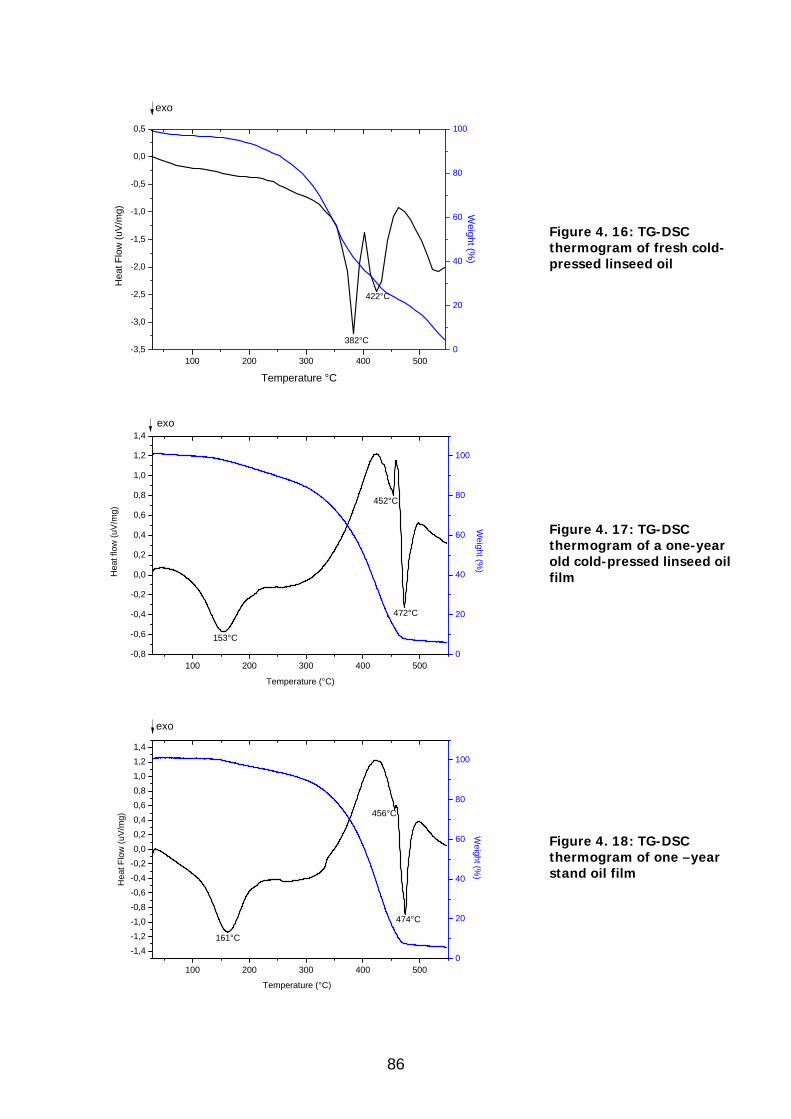
100 200 300 400 500-3,5
-3,0
-2,5
-2,0
-1,5
-1,0
-0,5
0,0
0,5
Temperature °C
Hea
t Flo
w (u
V/m
g)
382°C
422°C
0
20
40
60
80
100
Weight (%
)
exo
Figure 4. 16: TG-DSC thermogram of fresh cold-pressed linseed oil
100 200 300 400 500-0,8
-0,6
-0,4
-0,2
0,0
0,2
0,4
0,6
0,8
1,0
1,2
1,4
452°C
472°C
153°C
Hea
t flo
w (u
V/m
g)
Temperature (°C)
exo
0
20
40
60
80
100
Weight (%
)
Figure 4. 17: TG-DSC thermogram of a one-year old cold-pressed linseed oil film
100 200 300 400 500
-1,4-1,2-1,0-0,8-0,6-0,4-0,20,00,20,40,60,81,01,21,4
474°C
456°C
161°C
Temperature (°C)
exo
0
20
40
60
80
100
Weight (%
)
Hea
t Flo
w (u
V/m
g)
Figure 4. 18: TG-DSC thermogram of one –year stand oil film
86

Table 4.2-4.3 contain the results of TG and DSC performed on several unpigmented and pigmented oil films, some also containing additives as well. Except for fresh oils, the recorded TG thermograms showed a slight weight loss in the range between 100°C and 200°C, appearing in correspondence to the exothermic DSC peak at around 150°C: as seen before, this change is related to the decomposition of hydroperoxide groups. Between 250°C and 400°C and between 400°C and 550°C two more evident weight losses occur, which are linked to the oxidative decomposition with final combustion. After TG analyses the total weight percent losses were calculated. The values are rather different with regards to the age and the presence of pigments and additives. Generally, the percentage of weight lost after performing TG analyses decreases over time. Measurements were performed at several ranges of cured samples, both in natural (fresh, one week, one year, two years, and 28 years) or artificial (45 years) ageing conditions. This trend was observed in all oil samples, as depicted in the charts in Figure 4.19-4.20. For example, the film made of cobalt blue in CPLO presents three decreasing values: 83.4% after one week, 80.8% and 78.3% after one and two years respectively. A possible explanation for the altered thermal behaviour of older films is linked to the chemical transformations occurring in the film layers during drying processes. As autoxidation and polymerisation occur throughout the film, cross-linking reactions give rise to the formation of polymer matrix and then to new molecules, which are subjected to fragmentation and elimination with ageing [van den Berg J.D., 2002; Lazzari M., 1999]. For unpigmented oil films the total weight percent variation was higher than 90%, while for pigmented layers values vary from around 80% (cobalt blue, cadmium yellow) to 32.9% (ultramarine in linseed oil). These differences are due to the differences in composition of the painted layers. For instance, the film made of cadmium red in linseed oil (sample CRoil) had a 30% of weight loss. This result was presumably the combination of both the presence of inorganic fraction (cadmium red, CdS) and curing (28 years of natural ageing). The case of ultramarine film is interesting (sample U2): since it contains mainly silicates (ultramarine formula is 2Na2Al2Si2O6·NaS2 [Montagna G., 1993]), the temperature reached during thermal analyses (550°C) is not sufficient to achieve the complete combustion of the inorganic part. The weight percent of TG analysis residue was almost 70%. When 20% of aluminium stearate is added to the formulation (sample U2AS20P), less pigment is needed (decrease of pigment volume concentration). The percentage of weight lost increased as it included the combustion of the dispersion agent, which is an organic metallic salt. The same happens when castor wax (hydrogenated castor oil) is added as stabiliser in ultramarine formulation (sample U2HCO). Compared to the TG thermograms, those of DSC analyses are more varied: exothermic and endothermic peaks, are reported in Tables 4.2-4.3 case by case. The exothermic peak at around 150° is visible all the cured samples: this peak is an index of a fundamental importance for studying the rate of cross-linking in the film thickness [Ploeger R., 2008]. The exothermic process of cross-linking happened after the decomposition of hydroperoxides groups and the further formation of radicals reacting with the double bonds C=C [Mills J.S., 1987].
87

Endo
ther
mic
pea
ks
400°
C; 4
75°C
418°
C; 4
51°C
; 49
3°C
422°
C; 4
57°C
; 49
7°C
423°
C; 4
55°C
; 49
8°C
403°
C; 4
75°C
413°
C; 4
82°C
422°
C; 4
96°C
424°
C; 4
97°C
411°
C; 4
86°C
414°
C; 4
92°C
417°
C; 4
98°C
404°
C; 4
74°C
414°
C; 4
85°C
419°
C; 4
89°C
406°
C; 4
78°C
425°
C; 5
02°C
415°
C; 4
99°C
DSC
res
ult
s
Exot
her
mic
pea
ks
382°
C; 4
22°C
151°
C; 4
50°C
; 47
0°C
153°
C; 4
52°C
; 47
2°C
154°
C; 4
53°C
; 47
2°C
383°
C; 4
44°C
158°
C; 4
51°C
161°
C; 4
56°C
; 47
4°C
160°
C; 4
57°C
; 47
7°C
151°
C; 4
38°C
; 47
1°C
152°
C; 1
78°C
; 44
5°C;
475
°C
154°
C; 4
51°C
; 47
6°C
148°
C; 4
78°C
155°
C; 4
53°C
; 48
8°C
156°
C; 4
59°;
489
°C
159°
C; 4
58°C
; 46
9°C
153°
C; 4
64°C
; 47
8°C
156°
C; 4
65°C
; 48
0°C
Tota
l wei
ght
loss
es %
95.6
95.4
93.8
92.1
94.9
94.8
93.7
92.3
94.2
92.1
91.7
94.6
93.8
92.3
94.1
93.6
93.5
TG r
esu
lts
Wei
ght
loss
es r
egio
ns
(1)
250-
400°
C; (
2) >
400°
C
(1)1
00-2
50°C
; (2
) 25
0-40
0°C;
(3)
>40
0°C
(1)1
00-2
50°C
; (2
) 25
0-40
0°C;
(3)
>40
0°C
(1)1
00-2
50°C
; (2
) 25
0-40
0°C;
(3)
>40
0°C
(1)
250-
400°
C; (
2) >
400°
C
(1)1
00-2
50°C
; (2
) 25
0-40
0°C;
(3)
>40
0°C
(1)1
00-2
50°C
; (2
) 25
0-40
0°C;
(3)
>40
0°C
(1)1
00-2
50°C
; (2
) 25
0-40
0°C;
(3)
>40
0°C
(1)1
00-2
50°C
; (2
) 25
0-40
0°C;
(3)
>40
0°C
(1)1
00-2
50°C
; (2
) 25
0-40
0°C;
(3)
>40
0°C
(1)1
00-2
50°C
; (2
) 25
0-40
0°C;
(3)
>40
0°C
(1)1
00-2
50°C
; (2
) 25
0-40
0°C;
(3)
>40
0°C
(1)1
00-2
50°C
; (2
) 25
0-40
0°C;
(3)
>40
0°C
(1)1
00-2
50°C
; (2
) 25
0-40
0°C;
(3)
>40
0°C
(1)1
00-2
50°C
; (2
) 25
0-40
0°C;
(3)
>40
0°C
(1)1
00-2
50°C
; (2
) 25
0-40
0°C;
(3)
>40
0°C
(1)1
00-2
50°C
; (2
) 25
0-40
0°C;
(3)
>40
0°C
Age
of
the
film
fres
h
1 w
eek
1 ye
ar
2 ye
ars
fres
h
1 w
eek
1 ye
ar
2 ye
ars
1 w
eek
1 ye
ar
2 ye
ars
1 w
eek
1 ye
ar
2 ye
ars
1 w
eek
1 ye
ar
2 ye
ars
Sam
ples
CPLO
Stan
d oi
l
Popp
y se
ed o
il
Sunf
low
er o
il
Cast
or o
il
Table 4. 2: TG-DSC results for analysed unpigmented oil samples
88

Endo
ther
mic
pea
ks
434°
C; 4
51°C
; 47
8°C
436°
C; 4
50°C
; 47
9°C
435°
C; 4
53°C
; 48
4°C
302°
C; 4
37°C
; 48
2°C
303°
C; 4
38°C
; 48
7°C
303°
C; 4
41°C
; 48
6°C
303°
C; 3
66°C
; 46
8°C
332°
C; 4
04°C
; 47
5°C
393°
C; 4
62°C
82°C
; 32
3°C;
395
°C;
463°
C
411°
C; 4
63°C
412°
C; 4
64°C
220°
C; 3
91°C
; 46
0°C
428°
C; 4
66°C
123°
C; 3
07°C
; 44
3°C;
82°C
; 32
3°C;
395
°C;
464°
C
DSC
res
ult
s
Exot
her
mic
pea
ks
153°
C; 3
7°C;
455
°C
155°
C; 4
21°C
; 43
°C;
458°
C
158°
C; 4
22°C
; 44
8°C;
461
°C
151°
C; 3
90°C
; 40
5°C;
456
°C
156°
C; 3
91°C
; 40
8°C;
455
°C
158°
C; 4
01°C
; 40
9°C;
459
°C
246°
C; 4
08°C
175°
C; 2
50°C
; 35
5°C;
493
°C
154°
C; 3
44°C
; 38
1°C;
481
°C
155°
C; 3
45°C
; 37
9°C;
482
°C;
524°
C
153°
C; 3
51°C
; 44
5°C;
481
°C
154°
C; 3
54°C
; 44
6°C;
485
°C
178°
C; 2
70°C
; 44
0°C;
482
°C
180°
C; 4
41°C
; 44
6°C
251°
C; 3
83°C
; 49
7°C
253°
C; 4
10°C
; 52
5°C
Tota
l wei
ght
loss
es %
83.4
80.8
78.3
84.5
84.1
82.8
30.9
70.1
32.9
50.2
47.4
49.4
60.3
82.7
82.6
92.5
TG r
esu
lts
Wei
ght
loss
es r
egio
ns
(1)1
00-2
50°C
; (2
) 25
0-40
0°C;
(3)
>
400°
C (1
)100
-250
°C;
(2)
250-
400°
C; (
3)
>40
0°C
(1)1
00-2
50°C
; (2
) 25
0-40
0°C;
(3)
>
400°
C (1
)100
-250
°C;
(2)
250-
400°
C; (
3)
>40
0°C
(1)1
00-2
50°C
; (2
) 25
0-40
0°C;
(3)
>
400°
C (1
)100
-250
°C;
(2)
250-
400°
C; (
3)
>40
0°C
(1)1
00-2
50°C
; (2
) 25
0-40
0°C;
(3)
>
400°
C (1
)100
-250
°C;
(2)
250-
400°
C; (
3)
>40
0°C
(1)1
00-2
50°C
; (2
) 25
0-40
0°C;
(3)
>
400°
C (1
)100
-250
°C;
(2)
250-
400°
C; (
3)
>40
0°C
(1)1
00-2
50°C
; (2
) 25
0-40
0°C;
(3)
>
400°
C (1
)100
-250
°C;
(2)
250-
400°
C; (
3)
>40
0°C
(1)1
00-2
50°C
; (2
) 25
0-40
0°C;
(3)
>
400°
C (1
)100
-250
°C;
(2)
250-
400°
C; (
3)
>40
0°C
(1)1
00-2
50°C
; (2
) 25
0-40
0°C;
(3)
>
400°
C
(1)
100-
400°
C; (
2) >
400°
C
Age
of
the
film
1 w
eek
1 ye
ar
2 ye
ars
1 w
eek
1 ye
ar
2 ye
ars
28 y
ears
28 y
ears
45 y
ears
*
45 y
ears
*
45 y
ears
*
45 y
ears
*
45 y
ears
*
- - -
Sam
ples
Coba
lt Bl
ue in
lin
seed
oil
Cadm
ium
Yel
low
in
linse
ed o
il
Cadm
ium
red
in
linse
ed o
il Al
izar
in in
pop
py
seed
oil
U2
U2H
CO
U2A
S10P
U2A
S20P
RSA
S30P
AS
ZS
HCO
Table 4. 3: TG-DSC results for analysed pigmented and additive-containing oil samples
89

90
91
92
93
94
95
96
fresh
1 w
eek
1 ye
ar
2 ye
ars
fresh
1 w
eek
1 ye
ar
2 ye
ars
1 w
eek
1 ye
ar
2 ye
ars
1wee
k
1 ye
ar
2 ye
ars
1wee
k
1 ye
ar
2 ye
ars
CPLO StandOil PoppyOil Sunflow erOil CastorOil
Figure 4. 19: total weight % lost after TG analysis for oil films
20
30
40
50
60
70
80
90
1 w eek 1 year 2 years 1 w eek 1 year 2 years 28years
28years
45years
45years
45years
45years
45years
CBoil CYoil CRoil PopAl U2 UHCO UAS10 UAS20 RSAS30
Figure 4. 20: total weight % lost after TG analysis for oil films containing pigments and
additives With significant natural (28 years) and artificial (estimated 45 years under museum conditions) ageing, it is possible to notice that the hydroperoxide peak changes in size, becoming smaller and broader: Figure 4.21 illustrates the comparison of the DSC peak at 150°C in films of different ageing. While one-year old CPLO and stand oil films showed a well resolved peak at 153°C and 161°C respectively, the trend of the curve changed and broadened for pigmented and cured oil films. This provides an interesting indication on the rate of cross-linking, as suggests that the autoxidation processes occurred and led to the film formation. The concentration of hydroperoxides, which initially increased while the autoxidation took place, decreased with age (to almost disappear) from the occurrence of the formation of new bonds and the cure of the formed film [Wexler H., 1964]. The influence of pigments and ageing during the autoxidation processes was observed in the DCS thermograms: corresponding to the melting transition and oxidative decomposition peaks were observed shifting and changes in size. As depicted in Figure 4.22, the comparison between the DSC curves of one-year old CPLO film and artificial
90

ultramarine aged 45 years outlines several differences in endothermic and exothermic peak temperature.
100 200
-2
-1
0
1
Hea
t Flo
w (u
V/m
g)
Temperature °C
CPLO, 1 year StandOil, 1year CBoil, 1year CRoil, 28 year U2, 45 years
exo
Figure 4. 21: comparison of the DSC exothermic peak at 150°C (hydroperoxide groups)
100 200 300 400 500-3
-2
-1
0
1
2
Hea
t Flo
w(u
V/m
g)
Temperature °C
U2 CPLO
153°C
155°C 481°C
472°C
390°C
450°C
465°C
422°C
Figure 4. 22: comparison of DSC thermograms of CPLO and U2
50 100
-3,5
-3,0
-2,5
-2,0
-1,5
-1,0
-0,5
0,0
0,5
Hea
t Flo
w (u
V/m
g)
Temperature °C
exo
82°C
Figure 4. 23: DSC chromatogram of castor wax, with the characteristic endothermic peak at 82°C
91

100 200 300 400 500-6
-5
-4
-3
-2
-1
0
1
2
3
Hea
t Flo
w (W
/g)
Temperature °C
U2 U2AS2P AS
exo
Figure 4. 24: comparison of DSC thermograms of U2, U2AS2P and AS
300 400 500-16
-14
-12
-10
-8
-6
-4
-2
0
2
Hea
t Flo
w (u
V/m
g)
Temperature °C
RS30ASP AS
Figure 4. 25: comparison of DSC thermograms of RSAS30P and AS (selected temperature range 250-500°C)
The melting transitions for raw oil are particular as they occur at 422 and 450°C, while in U2 film one big melting event is recorded at 465°C. A shift to higher temperature also occurs for the exothermic peaks related to the second oxidation decomposition, which occurs at 472°C for CPLO and at 481°C for ultramarine film. TG-DSC analyses carried out on films containing lipidic additives successfully allowed for their identification, thanks to the comparison with reference thermograms of these materials. In particular, films containing HCO showed an endothermic peak at 82°C (also observed in [Ploeger R., 2008]): it derives from a melting transition of castor wax as it was observed in the reference of HCO in a temperature region where no other peaks were present (Figure 4.23). Figures 4.24-4.25 illustrate the DSC thermograms of films containing aluminium stearate: this was identified by a series of exothermic peaks in the region between 440 and 450°C.
92

4.1.4 GC-MS investigations GC-MS analyses were carried out on unpigmented, pigmented and additive-containing oil paints, following the same criteria used in the previous investigations. The method used is described in Chapter 3.4: it was especially designed while taking into consideration the modern manufactured oil formulations studied in the current research. The optimisation of the GC-MS method has lead to an innovative combination of extraction and derivatisation procedures, which reduce the complexity of treatments and the needed amount of sample. The selected transesterification reagent, Meth-Prep II®, enables the simultaneous methylation of (ester-, metal-bound and free) fatty acids, glycerol, natural resins and waxes. Qualitative and quantitative analyses were performed. At the present knowledge, this research seems to be the first which quantitatively considers the derivatives of the complex reaction between Meth-Prep II® and glycerol present in drying oils. This is an important improvement as it permits to include glycerol in evaluating molar ratios and characteristic parameters in oil films, such as P/G (palmitic- to glycerol). Under the experimental conditions described in Chapter 3.4, GC-MS analysis also enables a better understanding of the complex processes occurring in artists’ oil films and leading to the film formation, ageing and degradation. This is possible by detecting and quantifying not only the oil samples constituents, but also the oxidation and degradation products detectable in oil films. 4.1.4.1 Qualitative GC-MS results The results of GC-MS analysis of a 2-year old unpigmented cold-pressed linseed oil film are shown in Figure 4. 26. The total ion current chromatogram exhibits all the characteristic drying oil components (see Table 4.4 for full list). The main fatty acids present as methyl esters are: short chain fatty acids (nonanoic C9, capric C10, lauric C12), dicarboxylic acids (adipic 2C6, pimelic 2C7, suberic 2C8, azelaic 2C9, sebacic 2C10), saturated long chain fatty acids (myristic C14, palmitic C16, stearic C18, arachidic C20, behenic C22) and unsaturated fatty acids (oleic C18:1, linoleic C18:2, linolenic C18:3). Some oxidised C18 fatty acids were observed and their mass spectra are displayed in Figure 4.27-4.28-4.29. Several peaks related to glycerol derivatives were detected as well. The identified compounds all came from the hydrolysis (transesterification) and oxidative degradation of the original triglycerides which initially constituted the oil film. Since the film was relatively young and did not contain any pigment or drier, the double and triple unsaturated fatty acids were still detectable: nevertheless, their amount is much less compared to the original content (on average more than 50-60% of the total fatty acids) after autoxidation took place. The high amount of oleic acid is explainable by the youth of the film and by the minor reaction to autoxidation compared to doubly and triply unsaturated acids [Wexler H., 1964; van den Berg J. D., 2002]. The numerous and abundant oxidised C18 (oxo-, hydroxy-and methoxy-octadecanoic acids) were produced by the oxidative scission of unsaturated fatty acids. Dicarboxylic acids, such as azelaic, suberic and sebacic acids, are typical compounds from unsaturated fatty acids: they are the main oxidative degradation products and are formed as a consequence of fragmentations of triglycerides occurring in the cross-linked network.
93

6 8 10 12 14 16 18 20Time (min)
0
10
20
30
40
50
60
70
80
90
100R
elat
ive
Abu
ndan
ce15,45
15,67
13,59
17,38
9,11
7,7917,8310,34 15,75
20,2818,208,667,66 15,82 19,266,44 11,544,93 14,3912,5910,03
Figure 4. 26: Total ion current chromatogram of a 2-year old cold-pressed linseed oil film after transesterification and GC-MS analysis
Table 4. 4: Identified methylated compounds in a 2-year old linseed oil film after transesterification and GC-MS analysis
Retention time (min)
Molecular weight (m/z)
Compound (common name)
4.93 172 Nonanoic acid, methyl ester 5.14 174 Hexanedioic acid, dimethyl ester (adipic) 6.18 186 Decanoic acid, methyl ester (capric) 6.44 188 Heptanedioic acid, dimethyl ester (pimelic) 6.85 264 Glycerol derivative 7.13 174 Octanoic acid, 8-hydroxy-, methyl ester 7.66 186 Nonanoic acid, 9-oxo-, methyl ester 7.79 202 Octanedioic acid, dimethyl ester (suberic) 8.11 250 Glycerol derivative 8.66 214 Dodecanoic acid, methyl ester (lauric) 9.11 216 Nonanedioic acid, dimethyl ester (azelaic) 10.03 214 Undecanoic acid, 10-oxo-, methyl ester 10.34 230 Decanedioic acid, dimethyl ester (sebacic) 11.25 242 Tetradecanoic acid, methyl ester (myristic) 11.54 244 Undecanedioic acid, dimethyl ester 12.40 256 Pentadecanoic acid, methyl ester 12.70 258 Dodecanedioic acid, dimethyl ester 12.96 394 Glycerol derivative 13.36 268 Hexadecenoic acid, methyl ester (palmitoleic) 13.59 270 Hexadecanoic acid, methyl ester (palmitic) 13.61 394 Glycerol derivative 13.65 266 Hexadecadienoic acid, methyl ester 13.90 380 Glycerol derivative 14.05 380 Glycerol derivative
94

14.58 284 Heptadecanoic acid, methyl ester (margaric) 15.04 292 9,12,15-Octadecatrienoic acid, methyl ester (linolenic) 15.17 294 9,12-Octadecadienoic acid, methyl ester (linoleic) 15.46 296 9-Octadecenoic acid, methyl ester, (oleic) 15.67 298 Octadecanoic acid, methyl ester (stearic) 15.75 292 9,12,15-Octadecatrienoic acid, methyl ester (linolenic) 16.58 312 Nonadecanoic acid, methyl ester (internal standard) 17.12 312 Octadecanoic acid, 9,10-epoxy-, methyl ester (cis) 17.39 312 Octadecanoic acid, 9,10-dimethoxy-, methyl ester (cis) 17.51 326 Eicosanoic acid, methyl ester (arachidic) 17.70 524 Glycerol derivative 17.84 312 Octadecanoic acid, 9,10-epoxy-, methyl ester (trans) 18.20 312 Octadecanoic acid, 9,10-dihydroxy-, methyl ester 18.49 312 Octadecanoic acid, 10-oxo-, methyl ester 19.12 312 Octadecanoic acid, 9,10-epoxy-, methyl ester (cis) 19.26 354 Docosanoic acid, methyl ester (behenic)
40 90 140 190 240 290 340 390 440 4900
41
55
74
155
83109 139 171 199
214 239 281 312
Figure 4. 27: Mass spectrum of oxidised C18 Octadecanoic acid, 9,10-epoxy-, (cis), methyl ester
10 40 70 100 130 160 190 220 250 280 310 3400
50
15
2987
96109
127
138
170
187
201
41
55
74
155
O
Figure 4. 28: Mass spectrum of oxidised C18 Octadecanoic acid, 9,10-dihydroxy-, methyl ester
Figure 4. 29: Mass spectrum of oxidised C18 Octadecanoic acid, 10-oxo-,methyl ester
50
100
O
O
O
100
OH
OHO
10 30 50 70 90 110 130 150 170 190 210 230 250 270 290 3100
50
100
15
29
43
55
71
8197 125 141
156
167 182
199
214
239 252
281
312
OO
O
95

Unlike FT-IR and TG-DSC analyses, the differences in processing during oil preparation can be seen by GC-MS analysis. The chromatogram of Figure 4.30, refers to a pre-polymerised oil (stand oil). Among the drying oil components (fully reported in Table 4.5), some cyclic compounds were detected as methyl esters, such as7-(o-pentylphenyl)-heptanoic acid (mass spectrum in Figure 4.31) and 9-(o-propylphenyl)-nonanoic acid (mass spectrum in Figure 4.32). These are likely the cyclisation products due to the oil pre-polymerisation [Sebedio J.L., 1989].
5 6 7 8 9 10 11 12 13 14 15 16 17 18 19 20Time (min)
0
10
20
30
40
50
60
70
80
90
100
Rel
ativ
e A
bund
ance
13,58
15,66
9,13
17,3815,44
17,7413,00
13,647,70 7,82 16,6910,38
8,15 18,377,46 14,0711,84 19,319,224,99 6,38 11,58 20,41
Figure 4. 30: Total ion current chromatogram of a 2-year old stand oil film after
transesterification and GC-MS analysis
Table 4. 5: Identified methylated compounds in a 2-year old stand oil film after transesterification and GC-MS analysis
Retention time (min)
Molecular weight (m/z)
Compound (common name)
4.99 172 Nonanoic acid, methyl ester 5.17 174 Hexanedioic acid, dimethyl ester (adipic) 6.19 186 Decanoic acid, methyl ester (capric) 6.38 188 Heptanedioic acid, dimethyl ester (pimelic) 6.87 264 Glycerol derivative 7.46 174 Octanoic acid, 8-hydroxy-, methyl ester 7.70 186 Nonanoic acid, 9-oxo-, methyl ester 7.82 202 Octanedioic acid, dimethyl ester (suberic) 8.15 250 Glycerol derivative 8.69 214 Dodecanoic acid, methyl ester (lauric) 9.13 216 Nonanedioic acid, dimethyl ester (azelaic) 10.03 214 Undecanoic acid, 10-oxo-, methyl ester 10.38 230 Decanedioic acid, dimethyl ester (sebacic) 11.27 242 Tetradecanoic acid, methyl ester (myristic) 11.58 244 Undecanedioic acid, dimethyl ester 12.74 258 Dodecanedioic acid, dimethyl ester
96

12.96 394 Glycerol derivative 13.58 270 Hexadecanoic acid, methyl ester (palmitic) 13.64 394 Glycerol derivative 13.90 380 Glycerol derivative 14.07 380 Glycerol derivative 15.04 292 9,12,15-Octadecatrienoic acid, methyl ester (linolenic) 15.17 294 9,12-Octadecadienoic acid, methyl ester (linoleic) 15.44 296 9-Octadecenoic acid, methyl ester, (oleic) 15.66 298 Octadecanoic acid, methyl ester (stearic) 15.75 292 9,12,15-Octadecatrienoic acid, methyl ester (linolenic) 15.87 290 Heptanoic acid, 7-(o-pentylphenyl)-, methyl ester 15.98 290 Nonanoic acid, 9-(o-propylphenyl)-, methyl ester 16.14 290 Nonanoic acid, 9-(o-propylphenyl)-, methyl ester 16.44 290 Heptanoic acid, 7-(o-pentylphenyl)-, methyl ester 16.58 312 Nonadecanoic acid, methyl ester (internal standard) 17.12 312 Octadecanoic acid, 9,10-epoxy-, methyl ester (cis) 17.38 312 Octadecanoic acid, 9,10-dimethoxy-, methyl ester (cis) 17.51 326 Eicosanoic acid, methyl ester (arachidic) 17.70 524 Glycerol derivative 17.84 312 Octadecanoic acid, 9,10-epoxy-, methyl ester (trans) 18.20 312 Octadecanoic acid, 9,10-dihydroxy-, methyl ester 18.49 312 Octadecanoic acid, 10-oxo-, methyl ester 19.12 312 Octadecanoic acid, 9,10-epoxy-, methyl ester (cis) 19.26 354 Docosanoic acid, methyl ester (behenic)
50 100 150 200 250 300 350 400 450 5000
50
100
59
74
91
105
117
131
147161 187
219
259
290
O
O
Figure 4. 31: Mass spectrum of Heptanoic acid, 7-(o-pentylphenyl)-, methyl ester
40 90 140 190 240 290 340 390 440 490 5400
50
100
41
74
91
105
119
133
147 183
197
229
258
290
O
O
Figure 4. 32: Mass spectrum of Nonanoic acid, 9-(o-propylphenyl)-, methyl ester
97

With the progressive ageing of the oil film, the difatty acids content may increase consistently, indicating a high degree of oxidation; this increase is even more evident if a catalyst is present in the paint. This double influence can be noticed in the GC-MS chromatogram of a (naturally aged) 28-year old linseed oil film containing lead white (knowingly having a catalytic action [Mills J.S., 1987; Tumosa C., 2005]) , shown in Figure 4.33. The chromatogram mainly shows the same compounds detected for the 2-year old unpigmented film, but the relative quantities are different. Linoleic and linolenic acids reacted completely as they were not present anymore; almost no monounsaturated C18:1 acid was detected (a very low oleic peak at 15.28 min), while few oxidised C18 fatty acids were observed. However, the diacid content suggested a high degree of oxidation: the most abundant peak was the one of azelaic acid (at 8.94 min). As seen for FT-IR and TG-DSC analyses, the influence of pigments like lead might be explained in terms of accelerating the rate of drying. In particular metals like cobalt, manganese, lead, copper and iron are considered as catalysts, since they can start a reduction-oxidation (redox) mechanism which is able to promote polymerisation.
10 11 12 13 14 15 16 17 18 19Time (min)
13,38
15,46
12,81
16,4210,19
13,4517,54
11,65
10,4610,979,57 14,23
12,01 18,22 1914,07 17,35 19,1114,40 16,24
6 8 10 12 14 16 18 20Time (min)
10
20
30
40
50
60
70
80
90
100
Rel
ativ
e A
bund
ance
8,94
7,6413,38
15,467,28 12,81 16,426,32 7,97 10,194,61 13,45 17,5411,65 14,23 20,8118,22 19,76
Figure 4. 33: Total ion current chromatogram of a 28-year old linseed oil film containing lead
white after transesterification and GC-MS analysis
Table 4. 6: Identified methylated compounds in a 28-year old linseed oil film containing lead white after transesterification and GC-MS analysis
Retention Time min)
Molecular Weight (m/z)
Compound (common name)
4.61 172 Nonanoic acid, methyl ester 5.02 174 Hexanedioic acid, dimethyl ester (adipic) 5.81 142 Heptenoic acid, methyl ester 6.08 170 7-Nonenoic acid, methyl ester 6.18 186 Decanoic acid, methyl ester (capric) 6.32 188 Heptanedioic acid, dimethyl ester (pimelic) 6.81 264 Glycerol derivative 7.28 264 Glycerol derivative
98

7.48 250 Glycerol derivative 7.64 202 Octanedioic acid, dimethyl ester (suberic) 7.97 250 Glycerol derivative 8.82 214 Dodecanoic acid, methyl ester (lauric) 8.94 216 Nonanedioic acid, dimethyl ester (azelaic) 10.19 230 Decanedioic acid, dimethyl ester (sebacic) 11.04 244 Undecanedioic acid, dimethyl ester 11.10 242 Tetradecanoic acid, methyl ester (myristic) 11.65 300 Octadecanoic,9,10 –dimethoxy-, methyl ester 12.40 256 Pentadecanoic acid, methyl ester 12.81 394 Glycerol compound 13.38 270 Hexadecanoic acid, methyl ester (palmitic) 13.45 394 Glycerol compound 14.05 380 Glycerol compound 15.28 296 9-Octadecenoic acid, methyl ester, (oleic) 15.67 298 Octadecanoic acid, methyl ester (stearic) 16.42 312 Nonadecanoic acid, methyl ester (internal standard) 17.35 312 Octadecanoic acid, 9,10-epoxy-, methyl ester, cis- 17.51 326 Eicosanoic acid, methyl ester (arachidic) 17.54 524 Glycerol compound 17.84 312 Octadecanoic acid, 9,10-epoxy-, methyl ester, trans- 18.22 312 Octadecanoic acid, 9,10-epoxy-, methyl ester, cis-
Lipidic additives and additive-containing films were analysed by GC-MS. The chromatogram of Figure 4.34 refers to hydrogenated castor oil (or castor wax). This rheology and stabilisation additive is normally added as 1–2% of total pigment weight and its addition is easily detectable thanks to the presence of a specific marker, namely 12-hydroxy-stearic acid (mass spectrum in Figure 4.35) and its oxidation products such as 12-hydroxy-methoxy stearic acid (mass spectrum in Figure 4.36).
6 8 10 12 14 16 18 20Time (min)
0
10
20
30
40
50
60
70
80
90
100
Rel
ativ
e A
bund
ance
16,95
19,82
16,31
15,00
17,08
12,3612,99
11,92 18,146,88 7,07 18,646,42 20,208,59 14,85 18,0715,955,22 10,669,93
Figure 4. 34: Total ion current chromatogram of castor wax after transesterification and GC-MS
analysis
99

Table 4. 7: Identified methylated compounds in castor wax after transesterification and GC-MS analysis
Retention Time min)
Molecular Weight (m/z)
Compound (common name)
6.42 264 Glycerol derivative 6.88 264 Glycerol derivative 7.07 250 Glycerol derivative 7.56 250 Glycerol derivative 12.36 394 Glycerol compound 12.90 270 Hexadecanoic acid, methyl ester (palmitic) 12.99 380 Glycerol compound 13.43 380 Glycerol compound 14.85 296 9-Octadecenoic acid, methyl ester, (oleic) 15.00 298 Octadecanoic acid, methyl ester (stearic) 15.95 312 Nonadecanoic acid, methyl ester (internal standard) 16.31 328 Stearic acid, 12 hydroxy methoxy, methyl ester 16.73 312 Stearic acid, 12-oxo-, methyl ester 16.95 314 Stearic acid, 12-hydroxy-, methyl ester 17.08 524 Glycerol derivative 19.82 264 Unsatutared C18 acid
20 40 60 80 100 120 140 160 180 200 220 240 260 280 300 3200
50
100
29
43
55
6983
87
97
115 129143 157
171 185
197
215
229247
265281
296OHO
O
Figure 4. 35: Mass spectrum of stearic acid, 12-hydroxy-, methyl ester
40 80 120 160 200 240 280 320 360 4000
50
100
55
6981
97
109
129
161 179211
243
252
O
O
O
Figure 4. 36: Mass spectrum of stearic acid, 12 hydroxy methoxy, methyl ester
40 80 120 160 200 240 280 320 360 400 4400
50
10043
69 85113
153167 186 242
280 312
O
O
O
Figure 4. 37: Mass spectrum of stearic acid, 12-oxo-, methyl ester
100

HCO contains high amounts of glycerol (peaks labelled as Gly in Figure 4.3) and a unsaturated C18 acid (peak at 19.82 min, likely 12-octadecenoic acid). Unlike castor wax, aluminium and zinc stearates do not have any specific lipidic compounds to be easily detected and individuated in oil paints. They consist, in fact, principally of stearates and palmitates, present as stearic (peak at 15.73 min) and palmitic (at 13.64 min) methyl esters as it is shown in the chromatogram of Figure 4.38; traces of myristic acid (peak at 11.29 min) were also detected, since commercial stearates normally contain free fatty acids as impurities. These saturated C14, C16 and C18 compounds are normally present and very abundant in oil films, as seen before.
8 9 10 11 12 13Time (min)
11,29
9,228,82
12,45 13,008,767,82 9,35 9,50 11,1810,55 11,62 12,14 12,95 13,39
6 7 8 9 10 11 12 13 14 15 16 17 18 19 20Time (min)
0
10
20
30
40
50
60
70
80
90
100
Rel
ativ
e A
bund
ance
15,73
13,64
11,29 16,61 17,5414,635,66 9,22 19,868,82 19,306,09 6,86 12,459,71
Figure 4. 38: Total ion current chromatogram of aluminium stearate after transesterification
and GC-MS analysis Stearate-containing films were prepared by adding stearates as 2-5-10-20-30% of total pigment weight. Qualitative comparison of chromatograms referring to the series Raw Sienna is shown in Figure 4.39. When higher amounts of aluminium stearates are added, the increase in stearates and palmitates contents may be observed in terms of relative abundance; at the same time the peak of azelaic acid (2C9) and the main peak of glycerol (Gly) appear to become lower in abundance. The extraction method described in Chapeter3.4 may allow the separation of fatty acids from the oil binders and stearates and palmitates present as added metal soaps and bounded to the pigments. Figure 4.40 depicts the chromatograms of the sample chrome green containing 20% of aluminium stearate (CGAS20P) analysed as whole sample, residue after extraction and extracted solution. It can be notice that the chromatogram of the residue contains principally palmitates and stearates (although some difatty acids- such as azelaic acid, and other oil components are also partially extracted).
101

8 9 10 11 12 13 14 15 16Time (min)
0
50
1000
50
1000
50
1000
50
100
Rel
ativ
e A
bund
ance
0
50
1000
50
100 2C9RS GlyC18C16
RSAS2P
RSAS5P
RSAS10P
RSAS20P
RSAS30P
Figure 4. 39: Comparison between azelaic (2C9), palmitic(C16),stearic (C18) acids and glycerol (Gly) in the TIC chromatograms from the series Raw Sienna: (from above), RS, RSAS2P,
RSAS5P, RSAS10P, RSAS20P, RSAS30P.
6 8 10 12 14 16 18 20Time (min)
0
20
40
60
80
1000
20
40
60
80
100
Rel
ativ
e A
bund
ance
0
20
40
60
80
100 CGAS20P_ENTIRE C18C16
2C9
CGAS20P_RESIDUE
CGAS20P_EXTRACT
Figure 4. 40: Comparison between azelaic (2C9), palmitic (C16),stearic (C18) acids in the TIC
chromatograms from the series Chrome Green: (from above) RSAS20P entire, residue and extracted solution.
102

4.1.4.2 Quantitative GC-MS results The developed GC-MS method permits quantitative analysis of glycerol and total fatty acids. The analytical results are expressed as concentration (ug/mg) and molar ratios between the characteristic fatty acids. P/S Oil media are usually identified on the basis of peak ratios [Mills J.S., 1966]. In this classification, two ratios are normally considered typical for drying oils: the ratio between azelaic- to palmitic acid (A/P) and the one between palmitic- to stearic acid (P/S). In particular A/P ratios greater than 1 indicates drying oils (in comparison to egg, whose A/P ratio is about 0.3). The approach used for differentiating diverse kind of drying oils is normally based on the P/S ratios: values of 1.5-2 refer to linseed oil, whereas ratios of approximately 2.6 and higher than 3 are characteristic for walnut and poppy seed oil respectively [Mills J.S, 1966; Schilling M., 1999; Colombini M.P., 2009]1. This is one of the reasons why GC-MS has been so widely applied for the characterisation of drying oils. As previously seen, in fact, FT-IR and TG-DSC techniques provide much useful information on the drying and ageing processes occurring in oil paints but are not able to identify the kinds of drying oil. However, the P/S ratio is based on the statement that saturated fatty acid, such as palmitic and stearic, do not modify during drying and curing reactions. Recent studies, however, have proven that the possible decrease of P/S with ageing is likely due to the preferential loss of palmitic acid with respect to stearic [Schilling M., 1998]. Furthermore, the distinction based on P/S ratios only considers traditional drying oils: that is to say that oils added in the modern paint formulations are not included in this distinction. In the chart of Figure 4.40 are depicted the P/S ratios calculated on unpigmented oil films, namely fresh, one-year and two-year old films done with cold-pressed linseed oil, stand oil, poppy seed oil, sunflower oil, castor oil, Tung oil, safflower oil and cottonseed oil. The fist observation is that over time (in this case only two years) the P/S values are quite constant within the same class of oil. The P/S values for linseed oil, stand oil and poppy seed oil are consistent with those reported in the specific literature (1.6, 1.3 and 3.9 respectively). However, it is possible to notice that other oils than traditional walnut and poppy seed oils have P/S ratios which fall in the range included between 2.5 and 5: this is the case of sunflower oil (3.3), safflower (2.8) and Tung oil (4). The overlapping in the P/S values could lead to misinterpretations in the identification of lipidic media. During this research, when it was possible, the identification of drying, slow-drying and non-drying oils was done considering both P/S ratios (with all the care required) and the presence of any special fatty acids. In Table 4. 8 some of them are reported. For example, the presence of ricinoleic acid is indicative of the use of castor oil, while 11-eicosenoic (gondoic) acid and 13-docosenoic (erucic) acid are the biomarkers for rapeseed oil [Colombini M.P., 2009]. As regards sunflower oil, it is important to say that arachidic and behenic acids are not markers for this slow-drying oil, as they could be present in linseed oil too; nevertheless, in sunflower
1 A general confusion is due to the terms in which the ratios are expressed: some authors considered the ratio between their peak area [Mills J.S, 1966], others between the peak height [Ploeger R.,2008], others then the molar or concentration ratios [Schilling M., 1999]. The analytical results reported in this research are expressed in terms of molar ratios and calculated daily after the determination of single fatty acid/glycerol response factors and concentrations.
103

oil their weight percentage is higher than in linseed oil as it is reported in Table 1.4. The same consideration can be done for safflower oil, in which arachidic acid is present in a higher amount.
0
2
4
6
8
10
12
CPLO Stand oil Poppy seedoil
Sunflow eroil
Castor oil Tung oil Saff low eroil
Cottonseed oil
P/S fresh
P/S 1 year
P/S 2 years
Figure 4. 41: comparison between P/S calculated on fresh, 1-year, 2-year-old CPLO, stand oil, poppy seed oil, sunflower oil, castor oil, Tung oil, safflower oil and cottonseed oil films (three
replicates each) Table 4. 8: common oils used in modern artists’ oil manufacture with corresponding P/S molar
ratios and eventual special fatty acids
Kind of oil P/S Any special fatty acid
Linseed oil 1.6 (±0.3) -
Stand oil 1.3 (±0.4) Cyclic compound (7-(o-pentylphenyl)-
heptanoic acid; 9-(o-propylphenyl) nonanoic acid)
Poppy seed oil 3.9 (±1) -
Sunflower oil 3.3 (±0.2) Eicosanoic (arachidic) acid* Docosanoic (behenic) acid*
Safflower oil 2.8 (±0.3) Eicosanoic (arachidic) acid*
Castor oil 1 (±0.1) Hydroxyoctadecanoic (ricinoleic) acid 9,12-dihydroxyoctadecanoic acid
Tung oil 4 (±0.2) 9,11,13-octadecatrienoic (α-eleostearic) acid#
Cottonseed oil 9.5 (±0.5) -
Soya been oil 3.8 (±0.5) -
Rapeseed oil 3.7 (±0.3)
11-eicosenoic (gondoic)acid 13-docosenoic (erucic) acid
11,12-dihydroxyeicosanoic acid 13,14-dihydroxydocosanoic acid
*Arachidic and behenic acids are present in linseed oil too, but in sunflower oil their weight percentage is
higher; safflower oil present a higher amount of only arachidic acid (see Table 1.4); # α-eleostearic is detectable in fresh Tung oil as its high degree of unsaturation leads to polymerisation processes
104

P/S ratios were also calculated on pigmented oil films. The presence of pigments, even if known as driers and or catalyst in the drying processes, does not seem to influence the P/S values, as depicted in Figure 4.42. It is likely that the slight differences in P/S ratios visible in the chart are more related to the different quality of linseed oil used in the film preparation than to the ageing and pigmentation.
0,000,200,400,600,80
1,001,201,401,601,80
CPLO-1year
oilLW-28years
U2-45years
CG-45years
RS-45years
P/S
Figure 4. 42: comparison of P/S ratios between unpigmented CPLO and lead white,
ultramarine, chrome green and raw Sienna paints Differently from pigments, the presence of lipidic additives and metal stearates in particular, strongly influence the P/S ratios of oil films. It was proven that when the percentages of added stearates increase, the P/S ratios of the paint decrease due to the higher stearates content. This trend is well visible in the chart of Figure 4.43.
0,00
0,20
0,40
0,60
0,80
1,00
1,20
1,40
1,60
1,80
U2
U2AS2P
U2AS10P
U2AS20P
U2ZS2P
U2ZS10P
U2ZS15P
U2ZS20P
U2ZS30P CG
CGAS2P
CGAS5P
CGAS10P
CGAS20P
CGAS30P RS
RSAS2P
RSAS5P
RSAS10P
RSAS20P
RSAS30P
P/S
Figure 4. 43: P/S values for whole samples from stearate-containing oil films (series
ultramarine, chrome green and raw Sienna)
105

When extraction is performed as described in Chapter 3.4, the P/S ratios of the residues show values which are very close to those of metal stearate (P/S 0.5-0.8), as illustrated by the chart of Figure 4.44. The extracted solution, however, present P/S ratios which are similar to those of linseed oil (medium used in the preparation of additive-containing paints), as shown in Figure 4.45.
0,00
0,20
0,40
0,60
0,80
1,00
1,20
1,40
1,60
1,80
U2
U2AS2P
U2AS10P
U2AS20P
U2ZS2P
U2ZS10P
U2ZS15P
U2ZS20P
U2ZS30P CG
CGAS2P
CGAS5P
CGAS10P
CGAS20P
CGAS30P RS
RSAS2P
RSAS5P
RSAS10P
RSAS20P
RSAS30P
Figure 4. 44: P/S values for residues after extraction from stearate-containing oil films (series
ultramarine, chrome green and raw Sienna)
0,00
0,20
0,40
0,60
0,80
1,00
1,20
1,40
1,60
1,80
U2
U2AS2P
U2AS10P
U2AS20P
U2ZS2P
U2ZS10P
U2ZS15P
U2ZS20P
U2ZS30P CG
CGAS2P
CGAS5P
CGAS10P
CGAS20P
CGAS30P RS
RSAS2P
RSAS5P
RSAS10P
RSAS20P
RSAS30P
Figure 4. 45: P/S values for extracted solution from stearate-containing oil films (series
ultramarine, chrome green and raw Sienna)
106

On the other hand, P/S ratios do not seem to be modified by the addition of castor wax, as shown in Figure 4.46 thanks to the comparison between ultramarine paint, ultramarine paint with 2% and 5% of added HCO. This could be explained considering that HCO contains less than 10% of stearic acid and it is normally added by manufacturers for at least 2-5%,with the result that less than 1% of stearic acid coming from HCO may be present in the paint formulation.
00,20,40,60,8
11,21,41,61,8
U2 U2HCO U5HCO
P/S
Figure 4. 46: P/S values for samples from ultramarine oil film and ultramarine containing castor
wax Oil content, P/G and S/G GC-MS method enables to estimate the oil content of the paint sample thanks to the quantitation of the content of glycerol. Since in the majorities of drying oils the amount of glycerol is about 10% by weight, the percentage of oil in a paint sample is approximately ten times the percentage of glycerol [Schilling M., 1999]. The graphic in Figure 4.47 depicts the oil content calculated for one-year old CPLO, 28-year old lead white paint and 45-year old ultramarine, chrome green and raw Sienna. The values show a higher oil content in the paint film made only of oil and give information about the differences in the amount of oil used in the paint formulation, since every pigments requires a different amount of oil to be added [Doerner M., 1984]. Nevertheless, a limit in glycerol quantitation is due to the greater variability in the glycerol recovery for aged oil paints [Colombini M.P, 2009].
0,0010,0020,0030,0040,0050,0060,0070,0080,0090,00
CPLO-1year
oilLW-28years
U2-45years
CG-45years
RS-45years
% O
il
Figure 4. 47: comparison of Oil % between unpigmented CPLO and lead white, ultramarine,
chrome green and raw Sienna paints
107

P/G indicates the ratio of moles of palmitic to moles of glycerol detected in the sample. According to previous studies it was found that each drying oil has a well-defined and measurable P/G ratio, which is at its maximum value when the paint is fresh. The P/G ratio for castor oil is considered to be 0.03, 0.19 for linseed oil, 0.21 for safflower oil and 0.33 for poppy seed oil. Other lipidic media, such as egg yolk, have P/G higher the 1 [Schilling M., 1996; Lake S., 1999]. Nevertheless, the presence of metal stearate seems to have a strong influence also on the P/G ratios. A new evaluating parameter was introduced: the molar ratio between stearic acid to glycerol S/G may help in understand the direct influence of the addition of stearates in comparison with the glycerol content. Figure 4.48 reports the graphical comparison between P/G and S/G values from stearate-containing oil films: it can be noticed that the increase in the amount of added stearates leads to the increase of P/G and S/G values until values much higher than those indicated for drying oils.
0,00
0,50
1,00
1,50
2,00
2,50
U2
U2AS2P
U2AS10P
U2AS20P
U2ZS2P
U2ZS10P
U2ZS15P
U2ZS20P
U2ZS30P CG
CGAS2P
CGAS5P
CGAS10P
CGAS20P
CGAS30P RS
RSAS2P
RSAS5P
RSAS10P
RSAS20P
RSAS30P
P/GS/G
Figure 4. 48: comparison between P/G and S/G values from stearate-containing oil films (series ultramarine, chrome green and raw Sienna)
The same consideration is expressed by the graph of the molar ratios of P/G versus P/S (Figure 4.49). It is likely that when stearates are added in increasing percentage, the P/S values as are lower than 1 while the P/G (and S/G) values are higher than 1. For example, chrome green paint with 2% of added stearates has P/S=0.86 and P/G=0.29, while with 20% of added metal soap P/S=0.60 and P/G=1.42. The latter value is traditionally referred to egg yolk or casein, but it is actually the results of the influence of dispersion agents in modern formulations.
108

0,00
0,50
1,00
1,50
2,00
0,00 0,50 1,00 1,50 2,00
P/S
P/G
U2CGRS
Figure 4. 49: P/S vs P/G from stearate-containing oil films (series ultramarine, chrome green
and raw Sienna) A/P, D/P and A/S The ratio of saturated dicarboxylic to monocarboxylic acids is generally expressed by the A/P (azelaic-to palmitic acid) and D/P (sum of difatty acids-except azelaic-to palmitic acid) molar ratios. As difatty acids and in particular azelaic are formed during autoxidation and oxidative fragmentation of unsaturated drying oil compounds, A/P and D/P ratios should be higher in older samples. Nevertheless, these ratios only provide an indication of the degree of drying processes and the rate of oxidation, because they are influenced by several factors [Mills J.S. 1987; van den Berg J.D., 2002; Tumosa C.,2005]. A/S (azelaic-to stearic acid) was introduced to outline possible influences by added stearates in comparison with the difatty acid.
0,00
2,00
4,00
6,00
8,00
10,00
12,00
14,00
16,00
CPLO-1year
oilLW-28years
U2-45years CG-45years
RS-45years
A/PA/SD/P
Figure 4. 50: comparison between A/P, A/S and D/P values from unpigmented CPLO and lead white, ultramarine, chrome green and raw Sienna paints
109

Figure 4.50 depicts the comparison between the molar ratios A/P, A/S and D/P from unpigmented CPLO and several pigmented and aged paints. A/P (and A/S) are strongly influenced by the presence of drying catalysts, such as lead (in lead white) and manganese (contained in raw Sienna as Mn2O3 [Montagna G., 1993]): in fact their values are much higher than in other paints. Also in this case, stearates have a role in the variations exhibited by the A/P and A/S ratios (Figure 4.51-4.52): when the amount of dispersion agents increases, the ratio decrease, until values lower than 1. The latter value is traditionally referred to egg or mixture of egg and drying oil [Schilling M., 1996; Colombini M.P., 2009].
0
2
4
6
8
10
12
U2
U2AS2P
U2AS10P
U2AS20P
U2ZS2P
U2ZS10P
U2ZS15P
U2ZS20P
U2ZS30P CG
CGAS2P
CGAS5P
CGAS10P
CGAS20P
CGAS30P RS
RSAS2P
RSAS5P
RSAS10P
RSAS20P
RSAS30P
A/P
Figure 4. 51: A/P values for samples from stearate-containing oil films (series ultramarine,
chrome green and raw Sienna)
0
24
6
810
12
1416
18
U2
U2AS2P
U2AS10P
U2AS20P
U2ZS2P
U2ZS10P
U2ZS15P
U2ZS20P
U2ZS30P CG
CGAS2P
CGAS5P
CGAS10P
CGAS20P
CGAS30P RS
RSAS2P
RSAS5P
RSAS10P
RSAS20P
RSAS30P
A/S
Figure 4. 52: A/S values for samples from stearate-containing oil films (series ultramarine,
chrome green and raw Sienna)
110

Fatty acids and glycerol concentration An overview of the fatty acid and glycerol concentration (expressed as ug/mg) is presented in Figure 4.53. Once more, it is clear that the addition of metal soaps in the paints formulations could strongly influence the composition in terms of fatty acids and glycerol content as well as their molar ratios (as demonstrated above).
0%
20%
40%
60%
80%
100%
oiloil
LW U2
U2AS2P
U2AS10P
U2AS20P
U2ZS2P
U2ZS10P
U2ZS15P
U2ZS20P
U2ZS30P CG
CGAS2P
CGAS5P
CGAS10P
CGAS20P
CGAS30P RS
RSAS2P
RSAS5P
RSAS10P
RSAS20P
RSAS30P
C18
C16
C14
C12
C9
FA-2C10
FA-2C9
FA-2C8
glycerol (tot)
Figure 4. 53: fatty acid and glycerol concentration in unpigmented CPLO and lead white,
ultramarine, chrome green and raw Sienna paints
111

4.2 MANUFACTURED OIL PAINTS Several manufactured oil paints dating 1920s-2000s were investigated as the “missing link” between laboratory-prepared paints and real samples. The lists of oil tube paints are reported in Tables 3.4-3.5-3.6. The need of study and characterise components of commercial paints is due to the lack of information about oil media and additives in the tube labels. FT-IR, XRF, TG-DSC and GC-MS analyses were performed on samples from historical and more modern collapsible tube oils. Not all the abovementioned analytical techniques were carried out to test every paint sample, since the research was developed in different laboratories and/or in collaboration with several institutes. GC-MS, however, was performed for all the samples. The results are reported considering the different brands. Within the brands, a further distinction was done considering whether samples were collected directly from tubes or from painted out paint layers. Where information was available, the content of label, the identification code and/or the description of oil paints were reported (also from manufacturers’ catalogues and websites). 4.2.1 Royal Talens, The Netherlands Talens paint samples were both collected directly from historical oil paint tubes and from layers painted-out in 2008. Results are treated separately and reported in the Table 4.9 and 4.10, respectively. Samples taken from collections of oil tubes belong to the series Talens&Zoon (which was the former name of the paint manufacturer, from 1904 to 1949), Talens-Rembrandt and Talens-Van Gogh. GC-MS analyses reveal that the binding materials in all Talens paints are lipidic. Their chromatograms (see Figure 4.54-4.55) show the presence of glycerol derivatives (Gly) saturated (such as palmitic C16, stearic C18), dicarboxylic (such as suberic 2C8, azelaic 2C9 and sebacic 2C10) and unsaturated (oleic C18:1) acids as methyl esters. The majority of the paints show very high amounts of oleic (and sometimes linoleic) acid, as they were collected from the paste colours; some, however, were sampled from the external part of the tubes. For this reasons, oxidation products (such as difatty acids and oxidised C18 acids) were not uniformly detected in all paints. The molar ratios between saturated palmitic and stearic (P/S) acids and glycerol (P/G) were calculated. on both entire samples and residues after extraction and transesterification (Figure 4.56). The P/S ratios calculated on whole samples range between 1.3 and 3.4. Blue paints, in particular, have P/S values higher than 3, possibly related with the use of poppy seed, sunflower or safflower oils. The latter was also indicated by the producers as the medium of choice for blue colours from the 1960s [Litjens S., 2010]. P/S values of 1.3-1.8 are traditionally referred to the use of linseed oil [Mills J.S., 1966]. The P/S ratios calculated after extraction are slightly different from the previous ones. Except for the blue paints, the values are close or minor than 1. In the same way the values of the P/G ratios for entire and residues differ: in some cases P/G is higher than 1 after extraction. As seen in Chapter 4.1 for additive-containing oil films, P/S ratios lower than 1 and P/G ratios higher than 1 could provide an indication of the presence of metal stearates added in the paint
112

formulations as dispersion agents. Furthermore, XRF analyses performed in some of the Talens Van Gogh series in a previous study [Litjens S., 2010] show a significant presence of aluminium. This may also indicate the use of aluminium stearates, although aluminium could also be present as alumina [Mayer R, 1965].
Table 4. 9: GC-MS results from historical Royal Talens oil colours
GC-MS Sample P/S P/G A/P A/Sub other
Conclusions
Permanent groen (Permanent Green)
Talens&Zoon
1.8 0.9 (res)
0.1 1.8 (res) 0.9 6.6 High oleic
acid content Possibly linseed oil and
dispersion agents
Karmijnlak (Carmine lacquer)
Talens&Zoon
1.4 0.8 (res)
0.1 1 (res) - - High oleic
acid content Possibly linseed oil and
dispersion agents Ultramarijn Donker (Ultramarine Deep) Talens-Rembrandt
1.3 1 (res)
0.2 0.8 (res) 5.5 6.1 - Possibly linseed oil and
dispersion agents Koningsblauw (Queen’s Blue)
Talens-Rembrandt 3.5 0.1 - - High oleic
acid content Possibly poppy
seed/safflower oil Cobalt blauw Licht (Cobalt blue light) Talens-Rembrandt
3.4 0.2 - - High oleic acid content
Possibly poppy seed/safflower oil
Zink wit (Zinc white)
Talens-Rembrandt
2.1 1.1(res)
0.7 0.8 (res) 1.4 12 - Possibly safflower oil
and dispersion agents Mangaan blauw Phtl.
(manganese blue phthalate)
Talens-Rembrandt
1.8 0.9 (res)
0.1 1.8 (res) 4.2 >15 - Possibly linseed oil and
dispersion agents
Groene Aarde (Green Earth)
Talens-Rembrandt
2.5 1.1 (res)
0.3 1 (res) 5.2 >15
Possibly poppy seed/safflower oil and
dispersion agents Cadmium geel Licht (Cadmium yellow) Talens-Van Gogh
1.6 0.9 (res)
0.3 1.4 (res) - - High oleic
acid content Possibly linseed oil and
dispersion agents Lampen zwart (Lamp Black)
Talens-Van Gogh
1.3 0.9 (res)
0.2 1.3 (res) - - High oleic
acid content Possibly linseed oil and
dispersion agents
113

6 7 8 9 10 11 12 13 14 15 16 17 18 19 20Time (min)
0
10
20
30
40
50
60
70
80
90
100R
elat
ive
Abu
ndan
ce
GlyGlyGly GlyC19
C18:1
C18C16
2C8
2C9
Figure 4. 54: Total ion current chromatogram of (historical) Permanent Groen Talens&zoon paint after transesterification and GC-MS analysis
6 7 8 9 10 11 12 13 14 15 16 17 18 19 20Time (min)
0
10
20
30
40
50
60
70
80
90
100
Rel
ativ
e A
bund
ance
C192C10
GlyGly GlyGly
Gly
C18
C18:1
C16
2C8
2C9
Figure 4. 55: Total ion current chromatogram of (historical) Ultramarine Talens Rembrandt paint after transesterification and GC-MS analysis
114

0
1
2
3
4
Perman
ent G
roen
Karmijn
lak
Zink w
it
Ultramarijn
Don
ker
Groene A
arde
Mangaa
n blau
w Phtl.
konin
gblau
w
Cobalt b
lauw
Lampen
zwart
Cadmium
geel im
it
P/S entireP/S residueP/G entireP/G residue
Figure 4. 56: comparison between P/S and P/G ratios (entire and residues) for historical Royal
Talens oil paints Ultramarine blue, cadmium yellow and chrome green from the series Talens Rembrandt were purchased and applied on melinex in 2008 [Mills L., 2008]. The characteristics of the Talens Rembrandt series are described in the actual website with these words: “artistsquality extrafine; sublime brilliance and intensely deep colours; optimal colour strength due to the highest possible concentration of pigments and very fine grinding; highest degree of lightfastness; very pure colours and greatest durability of the paint coat . Zinc white and titanium white both based on linseed oil (for painting grounds) and based on non-yellowing safflower oil”.
For the Van Gogh series, which Azo Red L oil paint belongs to, the website claims:“ high quality; strong and brilliant colours; easy to mix and process; high content of pigments”. The paints were analysed by FT-IR, TG-DSC and GC-MS: the results are reported in Table 4.10. All paints were identified as having drying oil binding media and some of them also contain additives and fillers. In FT-IR spectra the typical absorption peaks related to oil are visible, as well as those of carbonates (likely calcium and magnesium carbonates added as pigment extenders) and possibly aluminium stearates (Figure 4.57). The presence of additives is indicated also by TG-DCS (Figure 4.58) and GC-MS analyses (Figure 4.59-4.60). In particular, GC-MS results suggest the use of linseed oil (P/S ratios after extraction range between 1.3 and 1.6) with metal stearates added in the paint formulations (P/S ratios of the residues are lower than 1).
115

Table 4. 10: FT-IR, TG-DSC and GC-MS results from Royal Talens oil colours (2008)
Sample (label) FT-IR TG-DSC GC-MS Conclusions
Ultramarine blue
Talens-Rembrandt
(PB29)
Oil ,silicates (ultramarine), Magnesium
carbonate (3693 cm-1)
Stearates?
DSC: exothermic Peaks at 151°C, 348°C, 484°C
(ultramarine in oil); 430-460°C stearates?
TG: 39% weight loss
Drying oil High oleic acid content
P/S=1.6 P/S= 0.6 (residue)
Possibly ultramarine with magnesium
carbonate in linseed oil
Indication of added stearates
Cadmium yellow Talens-
Rembrandt (PY35)
Oil, aluminium stearate
-
Drying oil High oleic acid content
P/S=1.3 P/S= 0.7 (residue)
Possibly cadmium yellow in linseed oil Indication of added
stearates
Chrome green Talens-
Rembrandt (PG17)
Oil ,calcium carbonate, Aluminium stearate
DSC: exothermic Peaks at 158°C,
395°C, 454°C (oil); 430-460°C stearates?
TG: 45% weight loss
Drying oil P/S=1.6
P/S= 0.8 (residue)
Possibly chrome green with calcium carbonate in linseed
oil Indication of added
stearates
Azo Red L Talens-Van
Gogh (P034)
Oil, carbonates, Aluminium stearate
- P/S=0.9
P/S=0.6 (residue)
Possibly organic dyestuff with
carbonate in linseed oil
Indication of added stearates
653
689
962
114
2
1377
142
014
62
1587
1741
2853
2922
336736
93
10 15
20
25
30
35
40
45
50
55
60
65
70
75
80
85
90
95
%T
1000 1500 2000 2500 3000 3500 4000 Wavenumbers (cm-1)
Figure 4. 57: FT-IR spectrum of Ultramarine Talens Rembrandt paint
116

100 200 300 400 500
-2,5
-2,0
-1,5
-1,0
-0,5
0,0
exo
158°C
395°C
454°C
0
20
40
60
80
100
Weight (%
)H
eat F
low
(uV
/mg)
Temperature °C
Figure 4. 58: TG-DSC thermogram of Cadmium yellow Talens Rembrandt paint
6 8 10 12 14 16 18 20Time (min)
0
10
20
30
40
50
60
70
80
90
100
Rel
ativ
e A
bund
ance
methoxymethoxy hydroxy
hydroxy
Oxo
OxoOxo
Oxo
C17
C20
C19
C18:1
C18C16
2C10
2C9
Gly
GlyGly
Gly
Gly
Gly
Gly
2C8
Figure 4. 59: Total ion current chromatogram of Ultramarine Talens Rembrandt paint after
transesterification and GC-MS analysis
117

6 7 8 9 10 11 12 13 14 15 16 17 18 19Time (min)
10
15
20
25
30
35
40
45
50
55
60
65
70
75
80
85
90
95
100R
elat
ive
Abu
ndan
ce
GlyC12 C14
Gly
GlyGly
GlyGly C19
C18:1
C18C16
2C10
2C8
2C9 N4TT
Figure 4. 60: Total ion current chromatogram of Azo Red L Talens VanGogh paint after
transesterification and GC-MS analysis 4.2.2 Old Holland, The Netherlands As seen for Talens paints, Old Holland paints were collected from historical oil paint tube (dating 1960s) and from paint films (dating 2008). Historical paints were semi-hardened as they were sampled from the external part of tubes. Paints were analysed by GC-MS: they were found to contain drying oil binding media. The chromatogram in Figure 4.61 refers to the cadmium red paint: glycerol (Gly), saturated (palmitic C16, stearic C18), unsaturated (oleic C18:1), dicarboxylic (suberic 2C8, azelaic 2C9, sebacic 2C10) acids and some oxidation products (Oxy) were detected. Table 4.11 displays the GC-MS results as evaluating parameters. Oleic acid was detected in higher amounts in all paint samples, indicating the immaturity of oil. The P/S ratios are in the range of linseed oil (1.3-1.6). Since there are no indications of added stearates in the residues after extraction, the low A/P values (see Raw Umber and Vermilion extra) are likely due to the low oxidation degree through the quite fresh samples.
118

Table 4. 11: GC-MS results from historical Old Holland oil colours
GC-MS Sample P/S P/G A/P A/Sub other
Conclusions
Cadmium Rood (Cadmium Red) 1.6 0.1 1.3 High oleic
acid content Possibly cold-pressed
linseed oil Rauwe Omber (Raw umber) 1.5 0.1 0.7 High oleic
acid content Possibly cold-pressed
linseed oil Vermiljoen Extra (Vermilion extra) 1.3 0.1 0.6 - High oleic
acid content Possibly cold-pressed
linseed oil Gebrande Omber (Burnt Umber) 1.5 01 1.6 High oleic
acid content Possibly cold-pressed
linseed oil
6 7 8 9 10 11 12 13 14 15 16 17 18 19 20 21Time (min)
10
20
30
40
50
60
70
80
90
100
Rel
ativ
e A
bund
ance
OxyOxyOxy
Gly
GlyGly
Gly
Gly2C10
2C8C19
C18
C18:1C16
2C9
Figure 4. 61: Total ion current chromatogram of historical Cadmium Rood Old Holland paint
after transesterification and GC-MS analysis
Ultramarine blue, cadmium yellow, cadmium red and chrome green were purchased in 2008 and applied on melinex [Mills L., 2008]. In the current Old Holland website it is stated: “In 1985, following extensive research, Old Holland presented a revolutionary range of 168 oil paints, each with the highest degree of lightness. [...] The only medium we use for our oil paints is cold-pressed extra virgin linseed oil, to obtain an optimum oxidization (drying) of the paint. This increases durability and brushstroke spread. Together, these characteristics result in an oil paint of unequalled quality”. The results from FT-IR, TG-DSC and GC-MS analyses are reported in Table 4.12. The paints were identified as containing drying oil: the medium is possibly linseed oil as the P/S ratios range between 1.3 and 1.6 and there are no indications of the addition of dispersion agents. Calcium carbonate was possibly used as an extender for pigments. In all Old Holland paints the presence of 12-hydroxy stearic acid was detected (see peak 12HydroxyC18 in the chromatogram of Figure 4.62). This is a derivative from castor wax (or hydrogenated castor oil) which was added as stabiliser for oil paints. The presence of
119

HCO was found in ultramarine paint thanks to the presence of the typical endothermic peak at 84°C in TG-DSC thermogram. In all the paints, high amount of oleic acid and glycerol were registered, likely due to the youth of the painted films.
Table 4. 12: FT-IR, TG-DSC and GC-MS results from Old Holland oil colours (2008)
Sample (label) FT-IR TG-DSC GC-MS conclusions
Ultramarine blue (A36)
Oil, silicates (ultramarine),calcium
carbonates
DSC: exothermic Peaks at, 151°C,
348°C, 484°C (ultramarine in
oil); Endothermic peak at 84°C (HCO). TG: 47% weight
loss
Drying oil High oleic acid and glycerol
content P/S=1.3
12-hydroxy stearic acid
Possibly ultramarine with
calcium carbonate in linseed oil. Presence of castor wax
cadmium yellow (D11)
Oil -
Drying oil High oleic acid and glycerol
content P/S=1.4
12-hydroxy stearic acid
Possibly cadmium yellow in linseed
oil. Presence of castor wax
chrome green (C50) Oil, carbonates -
Drying oil High oleic acid and glycerol
content P/S=1.6
12-hydroxy stearic acid
Possibly chrome green with
calcium carbonate in linseed oil. Presence of castor wax
120

6 8 10 12 14 16 18 20Time (min)
0
10
20
30
40
50
60
70
80
90
100R
elat
ive
Abu
ndan
ce
C14C12 Gly
C18:1
OxoOxoOxodiHydroxyC18
C19
12methoxyC18
Gly
GlyGly
Gly
Gly
Gly
Gly
12hydroxyC18
C18:1
C18
C16
2C10
2C8
2C9
Figure 4. 62: Total ion current chromatogram of Ultramarine Old Holland paint after
transesterification and GC-MS analysis
4.2.3 Claus&Fritz, The Netherlands The samples of Claus&Fritz paints were taken from historical tubes dating 1920s. Claus&Fritz was indeed an Amsterdam-based firm active between 1841 and 1931. Paints were sampled from the external part of the tubes or in proximity of the caps. Consequently the paints were semi-hardened. A previous research involved the study of the artistic materials used by Claus&Fritz; in particular pigments were investigated in an extensive way [Laar M., 1997]. Although paints were not taken from the same tubes investigated previously, many useful indications about pigments, fillers and extenders can be extrapolated. In the current study GC-MS was performed on the paint samples: results are reported in Table 4.13. The main component of the Claus&Fritz paints appeared to be drying oils. All the chromatograms show the characteristic drying oil compounds (see the chromatogram of Figure 4.63 referring to the vermilion paint). The paints contained quite abundant oleic acid, suggesting a certain degree of unsaturation. Nevertheless, the presence of many oxidation products and difatty acids (such as azelaic acid 2C9) indicates that oxidation took place on paints. The P/S ratios for the paints vary from 1.1 and 1.9 possibly linked with the use of linseed oil, although other oils can’t be excluded. In some paints long-chain alkanes were found, likely associated to the presence of beeswax. Although it is known that the addition of stearates was patented in the1920s, ultramarine and cadmium yellow paint possibly contain some added metal soaps as suggested by the P/S and P/G ratios of the residues after extraction. Besides, previous studies outlined the presence of zinc, which was supposed to be linked to paint additives [Laar M., 1997].
121

Table 4. 13: GC-MS results from historical Claus&Fritz oil paints
GC-MS Sample P/S P/G A/P A/Sub other
Conclusions
Geelgroene Zinnober (Yellow Cinnabar) 1.9 0.2 1.8 8.1 - Possibly linseed oil
Vermiljoen (Vermilion) 1.9 0.1 2.3 7.8
High oleic acid content long-chain
alkanes
Possibly oxidised linseed oil with
beeswax
Geel oker (Yellow ochre) 1.8 0.1 - -
Very high oleic acid content
Possibly linseed oil
Cadmiumgeel Licht (Cadmium yellow
light)
1.6 0.9 (res)
0.1 0.8 (res) 7.9
Very high oleic content long-chain
alkanes
Possibly linseed oil, stearates and
beeswax
Ultramarijn (Ultramarine)
1.1 0.9 (res)
0.5 1.1 (res) 1.8 8.1 - Possibly linseed oil
and stearates
8 10 12 14 16 18 20 22 24 26 28 30Time (min)
10
20
30
40
50
60
70
80
90
100
Rel
ativ
e A
bund
ance
GlyGly Gly
C16
C19
C18:1
C18
2C102C8
2C9
Figure 4. 63: Total ion current chromatogram of historical Vermilion Claus&Fritz paint after
transesterification and GC-MS analysis
122

4.2.4 Haagsche Kunstschilderveven Fabriek (HKF), The Netherlands HKF paint tubes dating 1940s were semi-hardened when sampled. They were analysed by XRF and GC-MS. Results are displayed in Table 4.14. The paints were identified as containing oil media, as it is possible to see in the chromatograms of Figure 4.66-4.67. In some cases, high oleic acid amount was recorded as the samples were not completely dried. The P/S ratio varied from 9 of the emerald green paint to 1.2 of gold ochre and cobalt violet. It is likely that the high P/S ratio refers to the use of cottonseed oil, though a series of long-chain alkanes were identified in emerald green paint maybe referring to the presence of natural waxes (beeswax). The other paints have P/S values probably associated to the use of linseed oil (1.2-1.7), since any special fatty acid was found. The P/S and P/G ratios after extraction were different from those from the entire samples: this could be an indication of the presence of added stearates. The A/P ratios are quite high, reflecting a high degree of oxidation. A good example of the influence of the pigments on drying is provided by the presence of cobalt in the violet paint, whose A/P ratio is 8.1. The ratios of azelaic-to suberic acid for all the HKF paints are approximately 7, which indicates that during oil processing no heat-treatments took place. Paints were found to contain barium sulphate and calcium carbonate, probably as fillers and whiteners in the oil paints.
Table 4. 14: XRF and GC-MS results from historical HKS oil paints
GC-MS conclusions Sample XRF
P/S A/P P/G A/Sub other
Smaragd groen
(Emerald Green)
Al, Ca, S 9 1.2 (res) 3 0.2
1.1 (res) 7 Phtalo blue
Alkanes
Possibly organic green in oil (cottonseed oil?) and
beeswax Indication of aluminium
stearates
Goud oker (Gold ochre)
Al, Si, S, K, Ca, Ba,
Fe
1.2 0.8 (res) 5 0.1
0.9 (res) 7.1 -
Possibly yellow ochre with barium sulphate and calcium carbonate in
linseed oil Indication of aluminium
stearates
Cobalt Violet Al, P, Ca, Co 1.2 8.1 0.1 7.3 - Possibly cobalt violet
phosphate in linseed oil
Monastraal Blauw
Al, Si, S, Ca (Ti),
(Cr), (Fe)
1.5 0.7 (res) 7 0.3
2.1 (res) 7.5
Phtalo Blue Very high
oleic acid content
Possibly organic blue in linseed oil
Indication of aluminium stearates
Chrome Groen (Chrome Green)
Al, S, Ca, Ba, Cr 1.7 1.9 0.1 6.9
Very high
oleic acid content
Possibly chrome green with barium sulphate and
calcium carbonate in linseed oil
123

0 2 4 6 8 100x-ray energy (keV)
Tube Voltage: 8.0 kV current: 15.0 uA
Al
SCa
Ba
Ba
Cr
Cr
Figure 4. 64: XRF spectrum of Chrome green HKF paint
0 2 4 6 80x-ray energy (keV)
Tube Voltage: 8.0 kV current: 15.0 uA
AlSi S
KCa
Ba
Ba
Fe
Fe
Figure 4. 65: XRF spectrum of Gold Ochre HKF paint
10 12 14 16 18 20 22 24 26Time (min)
0
10
20
30
40
50
60
70
80
90
100
Rel
ativ
e A
bund
ance
Oxo OxoGly Gly GlyGly Gly Gly C192C102C8
C18:1
C18
C16
2C9
Figure 4. 66: Total ion current chromatogram of historical Cobalt blue HKF paint after
transesterification and GC-MS analysis
124

6 7 8 9 10 11 12 13 14 15 16 17Time (min)
0
10
20
30
40
50
60
70
80
90
100R
elat
ive
Abu
ndan
ce
Oxo OxoGlyC14
C12Gly Gly
Gly
GlyGly
Gly
C18:1
C18
C16
2C102C8
2C9
Figure 4. 67: Total ion current chromatogram of historical Chrome green HKF paint after
transesterification and GC-MS analysis 4.2.5 Gimborn, The Netherlands Two Gimborn paints were sampled and analysed by XRF, FT-IR and GC-MS. Results are reported in Table 4.15. The paints both contain organic dyestuff and possibly barium sulphate and calcium carbonate added to the paint as extenders and/or whiteners Furthermore, the paints were both identified as containing oil binding media. The chromatogram of Figure 4.68 refers to the red paint: glycerol derivatives, dicarboxylic (such as suberic 2C8, azelaic 2C9 and sebacic acid 2C10), saturated (such as lauric C12, myristic C14, palmitic C16, stearic C18) and unsaturated fatty (such as oleic C18:1) acids were detected. Nevertheless, the binders appeared to be different. The red paint contains possibly linseed oil, as suggested by the P/S ratio of 1.9; however, the analysis of the residue suggests the presence of metal stearates. The blue paint contains also beeswax: this could explain the P/S of 8.5, although the use of cottonseed oil or other oils with high P/S ratios can’t be excluded.
125

Table 4. 15: XRF, FT-IR and GC-MS results from Gimborn Paints
GC-MS Sample XRF FT-IR
P/S A/P P/G A/Sub other conclusions
Rood 07 (Red 07)
Al, S, Ca, Ba
Oil, barium
sulphate, carbonat
es
1.9 1(res) 3.5 0.2
0.8 (res) 6.6
High oleic acid
content Alkanes
Possibly organic red (PR3-red naphthalene) with barium sulphate
and calcium carbonate in oil (possibly linseed) Indication of addition
of aluminium stearates and beeswax
Ijsblauw (Ice blue)
S, Ca, Ba
Oil, barium
sulphate, carbonat
es
8.5 3.6 0.3 7.1 Alkanes
Possibly organic blue with barium sulphate
and calcium carbonate in oil (cottonseed oil?)
and beeswax
6 7 8 9 10 11 12 13 14 15 16 17 18 19 20Time (min)
10
20
30
40
50
60
70
80
90
100
Rel
ativ
e A
bund
ance
PR3C12 C14GlyGlyGly
GlyGlyGly
C19
C18:1
C18
C16
2C102C8
2C9
Figure 4. 68: Total ion current chromatogram of historical Rood7 HKF paint after
transesterification and GC-MS analysis
126

4.2.6 Winsor&Newton (W&N), UK The sketches from W&N dating 1964-65 were part of the production process to check whether the paints were correct or not. The paints were applied on canvas and let to dry: they naturally aged. At the moment of being analysed, the films were dried and hard. These films were analysed by GC-MS and results expressed as molar ratios are visible in Table 4.16. The paints contained the typical drying oil compounds: glycerol derivatives, dicarboxylic and saturated fatty acids were detected. Unsaturated fatty acids (such as oleic acid) were found in some samples, as well as a high content of glycerol. All paints showed unusually high content of diacids. Azelaic acid, in particular, is predominant in all the chromatograms. The resulting A/P ratios, in fact, are very elevated. The reason of this high oxidation condition is not clear: maybe it is due to the storage conditions, as the painted layers were allowed to dry 30 days and then closed in a “dark” room; furthermore, these paints show a rather high water-sensitivity [Burnstock A., 2010]. It is possibly associated also with the use of zirconium- and cobalt- driers which were detected by EDX analysis [Burnstock A., 2010]. The influence of pigments is however outlined by the A/P ratios: the values, in fact, are higher for oils containing metal catalysts such as cobalt (in cobalt blue) and manganese (in raw and burnt Sienna).
Table 4. 16: GC-MS results from W&N 1964-65 oil paints
GC-MS Sample P/S P/G A/P A/Sub Other
Conclusions
Titanium White 3.9 0.8 (res) 0.1 11.5 6.7
High oleic acid and glycerol
content, oxidation products
Possibly poppy seed/safflower oil and
added stearates
Burnt Sienna 3.4 0.9 (res) 0.4 14.3 11.4
Arachidic acid, oxidation products
Possibly poppy seed/safflower oil and
added stearates Raw Sienna 1.8 0.8 11.2 15 Oxidation
products Possibly linseed oil
Flake White 3.4 0.1 2.4 9.3
High oleic acid content, oxidation products
Possibly poppy seed/safflower oil
Ultramarine Blue 5.9 0.4 6.4 6.8
High glycerol content, oxidation products
Possibly poppy seed oil
Cobalt Blue 9.1 0.5 15.2 13.3 Oxidation products Possibly cottonseed oil
Prussian Blue 2.4 0.2 3.9 9.5
High oleic acid and glycerol
content, Arachidic acid,
oxidation products
Possibly safflower oil
127
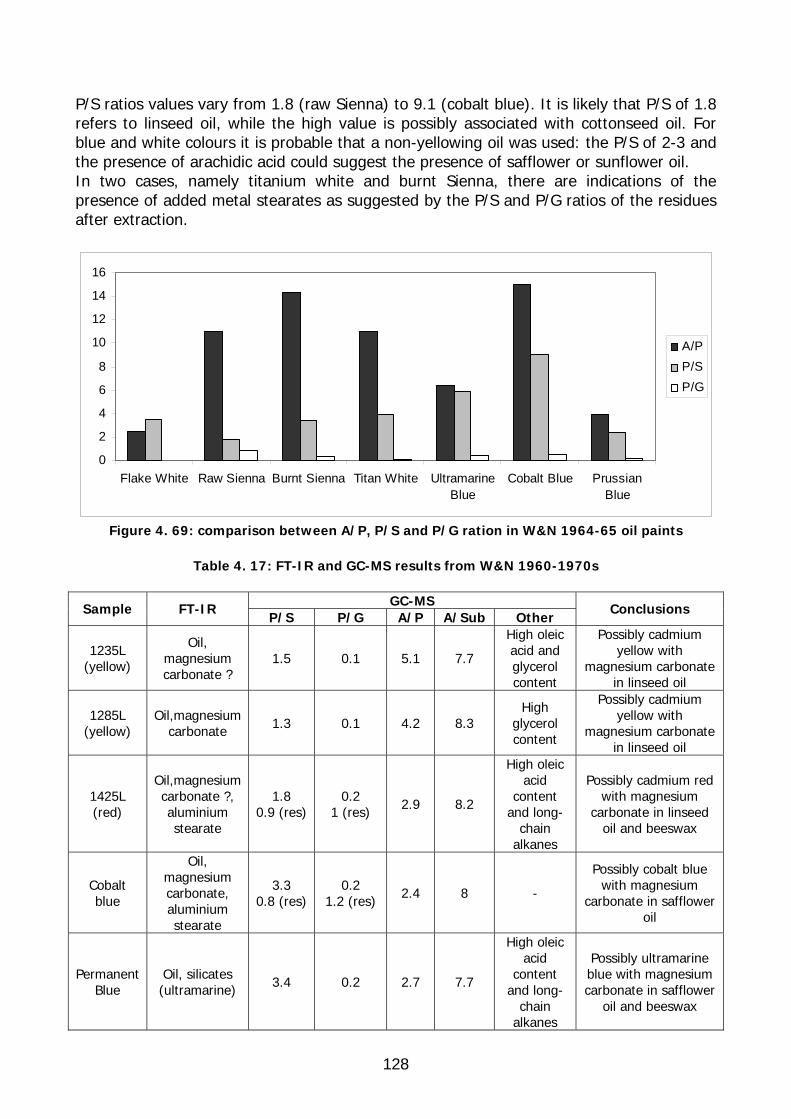
P/S ratios values vary from 1.8 (raw Sienna) to 9.1 (cobalt blue). It is likely that P/S of 1.8 refers to linseed oil, while the high value is possibly associated with cottonseed oil. For blue and white colours it is probable that a non-yellowing oil was used: the P/S of 2-3 and the presence of arachidic acid could suggest the presence of safflower or sunflower oil. In two cases, namely titanium white and burnt Sienna, there are indications of the presence of added metal stearates as suggested by the P/S and P/G ratios of the residues after extraction.
0
2
4
6
8
10
12
14
16
Flake White Raw Sienna Burnt Sienna Titan White UltramarineBlue
Cobalt Blue PrussianBlue
A/PP/SP/G
Figure 4. 69: comparison between A/P, P/S and P/G ration in W&N 1964-65 oil paints
Table 4. 17: FT-IR and GC-MS results from W&N 1960-1970s
GC-MS Sample FT-IR
P/S P/G A/P A/Sub Other Conclusions
1235L (yellow)
Oil, magnesium carbonate ?
1.5 0.1 5.1 7.7
High oleic acid and glycerol content
Possibly cadmium yellow with
magnesium carbonate in linseed oil
1285L (yellow)
Oil,magnesium carbonate 1.3 0.1 4.2 8.3
High glycerol content
Possibly cadmium yellow with
magnesium carbonate in linseed oil
1425L (red)
Oil,magnesium carbonate ?, aluminium stearate
1.8 0.9 (res)
0.2 1 (res) 2.9 8.2
High oleic acid
content and long-
chain alkanes
Possibly cadmium red with magnesium
carbonate in linseed oil and beeswax
Cobalt blue
Oil, magnesium carbonate, aluminium stearate
3.3 0.8 (res)
0.2 1.2 (res) 2.4 8 -
Possibly cobalt blue with magnesium
carbonate in safflower oil
Permanent Blue
Oil, silicates (ultramarine) 3.4 0.2 2.7 7.7
High oleic acid
content and long-
chain alkanes
Possibly ultramarine blue with magnesium carbonate in safflower
oil and beeswax
128

71
779388
3
1094
116012
361320
1417
1464
1480
1606
171
317
33
2852
2922
3390
W&N_red1425L
40
60
80%
T
648
68172477
0
795
954
104
510
9011
66
1320
1402
145
51612
170
917
35
2855
2925
3403
W&N_yellow1235L
80
85
90
95
100
%T
71
7789
889
110
0
1161
130
013
7814
12146016
12
1708
173
2
2852
2919
336
9
W&N_yellow1285L
40
60
80
%T
1000 1500 2000 2500 3000 3500 Wavenumbers (cm-1)
Figure 4. 70: FT-IR spectra of W&N Red 1425L (above), Yellow 1235L (centre) and Yellow
1285L (below) oil paints
641
851
883
980
1100
1165
123713
23
141714
80
1599
170
817
382854
2925
3427
3647
W&N_CobaltBlue
0
20
40
60
80
%T
653
6 72
5 82
6
992
109
611
64
13221375
141
214
60 160
9
1707
173
2
2852
2921
3398
W&N_PermanentBlue
30
40
50
60
70
80
90
%T
1000 1500 2000 2500 3000 3500 Wavenumbers (cm-1)
Figure 4. 71 : FT-IR spectra of W&N Cobalt blue (above) and Permanent Blue (below) oil paints
129

Other W&N paints from the 1960-1970s were applied on melinex and let to dry. Results (Table 4.17) show that they contain drying oil binders. The FT-IR spectra of Figure 4.70-4.71 illustrate the typical absorption peaks of lipidic media, as well as the presence of magnesium carbonate. This material was probably added as extender/filler in the pigment: it was found also in a previous research on W&N paints from the 1960s and it was supposed to be one of the causes of water-sensitivity in unvarnished painting [Wijnberg L., 2007; Burnstock A., 2008; Mills L., 2008]. By GC-MS the characteristic drying oil components and in some cases beeswax was detected as well: an example is provided in the chromatogram of Figure 4.72. Aluminium stearate was detected by FT-IR and GC-MS in the red and cobalt blue paints: the indication is given by the P/S and P/G ratios which are influenced by the addition of dispersion agents as seen Chapter 4.1.
10 12 14 16 18 20 22 24 26 28 30 32 34Time (min)
10
20
30
40
50
60
70
80
90
100
Rel
ativ
e A
bund
ance
C14C12Oxo
Oxo
OxoOxo
C20alkanes
alkanes
C19C18:1
C18
C16
2C102C8
2C9
GlyGly Gly
GlyGly
Gly
Figure 4. 72: Total ion current chromatogram of RED 1425L W&N paint after transesterification
and GC-MS analysis Ultramarine blue, cadmium yellow and cadmium red were purchased in 2008 and applied on melinex [Mills L., 2008]. These paints belong to the series Winsor&Newton Artists’ Oil colours, which is described in the website in this way: “Every Winsor&Newton Artists’ Oil colours is individually formulated to enhance each pigment’s natural characteristic and ensure stability of colour. By exercising maximum quality control throughout all stages of manufactu e, selecting the most suitable drying oil and methods of pigment dispersion, the unique individual properties of each colour are preserved”.
r
The oil paints, as seen for those from the 1960s, contain magnesium carbonate and/or barium sulphate as extenders and some of them possibly contain aluminium stearates as indicating by the presence of aluminium, the P/S and P/G ratios of the residues after extraction. The P/S ratios of cadmium yellow and chrome green could be associated to the use of linseed oil, while for ultramarine paint (Figure 4.73) a non-yellowing was possibly used.
130

Table 4. 18: FT-IR, XRF, TG-DSC and GC-MS results from 2008 W&N oil paints
GC-MS Sample FT-IR XRF TG-DSC P/S P/G A/P A/Sub Other
Conclusions
Ultramarine blue (263)
Oil, ultramarine magnesium carbonate
Al, Si 2.5 1(res)
0.3 1.2 (res) 1.5 5.6
High oleic acid and glycerol content
Arachidic and behenic
acids
Possibly ultramarine with
magnesium carbonate in safflower or sunflower oil
Cadmium yellow (108)
Oil, barium sulphate,
magnesium carbonate
Al, S, Ba,
Cd, Zn - 1.3
0.8 (res) 0.1
0.8 (res) 4.1 7.2
High oleic acid and glycerol content
Possibly cadmium yellow with
barium sulphate and magnesium
carbonate in linseed oil
Chrome green (459)
Oil, Magnesium carbonate
Al, Cr
DSC: Exothermic peaks at 151, 409, 508 °C
TG: 63% weight loss
1.8 0.2 2.3 7.5
High oleic acid and glycerol content
Possibly chrome green with magnesium carbonate in linseed oil
6 8 10 12 14 16 18 20Time (min)
0
10
20
30
40
50
60
70
80
90
100
Rel
ativ
e A
bund
ance
OxoOxo OxoC22C20
EpoxyC18
Gly
Gly
GlyGly
Gly
Gly
Gly
C19
C18:1
C18
C16
C9
C14C12
2C10
2C8
2C9
Figure 4. 73: Total ion current chromatogram of ultramarine W&N oil paint after
transesterification and GC-MS analysis
131

100 200 300 400 500-3
-2
-1
0
1
2
151°C
409°C
508°C
60
70
80
90
100
Temperature °C
Hea
t Flo
w (W
/g) W
eight %
exo
Figure 4. 74: TG-DSC thermogram of Chrome green W&N oil paint
4.2.7 Maimeri, Italy The paints from Maimeri were all painted out on glass slides and let to dry 2 years before the analyses. The resulting films were dried and hard when analyses were performed. Maimeri currently produces four series of oil colours: Maimeri Puro, Artisti, Classico and Classico Acqua. Two series were studied in this series: the series Artisti (purchased as extra fine artists’ oil colours) and the one called Classico (fine oil colours). Results from FT-IR, TG-DSC and GC-MS are reported in table 4.19. Maimeri paints were identified as having lipidic binding media. Figures 4.80-81 depict the chromatograms of the titanium white and chrome green paints: they show the presence of typical drying oil compounds: saturated, unsaturated, dicarboxylic acids and glycerol. For all the oil paints, the P/S ratios are included in the traditional range for linseed oil [Mills J. S., 1987]. Nevertheless, titanium white and the paints from the series Classico possibly contain stearates as indicated by the P/S and P/G ratios of the residues. For titanium white, moreover, the presence of aluminium stearates could be observed in the FT-IR spectrum (Figure 4.77, above). By FT-IR, in addition, it was possible to notice that the two series differ in the formulation, as calcium carbonate was detected in all the paints from the series Classico (see FT-IR spectra in Figure 4.78), while this whitener/extender was not present in the series Artisti (Figure 4.77). All the paints show a very high content of glycerol, partially due to the youth of the oil films.
132

Table 4. 19: FT-IR, TG-DSC and GC-MS results from Maimeri
GC-MS Sample FT-IR TG-DSC
P/S A/P P/G A/Sub Other Conclusions
Titan White Artisti (018)
Oil, stearates? - 1.1
0.8 (res) 3.9 1.1 5.1 (res) 6.5
High glycerol content
Possibly titanium white in linseed
oil with stearates
Cadmium red Artisti
(228)
Oil, silicates ? - 1.6
1 (res) 3.5 0.4 1.9 (res) 6.8
High glycerol content
Possibly red in linseed oil with
stearates Raw
umber Artist (492)i
Oil - 1.6 5.1 0.1 6.9 High
glycerol content
Possibly linseed oil
Mars Red Classico (248)
Oil, calcium
carbonate, silicates?
DSC: Exothermic peaks at
142, 425°C TG: 58%
weight loss
1.8 - - - High
glycerol content
Possibly red with calcium
carbonate in linseed oil
Cadmium yellow
Classico (084)
Oil, calcium
carbonate
DSC: Exothermic peaks at 156, 383,
454, 510°C TG: 53%
weight loss
1.3 0.9 (res) 3.5 0.1
1.2(res) 7.1 High
glycerol content
Possibly cadmium yellow with
calcium carbonate in
linseed oil with stearates
Chrome Oxide Green
Classico (336)
Oil,calcium carbonate
DSC: Exothermic peaks at 153, 410,
444,509 °C TG: 64%
weight loss
1.1 0.8 (res) 4.1 0.2
1 (res) 6.2 High
glycerol content
Possibly chrome green with
calcium carbonate in
linseed oil with stearates
Prussian Blue
Classico (402)
Oil, Prussian
blue, calcium
carbonate
1.4 0.9 (res) 2.3 0.1
5.3 (res) 6.6 High
glycerol content
Possibly Prussian blue with calcium
carbonate in linseed oil with
stearates
133

100 200 300 400 500
-4
-3
-2
-1
0
1
2
383°CH
eat F
low
(W/g
)
Temperature °C
Weight %
exo
156°C
454°C
510°C 50
60
70
80
90
100
110
Figure 4. 75: TG-DSC thermogram of Cadmium yellow Maimeri oil paint
100 200 300 400 500-8
-6
-4
-2
0
2
4
6
Hea
t Flo
w (W
/g)
Weight %
Temperature °C
exo
151°C
425°C 50
60
70
80
90
100
110
Figure 4. 76: TG-DSC thermogram of Mars red Maimeri oil paint
134

101
5
1093
1163
1243
1317
1377
141
4 1
456
153915
79
1737
2850
2919
3308
Titanium White
0
20
40
60
80
100
%T
617
787
89
7
102311
63 122
71377
1414
145
6
1635
1732
2854
2925 3
299
Raw Umber
0
20
40
60
80
100
%T
721
88
0
1016
1153
1376
1414
1457
1624
1653
1733
2853
2923
3384
Red Cadmium
0
20
40
60
80
100
%T
1000 1500 2000 2500 3000 3500 4000 Wavenumbers (cm-1)
Figure 4. 77: comparison between FT-IR spectra of Titanium white, Raw umber and Red cadmium oil paints from the series Artisti Maimeri
712
872
1038 1
165
1411
1611
1736
2083
2851
2919
337
3
Prussian Blue
40
60
80
%T
712
792
871
103711
45
1409
1629
173828
5329
22
3420
Cadmium Yellow
0
20
40
60
80
%T
622
712
783
872
103911
56
1409
1626
1709
173728
5029
19
3424
Chrome Green
20
40
60
80
%T
1000 1500 2000 2500 3000 3500 4000 Wavenumbers (cm-1)
Figure 4. 78: comparison between FT-IR spectra of Prussian blue, Cadmium yellow and Chrome green oil paints from the series Classico Maimeri
135

6 7 8 9 10 11 12 13 14 15 16 17 18 19Time (min)
0
10
20
30
40
50
60
70
80
90
100R
elat
ive
Abu
ndan
ce
OxoOxo
OxoC19 Oxo
GlyGly
GlyGlyGly
2C9
2C82C10
C16
C18
C18:1C12
C14
Figure 4. 79: Total ion current chromatogram of Titanium white Maimeri oil paint after
transesterification and GC-MS analysis
6 7 8 9 10 11 12 13 14 15 16 17 18 19Time (min)
0
10
20
30
40
50
60
70
80
90
100
Rel
ativ
e A
bund
ance
C14C12Oxo
Oxo OxoOxo
GlyGly Gly GlyGly
Gly Gly
C18:1
2C9
2C8
2C10
C16C18
C19
Figure 4. 80: Total ion current chromatogram of Chrome green Maimeri oil paint after
transesterification and GC-MS analysis
136

4.2.8 Le Franc, France Le Franc is a French manufacturer which currently produces three series of oil paints: Le Franc oil, Fine oil and Louvre oil. The series Louvre oil colours is described in their website as “a perfect compromise for first attempts at oil painting”. Orange PY65 and Yellow PY74 Louvre paints were painted out on glass slides and allowed to dry for few years before the analysis. At the moment of the GC-MS analysis, films were dried. It was noticed that in some oil tubes a phase-separation between oil-like material and the main medium: the exudate from Sap green (PY42/PR101/PG7) was analysed by GC-MS. Results are reported in Table The paints were identified as oil paints. The chromatograms of Figure 4.81-8.82 (referring to the yellow paint and the exudate respectively) show the presence of characteristic drying oil components. In particular, the exudate was identified possibly as fresh linseed oil, as the P/S ratio is 1.6 and any special fatty acid was found in the paint. The P/S ratio for the orange paint 3.2: this could be associated to the use of poppy seed oil (as traditionally reported), but the significant presence of arachidic acid (C20) and behenic acid(C22) may be related to the use of sunflower and/or safflower oil. In these paints, moreover, 12-hydroxy stearic acid was detected: it is likely that castor wax was added to the oil paints.
Table 4. 20: GC-MS results from Le Franc Louvre oil paints
Name GC-MS conclusions P/S A/P P/G A/Sub other
Sap Green Louvre
(PY42/PR101/PG7) 1.6 1.5 0.1 7.9- very high oleic
acid content Possibly linseed oil as
binder (still fresh)
Orange Louvre
(PY65/PO34) 3.2 1.8 0.2 8.1
Arachidic and behenic acid 12-hydroxy stearic acid
Poppy oil/safflower and/or sunflower oil and castor
wax
Yellow Louvre (PY74)
1.7 2.3 0.2 7.7
12-hydroxy stearic acid
high glycerol
content
Possibly linseed oil and castor wax
137

6 8 10 12 14 16 18 20Time (min)
0
10
20
30
40
50
60
70
80
90
100R
elat
ive
Abu
ndan
ce
OxoOxo OxoC19
12hydC18GlyGly Gly Gly
2C9
2C82C10
C18
C16
C18:1Gly
Figure 4. 81: Total ion current chromatogram of Yellow LeFranc oil paint after
transesterification and GC-MS analysis
8 10 12 14 16 18 20 22 24 26 28Time (min)
0
10
20
30
40
50
60
70
80
90
100
Rel
ativ
e A
bund
ance
Oxo OxoOxoC19Gly Gly GlyGly
Gly
C18:1
C18
C16
2C102C8
2C9
Figure 4. 82: Total ion current chromatogram of the exudate from the Sap green LeFranc oil
paint after transesterification and GC-MS analysis
138

4.3 MULTIVARIATE STATISTICAL ANALYSIS Results coming from performed analyses in chapter 4.1 and 4.2 show a huge complexity in data. Even if the analysed samples were all from oil paints, several differences were noticed in terms of formulation: binding materials, pigments and additives were extremely variable in nature and concentration. Elemental and inorganic analyses provided essential information of the nature of pigments, which have an important role in the drying processes occurring to oil films. Organic analysis by GC-MS helped in characterising oil binders by referring to specific evaluation parameters. It was underlined that identifying and classifying different kinds of artistic oils according only to the traditional P/S ratios is too restrictive, as well the employ of the only A/P ratio to define the degree of oxidation in oil films. Modern manufactured oil paints resulted, in fact, to contain other sources of fatty acids (like metal soaps and castor wax) which could interfere in the definition and identification of binding media based on traditional evaluation parameters. GC-MS results after extraction and transesterification from reconstructions and industrial oil samples were subjected to multivariate statistical analyses, such as cluster analysis and principal components analysis (PCA). These chemometric techniques were applied on a data matrix, which described the analysed system in term of n objects · p variables, after autoscaling. The objects consisted in samples from laboratory-prepared oil films and manufactured oil paints; the selected variables were the characteristic molar ratios P/S, A/P, A/S P/G, A/G, S/G, D/P, D/S, D/G and the concentration (expressed as ug/mg) of glycerol (Gly) and several unsaturated fatty acid (C9, C12 and C14). (see Chapter 3.4). The aim was to compare large data sets composed of several reconstruction oil samples of known composition with samples from commercial production to solve problems of clustering and classifying. 4.3.1 Cluster Analysis The results of cluster analysis are depicted in Figure 4.83. In the tree-diagram, obtained with Ward’s method and Euclidean distances, it is possible to individuate at certain distance two big clusters which are outlined with red and blue circles. The red cluster is heterogeneous as it is composed of two sub-clusters. The objects of the red cluster are all characterised in particular by: P/S ratios lower than 1; A/P and A/S ratios lower than 1; P/G and S/G ratios higher than 1. This group is composed of oil samples both from laboratory-prepared films and commercial paints: among the reconstruction paints, there are all the films which contain from 5 to 30% of aluminium and zinc soaps added in the paint formulation. As seen in Chapter 4.1, additives-containing oil films generally present molar ratios whose values are dissimilar from those of unpigmented and pigmented oil films. On the other hand, the big blue cluster contains objects characterised by: P/S ratios included between 1,2 and 7; A/P and A/S ratios much higher than 1; P/G and S/G ratios much lower than 1. As for the previous group, these objects are both from reconstructions and manufactured paints. Within the blue cluster, which is more homogeneous, two sub-groups were defined, which are dissimilar for the P/S ratio values: the green subgroup contains samples whose P/S ratios are lower than 2, while in the turquoise subgroup all the samples have P/S ratios higher than 2.
139

Tree Diagram for 54 CasesWard`s method
Euclidean distances
C_1
2C
_46
C_4
5C
_33
C_3
1C
_30
C_4
1C
_39
C_3
5C
_44
C_3
8C
_32
C_2
9C
_36
C_1
1C
_10
C_8
C_9
C_7
C_6
C_5
C_2
5C
_24
C_4
C_1
8C
_3C
_2C
_43
C_2
0C
_19
C_1
C_2
3C
_17
C_4
2C
_37
C_2
2C
_16
C_1
5C
_48
C_5
3C
_47
C_5
4C
_52
C_5
0C
_49
C_2
8C
_21
C_1
4C
_13
C_5
1C
_27
C_2
6C
_34
C_4
0
0
5
10
15
20
25
30
35
40
Link
age
Dis
tanc
e
Figure 4. 83: result of cluster analysis: in the tree-diagram two main groups are identified and graphically illustrated with the red and the blue circles
4.3.2 Principal components analysis The score plot reported in figure 4.85 illustrates the position of the objects (samples) as the coordinates on the space defined by the first two principal components. The number of meaningful principal components was evaluated by the total cumulative variance. It has to be said that the first two components account for 50% of the total variance of the data. The low variance showed an intermediate data correlation. Nevertheless, the information each variable provide is fundamental in the description of samples: as shown in the previous chapters, taking into consideration only some of the evaluation parameters is not correct to determine complex and heterogeneous paint formulations. The loading plot depicted in Figure 4.84 describes the distribution of the variables on the first two PC (pc1 vs pc2). It is also useful in understanding the weights of the variables in the PC space:
- P/G and S/G have positive and high values both in the first and the second component;
- P/S, A/S, A/G, D/S and the concentration of lauric acid [C12] have positive and high values in the second component, but negative in the first one;
- D/G, A/P, D/P and the concentration of glycerol have negative values in both the PCs;
140

- the concentration of myristic acid [C14] has positive values in the first component, but negative in the second one.
Projection of the variables on the factor-plane ( 1 x 2)
Ac
gly
C9 C12
C14
P/S
A/P
A/S
P/G
A/G S/G
D/G
2C9/2C8
D/P
D/S
-1,0 -0,5 0,0 0,5 1,0
Factor 1 : 31,00%
-1,0
-0,5
0,0
0,5
1,0
Fact
or 2
: 17
,94%
Figure 4. 84: results of principal components analysis: loading plot
Comparing the score plot and the loading plot, it is possible to notice that basically the results are analogous to those already seen from cluster analysis. In the score plot two big groups were distinguished (and circled with red and blue colours). The distinction is mostly done by the fist principal component, although the second one has however a crucial role in discriminating two sub-groups within the blue group. Conclusions are comparable outlined by cluster analysis. The red group, in particular, includes samples whose P/S ratios are lower than 1, A/P and A/S ratios lower than 1 and P/G and S/G ratios much higher than 1. The blue group contains many objects which are all characterised by P/S, A/P and A/S ratios higher than 1 and P/G and S/G ratios much lower than 1. Within this big group, two sub-groups are distinguished by the values in P/S values, as seen for clustering.
141

Projection of the cases on the factor-plane ( 1 x 2)Cases with sum of cosine square >= 0,00
Active
1
2 3 4
5 6
7
8 9
10 11
12 13 14
15 16
17
18 19 20 21
22
23
24 25 26 27 28
29
30
31
32 33
34
35
36
37
38
39
40
41
42
43
44
45
46 47 48 49 50 51 52
53 54
-16 -14 -12 -10 -8 -6 -4 -2 0 2 4 6 8 10
Factor 1: 30,45%
-5
-4
-3
-2
-1
0
1
2
3
4
5
6
Fact
or 2
: 16,
88%
Figure 4.85: results of principal components analysis: score plot
By clustering and PCA, it was possible to differentiate between two main groups whose objects are similar. One includes samples from laboratory-prepared oil films and from commercial paints which contain more than 5% of stearates added in the paint formulation. The other group contains samples whose formulation differs in particular in the presence of very low or the absence of stearates. The additional distinction in two sub-groups, however, allows to differentiate between samples with P/S ratios varying from 1.2 to 2 (close to linseed oil traditional values) and those varying from 2 to 7. Several drying, semi-drying and non-drying oils used by modern manufactures may belong to this P/S range. As noticed in previous chapters, the identification by simply evaluating the P/S ratio requires particular care, in particular because many oils have similar P/S values but many variations in terms of drying behaviours.
142

4.4 SUMMARY The investigations performed on unpigmented, pigmented and additive-containing oil films provided useful information in the understanding of the drying and curing processes occurring in oil paints. Furthermore they gave indications of the influence of pigments and modern additives. FT-IR and TG-DSC results provided comparable and complementary information on oxidative and thermal stability for laboratory-prepared oil films. GC-MS performed with the developed method helped to obtain a better knowledge of oils and additives used in modern formulations. In particular, it was demonstrated the importance of taking into consideration the presence (or absence) of metal stearates when calculating molar ratios. The evaluating parameters in fact can be strongly influenced by added metal soaps as they interfere with the determination of the amount of stearic and palmitic acids deriving from oils. Commercial oil paints from historical and modern collections have very generic labels which do not allow to know the exact composition of oil paints. Several brands were studied using FT-IR, TG-DSC, XRF and GC-MS. Although differences in the rate of drying (some paints were liquid, some semi-hardened, some dried), some considerations can be done about their formulations. The use of lipidic additives (metal stearates, castor wax and beeswax), fillers and extenders appeared to be quite common in all the manufactured oils. Furthermore some similarities between additive-containing oil film and manufactured films were noticed thanks to the multivariate statistical analysis. Chemometric methods were applied on a matrix, where objects consisted in samples from laboratory-prepared oil films and commercial oil paints, while variables were the characteristic molar ratios P/S, A/P, A/S P/G, A/G, S/G, D/P, D/S, D/G and the concentration (expressed as ug/mg) of glycerol (Gly) and several unsaturated fatty acid. Both cluster analysis and PCA allowed to identified two groups, one containing samples with P/S ratios lower than 1and high P/G and S/G much higher than 1 (likely indicating the presence of added stearates) and the other containing samples with P/S ratios higher than 1 and P/G ratios much lower than 1. This distinction may be useful in the identification of the kind of oil and additives present in commercial oil paints.
143

CHAPTER 5
CASE STUDIES
Abstract
t
In this chapter case s udies are presented. Samples were taken from oil paintings dating from the 1920s to the 1970s. They were analysed by using different analytical techniques,such as FT-IR, XRF, TG-DSC and GC-MS as described in the previous chapters.. The obtained results helped in knowing the constituent materials and in understanding of the state of conservation and the degradation phenomena. For each painting the most representative results are reported here. A particular relevance is given to the identification of binders and additives by using the GC-MS method designed for modern oil paints.
5.1 Introduction In order to widen the knowledge of artistic materials employed during the 20th century, real paintings were studied and the consequent results were compared with those coming from the analyses performed on reconstructed oil films and manufactured oil paints (presented in Chapter 4). The selection of paintings to be analysed was done in collaboration with conservators and restorers, according and focusing on degradation problems noticed during conservation treatments. Generally, the selected works of art showed physical and chemical behaviours and degradation typologies which are not related to traditional oil paintings. In particular, most of them exhibited a rather vulnerability of painted layers and an unexpected water-solvent sensitivity during cleaning operations [van den Berg K. J., 2008; Wijnberg L., 2007; Burnstock A., 2007; Ferriani B., 2009]. Samples were taken from selected areas, normally in proximity of losses and cracks. Although the destructive action of exporting pictorial fragments, it has already been mentioned that this sacrifice is one of the most advantageous tools in Conservation Science, as it allows the characterization of art production constituents (artist’s choice of media and palette), the determination of the state of conservation of art objects and the identification of degradation causes. Minute representative pictorial fragments were sampled without damaging the reading and the formal content of the work of art. Samples
144

were then analysed by FT-ATR-IR, XRF and GC-MS techniques: TG-DSC was not widely performed at this early stage of the study as the amount of samples were not always enough to carry out this destructive analyses. The list of case studies presented in this chapter is provided in Table 5.1.
Table 5.1: authors, names, dates and provenance of analysed paintings. # these paintings have been already part of a study to investigate water sensitivity during
cleaning operations
Author Name of the painting Year of production
Provenance (courtesy of)
Concetto spaziale. Notte d’amore a Venezia
(60 O 81) 1960
Concetto spaziale (62 O 66) 1962
Concetto spaziale (17 37/92) 1962
Concetto spaziale, La Fine di Dio (64 FD 5)
1964
Concetto spaziale, La Fine di Dio (63 FD 14)
1963
Lucio Fontana
Concetto spaziale (63 FD 23) 1963
Fondazione Lucio Fontana, Milano
(Barbara Ferriani S.r.l)
Jasper Johns Untitled 1964-65 # 1965
Karel Appel La grande Fleur de la nuit 1954
Willem De Kooning Rosy-Fingered Dawn at Louse Point # 1963
Stedelijk Museum Amsterdam
(Louise Wijnberg)
Salvador Dalì Landscape with Girl Skipping a Rope 1936
Museum Boijmans van Beuningen, Rotterdam
(Katrien Keune, Annalies Van Loon)
Isabel Lambert-Rawsthorne Male Baboon # c. 1950
Ethel Walker Models resting# c.1930
F. Breton Three Urchin Boys # c.1920
Courtrauld Institute of Art, London
(Aviva Burnstock)
All the paintings (except Three Urchin Boys) are unvarnished.
145

5.2 Lucio Fontana, Olii, Fine di Dio and Concetto Spaziale Lucio Fontana (Rosario di Santa Fé, Argentina 1899–Comabbio, Varese 1968) is considered one of the most important Italian artists of the 20th century. In 1927 the italo-argentinian artist moved to Milan, where he attended the Academy of Brera under the supervision of the sculptor Adolfo Wildt. After the Second World War he returned to Argentina, where he wrote the Manifesto Blanco in 1946 together with Argentinean artists and intellectuals. This manifesto, whose aim was to modernise art by introducing new and innovative materials, was at the bases of the foundation of the Spazialismo movement (also called Movimento Spaziale) in 1947 [Pasini R., 1995]. The name Spazialismo is an homage to the contemporaneous spatial explorations, which he related to the “artistic space”, the space where art and scientific and technological discoveries meet. In his spatial works of art, influenced by his sculpture formation, matter becomes energy and energy becomes part of the space [Pasini R., 1995]. In 1949 he started the series of paintings called Buchi (Holes): the canvas turned into a starry night, thanks to the provocative holes which allowed the sight to go inside and beyond the painting. In 1958 the series of Tagli (Cuts) was undertaken: cuts created a passage for light throughout the canvas, overcoming the limits between sculpture and painting. From 1960 Fontana worked on the Olii (Oils), followed in 1963 by the series labelled as Fine di Dio (The End of God). These paintings were characterised by an oval shape whose intent was to express the mystery and the cycle of life [Dorfles G., 1999; Crispolti E., 1974; Barbero L.M., 2006]. After experimenting different traditional and synthetic binding materials, by the end of the 1950s Fontana started his own research on oil, the classical paint medium [Ferriani B., 2009]. In this study, six of his oil paintings on canvas between 1960 and 1963 have been analysed. The composition of these paintings is quite similar: Fontana applied a monochromatic paint and, while the medium was drying he pierced, engraved and manipulated the paint which soaked in around the edges of the holes and leaked on the rear of the canvas; sometimes drawing or engraving on the surface, sometimes gluing shaped objects on the canvas, such as small pieces of coloured glass or sequins (lustrini). Fontana applied oil with thick impasto, by brush, fingers and spatula, to achieve a sculptural effect on the canvas [Ferriani B., 2009]. More particularly the series analysed belong to the series called Concetto Spaziale and Fine di Dio (oval paintings on canvas, monochrome with holes, cuts and sequins). Experimental Samples were provided thanks to the generosity of the Fondazione Lucio Fontana (Milan, Italy) and were collected by Barbara Ferriani, a private conservator (Milan, Italy). The pictorial fragments can be considered microsamples, taken from the back part or the edges of the paintings, some also containing the grounding layer of the canvas. They were composed of different layers of (monochromatic) paint and in some cases contained glasses or sequins. XRF, FT-IR and GC-MS were employed to study and identify the materials used by the artist and the possible degradation products, in order to help in defining the state of conservation of Fontana’s paintings.
146

Results The results of the analyses performed on Fontana’s paintings are discussed in detail, considering the different typologies of paints analysed. Concetto spaziale. Notte d’amore a Venezia (60 O 81), 1960 This painting on canvas was produced in 1960 and is part of the series called ConcettoSpaziale (Olii). The work of art is a monochromatic red-brown presenting holes, cuts and graffiti on the surface (Figure 5.1).
From an edge, it was possible to notice that the canvas has a white ground layer. The painted surface also partially allowed to see it, in correspondence to the holes and cuts. The red-brownish painted layer presented many wrinkled areas which, according to the conservator, were partially soft to the touch, fragile and very deformed [Ferriani B., 2010]. A sample from this painting was analysed, after separating and isolating the ground from the painted layer.
Figure 5. 1: Lucio Fontana, recto (left) and verso (right) of Concetto spaziale-Notte d’amore a
Venezia, 1960, Fondazione Lucio Fontana (60 0 81), 80 x 100 cm
The white ground layer is probably composed of lead white (2PbCO3·Pb(OH)2), as suggested by XRF results: other whitening materials were used, since traces of zinc (likely zinc oxide, ZnO), calcium (calcium carbonate, CaCO3) and barium (probably the correspondent sulphate, BaSO4) were also detected (Figure 5.2). The presence of prevalent lead-based ground is quite interesting as the extensive use of lead was forbidden from the early 1950s because of the health problems it could cause. This is the main reason why zinc and titanium white began to be more commonly employed, in particular for industrial primed canvases. The presence of a lead soap was observed at about 1530 cm-1 in FT-IR spectrum of Figure 5.3: it was likely the absorption of lead carboxylates formed as products after the reaction of the oil binder with lead pigment [van der Weerd J., 2005]. It is, in fact, known from previous studies that Fontana employed oil primed canvases [Ferriani B., Ploeger R., 2009]. The painted layer was analysed by FT-IR. The red-brown coloration of the paint is probably due to the presence of alizarin, an organic red dyestuff mainly composed of 1,2-dihydroxyanthraquinone. The quality of alizarin suggested the use of the natural dye, as shown thanks to the comparison with the reference FT-IR spectrum of natural alizarin (Figure 5.3).
147

0 5 10 15 200x-ray energy (keV)
Tube Voltage: 40.0 kV current: 2.2 uA
S
CaBa
Zn
Pb
Pb
Pb
Figure 5. 2: XRF spectrum of the ground layer from Lucio Fontana, Concetto spaziale. Notte d’amore a Venez a, 1960 i
653
667717
769
837
102
210
4210
9811
5212
6612
8613
2513
4813
6014
6415
2515
8816
3517
062854
2924
Fontana 60O81
0
20
40
60
80
100
%T
616
639
679
714
72777
8868
928
1021
1041
1069
1132
115912
0412
621290
1331
1377
1460
159016
371669
2853
2924
2954
Alizarin reference
0
20
40
60
80
100
%T
1000 1500 2000 2500 3000 3500 4000 Wavenumbers (cm-1)
Figure 5. 3: FT-IR spectra of the red sample from Lucio Fontana, Concetto spaziale. Notte d’amore a Venezia, 1960 (above) and the reference of natural alizarin (below)
148

The red-brown paint was identified after transesterification and GC-MS analysis as an oil paint. Figure 5.4 shows the resulting chromatogram, which presents all the typical peaks referring to an oil binder. The paint sample contains: several glycerol derivatives (labelled as Gly), monocarboxylic fatty acids (such as palmitic C16, stearic C18, arachidic C20, behenic C22), dicarboxylic fatty acids (such as suberic 2C8, azelaic 2C9 and sebacic 2C10) and unsaturated fatty acids (such as oleic C18:1 and linoleic C18:2) as methyl esters. In addition, the presence of ricinoleic acid as methyl ricinoleate (peak # in Figure 5.4; mass spectrum in Figure 5.5) and methyl methoxy ricinoleate (peak § in Figure 5.4; mass spectrum in Figure 5.6) was detected as well. This monounsaturated C18 fatty acid is the bio-marker for the identification of castor oil. Castor oil is a vegetable oil obtained from castor seeds. It is considered a slow/non-drying oil as it is composed for 90% of ricinoleic acid and of oleic and linoleic acid for less than 8%. Castor oil and its derivatives have many applications as industrial, cosmetic and medical ingredient; it is quite commonly added in the production of modern paints. Castor oil, if applied in very thin layers, can dry slowly, but it does not turn yellow: it would be an excellent painting medium, but it is too viscous and remains wet for a long time [Doerner M., 1984]. This is the reason why castor oil is usually mixed with better drying oils, such as linseed oil [Mayer R., 1965]. It is likely that the red paint from Fontana’s painting contained mainly castor oil, as suggested by the palmitic-to stearic acid (P/S) ratio: the value, in fact, is 1, in agreement with the presence of this non-drying oil, which contains 1-1.5% of C16 and C18. The P/S ratio is probably not influenced by added metal soaps: it seems that they are not present, also analysing by GC-MS the paint after extraction. The minor presence of lauric (C12) and myristic (C14) acids and the presence of unsaturated fatty acids strengthen the theory of the predominant use of castor oil as the binder. After 50 years the painting appears not completely dry. However, the azelaic-to palmitic ratio is 3.2, suggesting that the pictorial film is oxidised: other oxidation products were detected as well (Figure 5.7). The use of castor oil may be the explanation of the degradation signs evident in the painted layers. The wrinkles formed on the surface might be linked to the presence of castor oil spread on a thick, bodied layer, typical of Fontana’s aim to bring painting closer to sculpture. Over time, the evaporation of volatile compounds (such as alcohols, aldehydes and ketones) from the oxidative cross-linking reactions occurred, leading to weight losses. As the drying speed is slowed by the presence of non-drying oil, it is possible that the evaporation rate also occurred slowly, causing the formation of more visible and deep wrinkles. As seen in Chapter 4.1, the weight losses for linseed oil during drying processes are less marked than for castor oil, because the first contains higher amount of linolenic acid and polymerises with less evident volatile formation. It is not clear whether Fontana added castor oil by himself or that he bought a linseed-castor oil mixed paint already made. Unfortunately, very little is known about the brands of the materials he used, except the evidence that he used to buy commercial paints in local hardware suppliers [Ferriani B., 2010]. Fontana, however, wanted his oil paintings to dry fast: this seems quite in contradiction with a conscious use of castor oil.
149

7 8 9 10 11 12 13 14 15 16 17 18 19 20Time (min)
0
10
20
30
40
50
60
70
80
90
100
Rel
ativ
e A
bund
ance
Gly2C10 GlyC22
§
#
Gly
C20
C13C18:2
C18:1
C16 C18
2C9
2C8
C19
*Gly
Figure 5. 4: Total ion current chromatogram of red sample from Lucio Fontana, Concetto
spaziale. Notte d’amore a Venezia, 1960
40 70 100 130 160 190 220 250 280 310 3400
50
100
41
55
74 97 124
137
166
198263
OOH
O
Figure 5. 5: mass spectrum of ricinoleic acid, methyl ester (peak labelled as #)
40 70 100 130 160 190 220 250 280 3100
50
100
45
55
6981
97
107
129
149 169 241
OO
O
Figure 5. 6 : mass spectrum of ricinoleic acid, methoxy methyl ester (peak labelled as §)
40 100 160 220 280 340 400 460 520 5800
50
100
41
55
74
87 138
155
187
201
OH
OHO
O
Figure 5. 7: mass spectrum of Octadecanoic acid, 9,10- dihydroxy methl ester (peak labelled as *)
150

Series of pink Olii: Concetto spaziale (17 37/92), 1962; Concetto spaziale (62 O 66), 1962; Concetto spaziale, La Fine di Dio (63 FD 14), 1963 Between 1962 and 1963 Fontana was performing and experimental phase on oil binding materials. In 1962 Fontana created the two rectangular Concetto Spaziale illustrated in Figure 5.8-5.9. They are monochromatic pink paintings on canvas with cuts, slashes and graffiti. The third pink work of art reported in Figure 5.10 is called Concetto spaziale, La Fine di Dio, dating 1963: it is an oval painting on canvas presenting cuts and graffiti.
Figure 5. 9: Lucio Fontana, Concetto spaziale, 1962,
Fondazione Lucio Fontana ( 62 O 66),
145 x 115 cm
Figure 5. 8: Lucio Fontana, Concetto spaziale, 1962,
Fondazione Lucio Fonatana (17 37/92), recto-verso
100 x 80.5cm
Figure 5. 10: Concetto spaziale (17 37/92):
detail of a whitish spot
Figure 5. 11: Lucio Fontana, Concetto spaziale, La Fine di Dio, 1963, Fondazione Lucio Fontana (63 FD 14), recto-
verso Cm 178 x 123
151

This series of Olii showed very similar degradation phenomena: the conservator noticed evidence of whitish spots widespread on the pictorial surfaces (Figure 5.10) [Ferriani B., 2010]. Their presence, never observed before, is of unclear origin. They did not seem to be caused by the addition of different materials on canvas but were rather part of the painted layers. The decision of treating together the analytical results from the three pink paintings is linked to the similarities regarding the state of conservation and the constituent materials.
0 5 10 15 200x-ray energy (keV)
Tube Voltage: 40.0 kV current: 1.1 uA4989
Figure 5. 12: XRF spectra of the three pink Olii : the peaks refer both to zinc
609
72287
4
1075
1318
1413
1574
173828
5129
20
3336
Fontana_CS_4989
50
60
70
80
90
%T
722
873
1101
1161
1241
1320
1413
1539
1739
2851
2919
3334
Fontana_FD_4959
50
60
70
80
90
%T
722
873
1098
116212
4313
18
1411
156017
38
2851
2919
3368
Fontana_CS_4643
50
60
70
80
90
%T
1000 1500 2000 2500 3000 3500 Wavenumbers (cm-1)
Figure 5. 13: comparison of the FT-IR spectra of the pink Olii by Lucio Fontana Concetto spaziale (17 37/92) (above), Concetto spaziale –La Fine di Dio (63 FD 14) (middle) and
Concetto spaziale (62 O 66) (below)
464363FD14
152

With regards to the pigmentation, XRF analysis displayed in Figure 5.12 shows the relevant presence of zinc in all the paints, suggesting the presence of zinc likely in the form of zinc white (ZnO). The pink colouration has probably been obtained by mixing zinc white with an organic red dyestuff, which was detected by Py-GC-MS (not shown here) [v. Keulen H., 2010]. FT-IR analyses performed on the pink painted layers show the presence of typical absorption peaks of drying oils at 3340, 2919, 2851, 1738, 1300-1090 and 722 cm-1
(Figure 5.13). In all the FT-IR spectra it is possible to notice a clear and broad carboxylate absorption around 1570-1540 cm-1, which consists of several separate peaks (1620, 1588, 1540 cm-1). These peaks are possibly the result of the influence of zinc white in the drying and ageing of oil as they could refer to the formation of metal carboxylates (soaps) with the carboxylic acids presents. Metal soaps can be formed after hydrolysis of the fatty acid moieties of the triglycerides of drying oil with metal-based pigments [van der Weerd J., 2005]. The presence of added stearates in the paint formulation can not be excluded, although it is rather difficult to discriminate between formed and added metal soaps by FT-IR. A minor addition of calcium carbonate as white pigment is suggested by carbonatic absorption peaks at 1413 and 873 cm-1. GC-MS analyses carried out on the pink paints exhibit similar results for the three artworks. They are oil paints: Figure 5.14 reports the case of Concetto Spaziale-La fine di Dio (63FD14). In the chromatogram saturated (lauric C14, myristic C14, palmitic C16, stearic C18), unsaturated (oleic C18:1) and dicarboxylic (suberic 2C8, azelaic 2C9, sebacic 2C10) fatty acids and glycerol derivatives were recorded - as methyl esters- after transesterification and GC-MS analysis. Among the characteristic drying oil compounds, two uncommon fatty acids were detected in the three Olii: erucic (13-docosenoic, peak #, mass spectrum in Figure 5.15) and gondoic (11-eicosenoic, peak*, mass spectrum at 5.16) acids and their oxidation products (13,14-dihydroxydocosanoic acid and 11,12-dihydroxyeicosanoic acid respectively). These unsaturated fatty acids are considered bio-markers as they are quite abundant only in oils obtained from the seed of Brassicaceae, such as rapeseed oil. Rapeseed oil is a semi-drying oil, introduced in the19th century as a lubricant and nowadays used for the production of biodiesel. There are two distinct types of rapeseed oil categorised according to fatty acid composition: high erucic acid rapeseed (HEAR, about 47% by weight) and low erucic acid rapeseed (LEAR). The second one is a derivative of rapeseed oil after modifying the percentage of erucic acid content: in this way, 85% of this oil is composed of oleic acid. Relatively high amount of oleic acid in the GC-MS chromatogram may also be explained by the presence of this slow–drying oil. According to artists’ handbooks, olive oil or rapeseed oil and glycerol were added to avoid industrial primed grounds to dry fast: these compounds helped to keep the ground elastic [Doerner M., 1984]. High amount of glycerol were detected in the case studies, but it is not completely clear whether the commercial primed canvases of the pink Olii were prepared with the addition of rapeseed oil or if the rapeseed oil was mixed (probably with linseed oil) as a binding medium. The characteristic molar ratios were calculated for the oil paints: also in this case, the similarities between the obtained values are huge. Although the value 1.6 for A/P (azelaic- to palmitic acid) ratio indicates a high proportion of dicarboxylic acid in the film, the disproportion between oleic and stearic acids could suggest that the oil binder is not completely mature. The high content of oleic acid and the consequent high degree of unsaturation is likely a consequence of the presence of a slow-drying oil, as seen before, but it can be explained in another way too. The significant amounts of oleic acid may be
153

linked to the presence of zinc oxide, as elsewhere noticed too [Rogala D., 2010]. It seems that in a lipidic medium zinc oxide forms a packed structure which is able to trap oleic and acid in the painted layer. This effect can occur also years after the oxidation processes get to completeness. The ratio azelaic-to suberic is approximately 8 for all the pink paints, indicating that the oil medium preparation did not involve any pre-heating treatments. The P/S (palmitic- to stearic) ratio is 3.5 for the Concetto spaziale (17 37/92), 3.7 for Concetto spaziale (62 O 66) and 3.4 for Concetto spaziale- La Fine di Dio (63 FD 14 ). The values are quite similar and may refer to the presence of rapeseed oil (whose P/S is around 3.5-3.8). After extraction, transesterification and GC-MS analysis, the paints showed P/S ratios lower than 1, while the S/G (stearic acid to glycerol) ratios are higher than 1. These may be explained by the presence of added stearates (2-5%) in the paints formulations, as explained in Chapter 4. Probably zinc soaps are present as no aluminium was recorded by XRF. Since the beginning of the 20th, metal stearates (and aluminium and zinc in particular) have been widely employed by paint manufactures as dispersion agents. The pink paints Fontana used for the creation of the three Concetto spaziale in 1962-1963 appeared to have the same formulation, both in terms of pigments/dyestuff (zinc white and organic red) and lipidic binders (rapeseed oil) and additives (stearates). The particular degradation observed in all the painted surfaces might be a result of the presence of a mixture of linseed oil with a slow-drying oil (rapeseed oil) with still high amount of unsaturated acids (oleic, erucic and gondoic were detected after almost 50 years) whose triglycerides reacted with zinc white from the painted layers to form metal soaps. As FT-IR analyses suggested, metal soaps are present as zinc carboxylates: it is probable that zinc soaps are present as formed and/or added soaps and that they migrated and agglomerated on the surface showing white spots.
6 7 8 9 10 11 12 13 14 15 16 17 18 19 20Time (min)
0
10
20
30
40
50
60
70
80
90
100
Rel
ativ
e A
bund
ance
§ *
C19
GlyC14C12GlyGly
Gly Gly
GlyGly
2C9
2C82C10
C16
C18
C18:1
#Gly
Figure 5. 14: Total ion current chromatogram of pink paint from Lucio Fontana, Concetto
spaziale –Fine di Dio (63 FD 14), 1962
154

40 100 160 220 280 340 400 460 520 5800
50
100
43
55
69
83
96
147175 221 281 320
O
O
Figure 5.15: mass spectrum of erucic acid methyl ester (13-Docosenoic acid, methyl ester, peak labelled as #)
40 100 160 220 280 340 400 460 520 5800
50
100
41
55
69
97
111
152 208 250
292
324
O
O
Figure 5.16: mass spectrum of gondoic acid methyl ester (11-eicosenoic acid, methyl ester (peak labelled as *)
Concetto spaziale. La Fine di Dio (64 FD 5), 1964 Fontana painted this Concetto spaziale, La Fine di Dio (64 FD 5) in 1964. It is a monochromatic yellow oval painting on canvas with punctures, slashes and graffiti (Figure 5.17). A microsample of the yellow paint was removed from the reverse part of the work of art.
Figure 5.17: Lucio Fontana, Concetto spaziale-La Fine di Dio, 1964, Fondazione Lucio Fontana (64 FD 5), recto and verso,
178 x 123 cm
155

The yellow paint was analysed by XRF, FT-IR and GC-MS. As shown in Figure 5.18, the elemental analysis of the paint detected the presence of zinc (Zn), chrome (Cr) and potassium (K): the yellow pigment used is possibly zinc yellow, whose composition is mainly ZnCrO4+K2CrO4 [Montagna G., 1993]. It is also possible that zinc refers to the ground layers, although the ground was carefully separated from the upper layers. FT-IR analysis suggests the presence of carbonatic materials (absorption peaks at 1413 and 873 cm-1), which are likely present as whiteners. The IR peaks at 3425, 2963, 2853, 1736 and 720 cm-1 are characteristic of drying oils. As observed for the pink Olii, the broad peak at 1574 cm-1 can be explained by the presence of zinc soaps, formed and/or added in the paint formulation. GC-MS results are also comparable with the pink series. Besides the presence of common fatty acids (palmitic C16, stearic C18 and azelaic 2C9) and glycerol derivatives (labelled as Gly), the yellow paint exhibits high amounts of unsaturated oleic (C18:1), gondoic (C20:1) and erucic (C22:1) acids (Figure 5.20). The presence of rapeseed oil is suggested also in this case.The high abundance of C18:1 might be related to the action of zinc pigments, as seen before. The high degree of unsaturation is defined also by the A/P ratio, which is 0.6, and by the O/S (oleic-to stearic acid) ratio which indicates the immaturity of oil.
Figure 5.18: XRF spectrum of Lucio Fontana, Concetto
spaziale-La Fine di Dio, (64 FD 5), 1964
0 5 10 150x-ray energy (keV)
Tube Voltage: 40.0 kV current: 2.2 uA
K
Cr
Cr
Zn
Zn
156

706
789
873
944
1095
1160
124113
18
1413
1574
1736
2853
2923
3425
5
10
15
20
25
30
35
40
45
50
55
60
65
70
75
80
85
90
95 100
%T
1000 1500 2000 2500 3000 3500 Wavenumbers (cm-1)
Figure 5. 19: FT-IR spectrum of the yellow paint from Lucio Fontana, Concetto spaziale-La Fine di Dio, (64 FD 5), 1964
7 8 9 10 11 12 13 14 15 16 17 18 19 20Time (min)
0
10
20
30
40
50
60
70
80
90
100
Rel
ativ
e A
bund
ance
GlyC20:1
C22:1GlyGly
C19
C18:1
C18
C16
2C9
Figure 5. 20: Total ion current chromatogram of the yellow paint from Lucio Fontana, Concetto
spaziale-La Fine di Dio, (64 FD 5), 1964
157

Unlike the previously analysed paintings, the P/S ratio is 1.7, value traditionally referring to linseed oil [Mills J. S., 1966]. However, GC-MS results after extraction and transesterification of the yellow sample show a very low P/S (0.8) and a very high S/G (5.8), suggesting that metal stearates are possibly present in the paint formulation as dispersion agents. Concetto spaziale. La Fine di Dio (63 FD 23), 1963 This oval painting on canvas belongs to the series Fine di Dio and was produced in 1963. It is a monochromatic black work of art with punctures, slashes and sequins glued on the surface. During restoration treatments, the conservator noticed an unusual alteration phenomenon: the canvas was very flexible and deformed outwards [Ferriani B., 2010]. A sample from the black paint and a piece of adhesive with sequins were analysed.
Figure 5.21: Lucio Fontana, Concetto spaziale-La Fine di Dio, 1963, Fondazione Lucio Fontana (63 FD 23), recto and verso,
178 x 123 Cm The black paint layer was separated from the white ground layer. XRF spectrum in Figure 5.22 shows the presence of calcium (Ca), phosphorus (P), iron (Fe), lead (Pb) and zinc (Zn). The black coloration is probably due to the use of bone black or ivory black, pigments mainly composed of Ca3(PO4)2. Lead and zinc are possible residues from the white preparation. The FT-IR depicted in Figure 5.23 provides further information about the pigments and the presence of iron: around 2100-2000 cm-1 are the peaks which refer to the absorption of the C=N of Prussian blue or black (Fe4[Fe(CN)3]3]. IR measurements also show the typical absorption peaks of drying oils (3362, 2922, 2854, 1708, 723 cm-1) and a strong peak at 1016 cm-1, which is probably due to silicates from glasses glued on the painting.
158

0 5 10 15 20 250x-ray energy (keV)
Tube Voltage: 40.0 kV current: 1.1 uA
P
Ca
FeZn Pb
Figure 5. 22: XRF spectrum of the black paint from Lucio Fontana, Concetto spaziale-La Fine di Dio, (63 FD 23), 1963
723
78
3
873
1016
1174 1
238
140914
5415
87 1
613
1708
2011
209
5
2854
2922
3362
0
10
20
30
40
50
60
70
80
90
100
%T
1000 1500 2000 2500 3000 3500 4000 Wavenumbers (cm-1)
Figure 5.23: FT-IR spectrum of the black paint from Lucio Fontana, Concetto spaziale-La Fine di Dio, (63 FD 23), 1963
159

The black paint components, visible in the chromatogram of Figure 5.24, are: glycerol derivatives, monounsaturated fatty acids (such as palmitic C16 and stearic C18), dicarboxylic acids (such as suberic 2C8, azelaic 2C9 and sebacic 2C11) and unsaturated C18:1 acid. The high degree of unsaturation, associated with the high amount of oleic acid, suggests that the paint, even after 50 years of being applied to the canvas, is still immature or that a non-drying oil was added to the paint. The A/P ratio (3.1) indicates that the oxidation processes occurred in the oil film. The P/S ratio is 1.3, value traditionally referred to the use of linseed oil; after extraction, transesterification and GC-MS analysis, there are no indications of added metal stearates. The adhesive used to glue sequins was identified as polyvinyl acetate (PVA), as shown in the FT-IR spectrum in Fig. 5.25 in which all the characteristic peaks of the polymer are present. This polyvinyl adhesive (likely Vinavil by the Italian company Montecatini) was applied on the entire painting surface by brush. Although it is not completely clear, this glue could have a role in the creation of tensions and deformations of the painted layers.
6 7 8 9 10 11 12 13 14 15 16 17 18 19Time (min)
0
10
20
30
40
50
60
70
80
90
100
Rel
ativ
e A
bund
ance
GlyGlyGly
Gly Gly
C19
2C9
2C8
C16
C18C18:1
2C11Gly
Figure 5. 24: Total ion current chromatogram of the black paint from Lucio Fontana, Concetto
spaziale-La Fine di Dio, (63 FD 23), 1963
160

475
605
631
795
946
1022
1122
1240
1372
1434
1737
29262972
5
10
15
20
25
30
35
40
45
50
55
60
65
70
75
80
85
90
95
%T
1000 1500 2000 2500 3000 3500 Wavenumbers (cm-1)
Figure 5. 25: FT-IR spectrum of the adhesive used to glue sequins in Lucio Fontana, Concetto spaziale-La Fine di Dio, (63 FD 23), 1963
Conclusions The materials used by Fontana in this series called Olii have been successfully identified with XRF, FT-IR and GC-MS. As it appears from the results, Fontana used paints containing different kinds of oils: a non-drying oil such as castor oil, a semi-drying oil as rapeseed oil and the more traditional (and drying) linseed oil. It is not completely clear if Fontana wanted to employ and try different kinds of oils to achieve different effects or if he used already-made paint colours without knowing their composition in terms of binders. However, the materials used are possibly linked to the conservation problems exhibited by the painted layers and observed during conservation treatments. The investigations of the techniques used in some Olii from 1960 to 1963 have only provided a piece of information on the complex spatial work of Lucio Fontana. Acknowledgements This research on Fontana’s Olii has been possible thanks to the collaboration with Barbara Ferriani (Barbara Ferriani s.r.l., via Vettabbia 1, Milano, Italy) and the courtesy of the Fondazione Lucio Fontana. A thank to Dr. Ferriani for also providing useful information and the pictures of the paintings.
161

5.3 Jasper Johns, Untitled 1964-65, 1965 Jasper Johns (Augusta, Georgia U.S.A., 1930) is one of the most important contemporary artists and one of his painting (False Sta t, 1959) is considered the most expensive work of art by a living artist. Johns had a classical formation, but in 1954 he met the artist Robert Rauschenberg and started developing his new ideas on art. According to art critics, Johns and Rauschenberg belong to the Neo-Dadaist Movement, together with Allan Kaprow and Cy Twombly. Johns has been also targeted as a Pop Art artist. In 1955 Johns painted Flag (1954-55), starting a new kind of paintings which include daily objects as flags, papers, maps, letters, etc. According to his ideas, the subject of the painting has to be ordinary in order to contrast to noble subjects chosen by the Abstract Expressionism; he neutralised the subject since an ordinary object allow the artist to be focused on the essential meaning of painting, on the execution techniques, on the matter itself [Pasini R., 1995]. In this sense, Johns’ techniques go from the oil to the encaustic paint and the collage, always choosing the fundamental colours (yellow, red, blue) in all their nuances.
r
Untitled, 1964-’65 by Jasper Johns is a large polyptych composed of four panels with five basic colours and three-dimensional ordinary objects. It has been part of the collection of the Stedelijk Museum of Amsterdam (inventory #24222) since it was acquired in 1966.
Figure 5.26: Jasper Johns, Untitled 1964-’65, 1965
Collection of the Stedelijk Museum of Amsterdam (24222), 182.9 x 478 cm In 2004 the first conservation treatment was carried out and required an extensive technical analysis in order to understand the sensitivity shown by the paint during the cleaning operation [Wijnberg L., 2007]. The painting was found to be water sensitive: this fact seems to be quite widely observable in 20th century oil paintings and the reasons are still under investigation in the Water-sensitive oil Project [van den Berg K. J., Burnstock A., 2007; Tempest H., 2010]. The campaign of analysis considered several aspects of the painting, including the study of the palette, the canvas and the execution techniques. Organic and inorganic analysis results were combined with an interview with the artist as well as research into technical literature to obtain more information about the composition of the work of art. This current study aimed to obtain further information on painting binders, additives and pigments, especially by employing the GC-MS method set up for modern oil formulation.
162

Experimental Six small samples were provided by the generosity of the Stedelijk Museum of Amsterdam, in the person of the conservator Louise Wijnberg. They were collected by Klaas Jan van den Berg (RCE) from the blue, yellow, red and orange paints areas and from a transparent tacky layer.
Table 5.2: list of pictorial fragments sampled from Jasper Johns, Untitled 1964-’65, 1965
Paint Sample Description
Red Red paint scraping from the central red and violet panels Orange Orange paint layer from the little orange panel Yellow Yellow paint fragment from the yellow panel Blue1 Blue paint scraping from the left blue panel Blue2 Blue paint scraping from the central red and violet panels
Transparent yellow Sample from the exudate of a yellow paint from the yellow panel Samples were taken in different areas from those sampled in 2004; only the transparent yellow sample was the same as the previous study. Samples were analysed by FT-IR, XRF and GC-MS. Results Analytical results, which will be discussed in detail concerning palette, binding materials and additives, are fully reported in Table 5.3. Palette The investigations of the paints used in Johns’ painting led to results comparable to those from previous studies [Wijnberg L., 2007; Burnstock A., 2007]. Several cadmium-based pigments, such as yellow, red and orange cadmium, were detected in the corresponding coloured areas. Figure 5.27 displays the XRF spectrum of the yellow paint: zinc and cadmium are the most abundant elements, suggesting the presence of cadmium yellow, (as CdZnS or CdS) with possibly zinc oxide (ZnO). Differently from the study of 2007 (in which orange was identified as cadmium sulphide orange), the orange paint seems to contains also selenium and zinc (Figure 5.28). This has been likely associated with the use of cadmium selenide sulphide red (CdSeS) and zinc white. The painting contains at least two kinds of blue paints, here identified as ultramarine blue (2Na2Al2Si2O6*NaS2) and cobalt blue (CoAl2O4, see elements detected in the XFR spectrum of Figure 5.29) and referring to sample called blue1 and blue2. Unlike the previous investigations, the blue pigments were found separately and not in a mixture of the two. Moreover, cobalt blue results do not give information about the presence of barium sulphate, which was detected in 2007 in the blue paint. These dissimilarities could be linked to the different areas of sampling and/or different mixtures of paints applied and they are an indication of the variety of paints used by Johns. Paints are extensively filled with sulphates or carbonatic compounds: extenders and whiteners such as barium sulphate (BaSO4), magnesium carbonate (MgCO3) and titanium white were also detected by FT-IR. Much interference in the XRF spectra is mainly due to the priming of the canvas, composed of lead carbonate, chalk and barium sulphate [Wijnberg L., 2007].
163

Paint sample XRF FT-IR GC-MS Conclusions
Red Al, Ca, Ba, Cr, Fe, Zn, Pb, Se, Cd
Oil, magnesium carbonate,
barium sulphate
P/S=3.2 (entire) P/S=1 (residue)
S/G= 1.2 (residue)
A/P=3.5 A/Sub=5.9
Cadmium selenide red, magnesium carbonate and barium sulphate in
oil. Presence of aluminium
stearates
Orange Al, S, Ca, Ba, Cr, Fe, Zn, Pb, Se, Cd
Oil, magnesium carbonate
P/S=2.6 (entire)
P/S=1.1 (residue) S/G= 1.3 (residue)
A/P=2.1
A/Sub=5.8 High oleic content
Hydrogenated castor oil
Cadmium selenide orange, magnesium carbonate and zinc
white in oil. Presence of aluminium
stearates and hydrogenated castor oil
Yellow Al, S, Ca, Ti, Zn, Pb, Cd
Oil, barium sulphate
P/S=1.6 (entire)
P/S=0.9 (residue) S/G= 1.3 (residue)
A/P=2
A/Sub=5.2 High oleic content
Hydrogenated castor oil
Cadmium yellow, zinc white and barium
sulphate in oil. Presence of aluminium
stearates and hydrogenated castor oil
Blue1 Al, Si, S, Ti Oil, silicates
P/S=3.3 A/P=1.6
A/Sub=5.2 Hydrogenated castor oil
Ultramarine blue and titanium white in oil.
Presence of hydrogenated castor oil
Blue2 Al, Ca, Ti, Fe, Co, Cr, Zn,
Pb
Oil, magnesium carbonate
P/S= 1.8 A/P=5.8
A/Sub=2.3 Hydrogenated castor oil
Cobalt blue, titanium white and magnesium
carbonate in Heat-bodied linseed oil.
Presence of hydrogenated castor oil
Transparent layer
Pb,Ba (ground) -
P/S=1.7 A/P= 3.9
A/Sub=2.4 12-hydroxy-stearicacid
Cyclic compound (Nonanoic acid, 9-(o-propylphenyl)-,
methyl ester) colophony
Stand oil
mixed with hydrogenated castor oil
and colophony
Table 5. 3: XRF, FT-IR, GC-MS results of investigation performed on samples from Jasper Johns,
Untitled 1964-’65, 1965
164

0 5 10 15 20 250x-ray energy (keV)
Tube Voltage: 40.0 kV current: 1.1 uA
Al SCa Ti Fe
Zn
Zn
Pb
Cd
Cd
Figure 5.27: XRF spectrum of the yellow paint from Jasper Johns, Untitled 1964-’65, 1965
0 5 10 15 20 250x-ray energy (keV)
file: orange.pdzTube Voltage: 40.0 kV current: 1.1 uA
Al S
CaBaBa
CrFe
ZnPb
Se
Se
Cd
orange
Figure 5.28: XRF spectrum of the orange paint from Jasper Johns, Untitled 1964-’65, 1965
0 5 10 15 20 250x-ray energy (keV)
Tube Voltage: 40.0 kV current: 1.1 uA
Al
Ca
Ti
Fe
Co
Co
Cu
Zn
ZnPb Pb
Figure 5.29: XRF spectrum of the blue(2) paint from Jasper John s, Untitled 1964-’65, 1965
165

A few sources state that Johns employed Winsor&Newton oil paints in the ‘60s [Wijnberg L., 2007; Burnstock A., 2007]. The comparison between Johns’ paints and a set of W&N oil paints from 1964-65 (see Chapter 4.2) shows good similarities. In Figure 5.30 the FT-IR spectra of W&N Cobalt Blue oil paint and the cobalt blue oil paint from Johns’ painting are displayed: they are very well over-imposable, also in correspondence to the IR absorptions related to magnesium carbonate (approximately at 3640, 1480, 1420 cm-1).
851
883
980
1100
1165
123713
23
1480
1599
170
817
382854
2925
3427
3647
W&N_CobaltBlue 1964-65
20
30
40
50
60
70
80
90
%T
89
0
108
2
116
0
124
2 1
323
141
3
148
3
159
7
173
6
284
8 2
925
342
4
364
9
Johns_cobalt blue paint
0
20
40
60
80
100
%T
1000 1500 2000 2500 3000 3500 Wavenumbers (cm-1)
Figure 5. 30: comparison between the FT-IR spectra of the W&N Cobalt Blue oil paint (series 1964-65) and the Cobalt Blue oil paint from Jasper Johns, Untitled 1964-’65, 1965
0,0
1,0
2,0
3,0
4,0
5,0
6,0
7,0
yellow orange blue1 blue2 red transparent
P/SA/PP/GA/Sub
Figure 5. 31: comparison between evaluation molar ratios (P/S, A/P, P/G, A/Sub) in samples
from Jasper Johns, Untitled 1964-’65, 1965
166

Binding materials The binders in all the analysed paints are lipidic. The FT-IR spectra of the Johns’ paints are characterised by the typical absorption peaks of oil media (see peaks at 3424, 2925, 2848, 1735, 323, 1242, 1082 cm-1 in Figure 5.30). In the same way, GC-MS analyses show the presence of the characteristic compounds of drying oils (as methyl esters): glycerol derivatives, dicarboxylic (such as azelaic 2C9, suberic 2C8, sebacic 2C10), monosaturated (such as lauric C12, myristic C14, palmitic C16, stearic C18), unsaturated (as oleic C18:1 and linolenic C18:2) and oxidised C18 fatty acids were detected. In Figure 5.32-5.33-5.34 the chromatograms of the cadmium yellow, cobalt blue and transparent paints are respectively displayed. In particular, it is possible to notice in Figure 5.32 that the yellow paint contains a high amount of oleic acid, although several oxidation products were registered. The presence of unsaturated acid in dried painted layers is possibly linked to the zinc oxide present in the pigment or added as a whitener. From previous studies, zinc oxide in oil appears to form a packed structure which is able to trap unsaturated oleic acid in the painted layer,also after the oxidation processes reach completeness [Rogala D., 2010]. In this sence, the difference in the amount of oleic acid detected in other pigments is explained by a minor content of zinc white in the paints (as observed by XRF analysis). In the chromatogram of the transparent sample (Figure 5.34) colophony was also registered thanks to the identification of hydroabietic acid derivatives (see mass spectra in Figure 5.35-5.36-5.37). In figure 5.31 a graphical comparison between evaluating parameters expressed as molar ratios is provided. The ratios considered are: P/S (palmitic to stearic); A/P (azelaic to palmitic); P/G (palmitic to glycerol) and A/Sub (azelaic to suberic). The P/S and the P/G ratios help in assign the kinds of oil used, provided the lipidic fraction is pure, thanks to the comparison with reference data [Mills J., 1966; Schilling M, 1999]. The P/G values for the analysed samples are all lower than 1, supporting the use of drying oil and the absence of proteinaceous media in the paint formulations. The P/S ratios vary from 1.6 (yellow and transparent paint) to 3.3 (ultramarine blue paint). Traditional values differentiate between linseed (P/S=1.5-1.8), walnut (P/S=2-2.6) and poppy seed (P/S >3) oils. Nevertheless, modern paint manufacturers commonly employ several kinds of drying, semi-drying and non-drying oils whose P/S values are often overlapping. In the analysed paints, the presence of linseed oil is probably attested in the yellow, cobalt blue and transparent paints. The P/S ratio (3.3) and the presence of distinctive high amounts of arachidic (C20) and behenic (C22) acids could suggest that the binder in ultramarine blue paint is sunflower or safflower oil. The P/S for cadmium red (3.2) and cadmium orange (2.6) are reliable with the use of sunflower and safflower oils, although no particular fatty acids (such as C20 and C22) were detected. If it is assumed that the paints were applied in the same range of time (between 1964 and 1965), the comparison between the A/P ratios provide a reliable indicator of the influence of different pigments in the oxidation and drying processes occurring in oil binders. Cobalt, which is known to be a good catalyst, is here present in the paint blue2 sample as CoAl2O4. The corresponding A/P ratio, in fact, is higher than the A/P ratios from paints containing cadmium and silicates. In the case of the transparent yellow paint, the high A/P ratio is likely due to the contamination of lead from the ground (as lead is also a catalyst in the drying of an oil) [Tumosa C., 2005]. DTMS results from 2007 suggested that the transparent paint was a strongly heat-bodied stand oil [Wijnberg L., 2007; Burnstock A., 2007]. In the current study, both cobalt blue and the transparent paints have A/Sub ratios of 2.3 and 2.8 respectively, indicating the possible use of a heat-bodied drying oil in the commercial formulation. Furthermore, the
167

transparent layer presents few cyclic compounds which are the results of the cyclisation occurring during preparation of stand oil.The other paints show A/Sub ratios of approximately 5.5-6, values which are possibly related with cold-pressed (raw) oils. Additives The presence of metal stearates was in previous studies suggested by the identification of aluminium by elemental analysis (see EDX result in [Wijnberg L., 2007; Burnstock A., 2007]. In the analysed paints, a relevant presence of aluminium was also registered by XFR in all the samples (see Al peaks in the spectra): it is important to point out that in this study, magnesium (Mg) was not detected by XRF, while it was found extensively in the 2007 EDX analysis. Except for ultramarine sample and cobalt blue, aluminium was not a compound present in the pigments. Its presence is probably associated with the use of aluminium stearates as dispersion agents, widely added by paint manufacturers in the 20th century. The cadmium-based paints present, after extraction and transesterification, lower P/S ratios, namely 1 for the red paint, 0.9 and 1.1 for the orange and yellow paints respectively. This may indicate the presence of added stearates. This is supported also by the S/G (stearic acid to glycerol) ratios, which are higher than 1 for the three paints, suggesting the use of stearates in the paint formulations. In addition to the dispersion agents, other additives are present in the paints. Castor wax or hydrogenated castor oil was detected in several paints. It was identified thanks to the presence of the characteristic 12-hydroxy-octadecanoic acid (also called 12-hydroxy-stearic acid, corresponding to the peak labelled as 12hydC18 in the chromatograms) and its methoxy form (labelled as 12metC18). This wax-like material has been widely added as a stabiliser in oil paints in the 20th century. The presence of colophony, furthermore, was observed in the transparent yellow sample, but it is not clear whether it was present in the exudate or added by the artist himself. Conclusions This survey provides a second examination of Johns’ Untitled 1964-’65, performed with the aim to acquire more information from the masterpiece of the American artist. Although the paint samples were taken from different areas of the painting, the results showed similarities in the identification of the pigments detected during the first campaign of analysis [Wijnberg L., 2007; Burnstock A., 2007]. The use of cadmium-based pigments, cobalt blue and ultramarine blue was registered during this phase as well, but slight differences were noted too, suggesting a huge variety of paints used. This current study dealt more with lipidic binders and additives. GC-MS results suggested the presence of lipidic material (except for the colophony present in the transparent sample). The identification of the different kinds of oil (like linseed, safflower or sunflower oil) was based not only on the P/S ratios but it took into consideration also the presence (or the absence) of peculiar fatty acids. For example, behenic and arachidic acids were found in ultramarine blue paint, suggesting the employ of sunflower or safflower oils. Additives were detected in the commercial paints used by Johns. It was observed that cadmium-based pigments in particular contain dispersion additives, as metal stearates, and/or stabilisers such as castor wax. Other paints, such as ultramarine blue and cobalt blue, contain castor wax as well. Acknowledgements Thanks to Louise Wijnberg and the Stedelijk Museum, Amsterdam for the samples provided and the access to Jasper Johns’ work of art.
168
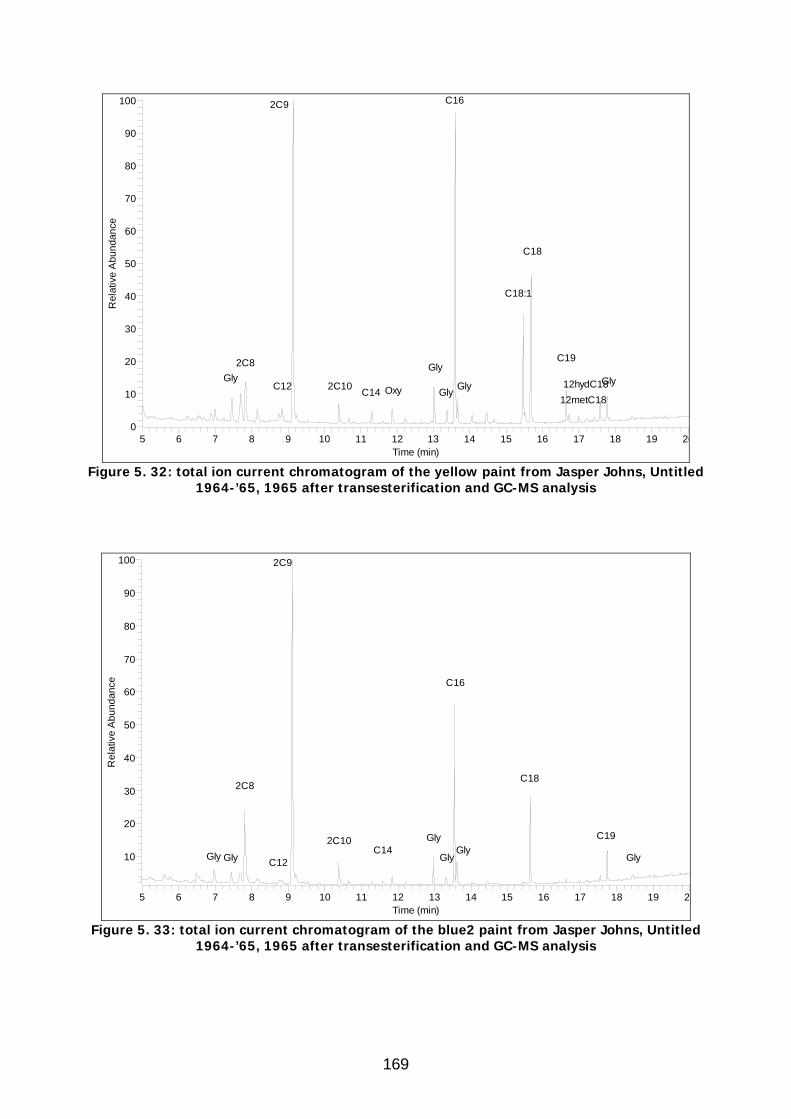
5 6 7 8 9 10 11 12 13 14 15 16 17 18 19 20Time (min)
0
10
20
30
40
50
60
70
80
90
100R
elat
ive
Abu
ndan
ce
12metC18
GlyGlyGly
Gly
2C9 C16
C18
C18:1
12hydC18
C192C8
2C10 OxyC12 C14 Gly
Figure 5. 32: total ion current chromatogram of the yellow paint from Jasper Johns, Untitled
1964-’65, 1965 after transesterification and GC-MS analysis
5 6 7 8 9 10 11 12 13 14 15 16 17 18 19 2Time (min)
10
20
30
40
50
60
70
80
90
100
Rel
ativ
e A
bund
ance
Gly2C10C14
C12Gly GlyGlyGly Gly
C19
C18
C16
2C9
2C8
Figure 5. 33: total ion current chromatogram of the blue2 paint from Jasper Johns, Untitled
1964-’65, 1965 after transesterification and GC-MS analysis
169

6 7 8 9 10 11 12 13 14 15 16 17 18 19 20Time (min)
10
20
30
40
50
60
70
80
90
100R
elat
ive
Abu
ndan
ce
Gly OxyOxyOxyGly
*
#§
C18:1
C19
GlyGly
Gly
Gly
C18
C16
12metC18
2C9
2C82C10
Gly
12hydC18
C18:2
Figure 5. 34: Total ion current chromatogram of the transparent sample from Jasper Johns,
Untitled 1964-’65, 1965 after transesterification and GC-MS analysis
Figure 5.35: mass spectrum of dehydroabietic acid methyl ester (peak labelled as #)
Figure 5.36: mass spectrum of dehydroabietyl alcohol (peak labelled as *)
39
Figure 5.37: Mass spectrum of Nonanoic acid, 9-(o-propylphenyl)-, methyl ester
40 100 160 220 280 340 400 460 520 5800
50
100
59 91 141 197
239
299
OO
40 90 140 190 240 290 340 390 440 490 540 5900
50
100
55
67
81109
123
135 179205
261
275
OH
40 90 140 190 240 290 340 0 440 490 5400
50
100
41
74
91
105
119
133
147 183
197
229
258
290
O
O
170

5.4 Karel Appel, La Grande Fleur de la Nuit, 1954 Karel Appel (Amsterdam 1921- Zurich 2006) was amongst the most important Dutch painters and sculptors of the 20th century. He attended the Academy of Fine Arts in Amsterdam from 1940 to 1943, in a period when Dutch artists could not buy artistic material or exhibit without being registered in the German Chamber of Culture. After the liberation, he started rebelling against his traditional and academic formation: this led him to be one of the founders of the artistic group called CoBrA (from the initials of the capital cities Copenhagen, Brussels and Amsterdam, where these artists used to live and work). In 1948, in fact, Asger Jorn (from Copenhagen), Joseph Noiret and Christian Dotremont (from Brussels) and Constant and Corneille together with Karel Appel (from Amsterdam) signed their manifesto, named “La cause était entendue” (The cause was heard) as a disagreement response to the French Surrealist document “La cause est entendue” (The cause is heard) [www.cobra-museum.nl]. The main objective of the CoBrA group, considered to be one the numerous declinations of the Informal Movement, was to rebel against the rules of Rationalism by approaching themselves to the grotesque and the legends from the popular Nordic culture [Pasini R., 1995]. In this way, Appel’s works of art were spontaneously created without constraint, full of colours and were fantastic images: he applied matter on canvas to experiment with subjects and materials, to recreate a barbaric and violent aspect, to fight against academic rules according to his vision that “to paint is to destroy what has been” [Claus H., 1962]. La Grande Fleur de la Nuit is a painting by Karel Appel, conserved in the collection of the Stedelijk Museum, Amsterdam. It was done in 1954, 3 years after the CoBrA movement was officially disbanded, but it still contains all the peculiar characteristic of this particular style. This work of art, in fact, is characterised by a violent and dramatic use of colours, which become matter with thickness and volume. The subject, a night flower, is realised with intense and lively brushstrokes, which juxtapose one on another themselves and create a dynamic context.
Figure 5. 38 : Karel Appel, La Grande Fleur de la nuit, 1954: details
171

Experimental Two small samples of paint layers were removed from areas affected by particular water sensitivity, according to the conservator Louise Wijnberg, Stedelijk Museum of Amsterdam. During sampling, a layer of dirt was observed and a certain softness of the painted layers was noticed especially in blue areas (soiled surface) [Soldano A., 2010].
Table 5.4: list of analysed samples from Karel Appel, LaGrande Fleur de la Nuit
Sample # Description 1 Red-orange paint layer from the reddish area 2 Yellow paint layer from the inferior left corner
Results Sample 1 This sample was taken from the red-orange area in the middle of the painting. The sample consisted in a pictorial fragment from the painted layer. XRF analysis (Figure 5.39) shows the presence of elements, such as lead (Pb), calcium (Ca), zinc (Zn), cadmium (Cd), selenium (Se), barium (Ba), sulphur (S), iron (Fe) and aluminium (Al). The reddish coloration is probably given by a red cadmium pigment, called cadmium selenide sulphide (CdSeS) which usually gives a very dark red coloration. It has possibly been lightened using a white pigment, as lead white (2PbCO3·Pb(OH)2) or zinc white (ZnO). The presences of barium and calcium are likely related to white pigments, such as barium sulphate (BaSO4) and calcium carbonate (CaCO3) widely used as extenders or fillers in manufactured oil paints. The occurrence of a significant aluminium content is not easily explainable: there is no indication of Al-containing pigments (such as ultramarine), so it can be linked to the presence of aluminium stearate (used as an emulsifying and dispersion agent) or hydrated alumina, knowingly added to paints as an extender. The results of GC-MS analysis performed on the whole sample are displayed in the chromatogram in Figure 5.40 The red-orange paint is actually composed of an organic synthetic dyestuff, called Antinolo Red B or Thioindigo Red B (compound labelled as * in Figure 5.40). The coloration is likely the result of mixing the organic dyestuff with cadmium selenide pigment (this can also explain the very low amount of cadmium recorded by XRF). It is not clear whether the artist mixed them during the creation of the painting or if it was an already made (and mixed) paint. GC-MS reveals that the red paint is an oil-based paint as it presents all the characteristic fatty acids and glycerol components. in fact, the paint sample contains, monocarboxylic fatty acids (such as nonanoic C9, lauric C12, myristic C14, palmitic C16, heptadecanoic C17, stearic C18, arachidic C20), dicarboxylic fatty acids (such as pimelic 2C7, suberic 2C8, azelaic 2C9 and sebacic 2C10) as methyl esters. In addition, several oxo- and methoxy- compounds have been identified. The high difatty acid content and the peculiar presence of oxo- and methoxy-difatty acids (for example those individuated as methoxy decanoic acid dimethyl ester, oxo- undecanedioic acid dimethyl ester) could be due to a pre-treatment of the oil binder. The use
172

of a pre-treated oil medium is explained also by the ratio between azelaic- to suberic acid (2C9/2C8), whose value is 3. In the same way, the A/P ratio (azelaic- to palmitic acid) is 2.6, showing a high proportion of dicarboxylic acid esters in the dried film. The palmitic- to stearic acid ratio (P/S) is 2: this value is included in the range traditionally referred to as linseed oil or walnut oil [Mills J.R., 1966].
0 5 10 15 20 250x-ray energy (keV)
Tube Voltage: 40.0 kV current: 1.1 uA
Al
SCa
BaBa Fe
Zn
Pb
Se
Pb
Sr
Pb
Cd
Figure 5.39: XRF spectrum of sample 1 of Karel Appel, La grande fleur de la nuit
6 7 8 9 10 11 12 13 14 15 16 17 18 19 20 21Time (min)
10
20
30
40
50
60
70
80
90
100
Rel
ativ
e A
bund
ance
2C7 §Pht GlyGly
Oxi*
GlyGly
GlyGly GlyC12
C19C18
C16
C9 2C102C8
2C9
Gly
mOxymOxy
C17 mOxyC18:1 C20C14 # Oxi
Figure 5.40: Total ion current chromatogram of the sample 1 of Karel Appel, La grande fleur de la nuit, after transesterification and GC-MS analysis.
173

40 100 160 220 280 340 400 460 520 5800
50
100
7181
109137
169
201
229
C13H24O5
Figure 5.41:§ = 2-methoxy decanoic acid dimethyl ester
40 100 160 220 280 340 400 460 520 5800
50
100
55
83
98
115
130
195
226
O O
O O
O
Figure 5.42:# = 4-oxo undecanedioic acid dimethyl ester,
40 100 160 220 280 340 400 460 520 5800
50
100
50
76
104
120
148 192240
267
296
O
S
S
O
Figure 5.43:*= Antinolo Red B or Thioindigo Red B
There is no indication of addition of natural resins or waxes in the paint formulation. The P/S ratio of sample 1 after extraction and transesterification is lower than 1, which likely indicates the presence of metal stearates added in the paint formulation. It is probably aluminium stearate, as aluminium has been detected by XRF analysis: this dispersion agent has been widely added in commercial paints since the 1920s as an aid in the grinding process of pigments and to prevent separation of pigment from the medium.
174

Sample 2 This pictorial fragment was taken from a yellow paint layer: it is a multi-layered sample taken from the painted surface. The elemental analysis is shown in Figure 5.44: in the XRF spectrum a predominant presence of zinc is registered, followed by barium, strontium, calcium, iron and aluminium. The yellow coloration is likely given by an iron oxide earth pigment and/or an organic colorant. Zinc white can be present as whitener pigment, as well with calcium carbonate and barium sulphate. The latter is also normally used as an extender for tube paints. Strontium could correspond to a white or yellow pigment. As seen for sample 1, the yellow paint contains drying oil. Methyl esters of short-chain fatty acids (C9-C14), saturated long-chain fatty acids (C16-C20), dicarboxylic acids (2C8-2C10), and oxidised C18 fatty acids are present together with glycerol derivatives. Although oxidation took place in the film, the organic investigations also show peaks for the unsaturated acids (oleic C18:1, linoleic C18:2) suggesting that the medium is relatively unoxidised even after 66 years from the creation of the painting. The unoxidised medium could be explained according to different considerations. The first one is related to the extreme thickness of the painted layer. It is in fact typical of Appel’s style to apply dense brushstrokes of colours, sometimes directly from the tubes. This creates many areas of thick impasto with a combination of numerous overlapping paints: thick layers have lower oxygen availability. Another explanation for the significant amounts of oleic acid is linked to the presence of zinc oxide, as elsewhere noticed [Rogala D., 2010]. It seems that zinc oxide in proximity of a lipidic medium forms a packed structure which is able to trap unsaturated fatty acids in the painted layer. This effect can also occur years after the oxidation process is complete, probably because of the stability in the zinc oxide-oleic acid structures. Finally, the absence of pigments and specifically the catalytic action of some metals capable of existing in more than one oxidation state has to be taken into consideration. Unlikely for sample 1, lead and other polymerisation-catalyst were not recorded. The oil paint in sample 2 is characterised by a P/S ratio of 1.5, likely linseed oil. The A/P ratio of 2.1 suggests a high proportion of dicarboxylic acid esters present in the film. Differently from sample 1, the ratio between azelaic- and suberic (5.8) and the absence of oxidative dicarboxylic compounds could indicate that during oil preparation a pre-treatment hardly took place. Like in sample 1, there is no indication of addition of resins or waxes. In this case, some aluminium stearates are present, as suggested by XRF identification of Al and, over all, by GC-MS results after extracting and transesterifying the sample. The P/S ratio is 0.9, suggesting the presence of dispersion agents added in the paint formulation. Like sample 1, there is no indication of addition of resins or waxes.
175

0 5 10 15 20 250x-ray energy (keV)
Tube Voltage: 40.0 kV current: 1.1 uA
AlCa
Ba Fe
Zn
Zn
Sr
Figure 5.44: XRF spectrum of sample 2 of Karel Appel, La grande fleur de la nuit
6 7 8 9 10 11 12 13 14 15 16 17 18 19Time (min)
10
20
30
40
50
60
70
80
90
100
Rel
ativ
e A
bund
ance
mOxyC14
C12C9 mOxy
mOxy
C18:2C20Oxi
GlyGly
Gly GlyGly
C18
C16
2C10
2C8
2C9
C18:1C19
Gly
Gly
Figure 5.45: Total ion current chromatogram of the sample 2 of Karel Appel, La grande fleur de la nuit, after transesterification and GC-MS analysis.
176

Conclusions Karel Appel’s painting La Grande Fleur de la Nuit is a complex overlapping of thick painted layers, characterised by both flat and impasto areas. The two paint samples taken from different areas are both oil paints as GC-MS results claim, but showing many differences. The red paint (sample 1) is like a mixture of cadmium selenide sulphide (CdSeS) pigment and an organic red colorant (called Antinolo Red B or Thioindigo Red B), lightened by the addition of lead white(2PbCO3·Pb(OH)2) or zinc oxide (ZnO). The high proportion of dicarboxylic acids (pimelic, suberic, azelaic, sebacic, etc) and the occurrence of their oxidation by-products suggest that the lipidic binder used is a pre-treated oil, likely linseed oil since the P/S ratio is 2. The light yellow painted layer is an iron oxide earth pigment and/or an organic colorant (not identified) with a strong presence of zinc white, used as a whitener. The oil binder is possibly linseed oil (P/S ratio of 1.5): although oxidation occurred, the film still presents unsaturated acids (oleic C18:1, linoleic C18:2). This could be explained by the thickness of the painted layer and by the role of zinc oxide in trapping unsaturated fatty acids in the painted layer and preventing them to be completely oxidised. In both cases there is an indication of stearates being added in the paint formulations, which is typical of manufactured oil paints. Acknowledgements Thanks to Louise Wijnberg and the Stedelijk Museum, Amsterdam for the samples provided and the access to Appel’s work of art.
177

5.5 Willem De Kooning, Rosy-Fingered Dawn at Louse Point, 1963 Willem De Kooning (Rotterdam, 1904–New York, 1997) was a Dutch-born painter emigrated in the United States in 1926. Few years later he met Arshile Gorky, a painter of Armenian origin. De Kooning started with him a fertile friendship and both of them took part in the artistic debate which defined the coordinates of the American informal art. De Kooning outshined in the new Yorker artistic scene in the early 1940s with the abstract frescoes for the International Exposition; few years later, with his first personal exhibition at the Edgan Gallery in 1948, he became one of the most important of the so-called New York School with other artists such as Jackson Pollock, Adolph Gottlieb, Ad Reinhardt, Mark Rothko, Robert Motherwell and Arshile Gorky. This definition, coined by the painter and art critic Robert Motherwell in 1949, grouped all these artists who were influenced by the European Avant-garde, according their preference to the emotional aspects of the artistic act in spite of the intellectual ones. De Kooning's paintings are characterised by the permanence of anthropomorphic trails (like in the Women series), surfacing from a thick and tangled pictorial matter, where colours are wisely mixed up in a rough way, almost tortured by an obsessive gestural expressiveness. This is the reasons why is possible to recognize in De Kooning an action painter [Pasini R., 1995]. In his works is possible to recognize the influence of the French painter Chaim Soutine, the Dutch origin played also a remarkable role. Afflicted by a sort of “Dutch-syndrome” in trying to escape from the Mondriaan and Van Doesburg rationalism [Pasini R., 1995], at the same time confronting himself with Flemish echoes, De Kooning embodied in his art the “anguish of an ancient past” [Argan G.C., 1970].
Figure 5. 46: Willem De Kooning, Rosy-Fingered Dawn at Louse Point, 1963, oil on canvas, Collection Stedelijk Museum Amsterdam (A22662)
203.5 cm x 178.5 cm
178

Rosy-Fingered Dawn at Louse Point, 1963, by Willem de Kooning (inventory #A22662; Figure 5.46) is in the collection of the Stedelijk Museum, Amsterdam since it was acquired by the museum in 1964. The painting was executed in the New York atelier and it is stylistically and technically considered in between his paintings from the 1950s and the 1960s [Lake S., 1999]. In this period, the artist was known to use linseed oil and castor oil, although he frequently mixed poppy and/or safflower oil and water into his paints; furthermore, from the 1964 until the middle of the 1970s safflower became his medium of choice [Lake S., 1999]. De Kooning was, indeed, an experimentalist: he wanted to achieve different effects by using radical paint formulations with extensive re-working of the painted canvases [Schilling M., 1999]. Nevertheless, the addition of the slow-drying safflower oil could be related to the negative long-term stability of his paintings from the period 1960-1977, in which many passages remained sticky and soft and presented amber-coloured drips of media residues [Lake S., 1999; Schilling M., 1999]. In 2008-2009 Rosy-Fingered Dawn at Louse Point was subjected to conservation treatments as it had a significant, disfiguring layer of surface dirt and in some areas it was soft and sticky. Furthermore it was found to be rather water-sensitive, especially in the yellow passages [Tempest H., 2009]. The painting was studied by several analytical techniques in order to investigate the components of the paint and understand the cause of water sensitivity. Results provided important information on De Kooning palette and painting techniques. The current study was carried out to obtain further information about binders and additives. Experimental Three paint samples were selected from the previous study by Hannah Tempest (CIA-2009).The pictorial fragments (reported in Table 5.5) were chosen among those on which GC-MS analysis was not performed (samples 2 and 3) or was performed with dubious results (sample 1). They were in fact analysed by the GC-MS method designed for modern paint formulation.
Figure 5. 5:list of samples from Willem de Kooning, Rosy-Fingered Dawn at Louse Point, 1963
Sample # Description 1 Yellow paint taken from the extreme left of the painting 3 Bright blue over white from the left, near top
Results Sample 1 The yellow paint was previously analysed as a cadmium zinc sulphide paint with barium sulphate in oil. Although the presence of a drying oil was outlined, the P/S ratios and other molar ratios were not calculated due to contamination of cadmium and zinc [Tempest H., 2009].
179

A fragment of sample 1 was once more analysed by GC-MS. The correspondent chromatogram is reported in Figure 5.47. The yellow paint is a drying oil, as di- and mono- unsaturated and oxidised C18 fatty acids were recorded as methyl esters. Among them, 12-hydroxy stearic acid (peak labelled as 12HydC18) and 12-hydroxy methoxy stearic acid (peak labelled as 12HydMetC18) methyl esters were detected as well. They are likely associated with the use of castor wax, a stabilisation agent found also in other paint samples from the painting [Tempest H., 2009]. The A/P ratio is 1.6 and suggests that oxidation took place in the oil film. The value azelaic- to suberic acid (7) indicates that any pre-heating treatments were done during oil preparation. The P/S ratio of the whole sample is 2.9: this value may refer to the use of safflower oil, the slow-drying oil used by De Kooning to prolong the workability of the painted surfaces [Lake S., 1999]. Furthermore, the P/S and P/G values of the residue after extraction and transesterification provide an indication for the presence of metal stearates: in fact, the P/S ratio is 0.9, while P/G is much higher than 1. As SEM analysis detected aluminium (which was not component of the yellow pigment) [Tempest H., 2009], it could be an additional indication for the presence of aluminium stearates. Sample 3 This pictorial fragment was a bright blue paint over white paint, which was identified as synthetic ultramarine with calcium carbonate bound in oil. The medium was found as possibly oil by FT-IR analysis [Tempest H.,2009]. GC-MS analysis performed in the current study outlined that the blue paint actually contains drying oil, as it is possible to see in the chromatogram of Figure 5.48. Glycerol, unsaturated fatty acids, difatty acids and some oxidation C18 products were detected. Unlike sample 1, castor wax derivatives are not present in the sample. The A/P ratio is 3.1, strengthening the use of a drying oil; as for sample 1, the A/Sub ratio suggests that the oil used was not pre-heated or pre-polymerised. The P/S ratio for the entire sample is 4: this quite high value is traditionally referred to poppy seed oil, but it cannot be excluded the presence of safflower and/or sunflower. In fact, significant amounts of behenic and arachidic acid were found in the oil paints, which might refer to these slow-drying oils commonly used by modern manufacturers. Furthermore, safflower oil, as previously seen, was the selected oil by De Kooning to modify commercial paints. In the bright blue paint, however, there are no indications for the presence of added stearates.
180

6 7 8 9 10 11 12 13 14 15 16 17 18 19 20Time (min)
0
10
20
30
40
50
60
70
80
90
100
Rel
ativ
e A
bund
ance
2C10GlyGly
Gly
GlyC14C12 Oxo
Oxo
12HydMetC18
12HydC18
C19C18
C16
2C8
2C9
Figure 5. 47: Total ion current chromatogram of sample 1 from Willem de Kooning Rosy-Fingered
Dawn at Louse Point, 1963 ,
5 6 7 8 9 10 11 12 13 14 15 16 17 18 19 20Time (min)
0
10
20
30
40
50
60
70
80
90
100
Rel
ativ
e A
bund
ance
Oxo OxoOxo
OxoGlyGly Gly
GlyC12 C14
C19
C18
C16
2C102C8
2C9
Figure 5. 48: Total ion current chromatogram of sample 3 from Willem de Kooning Rosy-Fingered
Dawn at Louse Point, 1963 ,
181

Conclusions The two paints from Willem de Kooning, Rosy-Fingered Dawn a Louse Point were found to be bound in oil, as previously suspected. They are likely commercial oil paints: the yellow one, in particular contains both stabilisers (as castor wax) and dispersions agents (metal stearates). In both cases, the high P/S ratios suggest the use of poppy oil and/or safflower oil. In the 1960s De Kooning was known to add extra oil (such as safflower oil) to obtain an always-fresh visual statement. Nevertheless, his procedures led to works of art which have remained tacky and soft,even 50 years from their production.
t
Acknowledgements Thanks to Louise Wijnberg and the Stedelijk Museum, Amsterdam and Klaas Jan van den Berg (RCE) for the samples provided from De Kooning’s work of art.
182

5.6 Salvador Dalì, Landscape with Girl Skipping a Rope, 1936 Salvador Dalì (1904-1989) is considered one of the most influential modern artists. He is very famous for his surrealistic world full of bizarre and unexpected images: the emblematic painting The Persistency of the Memory (1931, MoMA, New York) encloses the artist’s theory of “softness and hardness” in relation with time and elements of surprise and juxtaposition. During his 60-year career Dalì produced more than 1700 works. In 1936 Dalì painted Landscape with a Girl Skipping a Rope (Figure 5.49) for an important English client, Edward James, who commissioned him to make this work for his house in London. The painting was damaged during an air raid in the Second World War. The centre panel was then stored elsewhere and the side panels were transferred to the Tate Gallery. The panels were reunited and restored in the 1960s and then found their way to Museum Boijmans Van Beuningen as a long-term loan in 1972. The museum purchased the painting in 1977 [http://www.boijmans.nl].
Figure 5.49 Salvador Dalí. Landscape with a Girl Skipping a Rope, 1936, oil paint on canvas (Size: 4 x 298 x 90 cm Centre section: 293 x 280 cm Side panels: 261 x 84 cm)
Collection Museum Boijmans Van Beuningen. For a contemporaneous painting called Forgotten Horizon (1936, Tate T01078), the artist used a particularly fluid quality paint. The technical analyses led to claim that Dalì either used natural resin on its own or mixed with linseed oil paint to create a more liquid media [Smithen P., 2007]. The Catalan artist produced oil paintings, tempera paintings and others of diverse pictorial techniques, ranging from collages of various materials to the use of varnish as medium. In addition to using pre-existing methods of applying paint to canvas, Dali was known to employ some methods of his own creation, like the tachiste plates, the
183

painting with cartridges containing lithographic ink for the dessin automatique (for more details on Dalì’s life and works of art: www.salvador-dali.org). Experimental Dali’s Landscape with a Girl Skipping a Rope has been recently restored (Summer 2010) in the Museum Boijmans Van Beuningen in full view of museum visitors. For this occasion some micro-samples were taken to understand the composition of this surrealistic work of art. Samples were made available by the generosity of the Museum and were collected by Katrien Keune (freelancer) and Annelies Van Loon (Mauritshuis and freelancer). One pictorial fragment was sampled from the yellow landscape (left panel, left side) to be analysed by GC-MS in order to identify the binding materials used. Results Inorganic analyses on the yellow painted layers reveal the presence of yellow ochre, cadmium yellow, zinc white, barium sulphate and lead. The sample presents a first ground layer with calcium carbonate and lead white; a second ground containing lead white; a thick yellow paint with ochre and cadmium yellow; a thin transparent organic rich layer [Keune K., 2010, personal communication]. GC-MS analysis performed on the yellow paint scrapings detected the presence of drying oil. The chromatogram in Figure 5.50 displays the components characteristic of a cured drying oil: short-chain fatty acids (C9-C14), saturated long-chain fatty acids (C16-C22), dicarboxylic acids (2C8-2C10), unsaturated (C18:1), oxidised C18 fatty acids (as methyl esters) and glycerol. The unsaturated C18:2 and C18:3 fatty acids, original abundant components in fresh oil film, are not present anymore, while oleic acid is present in low amounts. The maturity of oil can be expressed by the oleic- to stearic acid, which is 0,3. In the same way, the presence of oxidised fatty acids (labelled as Ox in the chromatogram) indicates that oxidation occurred in the film or that the oil medium has cured. The A/P ratio (azelaic- to palmitic acid) is 1.6, showing a high proportion of dicarboxylic acid esters in the dried film. The ratio between azelaic and suberic acid is 7, value which indicate that no pre-heat treatment took place during preparation of the oil binder. The palmitic- to stearic acid ratio (P/S) is 3.2: this value is included in the ranges traditionally referred to as poppy seed oils [Mills J. R., 1966]. However, the presence of arachidic (C20) and behenic (C22) acids are more probably due to the use of sunflower oil. This oil contains on average 3-6% (by weight of total fatty acids) of palmitic acid, 1-3% of stearic acid, 0.6-4% of arachidic acid and 0.8% of behenic acid. During the 20th century, paint manufacturers used sunflower oil as a cheaper non-yellowing binding medium. It is a fluid, slow-drying oil (containing more than 50-60% of linoleic acid) with a slightly yellow colour: for its properties it resembles poppy seed oil. The binding medium used by Dalì may be sunflower oil (as suggested by long chain saturated fatty acids). In the GC-MS chromatogram there is no indication of natural waxes or resins. Extraction, transesterification and GC-MS analysis of the paint does not show the presence of metal stearates added to the paint formulation.
184

, ,
6 7 8 9 10 11 12 13 14 15 16 17 18 19 20Time (min)
0
10
20
30
40
50
60
70
80
90
100
Rel
ativ
e A
bund
ance
OxOx OxC9 C14C12Gly C20 C22
C19
Gly2C102C8
2C9
Gly GlyGly
C18:1
C18
C16
Figure 5.50: Total ion current chromatogram of the yellow sample from the landscape of Salvador
Dalì, Landscape with a Girl Skipping a Rope, after transesterification and GC-MS analysis. Conclusions For the realization of the landscape of the surrealistic painting conserved in Museum Boijmans Van Beuningen, Dalì chose lipidic binding media. GC-MS results show the occurrence of the typical drying oil compounds. Since the P/S ratio is higher than 3 and arachidic and behenic acid are present too, the use of sunflower oil, a slow-drying oil knowingly used in manufactured artists’ oil paints, is suggested. The yellow paint from the ‘30s seems not to contain natural waxes or resins, in contrast to the analysis results of paint in another painting by Dalì from 1936 conserved at the Tate, London. It is important to remind that the analyses only refer to the yellow landscape: the materials and in particular the binders used in other areas (sky, clouds) and subjects (girl, tower, etc.) were not studied. Acknowledgements Thanks to Katrien Keune and Annelies Van Loon for providing the sample and to the Museum Boijmans Van Beuningen, Rotterdam for the opportunity to analyse a Dalì’s painting.
185

5.7 Isabel Lambert-Rawsthorne, Male Baboon, c.1950 Isabel Lambert-Rawsthorne, born Isabel Nicholas (1912-1992), was a British artist who became famous for her intense artistic life and her love affairs with great artists. The article entitled “Isabel Rawsthorne: The woman who was a walking work of art” is certainly an homage to an extraordinary woman, who was a muse, a model and a painter herself [Ahad N., 2008]. She studied at the Liverpool College of Artthen at the Royal Academy in London. In 1934 she was in Paris, working with André Derain and Balthus. Isabel was for several times the model for Derain and Picasso. In that Avant-guard background, she met Giacometti and they became lovers. After the Second World War, she socialised with Simone de Beauvoir and Jean-Paul Sartre. She married three times: her surnames come from her second and third husbands, Constant Lambert and Alan Rawsthorne, both English composers. She came back to London, where she was in contact with Lucian Freud and Francis Bacon, to whom she was very close. In the '50s and '60s, she designed sets and costumes for ballets and ballet dancers became a favourite subject. Then, after a trip to Africa in 1961, she produced African landscapes and in the ‘70s she became involved with the Environmentalist movement. Once she said “I am beginning to understand what pushes me into painting – the love of seeing and the fact as the chosen subject grows in beauty, so it becomes more elusive”. Human bodies and animals are predominant in her work. When she was a child, her father supplied exotic creatures to British zoos and she used to paint these and other wildlife [Ahad N., 2008]. It is probably due to her interest in wild animals the realisation of the painting Male Baboon (Figure 5.51) dating around 1950.
Figure 5.51: Isabel Lambert-Rawsthorne, Male Baboon, c.1950, private collection
186
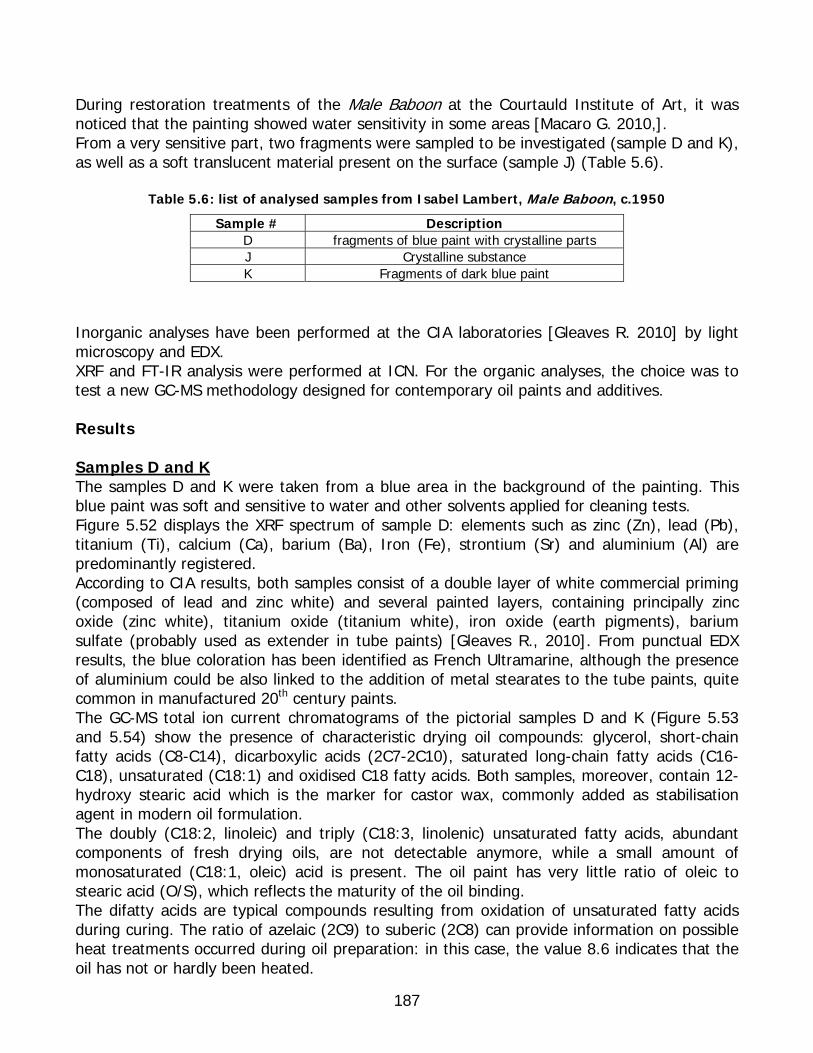
During restoration treatments of the Male Baboon at the Courtauld Institute of Art, it was noticed that the painting showed water sensitivity in some areas [Macaro G. 2010,]. From a very sensitive part, two fragments were sampled to be investigated (sample D and K), as well as a soft translucent material present on the surface (sample J) (Table 5.6).
Table 5.6: list of analysed samples from Isabel Lambert, Male Baboon, c.1950 Sample # Description
D fragments of blue paint with crystalline parts J Crystalline substance K Fragments of dark blue paint
Inorganic analyses have been performed at the CIA laboratories [Gleaves R. 2010] by light microscopy and EDX. XRF and FT-IR analysis were performed at ICN. For the organic analyses, the choice was to test a new GC-MS methodology designed for contemporary oil paints and additives. Results Samples D and K The samples D and K were taken from a blue area in the background of the painting. This blue paint was soft and sensitive to water and other solvents applied for cleaning tests. Figure 5.52 displays the XRF spectrum of sample D: elements such as zinc (Zn), lead (Pb), titanium (Ti), calcium (Ca), barium (Ba), Iron (Fe), strontium (Sr) and aluminium (Al) are predominantly registered. According to CIA results, both samples consist of a double layer of white commercial priming (composed of lead and zinc white) and several painted layers, containing principally zinc oxide (zinc white), titanium oxide (titanium white), iron oxide (earth pigments), barium sulfate (probably used as extender in tube paints) [Gleaves R., 2010]. From punctual EDX results, the blue coloration has been identified as French Ultramarine, although the presence of aluminium could be also linked to the addition of metal stearates to the tube paints, quite common in manufactured 20th century paints. The GC-MS total ion current chromatograms of the pictorial samples D and K (Figure 5.53 and 5.54) show the presence of characteristic drying oil compounds: glycerol, short-chain fatty acids (C8-C14), dicarboxylic acids (2C7-2C10), saturated long-chain fatty acids (C16-C18), unsaturated (C18:1) and oxidised C18 fatty acids. Both samples, moreover, contain 12-hydroxy stearic acid which is the marker for castor wax, commonly added as stabilisation agent in modern oil formulation. The doubly (C18:2, linoleic) and triply (C18:3, linolenic) unsaturated fatty acids, abundant components of fresh drying oils, are not detectable anymore, while a small amount of monosaturated (C18:1, oleic) acid is present. The oil paint has very little ratio of oleic to stearic acid (O/S), which reflects the maturity of the oil binding. The difatty acids are typical compounds resulting from oxidation of unsaturated fatty acids during curing. The ratio of azelaic (2C9) to suberic (2C8) can provide information on possible heat treatments occurred during oil preparation: in this case, the value 8.6 indicates that the oil has not or hardly been heated.
187

0 5 10 150x-ray energy (keV)
Tube Voltage: 40.0 kV current: 1.1 uA
Al S
Ca
TiBa
Mn
Fe
Co Ni
Zn
ZnPb
PbSr
Figure 5.52: XRF spectrum of the sample D, blue paint from Isabel Lambert, Male Baboon, c.1950
, ,
6 8 10 12 14 16 18 20Time (min)
10
20
30
40
50
60
70
80
90
100
Rel
ativ
e A
bund
ance
C20 C22
Gly
2C9
2C82C10
C16C18
C18:1
C19
12HydC18
GlyGly
GlyGly
Figure 5.53: Total ion current chromatogram of the pictorial sample D from Isabel Lambert, Male
Baboon, c.1950 after transesterification and GC-MS analysis
188
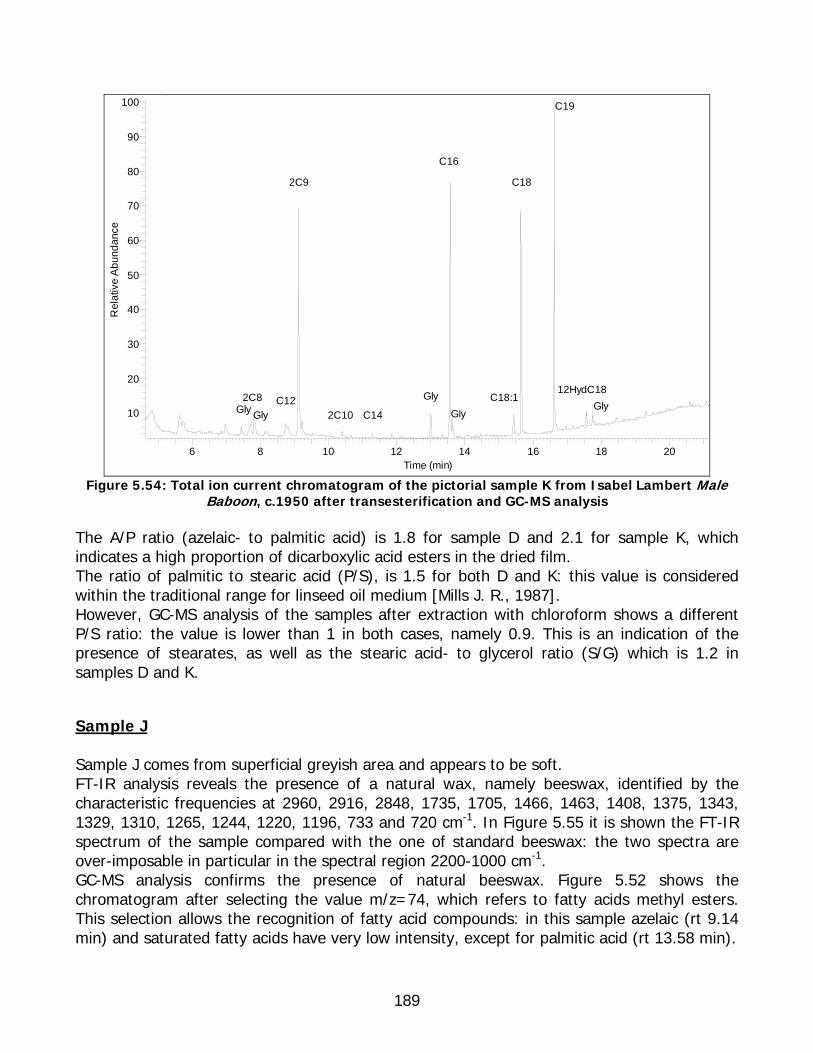
, ,
6 8 10 12 14 16 18 20Time (min)
10
20
30
40
50
60
70
80
90
100R
elat
ive
Abu
ndan
ce
2C10
12HydC18
C19
C18:1
C18
C16
2C8
2C9
GlyGlyGly
GlyGlyC12
C14
Figure 5.54: Total ion current chromatogram of the pictorial sample K from Isabel Lambert Male
Baboon, c.1950 after transesterification and GC-MS analysis The A/P ratio (azelaic- to palmitic acid) is 1.8 for sample D and 2.1 for sample K, which indicates a high proportion of dicarboxylic acid esters in the dried film. The ratio of palmitic to stearic acid (P/S), is 1.5 for both D and K: this value is considered within the traditional range for linseed oil medium [Mills J. R., 1987]. However, GC-MS analysis of the samples after extraction with chloroform shows a different P/S ratio: the value is lower than 1 in both cases, namely 0.9. This is an indication of the presence of stearates, as well as the stearic acid- to glycerol ratio (S/G) which is 1.2 in samples D and K. Sample J Sample J comes from superficial greyish area and appears to be soft. FT-IR analysis reveals the presence of a natural wax, namely beeswax, identified by the characteristic frequencies at 2960, 2916, 2848, 1735, 1705, 1466, 1463, 1408, 1375, 1343, 1329, 1310, 1265, 1244, 1220, 1196, 733 and 720 cm-1. In Figure 5.55 it is shown the FT-IR spectrum of the sample compared with the one of standard beeswax: the two spectra are over-imposable in particular in the spectral region 2200-1000 cm-1. GC-MS analysis confirms the presence of natural beeswax. Figure 5.52 shows the chromatogram after selecting the value m/z=74, which refers to fatty acids methyl esters. This selection allows the recognition of fatty acid compounds: in this sample azelaic (rt 9.14 min) and saturated fatty acids have very low intensity, except for palmitic acid (rt 13.58 min).
189
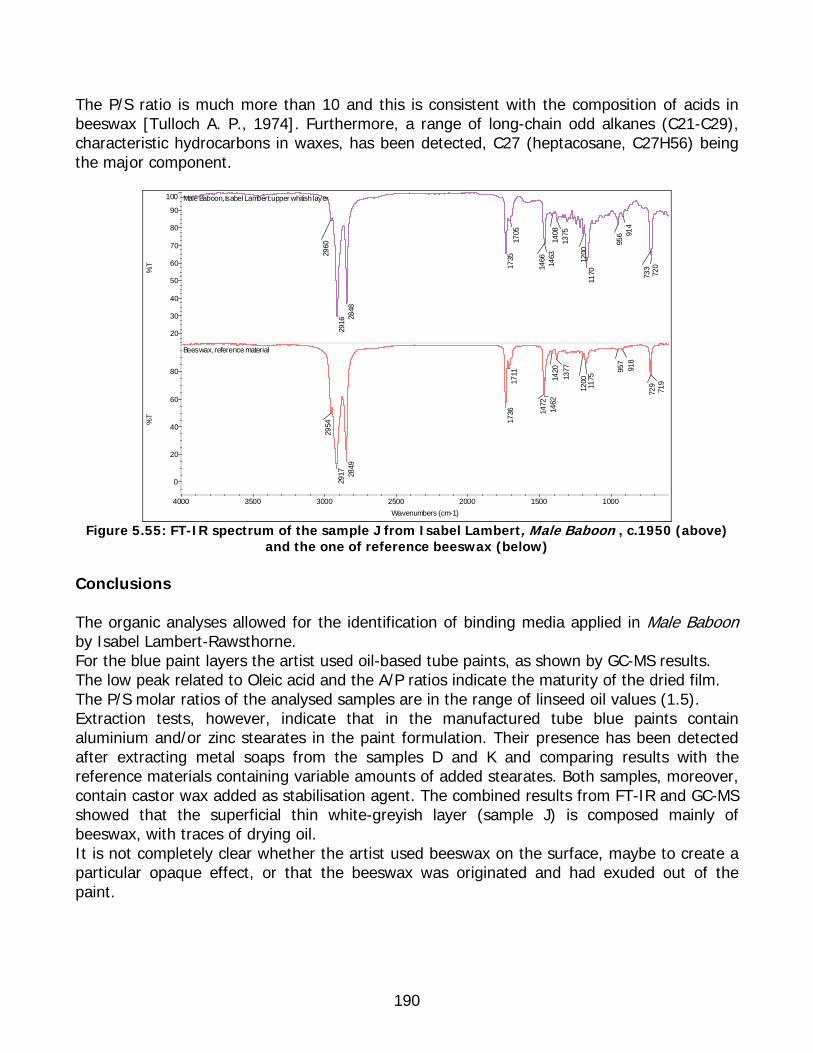
The P/S ratio is much more than 10 and this is consistent with the composition of acids in beeswax [Tulloch A. P., 1974]. Furthermore, a range of long-chain odd alkanes (C21-C29), characteristic hydrocarbons in waxes, has been detected, C27 (heptacosane, C27H56) being the major component.
720
73
3
91
495
6
1170
120
0
1375
140
814
63 1
466
170
517
35
2848
2916
296
0
Male Baboon, Isabel Lambert: upper whitish layer
20
30
40
50
60
70
80
90
100
%T
719
729
91
8
957
1175
120
01377
142
014
6214
72
1711
1736
2849
2917
2954
Beeswax, reference material
0
20
40
60
80
%T
1000 1500 2000 2500 3000 3500 4000 Wavenumbers (cm-1)
Figure 5.55: FT-IR spectrum of the sample J from Isabel Lambert, Male Baboon , c.1950 (above) and the one of reference beeswax (below)
Conclusions The organic analyses allowed for the identification of binding media applied in Male Baboon by Isabel Lambert-Rawsthorne. For the blue paint layers the artist used oil-based tube paints, as shown by GC-MS results. The low peak related to Oleic acid and the A/P ratios indicate the maturity of the dried film. The P/S molar ratios of the analysed samples are in the range of linseed oil values (1.5). Extraction tests, however, indicate that in the manufactured tube blue paints contain aluminium and/or zinc stearates in the paint formulation. Their presence has been detected after extracting metal soaps from the samples D and K and comparing results with the reference materials containing variable amounts of added stearates. Both samples, moreover, contain castor wax added as stabilisation agent. The combined results from FT-IR and GC-MS showed that the superficial thin white-greyish layer (sample J) is composed mainly of beeswax, with traces of drying oil. It is not completely clear whether the artist used beeswax on the surface, maybe to create a particular opaque effect, or that the beeswax was originated and had exuded out of the paint.
190

5.8 Ethel Walker, Models resting, c. 1930s Dame Ethel Walker (Edinburgh, 1861 – London, 1951) was the younger child of Arthur Walker and Isabella Robertson. She studied at Brondesbury, in London, where she met the drawing master Hector Caffierti. Following secondary school, Walker attended the Ridley School of Art, where she met the artist Clara Christian in 1880, starting with her a good friendship living, working and studying together. Furthermore she attended the Westminster School of Art, following the courses of the popular artist Frederick Brown, moving with him to the Slade School of Art for further study in 1893 [Pearce B. L., 1997] . Ethel Walker’s paintings are characterised by a large varieties of subjects, such as still life, landscapes, and mythological subjects, but is best known for her portraits of the female nude, paying particular attention to the detail of the sitters/models expression and individual temperaments [Earp T. W., 1952]. She was a supporter of the natural female form, often publicly rebuking other women for wearing makeup and heavy clothing that hid their form. For this reason her models were never allowed to wear makeup, lipstick, or nail polish during sittings. Walker's influences included in Greek and Renaissance art, as well as Chinese painting and Taoist philosophy. Although no longer considered a major artist in history, nowadays her work is still regularly displayed in exhibits at many art galleries, most notably The Gatehouse Gallery in Glasgow [Earp T. W., 1952].. One example of her nude portraits is Models Resting/Two Nudes (Figure 5.56), painted in the 1930s.
Figure 5.56: Ethel Walker, Models Resting/Two Nudes, c.1930s
191

Ethel Walker’s painting has been recently restored at the Courtauld Institute of Art. It contains some coloured areas affected by water sensitivity [Cooper A., 2010], as already noticed in several 20th century oil paintings. In order to obtain possible insight into the causes for water sensitivity, analyses of the binder and organic additives were requested. Experimental Samples provided for the analysis are listed in Table 5.7.
Table 5.7: list of analysed samples from Ethel Walker, Models Resting/Two Nudes, c.1930s
Sample # Description 1 Blue paint layer from the cover of the sofa 2 Red paint layer from the cover of the sofa 3 Brown paint layer from the floor, 4 Blue paint layer from a tacking margin left
Inorganic characterisation analyses were done with light microscopy and SEM-EDX by Anna Cooper at CIA, while FT-IR, XRF and GC-MS analyses were performed at RCE. Results Sample 1 This fragment was sampled from a blue area (from the cover of the sofa) which shows water sensitivity. Figure 5.57 displays XRF spectrum of sample 1 and illustrates the presence of lead (Pb), calcium (Ca), zinc (Zn), cobalt (Co), copper (Cu), chrome (Cr), aluminium (Al) and sulphur (S). The presence of Mg, found in the EDX analysis, could not be confirmed. These elements refer not only to the surface of the sample, as XRF can undergo the pictorial superficial layers. The blue coloration is linked to the presence of Co, possibly as Cobalt Blue (cobalt aluminate, CoAl2O4), while the green nuance of the sample could be due to Cr and Cu elements. The Pb and Ca peaks suggest the use of lead white (lead carbonate, 2PbCO3·Pb(OH)2) and calcium carbonate (CaCO3) in the grounding layers. Also Zn is normally related to the presence of a white pigment (zinc oxide, ZnO), but in this case it is not clear whereas it has been used in the ground or as a whitening pigment for the painted layers or as a dispersion agent (zinc stearate, Zn(C18H35O2)2) added to industrial paints to increase the stability of the suspension of pigment in a oily binder. These considerations are consistent with the light microscopy and punctual EDX analysis by Anna Cooper, who also registered the presence of barium sulphate in the bottom layer [Cooper A., 2010].
192

0 5 10 15 200x-ray energy (keV)
Tube Voltage: 40.0 kV current: 1.1 uA
AlS
Ca
Cr
Co CuZn
Zn
Pb
Pb
Pb
Figure 5.57: XRF spectrum of sample 1 from Ethel Walker, Models Resting/Two Nudes, c.1930s
FT-IR analysis (Figure 5.58) confirms the presence of calcium and lead carbonates mixed together, identified by the characteristic frequencies at 1795 (Ca), 1736 (Pb), 1395 (which encloses the strong peak around 1420 for CaCO3 and the one around 1370 for PbCO3), 870, 711 (Ca) and 678 (Pb) cm-1. The peaks at 1712, 1254, 1168, 1086 cm-1 could refer to a lipidic binder used as a painting medium, although the identification is made difficult by the strong presence of inorganic carbonates.
637
678
711
80
087
0
103
710
86
1168
125
4
1395
152
4
171
2
1736
1795 2
509
2853
2923
3404
0
10
20
30
40
50
60
70
80
90
100
%T
1000 1500 2000 2500 3000 3500 4000 Wavenumbers (cm-1)
Figure 5.58: FT-IR-ATR spectrum of sample 1 from Ethel Walker, Models Resting/Two Nudes, c.1930s
193

, ,
6 8 10 12 14 16 18 20Time (min)
0
10
20
30
40
50
60
70
80
90
100R
elat
ive
Abu
ndan
ce
Oxy Oxy OxyGlyGly Gly2C10 C14C12 GlyC20
2C9 C16
C18
C192C8
C22
Figure 5.59: Total ion current chromatogram of the pictorial sample 1 from Ethel Walker, Models
Resting/Two Nudes, c.1930s after transesterification and GC-MS analysis Figure 5.59 reports the GC-MS chromatogram of the sample 1, wherein the characteristic drying oil compounds are present as short-chain fatty acids (C9-C14), saturated long-chain fatty acids (C16-C22), dicarboxylic acids (2C7-2C10), unsaturated (C18:1), oxidised C18 fatty acids and glycerol. The unsaturated fatty acids, original abundant components in oil film, are not present anymore, reflecting the maturity of the medium. In the same way, the presence of oxidised fatty acids indicates that oxidation occurred in the film. The A/P ratio (azelaic- to palmitic acid) is 2.8, showing a high proportion of dicarboxylic acid esters in the dried film. The ratio between azelaic and suberic acid is 4.8, value which could indicate that during oil preparation a pre-heat treatment took place. The palmitic- to stearic acid ratio (P/S) is 2.7: this value is included in the ranges traditionally referred to walnut or poppy seed oils [Mills J. R., 1966]. Nevertheless, the presence of significant percentage of arachidic (C20) and behenic (C22) acids (see Figure 5.58, at 17.57 and 19.32 min) are more probably linked to the use of sunflower oil: it contains on average 3-6% (by weight of total fatty acids) of palmitic acid, 1-3% of stearic acid, 0.6-4% of arachidic acid and 0.8% of behenic acid. In addition, sunflower has knowingly been employed by 20th century manufacturers as a cheaper non-yellowing binding medium, sometimes as a substitute for traditional drying oils, in particular replacing walnut oil and its relatively expensive production. It is a fluid, slow-drying oil (containing more than 50-60% of linoleic acid) with a slightly yellow colour: for its properties it resembles poppy seed oil, although in general it is inferior to it.
194

The medium in sample 1 may be a mixture of pre-heated linseed oil (as suggested by the high amount of suberic acid in relation to azelaic acid) and sunflower oil (as suggested by long chain saturated fatty acids). There is no indication of metal stearate added to the paint formulation, since the GC-MS analysis on the same sample after extraction and transesterification does not show a P/S ratio lower than 1. This would imply that Zn, Mg and Al are not present in the paint as added stearates, unless the materials were added in very low concentrations. Sample 2 This sample comes from an area of red paint (from the cover of the sofa). The sample was not analysed with EDX nor XRF but it is assumed to contain vermillion. The sensitivity to solvents may be related to a poorly dried and underbound paint [Cooper A.,2010]. , ,
6 8 10 12 14 16 18 20Time (min)
0
10
20
30
40
50
60
70
80
90
100
Rel
ativ
e A
bund
ance
GlyGlyGly
Gly C22C20
C19
C18
C16
2C8
2C9
Figure 5.60: Total ion current chromatogram of the pictorial sample 2 from Models Resting after
transesterification and GC-MS analysis Very similar to sample 1, this pictorial fragment has also a typical GC-MS chromatogram of a drying oil medium (Figure 5.60). The main components detected (as methyl esters) are long chain saturated fatty acids, dicarboxylic acids produced after oxidative scission of unsaturated acids and oxidised C18 acids due to the unsaturated fatty acids in the oil film. The characteristic molar ratio values of fatty acids amounts are similar to those of sample 1: the A/P ratio is 2, the azelaic-to suberic acid ratio is 5 and the P/S is 2.8. In this case, as well, the amount of arachidic and behenic acids could indicate the use of sunflower oil in mixture with linseed oil. No indication for the addition of neither metal soap nor waxy materials was found.
195

Sample 3 This fragment was sampled from the brown area, from the left part of the painting. According to the conservator, this area does not exhibit water sensitivity. XRF results for the brown sample are displayed in Figure 5.61: elements such as lead (Pb), iron (Fe), mercury (Hg), calcium (Ca), zinc (Zn), cobalt (Co), cupper (Cu), chrome (Cr), aluminium (Al) and sulphur (S) have been registered. As noticed for sample 1, the presence of Pb and Ca peaks might be associated to lead white (lead carbonate, 2PbCO3·Pb(OH)2) and calcium carbonate (CaCO3) used in the grounding layers. Cobalt, chrome and cupper are in all probability due to the presence of a blue shade (see sample 1). Iron and mercury are the potential responsible for the red-brown coloration: the first present as red-yellow colouring earths (iron oxides), while the second as vermilion (mercury sulphide, HgS).
0 5 10 15 200x-ray energy (keV)
Tube Voltage: 40.0 kV current: 1.1 uA
Al
S
Ca
Cr
Fe
Co
Cu
Zn
Hg
Pb
Hg
Pb
Pb
Figure 5.61: XRF spectrum of the sample 3 from Ethel Walker, Models Resting/Two Nudes, c.1930s
Concerning the organic analysis, some significant differences have been recorded. In the GC-MS chromatogram (Figure 5.62), glycerol, short-chain fatty acids, dicarboxylic acids, saturated long-chain fatty acids, unsaturated and oxidised fatty acids (Table 5.9). At 15.44 min, unsaturated C18:1 fatty acid is recorded, while at 17.39 min unsaturated C18:2 is present: the presence oleic and linoleic acid indicates a poorly dried paint film. In the same way, the A/P ratio has a value lower than 1, namely 0.78: this could be another indication of the low degree of oxidation processes in the paint film. The P/S ratio is 2.6 and it may indicate here the presence of sunflower as well. In this paint, the slow-drying oil could have interfered with the curing processes because of its considerable amount of oleic and linoleic acids in the composition, respectively 14-35% and 44-75% on average (much higher than in linseed oil). There are no suggestions on pre-heated treatments, as the ratio azelaic-to suberic is quite high (>6).
196

, ,
6 8 10 12 14 16 18 20Time (min)
0
10
20
30
40
50
60
70
80
90
100R
elat
ive
Abu
ndan
ce
C20 C22GlyGly GlyC18:2
C19C18:1
C18
C16
2C8
2C9
Figure 5.62: Total ion current chromatogram of the pictorial sample 3 from Ethel Walker, Models
Resting, c.1930s after transesterification and GC-MS analysis Sample 4 Few comments can refer to the GC-MS analysis on sample 4 (Figure 5.63), taken from a blue area showing water sensitivity. The EDX spectra indicated that cerulean blue (cobalt stannate) is present, with some viridian (chromium oxide green), an earth pigment (Fe peaks in EDX), but there were also some Mg and Al peaks in this analysis. On surface crystal contains elemental Mg and S, which might indicate the presence of magnesium sulphate hydrate, which in turn may account for the water sensitivity of the paint [Cooper A. 2010]. The organic analysis of the paint fragment shows the presence of saturated fatty acid, dicarboxylic acids and oxidised fatty acids. The ratio for samples 4 can be summarised: A/P=1, azelaic- to suberic=8, P/S=3. These results are consistent with previously analysed sample, indicating the presence of unheated sunflower oil (see previous discussions).
197

, ,
6 8 10 12 14 16 18 20Time (min)
0
10
20
30
40
50
60
70
80
90
100R
elat
ive
Abu
ndan
ce
Oxy
OxyOxy GlyGly
2C9
C16
C18
C19
C20C22
2C82C10
Gly Gly
Figure 5.63: Total ion current chromatogram of the pictorial sample 4 from Models Resting after
transesterification and GC-MS analysis Conclusions According to the organic analyses, media employed in Ethel Walker’s painting ModelsResting/Two Nudes are all drying oils.
Paints from blue and red areas (samples 1, 2 and 4) were well dried and matured, as unsaturated fatty acids are not detectable anymore. The A/P ratios (higher than 1) also reflects that oxidation took place in the binding film, while the azelaic-to suberic ratio (around 4-5) for sample 1 and 2 indicate that the oil media were subjected to slight pre-heat treatment, whereas for the media sample 3 and 4 no heat treatment was used. For the identification of the kind of oils, not only P/S ratios have been considered (whose values are about 3) but also the presence of significant percentage of special fatty acids, as arachidic (C20) and behenic (C22). These data suggest the use of pre-heated linseed oil mixed with sunflower oil. The brown-red paint (sample 3) shows a different degree of oxidation processes occurred during film formation: the presence of oleic and linoleic acid and the A/P ratio having a value lower than 1 show that the paint has not fully dried. The medium is probably a mixture of linseed oil (not pre-heated, in this case) and a slow drying oil as sunflower. GC-MS procedure couldn’t detect any lipidic (as metal stearates) or waxy additives in the paints.
198

5.10 F. Breton, Three urchin Boys, c. 1920s Unfortunately no information was found on the artist’s name, life and carrier. The author painted in the 1920s the picture named Three urchin Boys. This painting is the only varnished painting studied in this research.
Figure 5.64: F. Breton, Three Urchin Boys, c.1920s, private collection
Experimental During restoration at the Courtauld Institute of Art, it was registered that there were some areas of the painting showing sensitivity towards the use of water, saliva and alcohol used as cleaning solvents. The presence of a tacky brown coating layer was observed as well [Gleave R., 2010]. Three samples were taken (listed in Table 5.8) in order to understand the composition of the paints and the painting execution technique.
199

Table 5.8: list of analysed samples from F. Breton, Three Urchin Boys, c.1920s
Sample # Description 7 Brown drip of tacky coating 9 Red/brown paint layer(from brick wall, right hand side) 10 Black paint layer(from the door, left hand side)
Inorganic constituents have been detected at CIA by using light microscopy and SEM/EDX analysis. FT-IR analyses of the water sensitive paint layers were performed by Suzan de Groot at RCE. Organic material have been analysed through a new GC-MS procedure, especially designed for 20th century oil paint. Results Sample 7 FT-IR analysis on sample 7, composed of a brown drip of tacky coating, indicated the presence of oil and/or natural resin. With this technique, it is not possible to distinguish between drying oil and natural resin [de Groot S., 2010,]. This sample was analysed with GC-MS and the resulting chromatogram is reported in Figure 5.65. , ,
6 8 10 12 14 16 18 20Time (min)
10
20
30
40
50
60
70
80
90
100
Rel
ativ
e A
bund
ance
OxyOxyOxy GlyGly Gly
Gly
2C10
2C8
C19C18
C16
2C9
DeHydroAb
C12
C14 Oxy
Figure 5.65: Total ion current chromatogram of the sample 7 from F. Breton, Three Urchin Boys,
c.1920s after transesterification and GC-MS analysis
200

The presence of characteristic drying oil compounds, such as short-chain fatty acids (C9-C14), dicarboxylic acids (2C7-2C10), saturated long-chain fatty acids (C16-C20), unsaturated (C18:1) and oxidised C18 fatty acids was registered. The oil medium has dried and oxidised well, as the almost total absence of unsaturated fatty acids and the presence of oxidised fatty acids suggest. The high proportion of dicarboxylic acid, in particular azelaic, in the dried film is shown by the A/P ratio (azelaic- to palmitic acid) value, which is 4.3; the ratio azelaic- to suberic acid is 4 which suggests that the preparation of the oil medium involved pre-heat treatment. The palmitic- to stearic acid ratio (P/S) is 1.3, value considered within the traditional range for linseed oil medium [Mills J. S.., 1987]. The sample contains small amounts of dehydroabietic acid as well. This is a characteristic compound of (aged) natural diterpenoid resin, such as colophony or rosin. Terpenic resins have been used traditionally as the main ingredient in paint varnishes, but in many 20th century manufactured paints natural resins were included in the formulations and they can be considered an adulterant in oil paints; in particular, colophony has been added in large quantities for cheaper products. In this case, a thick layer of coating has been noticed on the surface using UV-light microscopy [Gleave R., 2010], so it is more probable that the artist employed a varnish containing colophony mixed with pre-heated oil. This use of colophony-based varnish may explain the stickiness and the cracks on the surface: paints and varnishes containing this natural resin are normally tacky, weak and become dark and crack [Mayer R., 1964].
Sample 9 The sample 9 was taken from a red/brown paint layer, from the brick wall on the right side. According to EDX (punctual) analysis, this work of art was painted on a commercially primed canvas, with a ground composed of barium sulphate (BaSO4) and lead white (2PbCO3·Pb(OH)2). Painted layers contain synthetic iron oxide pigments (including Mars red), zinc white (ZnO), raw umber, calcium carbonate (CaCO3) and barium sulphate (pigments extender). The presence of zinc in the pictorial layers may be linked to the addition of zinc stearate to the paint to act as a dispersion agent [Gleave R., 2010, personal communication] FT-IR analysis confirms the presence of barium sulphate and detected also gypsum (CaSO4·2H2O), zinc carboxylate and the use of a drying oil [de Groot S., 2010]. The GC-MS chromatogram of sample 9 is displayed in Figure 5.66: The characteristic molar ratio values of fatty acids amounts have been calculated. Although the value 2.3 for A/P ratio indicates a high proportion of dicarboxylic acid in the film, the disproportion between oleic and stearic acids let consider that the oil binder is not completely mature. The ratio azelaic-to suberic is 4.5, indicating that the oil medium preparation involved pre-heating treatment . The P/S ratio (1.6) indicates linseed oil, while the residue after extraction has a slight low P/S (0.8) showing a high stearic acid content. As stearates (whose P/S ratio is 0.6-0.7) are not extractable, their presence is reflected in increased relative amounts of stearic acid in the paint after extraction. So, P/S=0.8 is an indication of the presence of stearates, possibly zinc stearates as reported also in FT-IR results.
201

Among the characteristic drying oil compounds, it has to be outlined the presence of two uncommon fatty acids: erucic (Z-13-docosenoic) and gondoic (Z-11-eicosenoic) acids (peaks at 17.38 and 19.18 min). As seen for the case of Fontana pink Olii, hese unsaturated fatty acids are considered biomarkers as they are quite abundant only in oils obtained from rapeseed oil. According to artists’ handbooks, olive oil or rapeseed oil and glycerine were added to avoid industrial chalk-grounds to dry fast: these compounds help to keep the ground elastic but cause the colours later to turn dark and become sticky [Doerner M., 1984]. It is not completely clear whether the commercial primed canvas of the Three Urchin Boys was prepared with the addition of rapeseed oil or rapeseed oil was mixed with linseed oil as a binding medium. Dehydroabietic acid (colophony) is present here too and probably it comes from the natural resin-based varnish (see Sample 7). , ,
6 8 10 12 14 16 18 20Time (min)
10
20
30
40
50
60
70
80
90
100
Rel
ativ
e A
bund
ance
OxyOxy
OxyOxy C20:1 C22:1
GlyGly
Gly
Gly
Gly
Gly
C19
C18:1
2C9
2C8
2C10
C16
C18
Figure 5.66: Total ion current chromatogram of the sample 9 from F. Breton, Three Urchin Boys,
c.1920s after transesterification and GC-MS analysis Sample 10 This fragment was sampled from a black paint layer, from the door on the left side. The presence of a drying oil and Prussian blue (Fe4[Fe(CN)6]3) was identified by FT-IR analysis [S. de Groot, 2010]. The results of GC-MS analysis (Figure 5.67) are partially consistent with those of sample 9. Erucic and gondoic acids, the rapeseed oil biomarkers, and high amount of oleic acid have been detected here too: this leads to the same considerations as for Sample 9.
202

However, the fatty acids profile is characteristic for drying oils (short-chain fatty acids, dicarboxylic acids, saturated long-chain fatty acids, unsaturated (C18:1) and oxidised C18 fatty acids). The azelaic- to palmitic acid ratio is 2.3, as in sample 9, while in this case there are no indications of heating treatments during oil preparation (the azelaic-to suberic acid ratio is higher than 8). The P/S ratio is 1.5 suggesting the presence of linseed oil; unlike sample 9, there are no indications for added metal stearates. , ,
6 7 8 9 10 11 12 13 14 15 16 17 18 19 20Time (min)
0
10
20
30
40
50
60
70
80
90
100
Rel
ativ
e A
bund
ance
C14C12 OxyOxy
OxyOxyOxy
C20:1
C22:1GlyGly
Gly
GlyGly
Gly
C19
C18:1
C18
C16
2C10
2C8
2C9
Figure 5.67: Total ion current chromatogram of the sample 10 from F.Breton, Three Urchin Boys,
c.1920s after transesterification and GC-MS analysis Conclusions In Breton’s painting entitled Three Urchin Boys media employed are drying oils. The work of art presents a very thick coating layer, which results to be composed of natural resin based varnish, possibly colophony mixed with pre-heated linseed oil. Red-brown and black paints have been analysed as oil paints since their P/S molar ratios are in the range of linseed oil values (1.5). But they present a particularity, as samples contain a significant amount of unsaturated fatty acids related to the employ of rapeseed oil (erucic and gondoic). Nevertheless, the use of rapeseed oil is not completely clear: it could have been used in the industrial priming to avoid a fast drying process or it may be added in the formulation of oil paints to enhance the fluidity of the medium or as a cheaper adulterant in the paint composition. Extraction tests, then, indicate that the manufactured tube red-brown paint contain a percentage of (zinc) stearates higher than 5% of the paint formulation.
203

5.10 Summary This chapter discusses real cases where modern oil formulations were studied and identified in works of art which presented uncommon degradation phenomena. Problems were related in particular to an unexpected vulnerability of painted layers and a rather water-solvent sensitivity. This study has not answered to all the problems arisen from the conservators, but at least may have widen the knowledge of the constituent materials of 20th century oil paints. The cases present a wide range of situations which are comparable with the studyof the manufactured oil paints (Chapter 4.2). Paint formulations generally contain drying oils (such as linseed oil and poppy seed oil), slow-drying oils (safflower oil, sunflower and rapeseed oil) and non-drying oil (such as castor oil), in mixture or by themselves. Pigments in tube oils are preferably the modern cadmium, zinc, titanium, barium and cobalt-based pigments industrially produced since the end of the 19th century. Furthermore, dispersion agents (metal soaps) and stabilisers (castor wax and natural waxes) were quite extensively detected. Except for Willem De Kooning who declare to add safflower oil and other slow-drying oils to his paintings, it is not clear whether artists really chose the binding materials or they used commercial already-made oil paints without knowing the exact composition.
204

CONCLUDING REMARKS AND FUTURE PERSPECTIVES
The current research aimed to provide a piece of information in the knowledge of artistic materials and production techniques. The subject of this study is 20th century manufactured artists’ oil. Oil paints under investigation are relatively recent (from 1920 to 1990); nevertheless, not a lot is known about modern formulations, as labels usually do not completely indicate components present in tube oils. Beyond the need of knowledge about artistic materials, the main issue of this study is connected with the state of conservation of numerous modern and contemporary oil paintings. Even if produced in the last 60-80 years, they generally suffer of deterioration phenomena never or rarely observed in traditional oil paintings. In particular, 20th century oil paintings have commonly conservation problems related to the fragility and the sensitivity of the superficial layers. These phenomena could be understood in relation to two main reasons. The first is associated with the modifications in materials and formulations in oil manufacture. Since 1841, when the collapsible tube for preserving paints was invented, several different, new and unusual materials were introduced: different kinds of oil (non only drying oils, but also semi-drying or non drying oils as adulterants or substitute for more expensive oils); pigments adulterated by the presence of fillers, extenders which often lower the price but also the quality; dispersion agents such as metal soaps to help pigments to disperse into oil; stabilisers such as waxes and waxy-like and many others. The second main reason is correlated with the role of modern artists. It must be said that the relationship between artists and artistic materials was completely changed by the introduction of industrial already-made oil paints. While in the past the artist was aware about the materials used and often he prepared the materials by himself, from the late 19th century artists generally did not know exactly what they employed in the artistic production. Furthermore, 20th century artists have generally been more devoted to the messages conveyed by their art creation than to the materials used to achieve their message. It is not uncommon that painters mixed up different binding media, artistic material, common objects etc. In front of this complex situation, the need of going deeper in the problem arises. Numerous analytical and technical studies refer to traditional oil paints and paintings. Few researches have been done on modern and contemporary oil paints, even less dealt with the changes of constituents and productions techniques of manufactured artists’ oil paints. As the traditional approach was too restrictive for modern painting and the traditional analytical methods could not provided exhaustive answers, a more comprehensive approach has been set. Not only by the assessment of an innovative gas chromatographic-
205

mass spectrometric method to performed organic analyses on lipidic binders and additives, but also by allowing for a new approach which takes into consideration all the “new” components. At this purpose, reconstructed oil films (prepared following modern industrial formulations) and historical and modern commercial oil paints were the vehicle to approach modern and contemporary oil paintings. The analytical results from laboratory-prepared oil paints show that it is possible to determine quantitatively the constituents of binding materials and additives (even if present in low %), by individuating not only the initial constituents of the paints but also their transformations over time (drying, curing, ageing). GC-MS results, in particular, provided interesting results. Molar ratios commonly used as evaluating parameters for traditional oil paints seemed to be not completely exhaustive for modern oil formulation. Additive-containing films, in fact, have different sources of lipidic materials (such as metal stearates and castor wax) which have a role in the characterization paint films. The traditional evaluating parameters do not take into account these new inputs. During this research, the parameters have been implemented with the addition of new complementary parameters (such as S/G and A/S) which differently take into consideration the lipidic addition due to dispersion agents and stabilisers. The results from the tube oil paints (whose labels provided few information about the real content) were very interesting, showing the presence of additives, fillers and extenders in a huge variety. Results were expressed, as before described for laboratory-prepared films, including parameters which count also new materials in commercial formulations. The chemometric approach by using clustering and PCA was very useful in individuating precise groups which refer to different kinds of paints (and additives). It was possible to differentiate between two main groups. One includes samples from laboratory-prepared oil films and from commercial paints which contain more than 5% of stearates added in the paint formulation. The other group contains samples whose formulation differs in particular in the presence of very low (less than 2%) or the absence of stearates. Real cases were modern and contemporary oil paintings which presented different typologies of deterioration. A multidisciplinary approach was possible thanks to the collaboration with restorers and conservators. The researches performed on case studies confirmed the applicability of the GC-MS method and the introduction of new parameters in analysing modern oils. Results show a variety of different cases and different materials employ in the so-called oil technique. This term seems to be too restrictive, considering the huge variations in lipidic materials possibly used by artists. The fundamental question is however linked to the choice of artists. Were they actually free of choosing materials, did they mix materials or were they somehow “forced” by the industrial manufacturer products? To find an answer to these questions could help in the knowledge standing behind the development of conservative methodologies and objective choices in conservation. Far away from giving definitive conclusions, this study is a work-in-progress which aims to open the path for new and deeper investigations on many sectors of modern and contemporary materials in oil painting.
206

GLOSSARY
12hydroxyC18/12hydc18 12-hydroxy stearic acid 12hydroxymetC18/12hydmetC18 12-methoxy stearic acid 2C8 Suberic acid 2C9 Azelaic acid 2C10 Sebacic acid amu Atomic mass unit AS Aluminium stearate BIoil linseed oil + Black Iron Oxide
C9 Nonanoic acid C12 Lauric acid C14 Myristic acid C16 Palmitic acid C18 Stearic acid C18:1 Oleic acid C18:2 Linoleic acid C18:3 Linolemic acid C19 Nonadecanoic acid C20 Arachidic acid C20:1 Gondoic acid C21 Heneicosanoic acid C22 Behenic acid C22:1 Erucic acid CAS Castor Oil
CBoil Linseed oil + Cobalt blue
CG cold-pressed and alkaline refined linseed oil + Chrome oxide Green
CGAS10P CG +10% Aluminium Stearate CGAS2P CG + 2% Aluminium Stearate CGAS20P CG +20% Aluminium Stearate CGAS30P CG +30% Aluminium Stearate CGAS5P CG +5% Aluminium Stearate Cgoil Linseed oil + chrome green
CIA Courtald Institute of Art
Cmoil linseed oil + Caput Mortuum
Cooil Linseed oil +cadmium orange
207

COT Cottonseed
Croil Cadmium Red + linseed oil
Cyoil Linseed oil + cadmium yellow
GC-MS gas chromatography-mass spectrometry Gly Glycerol/glycerol derivatives HCO hydrogenated castor oil (or castor wax) ICN Instituut Collectie Nederland (until 2010), currently
RCE Lwoil Linseed oil + lead white
M+ molecular ion MiBAC Ministero dei Beni e delle Attività Culturali (Italian
Minister of Cultural Heritage) m/z mass over charge ratio oilLW Linseed oil +Lead White
Oxy/Oxo Oxidised fatty acid
PBoil Linseed oil + Prussian Blue
POP Poppy seed oil
PopAl Poppy seed oil + alizarin
PopSic Poppy seed oil + 1% siccative
RCE Ex ICN ROOH hydroperoxide
RS cold-pressed and alkaline refined linseed oil + Raw Sienna
RSAS10P RS +10% Aluminium Stearate RSAS2P RS + 2% Aluminium Stearate RSAS20P RS +20% Aluminium Stearate RSAS30P RS +30% Aluminium Stearate RSAS5P RS +5% Aluminium Stearate RSoil Linseed oil + raw sienna
SAF Safflower oil
STOIL Stand oil
SUN Sunflower oil
TG-DSC Thermogravimetry-differential scanning calorimetry TIC Total ion current tR Retention time TUN Tung oil
U2 cold-pressed and alkaline refined linseed oil + Ultramarine Blue
U2AS10P U2 +10% Aluminium Stearate U2AS20P U2 +20% Aluminium Stearate U2AS2P U2 + 2% Aluminium Stearate
208

U2HCO U2 + 2% Hydrogenated castor oil U2HFA U2+Extra hydrolysed fatty acid (from linseed oil) U2ZS10P U2 +10% Zinc Stearate U2ZS15P U2 +15% Zinc Stearate U5HCO U2 + 5% Hydrogenated castor oil U2ZS20P U2 +20% Zinc Stearate U2ZS2P U2 +2% Zinc Stearate U2ZS30P U2 +30% Zinc Stearate UniVe Univesity Ca’ Foscari of Venice W&N Winsor & Newton ZS zinc stearate ZWoil Linseed oil+ zinc white
209

BIBLIOGRAPHY AA VV, Artists' Pigments. A Handbook of their His ory and Characteristics, Oxford University press 1994
t
t
t
- t
ADROVER GRACIA I., Applicazioni della spettrofotometria IR allo studio dei Beni Culturali, Padova, Il Prato 2001 AGEE W. C., FAXON S. C. (editors), Coming of Age. Arte americana dal 1850 al 1950, Milano Skira 2008 AHAD N., Isabel Rawsthorne: The woman who was a walking work of art, Yorkshire Post online 2008 ALFASSI Z. B. (editor), The Chemistry of Free Radicals: Peroxyl Radicals, New York, Wiley & Sons 1997 ANDREOTTI A., BONADUCE I., COLOMBINI M. P. ET ALII, Combined GC/MS analytical procedure for the characterization of glycerolipid , waxy, resinous, and proteinaceous materials in a unique paint microsample, in Analytical Chemistry, vol. 78 (2006), pp. 4490-4500 ARGAN G. C., L’arte moderna. 1770/1970, Firenze, Sansoni 1980 ASPERGER A., ENGEWALD W., FABIAN G., Thermally assis ed hydrolysis and methylation – a simple and rapid online derivatization method for the gas chromatographic analysis of natural waxes, in Journal of analytical and applied pyrolysis, vol. 61 (2001), pp. 91-109 BARILLI R., L’arte contemporanea. Da Cézanne alle ultime tendenze, Milano, Feltrinelli 1984 BASILE G. (editor), Conservazione e restauro nell’arte contemporanea. Atti del convegno, Argomenti di Arte e Critica, anno III, Roma 1995, proceedings BATCHELOR D., Cromofobia. Storia della paura del colore, Milano, Bruno Mondadori 2001 BAUMER U., KOLLER J., FRIEDLER I., ET ALII, Binding media analysis at the Doerner Institut, MaSC workshop 2007 BAZZI M., Abecedario Pit orico, Vicenza, Neri Pozza Editore 1993 BEAL G. F., ANDERSON H. V., LONG J. S., Studies in the drying oils. XVI – X Ray s udy of some natural and synthetic varnish resins, in Industrial engineering chemistry, vol. 24 (1932),
210

pp. 1068-1072 BENSI P., La vita del colo e, Neoes.e, Genova 2002 r
t
r
-
f
t
t
t r
f r r
t t r-
s r
t r
BISCONTIN G., ZENDRI E., RIATO S. ET ALII, Il problema metodologico nello studio di opere moderna: la grande pit ura di Sironi a Ca’ Foscari, in Architettura e materiali del Novecento, Atti del Convegno di Bressanone 2004, p. 775-783, proceedings BLETON J., MEJANELLE P., SANSOULET J. ET ALII, Characterization of neut al sugars and uronic acids after methanolys and trimethylsilylation for recognition of plant gums, in Journal of Chromatography A, vol. 720 (1996), pp. 27-49 BONADUCE I., BRECOULAKI H., COLOMBINI M. P. ET ALII, Gas chromatographic mass spectrometric characterisation of plant gums in samples from painted works of art, in Journal of Chromatography A, vol. 1175 (2007), pp. 275-282 BONISSONI G., Introduzione alla spettrometria dei Raggi X di fluorescenza, Milano, Etas libri 1977 BOON J. J., PEULVE S. L., VAN DER BRINK O. E. ET ALII, Molecular aspects o mobile and stationary phases in ageing tempera and oil pant films, in Early Italian Paintings Techniques and Analysis, Maastricht 9-10 October 1996, pp. 35-56, proceedings BOON J. J., LEARNER T., Analytical mass spectrometry of artists' acrylic emulsion paints by direct temperature resolved mass spectrometry and laser desorption ionisation mass spectrometry, in Journal of Analytical and Applied Pyrolysis, vol. 64 (2002), 327-344 BOON J. J., VAN DER WEERD J., KEUNE K., Mechanical and chemical changes in Old Master paintings dissolution, metal soap formation and remineraliza ion processes in lead pigmented ground/intermediate paint layers of 17th century paintings, ICOM Committee for Conservation preprints, vol. 1 (2002), pp. 401-406 BRANDI C., Scrit i sull’arte contemporanea, Torino, Einaudi 1976 BRANDI C., Teoria del restauro, Torino, Einaudi 2000 BRERETON R. G., Multivariate pat e n recognition in chemometrics, in Data Handling in Science and Technology, vol. 1, Amsterdam, Elsevier 1992 BURMESTER A., Investigation of paint media by dif e ential scanning calorimet y (DSC), in Studies in Conservation, vol. 37 (1992), pp. 73-81 BURNSTOCK A., VAN DER BERG K. J., DE GROOT S. ET ALII, An investiga ion of wa e sensitive oil paints in the 20th century paintings, in LEARNER T. J. S., SMITHEN P., KRUEGER J. ET ALII, Modern Paint Uncove ed, Los Angeles, The Getty Conservation Institute 2007, pp. 177-188 BURNSTOCK A., personal communication, 2010 CAPPITELLI F., I leganti nella pit ura del XX secolo. Storia e indagini diagnostiche, in Ke mes, vol. 47 (2002), pp. 35-40
211

CAPPITELLI F., LEARNER T., CHIANTORE O., An initial assessment of thermally assisted hydrolysis and methylation-gas chromatography/mass spectrometry for the identification of oils f om dried paint films, in Journal of Analytical and Applied Pyrolysis, vol. 63 (2002), pp. 339-348
r
I
t
/
-
t
tt r
CASTELLANI L., FERRANTELLI P., SINIBALDI M. ET ALII, dentification of proteinaceous adhesives in the wood backing of Piero della Francesca's painting Pala of Saint Bernardino: a gas chromatographic study, in Journal of Cultural Heritage, vol. 2 (2001), pp. 209-215 CHALLINOR J. M., A rapid simple pyrolysis derivatisation gas chromatography-mass spectrometry method for profiling of fat y acids in trace quantities of lipids, in Journal of Analytical and Applied Pyrolysis, vol. 37 (1996), pp. 185-197 CHALLINOR J. M., Review: the development and applications of thermally assisted hydrolysis and methylation reactions, in Journal of Analytical and Applied Pyrolysis, vol. 61 (2001), pp. 3-34 CHECA-MORENO R., MANZANO E., MIRÓN G. ET ALII, Comparison between traditional strategies and classification technique (SIMCA) in the identification of old proteinaceous binders, in Talanta, vol. 75 (2008), pp. 697-704 CHIANTORE O., RAVA A., Conservare l'arte contemporanea. Problemi, metodi, materiali, ricerche, Milano, Electa 2005 CHIANTORE O., RIEDO C., SCALARONE D., Gas chromatography-mass spectrometric analysis of products from on-line pyrolysis silylation of plant gums used as binding media, in International Journal of Mass Spectrometry, vol. 284 (2008), pp. 35-41 CHIAVARI G., IOELE M., PRATI S. ET ALII, Py-GC MS of the synthetic polymers used in past restorations on Giotto's mural paintings at the Scrovegni Chapel (Padova), in Chromatographia, vol. 56 (2002), pp. 763-767 CHIAVARI G., FABBRI D., PRATI S., Effect of pigments on the analysis of fat y acids in siccative oils by pyrolysis methylation and silylation, in Journal of analytical and applied pyrolysis, vol. 74 (2005), pp. 39-44 CHRISTIAN G.D., O’ REILLY J. E., Analisi strumentale, Padova, Piccin Editore 1985 CHRISTIE W. W., Preparation of ester derivatives of fa y acids for ch omatographic analysis, in Advances in Lipid Methodology, vol. 2 (1993), pp. 69-111 CHRISTIE W. W., Lipid Analysis, The Oily Press, Bridgwater 2003 CILIBERTO E., SPOTO G., Modern Analytical Methods in Art and Archeology, New York, Wiley Interscience 2000 COE R. H., MYSELS K. J., SMITH G. H., Bound and free acid in aluminum soap prepared by precipitation, in Journal of Colloid Science, vol. 3 (1948), pp. 293-302
212

COLLINS J., WELCHMAN J., CHANDLER D. ET ALII, Techniques of modern art, New Jersey, Chartwell Books 1983 COLOMBINI M. P., MODUGNO F., SILVANO F. ET ALII, Characterization of the balm of an egyptian mummy from the seventh century B. C., in Studies in Conservation, vol. 45 (2000), pp. 19-29 COLOMBINI M. P., CECCARINI A., CARMIGNANI A., on ch omatography characterization of polysaccharides in ancient wall paintings, in Journal of Chromatography A, vol. 968 (2002), pp. 79-88
I r
tt
f
t
r
r
COLOMBINI M. P., MODUGNO F., FUOCO R. ET ALII, A GC-MC study on the deterioration of lipid paint binders, in Microchemical Journal, vol. 73 (2002), pp. 175-185 COLOMBINI M. P., GIACHI G., MODUGNO F., RIBECHINI E., Cara erizazione dei materiali organici. Il caso del Cantiere delle navi antiche di Pisa, Firenze-Pisa 2007 COLOMBINI M. P., MODUGNO F., Organic mass spectrometry in art and archaeology, New York, Wiley & Sons 2009 COOPER A., personal communication, 2010 COTTE M., CHECROUN E., SUSINI J. ET ALII, Kinetics of oil saponi ication by lead salts in ancient preparations of pharmaceutical lead plasters and painting lead mediums, in Talanta, vol. 70 (2006), pp. 1136-1142 CREMONESI P., L’uso dei Solventi Organici nella pulitura di opere policrome, Padova, Il Prato 2004 DE CHIRICO G., Piccolo trattato di tecnica pit orica, Milano, Scheiwiller 2001 DE GROOT S., personal communication, 2010 DELCROIX G., HAVEL M., Phénomènes physique et peinture artistique, Bayeux, EREC 1988 DE LUCCHI O., unpublished materials 2010 DERRICK M. R., STULLICK D. C., Inf ared Spectroscopy in Conservation Science, Getty Publications 2000 DI MARTINO E., Bevilacqua La Masa 1908―1993. Una fondazione per i giovani artisti, Venezia, Marsilio 1994 DI MARTINO E., Storia della Biennale di Venezia. 1895-2003, Torino, Papiro Arte 2003 DI MARTINO E., Arte contempo anea: Conservazione e restauro, Venezia, Società editrice Umberto Allemandi 2005 DOERNER M., The materials of artists and their use in painting, San Diego/New York/London, Harvest 1984
213

DORFLES G., Ultime tendenze nell’arte oggi. Dall’informale al Neo-ogge uale, Milano, Feltrinelli 1999
tt
tt
ttt
t
DOMÉNECH-CARBÓ M. T., BITOSSI G., OSETE-CORTINA L. ET ALII, Characterization of polyvinyl resins used as binding media in paintings by pyrolysis-silylation-gas chromatography-mass spectrometry, in Analytical Bioanalytical Chemistry, vol. 391 (2008), pp. 1371-1379 DUBOIS V., BRETON S., LINDER M. ET ALII, Fa y acid profiles of 80 vegetables oils with regard to their nutritional potential, in European Journal of Lipid Science Technology, vol. 109 (2007), pp. 710-732
EARP T. W. ET ALII, Ethel Walker, Frances Hodgkins, and Gwen John. A memorial exhibition,
London, Arts Council of Great Britain 1952 ERHARDT D., Paints based on drying oil media, in Painted wood: History and conservation, proceedings, Williamsburg 1994 ERHARDT D., TUMOSA S. C., MECKLENBURG M. F., Long-term chemical and physical processes in oil paint films, in Studies in conservation, vol. 50 (2005), pp. 143-150 EVANS D., MATTHEWS J. B., The structure of aluminium stearate grease, in Journal of Colloid Science, vol. 9 (1954), pp. 60-69 FAVARO M., BIANCHIN S., VIGATO P. A., VERVAT M., The palet e of the Macchia Italian artist Giovanni Fa ori in the second half of the XIXth century, in Journal of Cultural Heritage, vol. 11 (2010), pp. 265-278
FELLER R. L. (editor), Artists Pigments. A Handbook of Their History and Characteristics, New York, Oxford University Press, 1957
FELLER R. L., Accelerated aging. Fotochemical and thermal aspects, U.S.A., The Getty Conservation Institute 1994 FERRIANI B., PLOEGER R., POLI T. ET ALII, Lucio Fontana. Between tradition and innovation, in Art d'aujourd'hui. Patrimoine de demain. Conservation et restauration des œuvres contemporaines, Paris 2009 FONTI D., Gino Severini. La danza 1909-1916, Milano, Skira 2001 FORTI G., Antiche ricette di pit ura murale, Verona, Cierre Edizioni 1998 FREZZATO F. (editor), Il libro dell’arte di Cennino Cennini, Vicenza, Neri Pozza editore 2004 GARDNER H. A., Paint technology and tests, New York, McGraw-Hill Book Co. 1911 GAULD BEARN J., The chemistry of paints, pigments and varnishes, London, Ernest Benn 1923
214

GETTENS R. J., STOUT G. L., Painting Materials. A Short Encyclopedia, New York, Dover
Publications 1966
GIMENO ADELANTADO J. V., MATEO CASTRO R., DOMÉNECH CARBÓ M. T., dentification of lipid binders in paintings by gas ch omatography. Influence of the pigments, Journal of Chromatography A, vol. 922 (2001), pp. 385-390
Ir
ttt
r
t t
fr -
GLEAVES R., personal communication, 2010 GÓMEZ-BRANDÓN M., LORES M., DOMÍNGUEZ J., A new combination of extraction and derivatization methods that reduces the complexity and prepara ion time in determining phospholipid fa y acids in solid environmental samples, in Bioresource Technology, vol. 101 (2010), pp. 1348-1354 GRANDOU P., PASTOUR P., Peintures et vernis, Les costituants : liants, solvants, plastificants, pigments, colorants, charges, adjuvants, Paris, Hermann Editeurs des sciences et des arts 1988 GROB R. L. (editor), Modern Practice of Gas Chromatography, New York, Wiley & Sons 1995 GRÖSSL M., HARRISON S., KAML I. ET ALII, Characterisation of natural polysaccharides (plant gums) used as binding media fo artistic and historic works by capillary zone electrophoresis, in Journal of Chromatography A, vol. 1077 (2005), pp. 80-89
HEDLEY, G., Solubility parameters and varnish removal: a survey, in The Conservator, vol. 4 (1980), pp. 12-18
HORIE C. V., Materials for Conservation, Oxford (UK), Butterworth Heinemann 1987
HÜBSCHMANN H., Handbook of GC/MS. Fundamentals and applications, New York, Wiley & Sons 2009
IZZO F. C., La Pit ura Murale Italiana del Novecento: studio della tecnica pit orica in opere di Cherubini, Sironi, Bacci e Campigli, Tesi di Laurea Specialistica in Scienze Chimiche per la Conservazione ed il Restauro, (Tutor professor ZENDRI E.) Venezia 2007 JAKAB A., HÉBERGER K., FORGÁCS E., Comparative analysis o different plant oils by high-performance liquid ch omatography atmospheric pressure chemical ionization mass spectrometry, in Journal of Chromatography A, vol. 976 (2002), pp. 255-263 KEUNE K., HOOGLAND F., BOON J. ET ALII, Comparative study of the effect of traditional pigments on artificially aged oil paint systems using complementary analytical techniques, in ICOM Committee for Conservation preprints, vol. 2 (2008), pp. 833-842 KEUNE K., personal communication, 2010 KLAUS H., Karel Appel painter, Amsterdam, Strengolt 1962
215

KOLLER J., BAUMER U., The scientific analysis of traditional western coatings. Systematic approach and case studies, in Preprints of the 17th International Symposium on the Conservation and Restauration of Cultural Property, Conservation of Urushi objects, Tokyo 1993, pp. 178-192 KORUS R. A., MOUSETIS T. L., Polymerization of safflower and rapeseed oils, in Journal of the American Oil Chemists’ Society, vol. 61 (1984), pp. 537-540 KRUG M., An artist's handbook. Materials and techniques, London, Laurence King Publishing, 2007 LAKE S., The relationship between style and technical procedure: Willem de Kooning's paintings of the late 1940s and 1960s, Phd disseration thesis, University of Delaware, 1999 LAKE S., LOMAX S. Q., SCHILLING M. R., A technical investigation of Willem de Kooning's paintings from the 1960s and 1970s, in ICOM Committee for Conservation preprints, vol. 1 (1999), pp. 381-385 LANGURI G. M., VAN DER HORST J., BOON J. J., Chracterisation o a unique 'asphal ' sample f om the early 19
f t r
t
th century Hafkenscheid painting materials collection by analytical pyrolysis MS and GC/MS, in Journal Analytical and Applied Pyrolysis, vol. 63 (2002), pp. 171-196
LAURIE A. P., The Painters Methods and Materials, New York, Dover Publications 1988
LAZOTTI L., Leggere l’arte. Una proposta di analisi testuale, Milano, Franco Angeli Editore 1987 LAZZARI M., CHIANTORE O., Drying and oxidative degradation of linseed oil, in Polymer degradation and stability, vol. 65 (1999), pp. 303-313 LEARNER T. J. S., Analysis of modern paints, Los Angeles, The Getty Conservation Institute 2004 LE PARLOUËR P., Simultaneous TG-DSC: a new technique for thermal analysis, in Thermochimica Acta, vol. 121 (1987), pp. 307-322 LITJENS S., Nederlandse Olieverf ubes uit de Twintigste Eeuw, dissertation MA, University of Amsterdam, 2010 LONG J. S., SMULL J. G., A control method for boiling drying oils, in Industrial engineering chemistry, vol. 17 (1925), pp. 138-141 LONG J. S., KNAUSS C. A., SMULL J. G., The boiling of linseed oil, in Industrial and engineering chemistry, vol. 19 (1927), pp. 62-65 LONG J. S., ZIMMERMANN E. K., NEVINS S. C., Studies in the drying oils. VIII – Adsorption of liquids by oil gels, in Industrial and engineering chemistry, vol. 20 (1928), pp. 806-811 LONG J. S., KITTELBERGER W. W., SCOTT L. K. ET ALII, Studies in the drying oils. XI –
216

Monomolecular films of blown and heat-bodied oils and their constituent fa y acids and esters on water surfaces, in Industrial engineering chemistry, vol. 21 (1929), pp. 950-955
tt
rt
f
r
-I
I
,f
LONG J. S., CHATAWAY H. D., Studies in the dryin oils. XIV - Rate of Oxidation of linseed oil at 160° C, in Industrial engineering chemistry, vol. 23 (1931), pp. 53-57 LONG J. S., RHEINECK A. E., BALL JR. G. L., Studies in the d ying oils. XVII – Influence of several fac ors on the mechanism of drying oil films, in Industrial engineering chemistry, vol. 25 (1933), pp. 1086-1091 LONG J. S., REYNOLDS J. B., NAPRAVNIK J., Studies in the drying oils. XVIII – Specific heat andeatures ofheating drying oils, in Industrial engineering chemistry, vol. 26 (1934), pp. 864-868 LO RUSSO S., La diagnostica nel settore dei beni culturali, Ravenna, Longo Editore 1998 LUXÁN M. P., DORREGO F., Reactivity of earth and synthetic pigments with linseed oil, in Surface Coatings International, vol. 8 (1999), pp. 390-402 MACARO G., personal communication, 2010 MALLÉGOL J., LEMAIRE J., GARDETTE J., Drier influence on the curing of linseed oil, in Progress in organic coatings, vol. 39 (2000), pp. 107-113 MALTESE C. (editor), Le tecniche a tistiche, Milano, Mursia 1973 MANZANO E., NAVAS N., CHECA-MORENO R. ET ALII, Preliminary study of UV ageing process of proteinaceous paint binder by FT R and principal component analysis, in Talanta, vol. 77 (2008), pp. 1724-1731 MARINACH C., PAPILLON M.C., PEPE C., dentification of binding media in works of art by gas chromatography-mass spectrometry, in Journal of Cultural Heritage, vol. 5 (2004), pp. 231-240 MAROGER J., The secret formules and techniques of the masters, London/New York, Hacker art books 1948 MARRIFIELD M. P., Original treatises on the arts of painting , New York, Dover publications 1967 MASINI L. V., L’arte del Novecento: dall’Espressionismo al Multimediale, vols. 1-2, Firenze, Giunti 1989 MASOOMA A., CHEUNG J., WELLS R. J., Direct on-column derivatisation in gas chromatography. II. Comparison of various on-column methylation reagents and the development of a new selective methylation reagent, in Journal of Chromatography A, vol. 738 (1996), pp. 43-55 MASOOMA A., CHEUNG J., WELLS R. J., Direct on-column derivatisation in gas chromatography. III. On-column benzylation reagents and the development of 3 5-bis (trifluoromethyl)benzyl-dimethylphenylammonium fluoride, an ef icient new on-column
217
derivatisation reagent, in Journal of Chromatography A, vol. 738 (1996), pp. 57-72 MASSART D. L. ET ALII, Chemometrics: a Textbook, in Data Handling in Science and Technology, vol. 2, Amsterdam, Elsevier 2003 MASSCHELEN-KLEINER L., Les solvants, Bruxelles, ICCROM 1981 MASSCHELEN-KLEINER L., Liants, vernis et adhésifs anciens, Bruxelles, ICCROM 1978 MASSOBRIO G., PORTOGHESI P., Album del Liberty, Bari, Editori Laterza 1975 MASSOBRIO G., PORTOGHESI P., Album degli Anni T enta, Bari, Editori Laterza 1978 r
.
.,
t
-
MATTEINI M., MOLES A., Scienza e restauro, Nardini Editore, Firenze 1984 MAYER R., The artist’s handbook of materials and techniques, New York, Viking 1940 MAYER R., The artist’s handbook of materials and techniques, Revisited Edition, New York, Viking 1965 MC MASTER M. C., GC/MS A pratical user's guide, New York, Wiley & Sons 2008 MC NAIR H., BONELLI E Basic Gas Chromatography, Palo Alto, Varian 1969 MEILUNAS R. J., BENTSEN J. G., STEINBERG A., Analysis of aged paint binders by FTIR spectroscopy, in Studies in Conservation, vol. 35 (1990), pp. 33-51 MELCHIORRE DI CRESCENZO M., ZENDRI E., Studio del comportamento di pit ure acriliche su supporto murario. Lo stato dell’arte, in IGIIC- Lo stato dell’arte, Spoleto, Nardini editore, vol. 6 (2008), pp. 443-452, proceedings MILLS J. S., The gas chromatographic examination of paint media. Part I. Fatty acid composition and identification of dried oil film, in Studies in conservation, vol. 11 (1966), pp 92-108 MILLS J. S., WHITE R., The organic chemistry of museum objects, New York, Butterworth Heinemann 1987 MILLS J. S., WHITE R., The organic chemistry of museum objects, Butterworth Heinemann, London 1994 MILLS L., Water sensitive oil paints: an experimental investigation carachterising the caused of the phenomena and analysis of a case study painting Les animaux, 1961, by Karel Appel, post graduate diploma in the Conservation of easel paintings, 2008 MILLS L., BURNSTOCK A., DUARTE F. ET ALII, Water sensitivity of modern artists' oil paint, in ICOM Committee for Conservation, vol. 2 (2008), pp. 651-659 MONTAGNA G., I pigmenti, Firenze, Nardini editore 1993
218

ODLYHA M., nvestigation of the binding media of paintings by thermoanalytical and spectroscopic techniques, in Thermochimica acta, vol. 269/270 (1995), pp. 705-727
I
r
r
t
I f . t r
t
f t
rt ,
t
f
ORMSBY B.A., TOWNSEND J. H., SINGER B. W. ET ALII, British Watercolour cakes f om the Eighteenth to the early Twentieth century, in Studies in Conservation, vol. 50 (2005), pp. 45-66 ORMSBY B. A., LEARNER T., The effects of wet surface cleaning treatments on acrylic emulsionartists' paints – a review of recent scientific resea ch, in Reviews in Conservation, vol. 10 (2009), pp. 29-41 PARALUPI R., L’arte moderna a Venezia, Cerignola, Tip. Editrice della Scienza e dilet o 1903 PARISOT C., Modigliani, Paris, Terrail 1993 PASINI R., n ormale S ati Uniti Eu opa Italia, Bologna, Clueb 1995 PAVANELLO G., STRINGA N. (editors) La pit ura nel Veneto. Il Novecento, vol. 1, Milano, Electa 2006 PEARCE B. L., Dame Ethel Walker. An essay in reassessment, Exeter (Eng), Stride Publications 1997 PEROCCO G., Le origini dell’Arte Moderna a Venezia (1908-1920), Treviso, Editrice Canova 1972 PERRY J., Introduction to Analytical Gas Chromatography, New York, Marcel Dekker 1981 PERUSINI T., Le pitture murali di A ro Basaldella tra il 1936 ed il 1955:analisi s orico-tecnica e problemi di conservazione, in Architettura e materiali del Novecento, Atti del Convegno di Bressanone 2004, pp. 249-260, proceedings PERUSINI T., MANCUSO C., ZENDRI E. ET ALII, Il muralismo italiano degli anni T enta: problemi tecnici ed analitici. Un excursus attraverso l’analisi di pit ure di Sironi, De Chirico Cagli, Afro e Sbisà, in Sulle pitture murali, Atti del convegno di Bressanone 2005, proceedings
PHENIX, A., The swelling of artists' paints in organic solvents. Part 1 - a simple method formeasuring the in-plane swelling of unsupported paint films, Journal of the American Instiute for Conservation vol. 41 (2002), pp. 43-60
PHENIX, A., The swelling of artists' paints in organic solvents. Part 2 - compara ive swelling powers of selected organic solvents and solvent mixtures, Journal of the American Institute for Conservation, vol. 41 (2002), pp. 61-90
PIAZZA R., academic material, 2005 PICCIRILLO A., SCALARONE D., CHIANTORE O., Comparison between of -line and on-line derivatisation methods in the characterisation of siccative oils in paint media, in Journal of Analytical Applied Pyrolysis, vol. 74 (2005), pp. 33-38
219

PILPEL N., Properties of organic solutions of heavy metal soaps, in Chemical Reviews, vol. 63 (1963), pp. 221-234 PIQUE’ F., Il progetto “Organic Materials in Wall Paintings”: risultati della prima fase, in Atti del Convegno Lo stato dell’Arte, IV Congresso Nazionale IGIIC, 2006, pp. 125-132, proceedings PITTHARD V., STANEK. S., GRIESSER M. ET ALII, Gas Chromatography-Mass Spectrometry of binding media from early 20th century paint samples from Arnold Schönberg’s palette, in Chromatographia, vol. 62 (2005), pp. 175-182 PITTHARD V., GRIESSER M., STANEK S. ET ALII, Study of complex organic binding media systems on artworks applying GC-MS analysis: selected examples from the Kunsthistorisches Museum, Vienna, in Macromolecular Symposium, vol. 238 (2006), pp. 37-45 PIVA G., La tecnica della pit ura ad olio e del disegno artistico, Milano, Hoepli 1985 t
tt
f r
PLATER J. M., DE SILVA B., GELBRICH T. ET ALII, The characterisation of lead fa y acid soaps in 'protrusions' in aged traditional oil paint, in Polyhedron, vol. 22 (2003), pp. 3171-3179 PLOEGER R., SCALARONE D., CHIANTORE O., Thermal analytical study of the oxidative stability of artists’ alkyd paints, in Polymer Degradation and Stability, vol. 94 (2009), pp. 2036-2041 PONTIGGIA E. (editor), Da Boccioni a Sironi. Il mondo di Margherita Sarfatti (catalogo della mostra), Milano, Skira 1997 POPE M. I., JUDD M. D., Dif e ential thermal analysis. A guide to the Tecnique and Its Applications, London, Heyden & Son 1977 PRATI S., CHIAVARI G., CAM D., Dsc application in the conservation field, in Journal of Thermal analysis and Calorimetry, vol. 66 (2001), pp.315-327 PUGLIESE M., I materiali sintetici nell’arte contemporanea, in Kermes, vol. 30 (1997), pp. 21-30 REEDY T. J., REEDY C. L., Statistical Analysis in Art Conservation Research, U.S.A., The Getty Conservation Institute, 1988 RIOUT D., L’arte del ventesimo secolo. Protagonisti, temi, correnti, Torino, Einaudi 2002 ROBINET L., CORBEIL M., The characterisation of metal soaps, in Studies in Conservation, vol.48 (2003), pp. 23-40 RODIER C., STERNBERG, RAULIN F. ET ALII, Chemical derivatization of amino acids for in situ analysis of Martian samples by gas chromatography, in Journal of Chromatography A, vol. 915 (2001), pp. 199-207 ROGALA D., LAKE S., MAINES C., MECKLENBURG M., Condition problems related to zinc oxide underlayers: examination of selected abstract expressionist paintings from the collection of
220

the Hirshhorn Museum and sculpture garden, Smithsonian Insti ution, in Journal of the American Institute for Conservation, 2010 (in press)
t
r
t
,
f
tt f
ttr
RUDNIK E., SZCZUCINSKA A., GWARDIAK H. ET ALII, Comparative studies of oxidative stability of linseed oil, in Thermochimica Acta, vol. 370 (2001), pp. 135-140 RUHRBERG K., SCHNECKENBURGER M., FRICKE C., HONNEF K., Art of the 20th Century. Painting Sculpture New Media Photog aphy, 2 vols., Köln, Taschen 1998 SABIN A. H., Linseed oil, in The Journal of industrial and engineering chemistry, vol. 3 (1911), pp. 84-86 SALTMARSH P., unpublished material, 2008 SARFATTI M., Storia della pit ura moderna, Roma, Cremonese edizioni 1930 SCARSELLA P., NATALE P., Terre colorate naturali e tinte murali a base di terre, Torino, Stamperia Artistica nazionale 1989 SCHAEFER I., VON SAINT-GEORGE C., LEWERENTZ K. (editors), Impressionismo. Dipingere la luce.Le Tecniche nascosste di Monet Renoir e Van Gogh, Milano, Skira 2008 SCHILLING M. R., The glass transition of materials used in conservation, in Studies in Conservation, vol. 34 (1989), pp. 110-116 SCHILLING M. R., KHANJIAN H. P., Gas chromatographic analysis of amino acids as ethyl chloroformate derivatives. III. Identification o proteinaceous binding media by interpretation of amino acid composition data, in ICOM Committee for Conservation preprints, vol. 1 (1996), pp. 211-219 SCHILLING M. R., KHANJIAN H. P., Gas chromatographic determination of the fatty acid and glycerol content of lipids. I. The effect of pigments and aging on the composition of oil paints,in ICOM Committee for Conservation preprints, vol. 1 (1996), pp. 220-227 SCHILLING M. R., KHANJIAN H. P., CARSON D. M., Fa y acid and glycerol content of lipids; effecto ageing and solvent extraction on the composition of oil paints, in Techne, vol. 5 (1997), pp. 71-78 SCHILLING M. R., CARSON D. M., KHANJIAN H. P., The composition of solvents extracts from oil paints, in Art et Chimie - La Couleur conference, Paris, Louvre, September 1998, proceedings SCHILLING M. R., CARSON D. M., KHANJIAN H. P., Evaporation of fa y acids and the formation of ghost images by f amed oil paintings, in Western Association of Art Conservators Annual Meeting, October 1998, proceedings SCHNEIDER U., KENNDLER E., Identification of plant and animal glues in museum objects by GC-MS, after catalytic hydrolysis of the proteins by the use of a cation exchanger, with simultaneous separation from the carbohydrates, in Fresenius Journal of Analytical Chemistry, vol. 371 (2001), pp. 81-87
221

SCICOLONE G. C., Il restauro dei dipinti contemporanei. Dalle tecniche di intervento tradizionali alle metodologie innovative, Firenze, Nardini Editore 1993 SCHÖNEMANN A., FRENZEL W., UNGER A. ET ALII, An investigation of the fa y acid composition of new and aged tung oil, in Studies in Conservation, vol. 51 (2006), pp. 99-110
tt
,
tt
t t
r
-f
SÉBÉDIO J. L., GRANDGIRARD A., Cyclic fatty acids: natural sources, formation during heat treatment, synthesis and biological properties, in Progress Lipid Research, vol. 28 (1989), pp. 303-336 ŞERIFAKI K., BÖKE H., YALÇIN S., IPEKOĞLU B., Characterization of materials used in the execution of historic oil paintings by XRD, SEM-EDS TGA and LIBS analysis, in Materials characterization, (2008), pp. 1-9 SGARBI V. (editor), Da Corot a Picasso da Fa ori a De Pisis. La Phillips Collection di Washington e la Collezione Ricci Oddi di Piacenza, Milano, Silvana Editoriale 2008 ŠIMŮNKOVÁ E., BROTHÁNKOVÁ-BUCIFALOVÁ J., ZELINGER J., The influence of cobalt blue pigmentson the drying of linseed oil, in Studies in Conservation, vol. 30 (1985), pp. 161-166 SKOOG D. A., WEST D. M., HOLLER F. J., Fondamenti di chimica analitica, Napoli, EdiSES 2000 SMITHEN P., Salvador Dali’s Forgotten Horizon 1936, in Tate paintings conservation online, 2007 SOLDANO A., personal communication, 2010 SONNTAG N. O. V., Fat splitting, in Journal of American Oil Chemists’ Society, vol. 56 (1979), pp. 729a-732a SPEZZANI P., Riflettoscopia e indagini non distrut ive. Pit ura e grafica, Milano, Olivetti 1992
STOLOW, N., The action of solvents on drying oil films, Parts I & II, Journal of the Oil and Colour Chemists Association, vol. 40 (1957), pp. 377-402, pp. 488-499
STRINGA N. (editor), Venezia '900. Da Boccioni a Vedova, Venezia, Marsilio 2006 SUTHERLAND K. R., Solvent extractable components of oil paints films, Amsterdam, FOM Institutes for Atomic and Molecular Physics 2001 SUTHERLAND K. R., Derivatisation using m-(trifluoromthyl)phenyltrimethylammoniumhydroxide of organic materials in artworks for analysis by gas ch omatography-mass spectrometry: Unusual reaction products with alcohols, in Journal of chromatography A, vol. 1149 (2007), pp. 30-37 TEMPEST H., Water sensitive oil paint: an experimental investigation, with case studies, urther carachterizing the causes of the phenomenon, post graduate diploma in the Conservation of easel paintings, 2009
222

TEMPEST H., BURNSTOCK A., SALTMARSH P. ET ALII, Progress in the water sensitive oil project, in New Insights into the Cleaning o Paintings, Valencia, 2010 (in press) f
t
t
.,t f
I
TIOZZO C. B., La pit ura veneziana e la sua tecnica dalle origini al Novecento, Venezia, Editoria Universitaria 2002 TODESCHINI R., Introduzione alla Chemiometria, Napoli, EDiSES 1998 TONIATO T. (editor), Modernità allo specchio: arte a Venezia (1860-1960), Venezia, Supernova 1995 TORRACA G., Solubility and solvents for conservation problems, ICCROM 1984 TSAKALOF A. K., BAIRACHTARI K. A., CHRYSSOULAKIS I. D., Pitfalls in drying oils identification in art objects by gas chromatography, in Journal of Separation Science, vol. 29 (2006), pp. 1642-1646 TSANG J. S., ERHARDT D., Current research on the effects of solvents and galled and aqueous cleaning system on oil paint films, in Journal of the American Institute for Conservation, vol. 31 (1992), pp. 87-94 TULLOCH A. P., Composition of some na ural waxes, in Cosmetics and Perfumery, vol. 89 (1974), pp. 53-54 TUMAN S. J., CHAMBERLAIN D., SCHOLSKY K. M. ET ALII, Differential scanning calorimetry study of linseed oil cured with metal catalysts, in Progress in organic coatings, vol. 28 (1996), pp. 251-258 TUMOSA C. S., A brief history of aluminum stearate as a component of paint, in Waac Newsletter, vol. 23 (2001), pp. 10-11 TUMOSA C. S., MECKLENBURG M. F., The influence of lead ions on the drying of oils, in Reviews in conservation, vol. 6 (2005), pp. 39-47 TURNER J. H. W., KEMP S. G., HARSON S. E., The function of aluminium complexes as structure-modifiers for paint, in Journal of the oil & colour chemists’ association, vol. 41 (1958), pp. 769-779 VAN DEN BERG J. D. J., VAN DEN BERG K. J., BOON J. J Chemical changes in curing and ageing oil paints, in ICOM Commit ee or conservation preprints, vol. 1 (1999), pp. 248-253 VAN DEN BERG J. D., VAN DEN BERG K. J., BOON J. J., dentification of non-cross-linked compounds in methanolic extracts of cured and aged linseed oil-based paint films using gas chromatography-mass spectrometry, in Journal of Chromatography A, vol. 950 (2002), pp. 195-211 VAN DEN BERG K. J., BOON J. J., PASTOROVA I. ET ALII, Mass spectrometric methodology for the analysis of highly oxidized diterpenoid acids in Old Master paintings, in Journal of mass spectrometry, vol. 35 (2000), pp. 512-533
223

VAN DEN BERG K. J., personal communication, 2009 VAN DER DOELEN G. A., VAN DEN BERG K. J., BOON J. J., Comparative chromatographic and mass-spectromic studies of triterpenoid va nishes: f esh material and aged samples f om paintings, in Studies in Conservation, vol. 43 (1998), pp. 249-264
r r r
-
t
rf
t r
tt
VAN DER DOELEN G. A., VAN DEN BERG K. J., BOON J. J. ET ALII, Analysis of fresh triterpenoid resins and aged triterpenoid varnishes by high-performance liquid chromatographyatmospheric pressure chemical ionisation (tandem) mass spectrometry, in Journal of Chromatography A, vol. 809 (1998), pp. 21-37 VAN DER WEERD, J., VAN LOON A., BOON J.J., FTIR studies of the effects of pigments on the ageing of oil, in Studies in Conservation, vol. 50 (2005), pp. 3-22 VAN KEULEN H., personal communication, 2010 VASARI G., Le vite de più eccellenti architetti, pit ori et scultori italiani, Torino, Einaudi 1986 VICENTE J. P., GIMENO ADELANTADO J. V., DOMÉNECH CARBÓ M. T. ET ALII, Identification of drying oils used in pictorial works of art by liquid chromatography of the 2-nitrophenylhyd azides derivatives o fatty acids, in Talanta, vol. 64 (2004), pp. 326-333 VOLPIN S., APPOLONIA L., Le analisi di labora o io applicate ai beni artistici policromi, Padova, Il Prato 2002 WAMPLER T. P., Introduction to pyrolysis-capillary gas chromatography, in Journal of Chromatography A, vol. 842 (1999), pp. 207-220 WEGER M., Die Sauerstoffaufnahme der Oele und Harze, Leipzig, Eduard Baldamus 1899 WEISS J., Organic aluminium compounds in drying oils, in Journal of Oil Colour, vol. 40 (1957), pp. 863-989 WEXLER H., Polymerization of drying oils, in Chemical Reviews, vol. 64 (1964), pp. 591-611 WIJNBERG L., VAN DEN BERG K. J., BURNSTOCK A. ET ALII, Jasper Johns’ Untitled 1964-65, in Art matters, (2007), pp. 68-80
WILLMORE, J., An examination of the solvent- induced swelling of leached oil paint, 3rd year Diploma project report, Dept. of Conservation & Technology, Courtauld Institute of Art, University of London, 2000
WOLBERS R., Methods of cleaning Painted Surfaces, Archetype Publications, London 2000 WOO K., KIM J., New hydrolysis method for extremely small amount of lipids and capillary gas chromatographic analysis as N(O)-tert.-butyldimethylsilyl fa y acid derivatives compared with methyl ester derivatives, in Journal of Chromatography A, vol. 862 (1999), pp. 199-208
224

WOUTERS J., VERHECKEN A., The coccid insect dyes: HPLC and computerized diode-array analysis of dyed ya ns, in Studies in Conservation, vol. 34 (1989), pp. 189-200 r ZENDRI E., Problematiche e sviluppi futuri nell’ambito dello studio delle opere contemporanee, in IAZURLO P., VALENTINI F. (editors), Conservazione dell’Arte contemporanea, temi e problemi, Padova, Il Prato 2005, pp. 47-56 www.aaa.si.edu/exhibits www.bojmans.nlwww.cobra-museum.nlwww.cool.conservation-us.org www.lefranc-bourgeois.comwww.lipidlibrary.co.ukwww.maimeri.itwww.oldholland.comwww.salvador-dali.orgwww.talens.comwww.tate.org.uk www.winsornewton.com
225

AKNOWLEDGEMENTS I would like to thank many people and institutions who helped me during these three years of PhD. You all have been important in supporting this research! I’d like to acknowledge first my academic “family” at the University Ca’ Foscari of Venice. Thanks to my tutor, Prof. Guido Biscontin, for giving me the possibility to develop this research with autonomy but never alone! Thanks to Prof. Elisabetta Zendri (and her family) for helping and supporting me in many occasions (also by bike!). Thanks to Prof. Ottorino De Lucchi and Prof. Fabrizio Fabris for sharing with me fundamental knowledge on fatty acids, contemporary art and fishing skills. Important to thank Prof. Rossano Piazza and Dr. Marco Vecchiato for introducing me in a multivariate chromatografic world. Thanks to all my colleagues (friends!) of Via Torino for sharing with me nice laboratory and culinary moments; in particular I’d like to thank Dr. Luca Bellotto for giving life to my molecules! I’d also like to thank my “family” at ICN-RCE in Amsterdam. Thanks to Dr. Klaas Jan van den Berg for welcoming and supporting me during my cold year in the Netherlands! Many thanks to Dr. Henk van Keulen for teaching me everything about GC-MS..I know how difficult it was for you to share the lab with a noisy Italian girl! Thanks to Dr. Marjolein Wassink, Dr. Luc Megens and Dr. Suzanne de Groot for helping me with the analysis (but not only!). Thanks to all the interns, the people-of-the-dungeon: Beatriz, Ana, JoAnn, Yanneke, Alex, Pedro and many others…thanks for sharing picnics in Museumplein and sorry if you heard me so many times saying: “Wait, wait, wait! I have to inject!” A special thanks to the conservators and conservation scientists who shared with me information and provided samples from great modern and contemporary paintings. A special thank to Dr. Barbara Ferriani and the Fondazione Lucio Fontana. Thanks to Dr. Louise Wijnberg from the Stedelijk Museum of Amsterdam. I’d like also to thanks Katrien Keune and Annelies van Loon for sharing one Dalì’s sample! Thanks to Dr. Aviva Burnstock for the interesting works of art from the CIA. Many thanks also to all the people who help me while writing this thesis: thanks to Cesare and Suvi&Kustaa for their “Dutch” hospitality, to Elena&Leo for the moving of the tables, to my personal graphic Alberto and to my proof-reader Alexia! Finally I need to thank my real family, they know why. And thanks to Francesco…he also knows why! Grazie!
226

Estratto per riassunto della tesi di dottorato
L’estratto (max. 1000 battute) deve essere redatto sia in lingua italiana che in lingua inglese e nella lingua straniera eventualmente indicata dal Collegio dei docenti. L’estratto va firmato e rilegato come ultimo foglio della tesi.
Studente: FRANCESCA CATERINA IZZO matricola: 955473
Dottorato: SCIENZE CHIMICHE
Ciclo: XXIII
Titolo della tesi : 20th Century Artists’ Oil Paints: A Chemical-Physical Survey
Abstract (Italiano):
Il progetto sviluppato in questa tesi di Dottorato in Scienze chimiche riguarda lo studio di opere di arte moderna e contemporanea con particolare riferimento alle indagini sui materiali e tecnologie usate dagli artisti. Per tale ricerca sono state sviluppate delle tecniche di indagine innovative, specifiche in grado di rilevare non solamente la natura dei materiali utilizzati ma anche il loro comportamento nel tempo. Questa ricerca si è inserita in un progetto internazionale riguardante appunto la conservazione dell’arte contemporanea (20th Century Oil Paint Project, promosso dall'ICN The Netherlands Institute for Cultural Heritage, Amsterdam in collaborazione con il Courtauld Institute of Art, London, il Tate, London e il Getty Conservation Institute, Los Angeles). Il lavoro di tesi ha portato in particolare alla messa a punto di metodologie di studio dei leganti oleosi attraverso l’impiego di tecniche cromatografiche (GC-MS, Py-GC-MS) che hanno consentito di individuare la presenza e il ruolo di alcuni additivi industriali (come gli stearati di alluminio e zinco e l'olio di ricino idrogenato) che fino ad ora non erano stati rilevati in maniera significativa,ma che rivestono un ruolo importante nella produzione industriale dei materiali dell’arte. La ricerca è stata condotta dapprima su campioni pittorici ad olio realizzati in laboratorio utilizzando leganti oleosi, pigmenti, siccativi e additivi impiegati nella moderna produzione industriale di colori ad olio. I film pittorici sono stati analizzati mediante l’uso di svariate tecniche analitiche, tra cui la spettrometria infrarosso in trasformata di Fourier (FT-IR), la spettrofotometria a raggi X (XRF), la Termogravimetria (TG), la Calorimetria Differenziale a Scansione (DSC) e la Gascromatografia abbinata alla Spettrometria di Massa (GC-MS). La parte sperimentale si è poi incentrata sullo studio di colori ad olio (a tubetto) provenienti da collezioni storiche di famose ditte produttrici di colori ad olio (come ad esempio Winsor&Newton, Talens, Old Holland, Maimeri). L’ultima parte della tesi è stata dedicata allo studio di significative opere moderne e contemporanee di artisti quali Lucio Fontana, Jasper Johns, Karel Appel, Willem de Kooning, Salvador Dalì, Henri Matisse, Isabel Lambert-Rawsthorne, Ethel Walker, etc. I risultati, oltre che a chiarire le situazioni sotto indagine, aprono una serie di nuove prospettive su settori finora poco approfonditi nella produzione artistica e tecnologica dell’arte moderna e contemporanea.

Abstract (English):
The research project developed in this PhD research in Chemical Sciences deals with the study of modern and contemporary works of art, focusing on materials and production techniques employed by artists. In this study innovative and specific analytical techniques have been optimised: the survey has been successful not only in detecting the nature of artistic materials used in the 20th century, but also in studying their behaviours over time. This PhD research has been part of an international project concerning the Conservation of Contemporary Art and has lead to the improvement of new methodologies to study proteinaceous and lipidic binding media by using chromatographic techniques (GC-MS, Py-GC-MS, HPLC). These methods have also allowed for the identification and the role of industrial additives (such as aluminium and zinc stearates and hydrogenated castor oil), which had been not fully studied previously. This part of the PhD research has been developed in the Netherlands, in the laboratories of the ICN (The Netherlands Institute for Cultural Heritage, Amsterdam), under the supervision of Dr. Klaas Jan van den Berg and Mr. Ing. Henk van Keulen. The research has been part of the international project called 20th Century Oil Paint Project, carried out at ICN in collaboration with Courtauld Institute of Art, London, Tate, London and Getty Conservation Institute, Los Angeles. The research was initially focused on the study of laboratory-reconstructed oil films, which were prepared with lipidic binders, additives, pigments and driers used by modern oil manufacturers. the films were studied by using several analytical techniques: FT-IR, XRF, TG-DSC and GC-MS. This study has lead to an improvement of analytical methodologies for the study of manufactured oil samples. Furthermore, the research focused on real samples taken from important modern paintings by Lucio Fontana, Jasper Johns, Karel Appel, Willem de Kooning, Salvador Dalì, Henri Matisse, Isabel Lambert-Rawsthorne, Ethel Walker, etc.
The obtained results are a further step in the knowledge of the materials used in artistic and technological production in Contemporary Art.
Firma dello studente ________________

DEPOSITO ELETTRONICO DELLA TESI DI DOTTORATO
DICHIARAZIONE SOSTITUTIVA DELL’ATTO DI NOTORIETA’ (Art. 47 D.P.R. 445 del 28/12/2000 e relative modifiche)
Io sottoscritto FRANCESCA CATERINA IZZO natA a …VENEZIA……… (prov. …VE… ) il 12/02/1982………………………… residente a CONEGLIANO in …VIA MONTICANO n.110 Matricola (se posseduta) 955473………… Autore della tesi di dottorato dal titolo: …20th Century Artists' Oil Paints: A Chemical-Physical Survey Dottorato di ricerca in …SCIENZE CHIMICHE………………………………………………………………………… (in cotutela con ……………………………………………………………………………………) Ciclo ……XXIII……………… Anno di conseguimento del titolo ………2009-2010 (2011 ESAME)……………
DICHIARO di essere a conoscenza: 1) del fatto che in caso di dichiarazioni mendaci, oltre alle sanzioni previste dal codice penale e dalle Leggi speciali per l’ipotesi di falsità in atti ed uso di atti falsi, decado fin dall’inizio e senza necessità di nessuna formalità dai benefici conseguenti al provvedimento emanato sulla base di tali dichiarazioni; 2) dell’obbligo per l’Università di provvedere, per via telematica, al deposito di legge delle tesi di dottorato presso le Biblioteche Nazionali Centrali di Roma e di Firenze al fine di assicurarne la conservazione e la consultabilità da parte di terzi; 3) che l’Università si riserva i diritti di riproduzione per scopi didattici, con citazione della fonte; 4) del fatto che il testo integrale della tesi di dottorato di cui alla presente dichiarazione viene archiviato e reso consultabile via internet attraverso l’Archivio Istituzionale ad Accesso Aperto dell’Università Ca’ Foscari, oltre che attraverso i cataloghi delle Biblioteche Nazionali Centrali di Roma e Firenze; 5) del fatto che, ai sensi e per gli effetti di cui al D.Lgs. n. 196/2003, i dati personali raccolti saranno trattati, anche con strumenti informatici, esclusivamente nell’ambito del procedimento per il quale la presentazione viene resa; 6) del fatto che la copia della tesi in formato elettronico depositato nell’Archivio Istituzionale ad Accesso Aperto è del tutto corrispondente alla tesi in formato cartaceo, controfirmata dal tutor, consegnata presso la segreteria didattica del dipartimento di riferimento del corso di dottorato ai fini del deposito presso l’Archivio di Ateneo, e che di
Mod. TD-Lib-09-a 1

conseguenza va esclusa qualsiasi responsabilità dell’Ateneo stesso per quanto riguarda eventuali errori, imprecisioni o omissioni nei contenuti della tesi; 7) del fatto che la copia consegnata in formato cartaceo, controfirmata dal tutor, depositata nell’Archivio di Ateneo, è l’unica alla quale farà riferimento l’Università per rilasciare, a richiesta, la dichiarazione di conformità di eventuali copie; Data _________________ Firma ________________________________
Autorizzo
- l’Università a riprodurre ai fini dell’immissione in rete e a comunicare al pubblico tramite servizio on line entro l’Archivio Istituzionale ad Accesso Aperto il testo integrale della tesi depositata; - l’Università a consentire:
- la riproduzione a fini personali e di ricerca, escludendo ogni utilizzo di carattere commerciale; - la citazione purché completa di tutti i dati bibliografici (nome e cognome dell’autore, titolo della tesi, relatore e correlatore, l’università, l’anno accademico e il numero delle pagine citate).
DICHIARO 1) che il contenuto e l’organizzazione della tesi è opera originale da me realizzata e non infrange in alcun modo il diritto d’autore né gli obblighi connessi alla salvaguardia di diritti morali od economici di altri autori o di altri aventi diritto, sia per testi, immagini, foto, tabelle, o altre parti di cui la tesi è composta, né compromette in alcun modo i diritti di terzi relativi alla sicurezza dei dati personali; 2) che la tesi di dottorato non è il risultato di attività rientranti nella normativa sulla proprietà industriale, non è stata prodotta nell’ambito di progetti finanziati da soggetti pubblici o privati con vincoli alla divulgazione dei risultati, non è oggetto di eventuali registrazione di tipo brevettuale o di tutela; 3) che pertanto l’Università è in ogni caso esente da responsabilità di qualsivoglia natura civile, amministrativa o penale e sarà tenuta indenne a qualsiasi richiesta o rivendicazione da parte di terzi. A tal fine: - dichiaro di aver autoarchiviato la copia integrale della tesi in formato elettronico nell’Archivio Istituzionale ad Accesso Aperto dell’Università Ca’ Foscari; - consegno la copia integrale della tesi in formato cartaceo presso la segreteria didattica del dipartimento di riferimento del corso di dottorato ai fini del deposito presso l’Archivio di Ateneo. Data _________________ Firma ________________________________ La presente dichiarazione è sottoscritta dall’interessato in presenza del dipendente addetto, ovvero sottoscritta e inviata, unitamente a copia fotostatica non autenticata di un documento di identità del dichiarante, all’ufficio competente via fax, ovvero tramite un incaricato, oppure a mezzo posta Firma del dipendente addetto …………………………………………………………
Mod. TD-Lib-09-a 2