the art of natural ventilation balancing heat and air flows? art of natural ventilation... · the...
TRANSCRIPT
The Art of Natural Ventilation – Balancing
Heat and Air Flows?
Consulting in the Science of
Buildings, Structures and
Environment
Rowan Williams Davis & Irwin (RWDI) Inc.

Acknowledgements
This presentation is possible because
of the efforts of the many bright and
committed colleagues I have the
pleasure of working with at RWDI.
I’d also like to acknowledge my
appreciation for the opportunity to
work on great projects, with cool
teams for inspired clients.
2
Outline
• What is natural ventilation
• Human requirements
• Driving forces
• Design process
• Examples
• Is it working?
3 WES Seminar – Is Natural Ventilation Working as Advertised? 2012/01/18

Outline
• What is natural ventilation
• Human requirements
• Driving forces
• Design process
• Examples
• Is it working?
• Does wind help or hurt?
4

What do we naturally ventilate?
• We naturally ventilate many spaces
– Hospital patient rooms - parking garages
– Offices - arenas / stadia
– Schools
– Homes
• Sometimes the spaces are about processes and
not humans
– Transformer vaults
– Industrial processes
– Antenna arrays
– Road and rail tunnels
– Emergency (smoke) ventilation
5
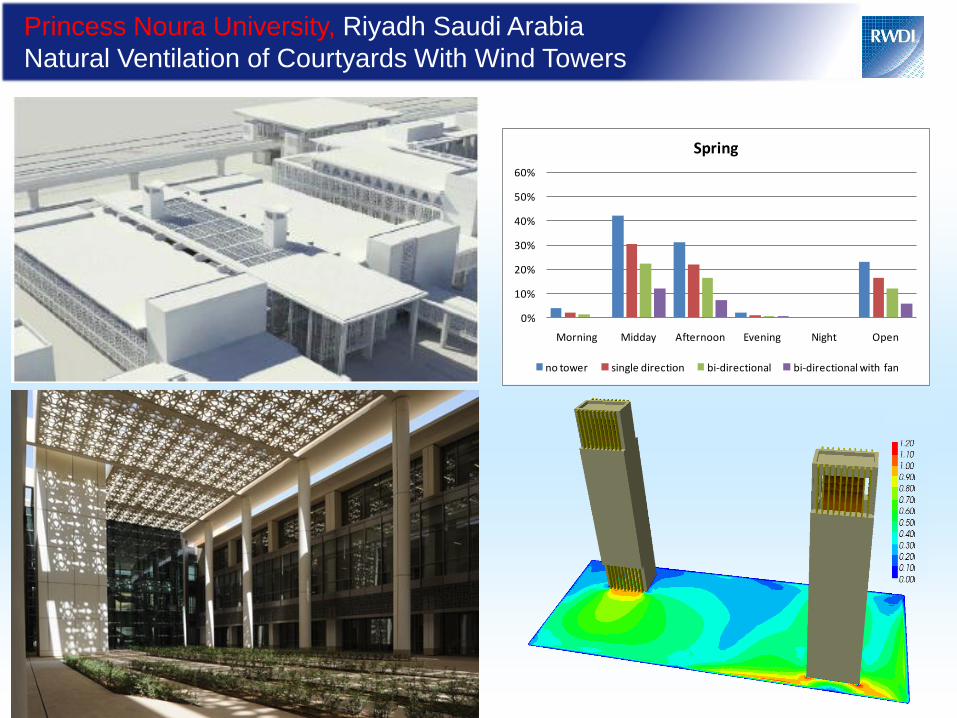
Princess Noura University, Riyadh Saudi Arabia
Natural Ventilation of Courtyards With Wind Towers
1 2
0%
10%
20%
30%
40%
50%
60%
Morning Midday Afternoon Evening Night Open
Spring
no tower single direction bi-directional bi-directional with fan
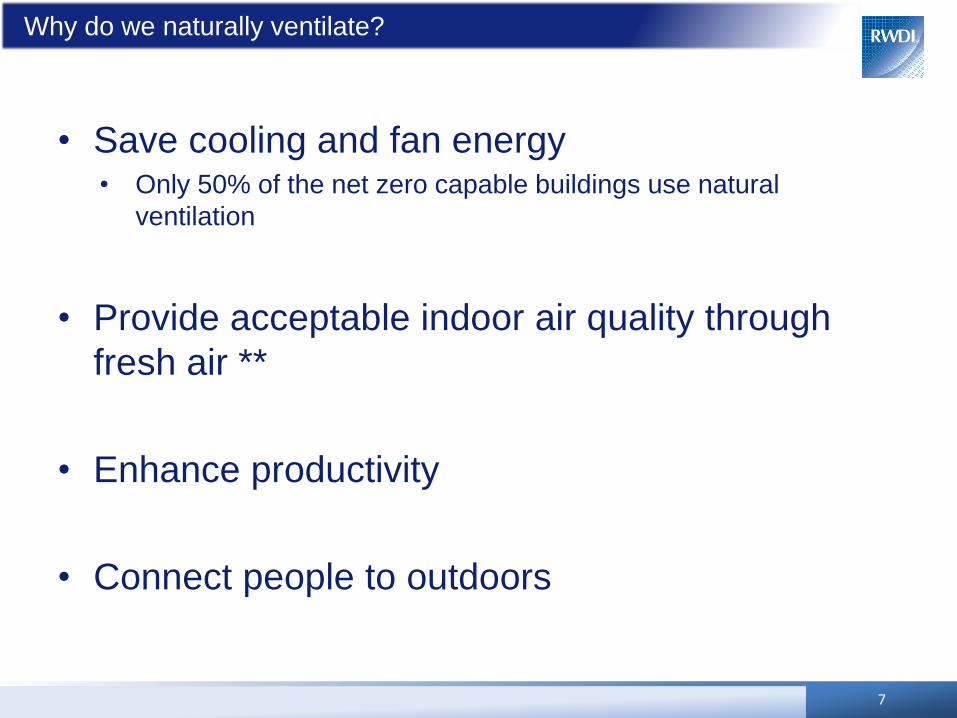
Why do we naturally ventilate?
• Save cooling and fan energy • Only 50% of the net zero capable buildings use natural
ventilation
• Provide acceptable indoor air quality through
fresh air **
• Enhance productivity
• Connect people to outdoors
7
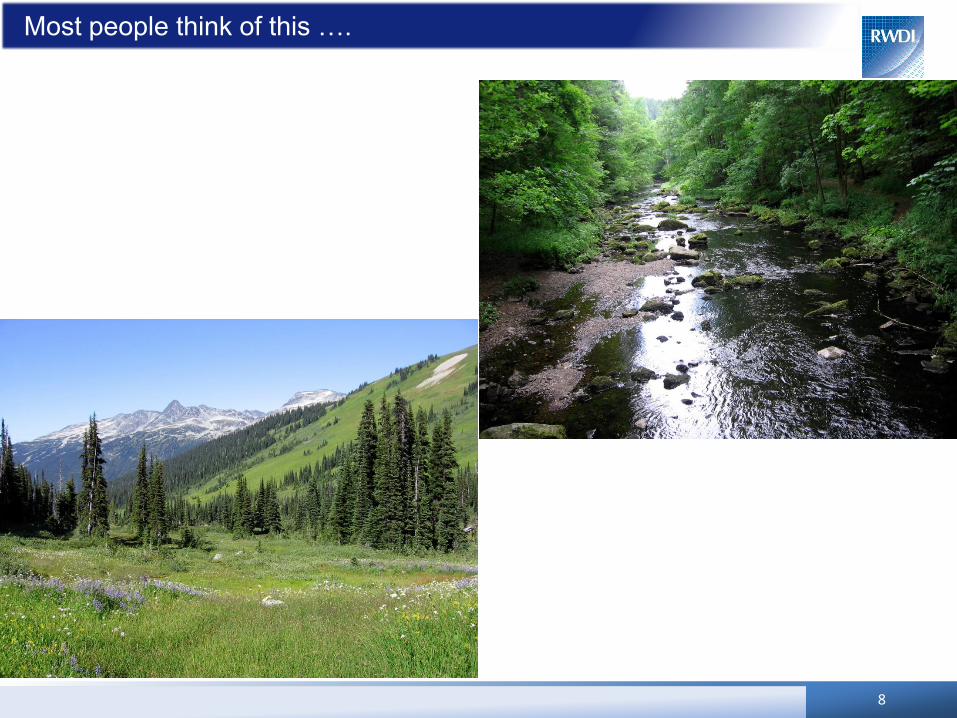
Most people think of this ….
8

For many the reality is different …
9
Photo Courtesy Hanqing Wu, RWDI Photo Courtesy Hanqing Wu, RWDI
Hong Kong
Cairo
Issues to Remember
• Natural ventilation must meet people’s needs
– Temperatures & RH
– Biological airflow requirements
– Contaminants – AQ
• Ideally people should be able to feel it working
• Large consequences can come from (small)
annoyances making a building undesirable:
– Noise
– Odour
– Excessive temperatures
– Dust
– Insects, and
– Allergens 10
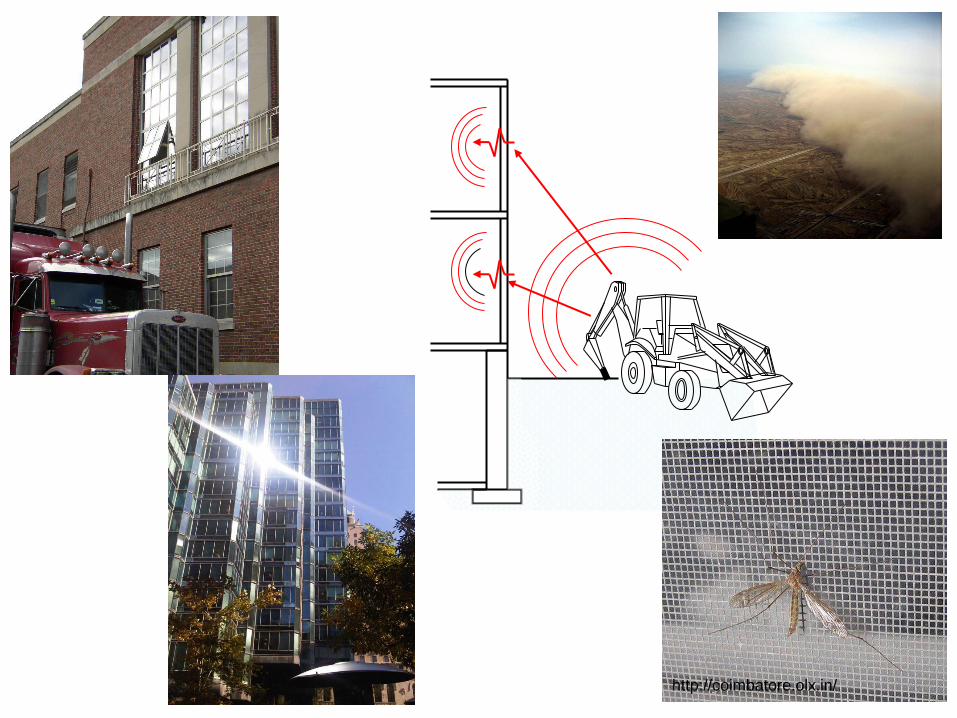
11 http://coimbatore.olx.in/
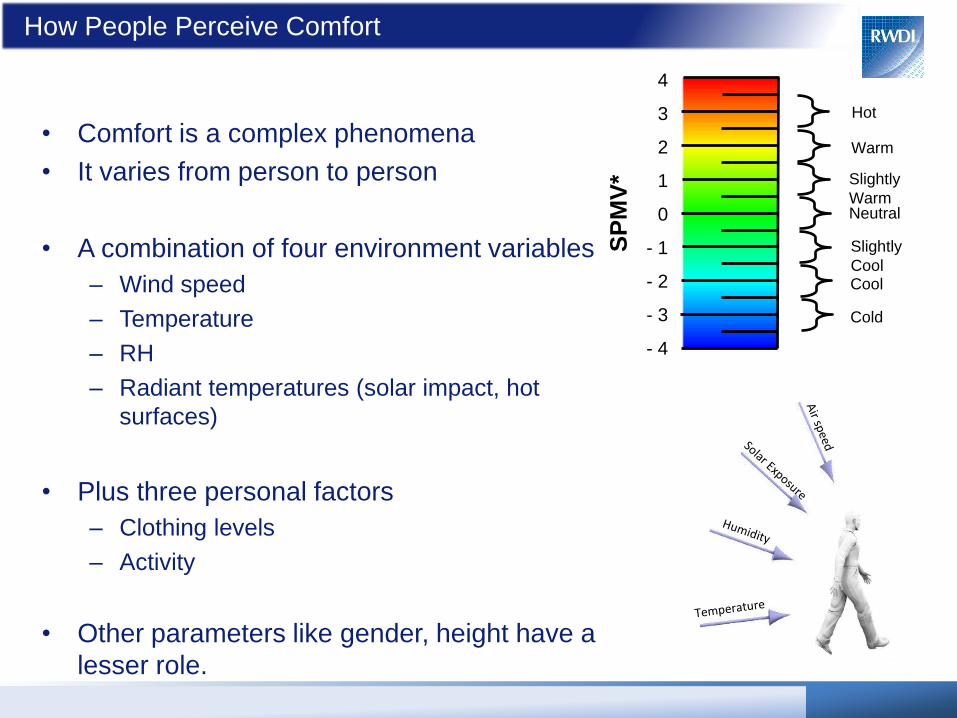
How People Perceive Comfort
• Comfort is a complex phenomena
• It varies from person to person
• A combination of four environment variables
– Wind speed
– Temperature
– RH
– Radiant temperatures (solar impact, hot
surfaces)
• Plus three personal factors
– Clothing levels
– Activity
• Other parameters like gender, height have a
lesser role.
4
3
2
1
0
- 1
- 2
- 3
- 4
Hot
Warm
Slightly
Warm Neutral
Slightly
Cool Cool
Cold
SP
MV
*
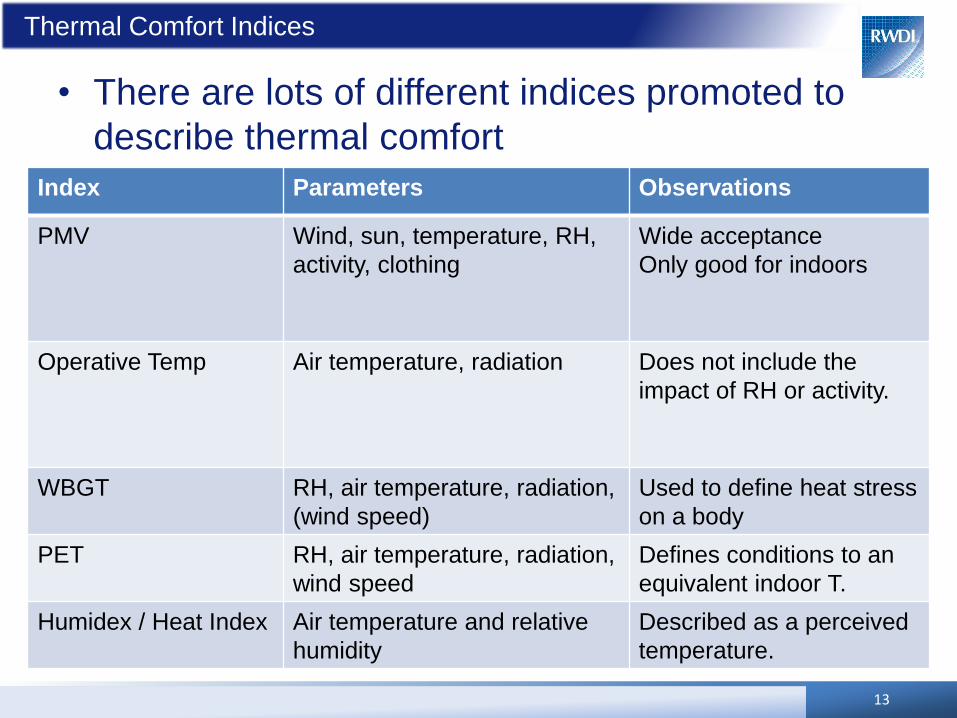
Thermal Comfort Indices
• There are lots of different indices promoted to
describe thermal comfort
13
Index Parameters Observations
PMV Wind, sun, temperature, RH,
activity, clothing
Wide acceptance
Only good for indoors
Operative Temp Air temperature, radiation Does not include the
impact of RH or activity.
WBGT RH, air temperature, radiation,
(wind speed)
Used to define heat stress
on a body
PET RH, air temperature, radiation,
wind speed
Defines conditions to an
equivalent indoor T.
Humidex / Heat Index Air temperature and relative
humidity
Described as a perceived
temperature.

ARRANGEMENTS
14
Two Airflow Issues
• Get the air in
– Related to the flow through the perimeter
• Circulated it well
– Dictates how efficiently we use the air that is available
• Internal quantities (AQ, temperature) scale with
air flow rate
– makes envelope flows very important
15
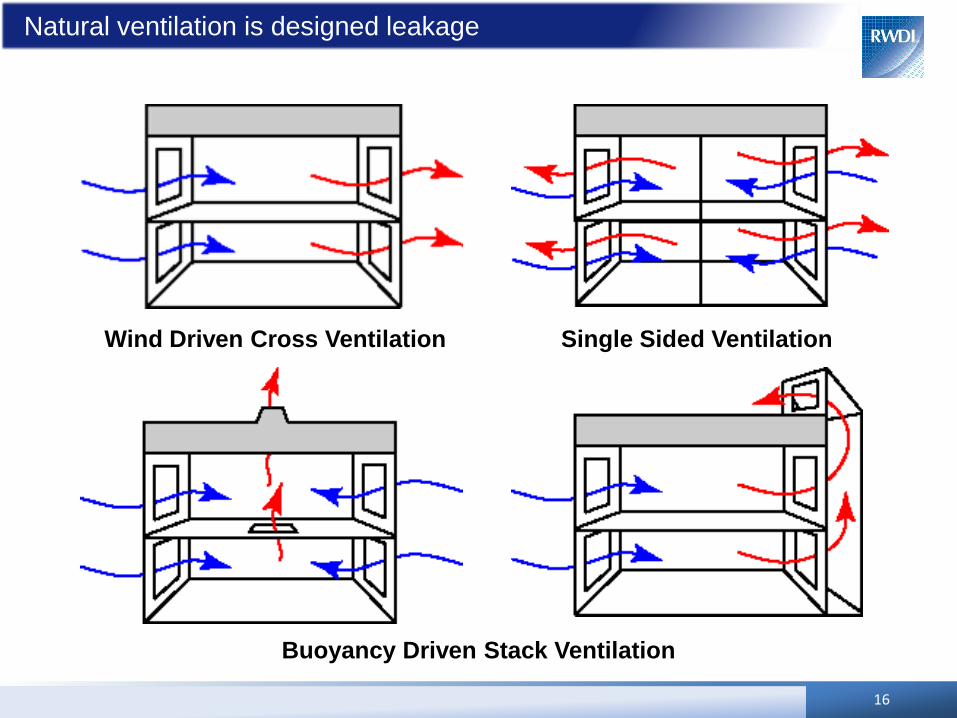
Natural ventilation is designed leakage
16
Buoyancy Driven Stack Ventilation
Wind Driven Cross Ventilation Single Sided Ventilation
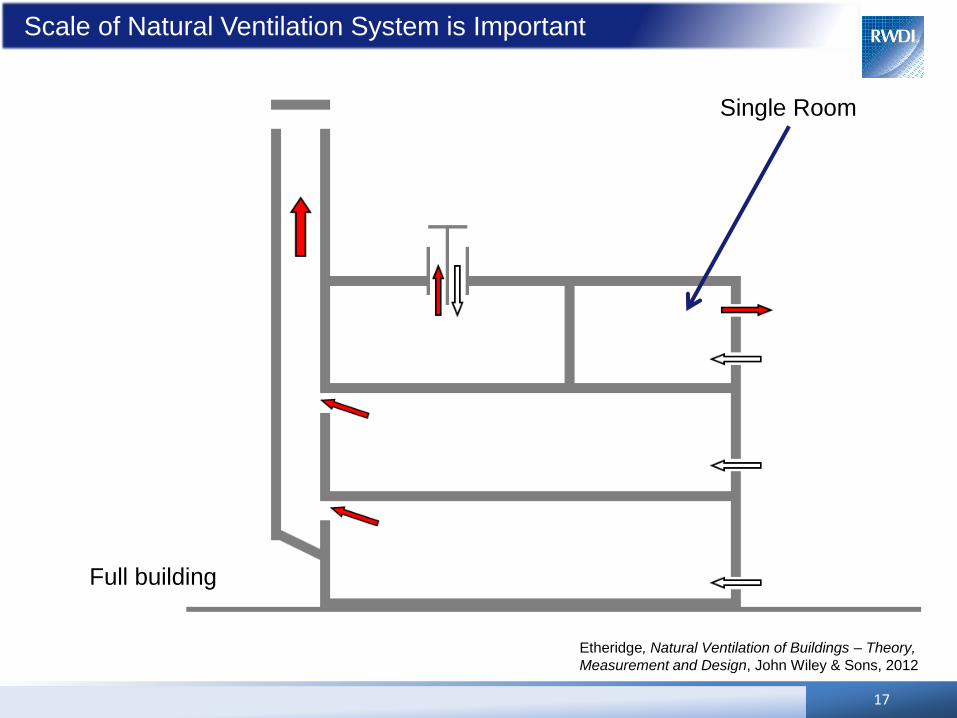
Scale of Natural Ventilation System is Important
17
Etheridge, Natural Ventilation of Buildings – Theory,
Measurement and Design, John Wiley & Sons, 2012
Single Room
Full building

STACK EFFECT
Some Physics
18
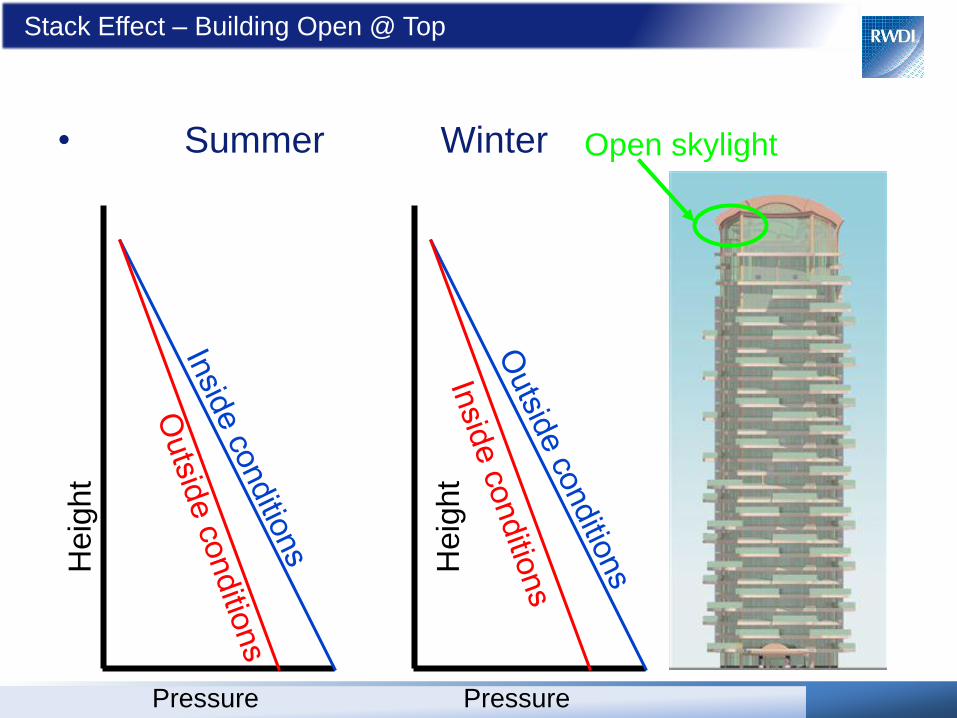
Stack Effect – Building Open @ Top
• Summer Winter
Pressure
Heig
ht
Pressure
Heig
ht
Open skylight

Stack Effect – Building Open @ Top
• Summer Winter
Pressure
Heig
ht
Pressure
Heig
ht
ΔP = Pinside – Poutside
Open skylight

Stack Effect – Building Open@Bottom
• Summer Winter
Heig
ht
Pressure
Heig
ht
Open door
Pressure
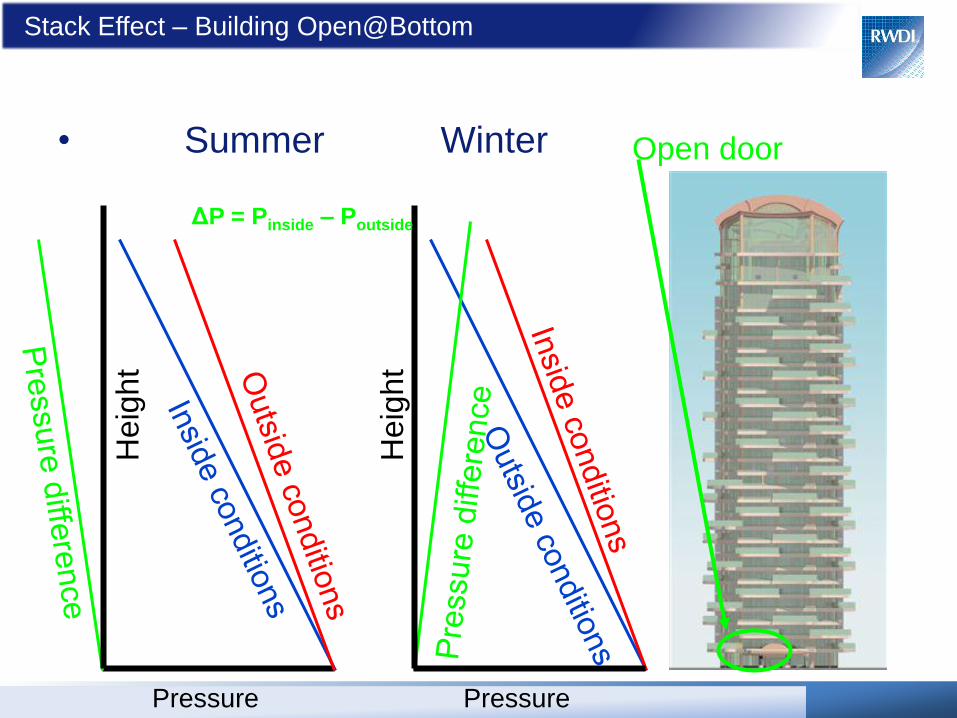
Stack Effect – Building Open@Bottom
• Summer Winter Open door
Heig
ht
Pressure
Heig
ht
ΔP = Pinside – Poutside
Pressure
Heig
ht
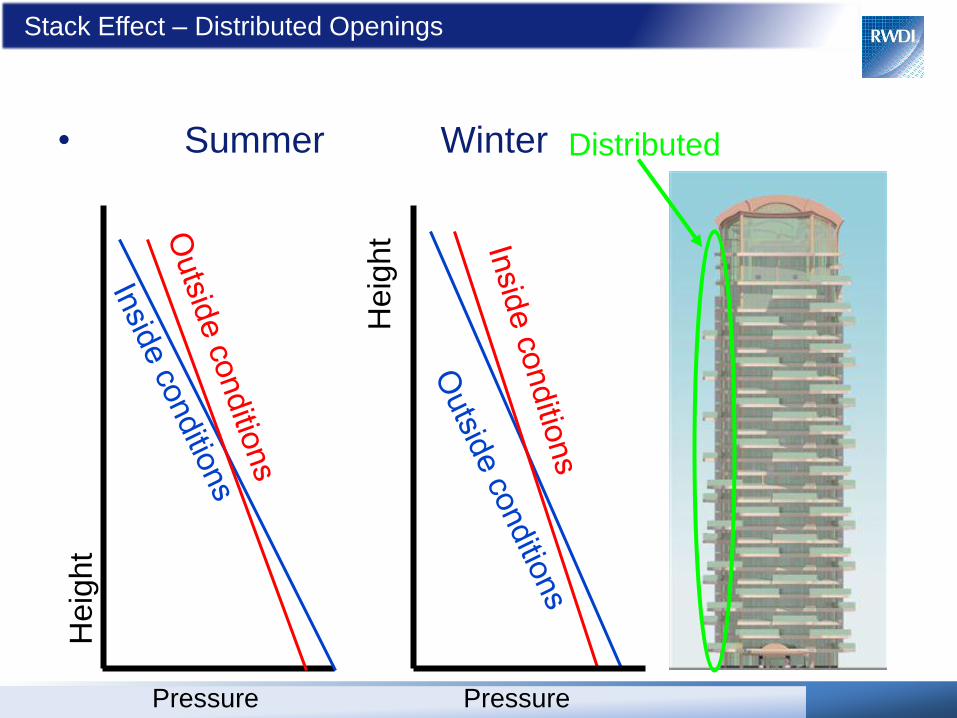
Stack Effect – Distributed Openings
• Summer Winter
Pressure Pressure
Heig
ht
Distributed
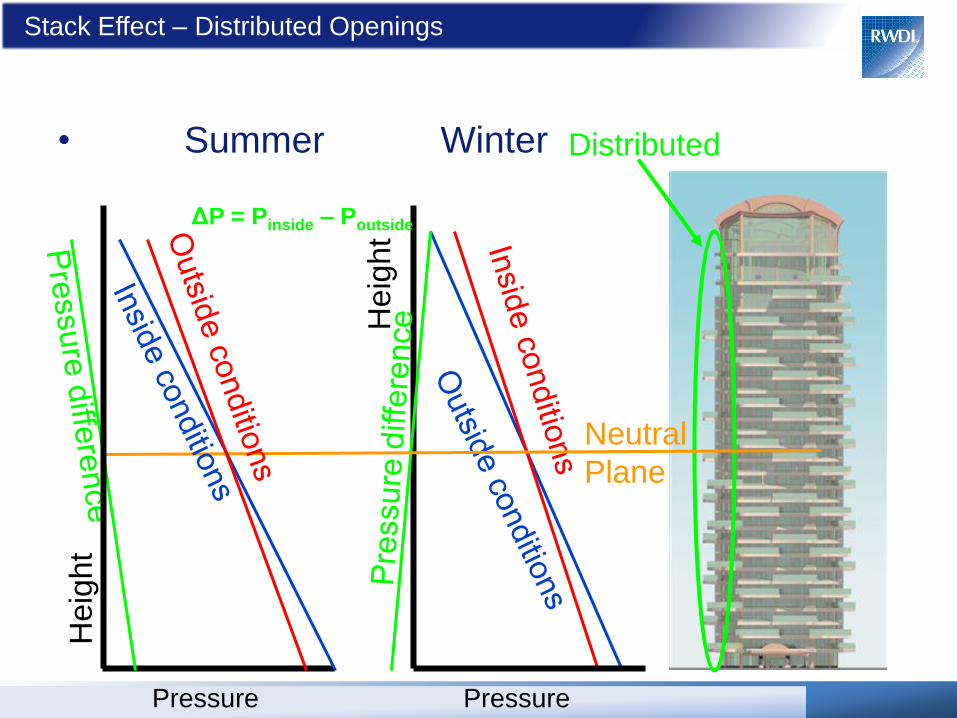
Stack Effect – Distributed Openings
• Summer Winter Distributed
Heig
ht
Neutral
Plane
Pressure
Heig
ht
ΔP = Pinside – Poutside
Pressure
Heig
ht
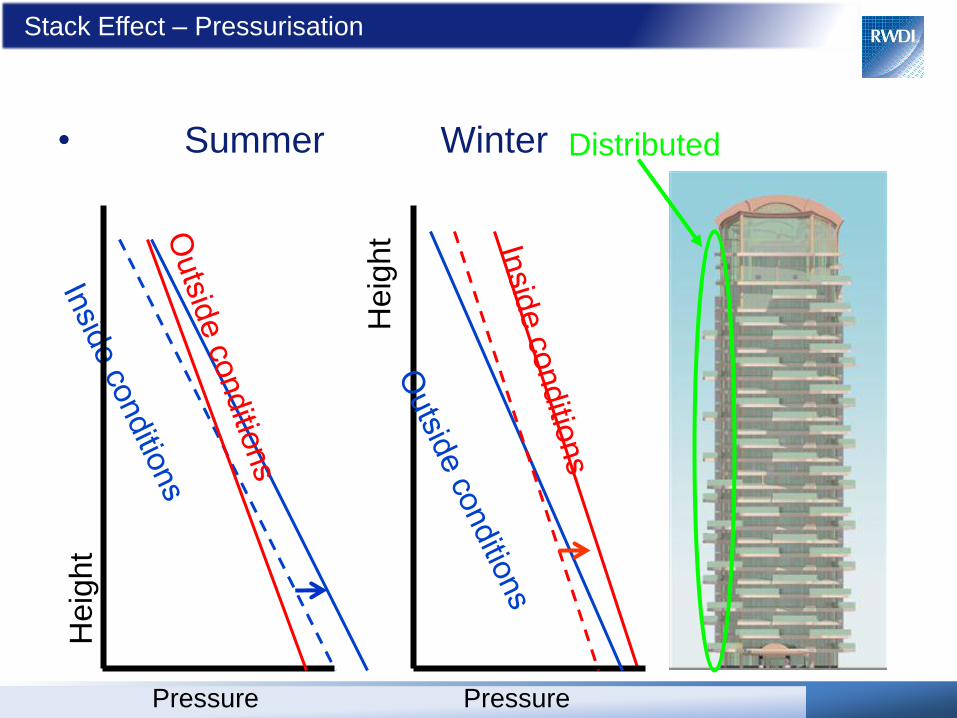
Stack Effect – Pressurisation
• Summer Winter
Pressure Pressure
Heig
ht
Distributed
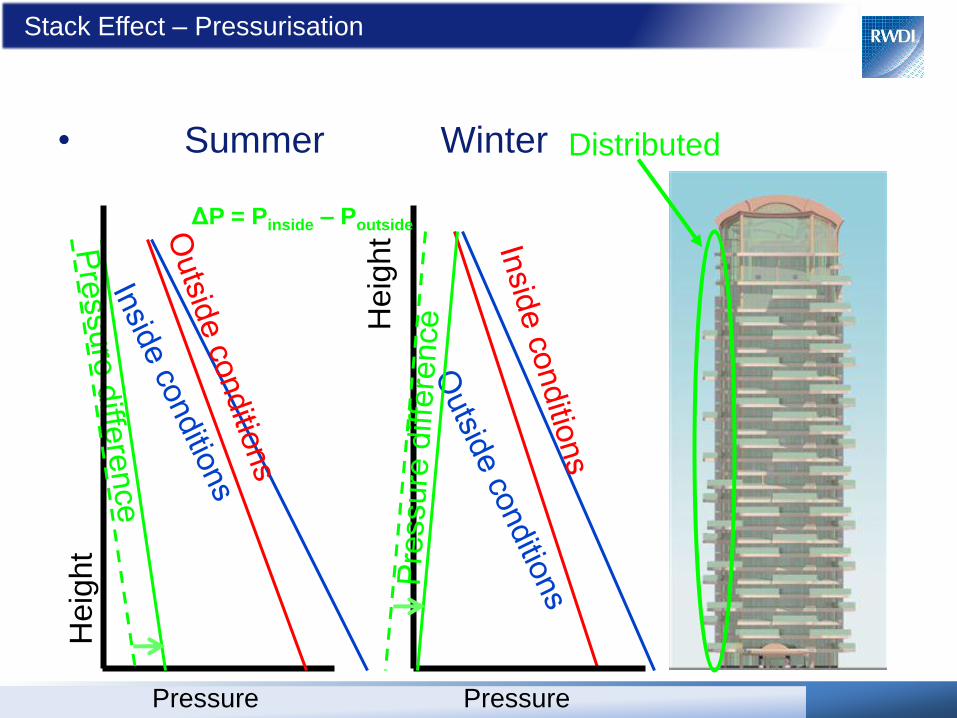
Stack Effect – Pressurisation
• Summer Winter Distributed
Heig
ht
Pressure
Heig
ht
ΔP = Pinside – Poutside
Pressure

Stack Effect – Distributed Openings
Wind Impact Windward Side
• Summer Winter Distributed
Heig
ht
Neutral
Plane
Pressure
ΔP = Pinside – Poutside
Pressure
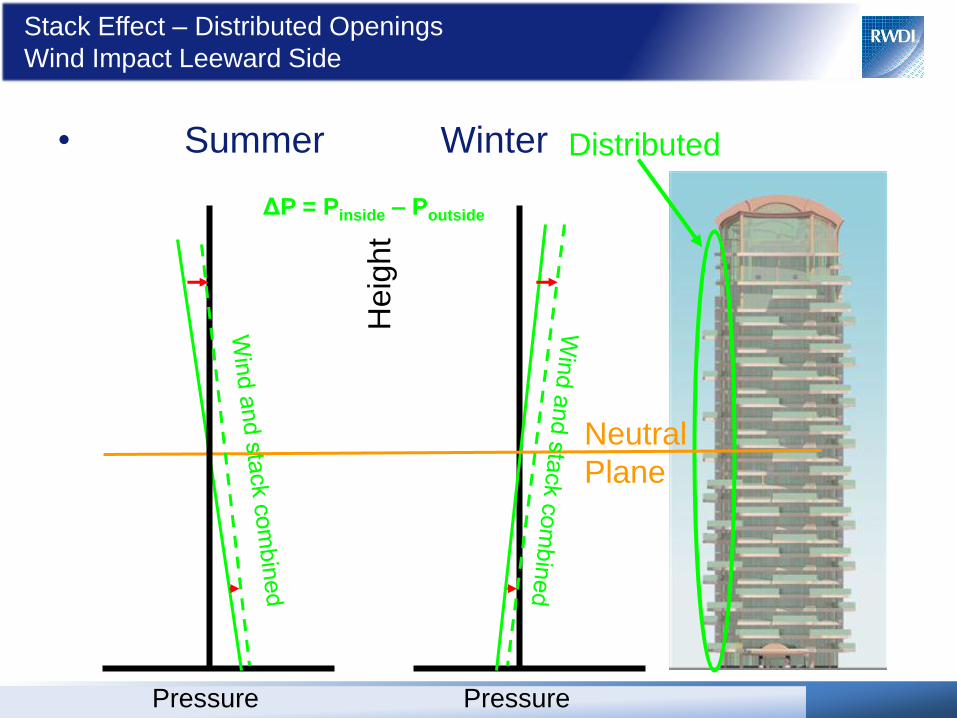
Stack Effect – Distributed Openings
Wind Impact Leeward Side
• Summer Winter Distributed
Heig
ht
Neutral
Plane
Pressure
ΔP = Pinside – Poutside
Pressure
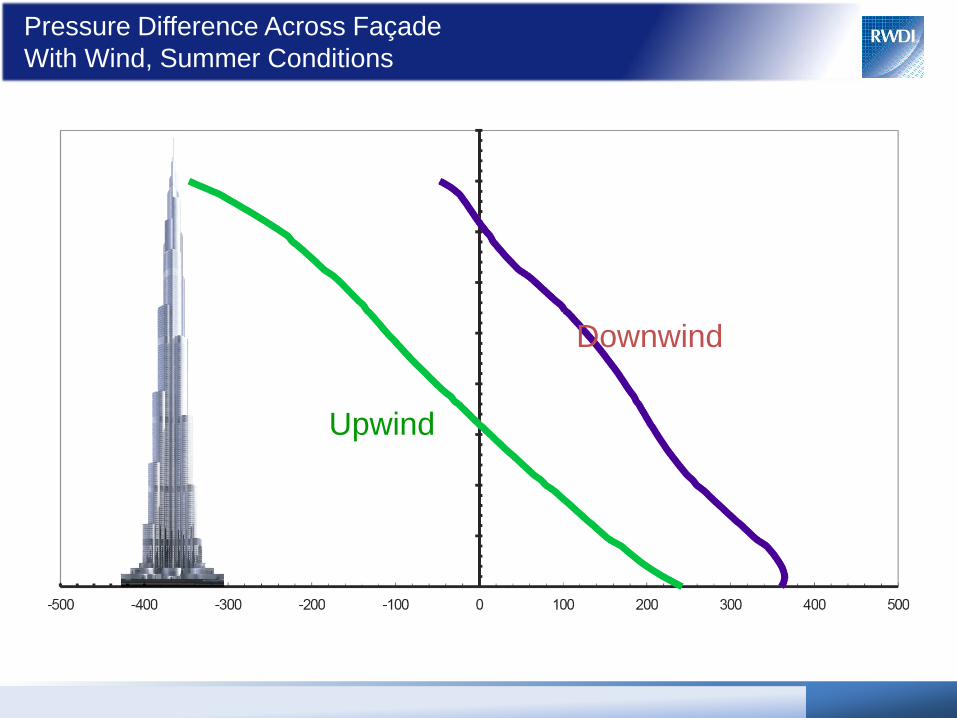
Pressure Difference Across Façade
With Wind, Summer Conditions
Upwind
Downwind
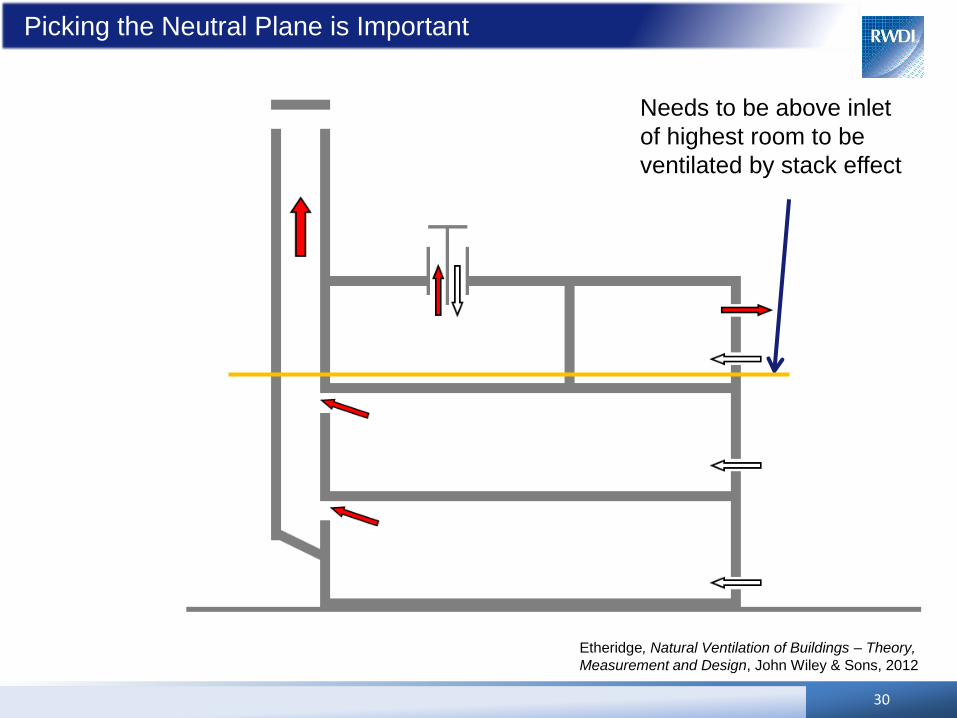
Picking the Neutral Plane is Important
30
Etheridge, Natural Ventilation of Buildings – Theory,
Measurement and Design, John Wiley & Sons, 2012
Needs to be above inlet
of highest room to be
ventilated by stack effect
31
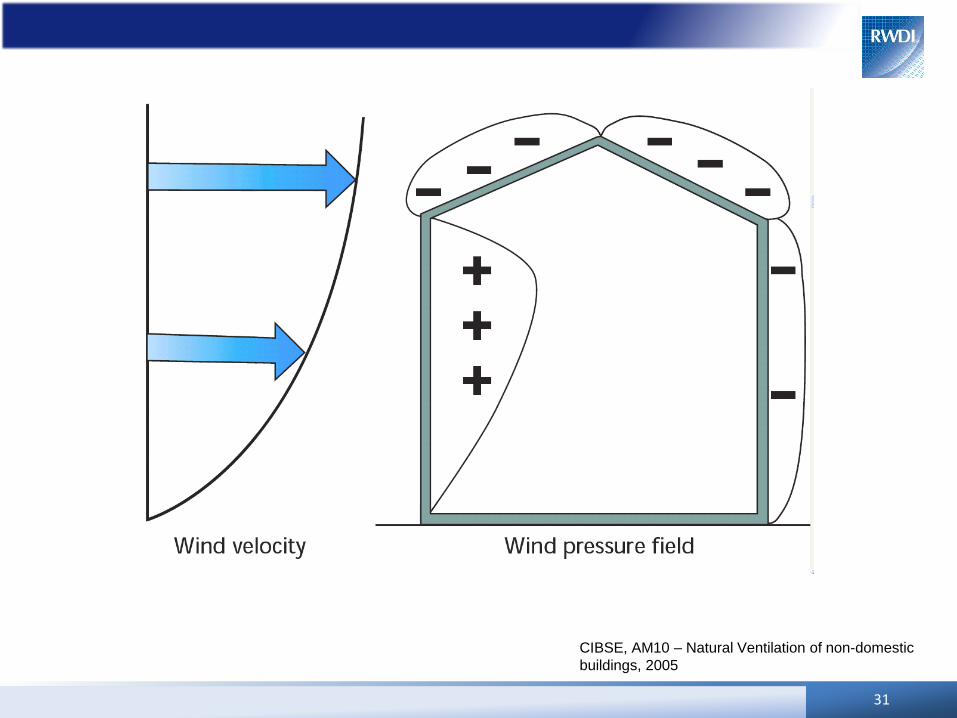
CIBSE, AM10 – Natural Ventilation of non-domestic
buildings, 2005
32
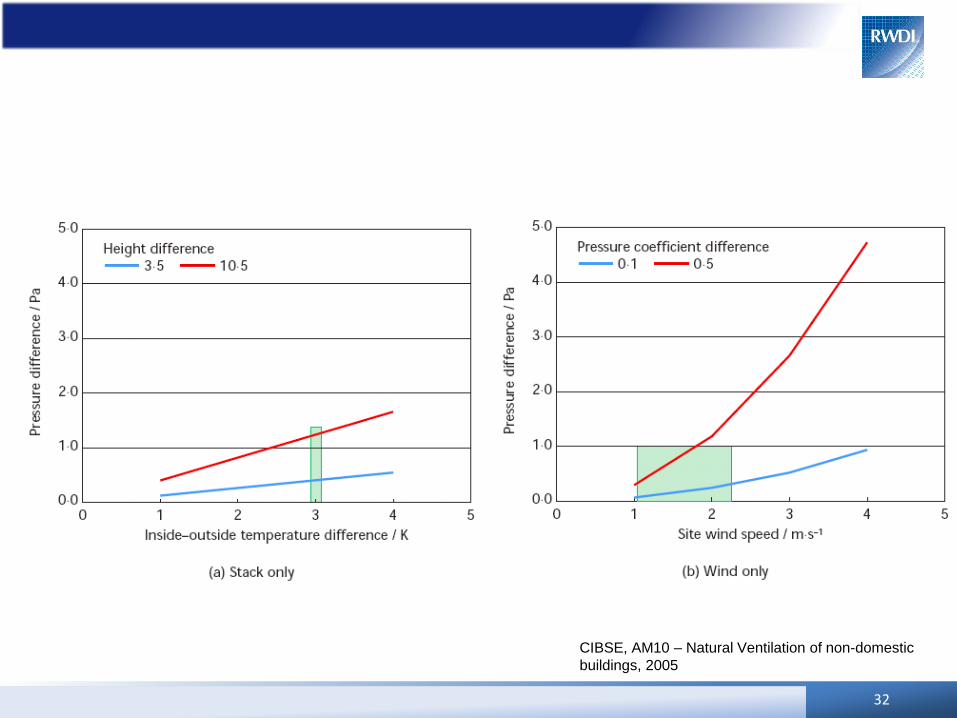
CIBSE, AM10 – Natural Ventilation of non-domestic
buildings, 2005

THE DESIGN PROCESS
33
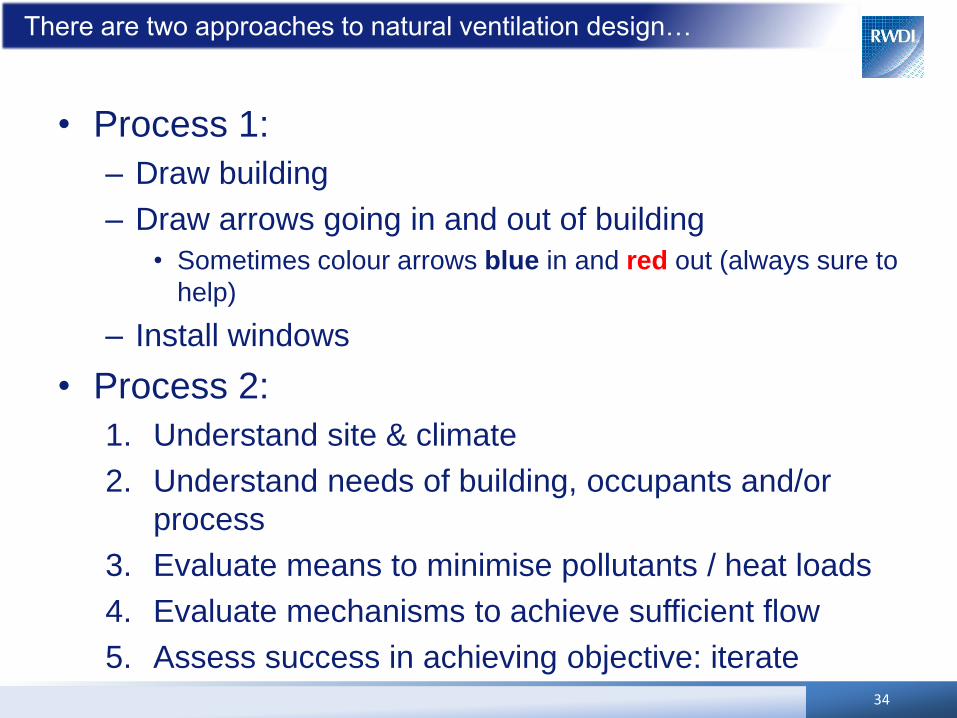
There are two approaches to natural ventilation design…
• Process 1:
– Draw building
– Draw arrows going in and out of building
• Sometimes colour arrows blue in and red out (always sure to
help)
– Install windows
• Process 2:
1. Understand site & climate
2. Understand needs of building, occupants and/or
process
3. Evaluate means to minimise pollutants / heat loads
4. Evaluate mechanisms to achieve sufficient flow
5. Assess success in achieving objective: iterate
34
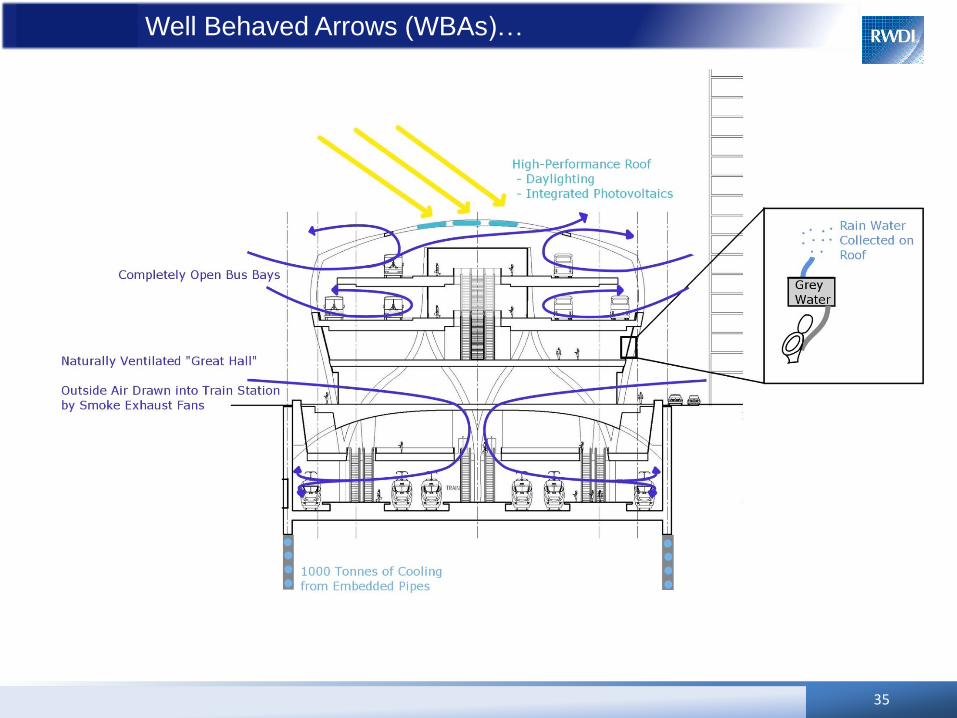
Very Very Well Behaved Arrows (WBAs)…
35
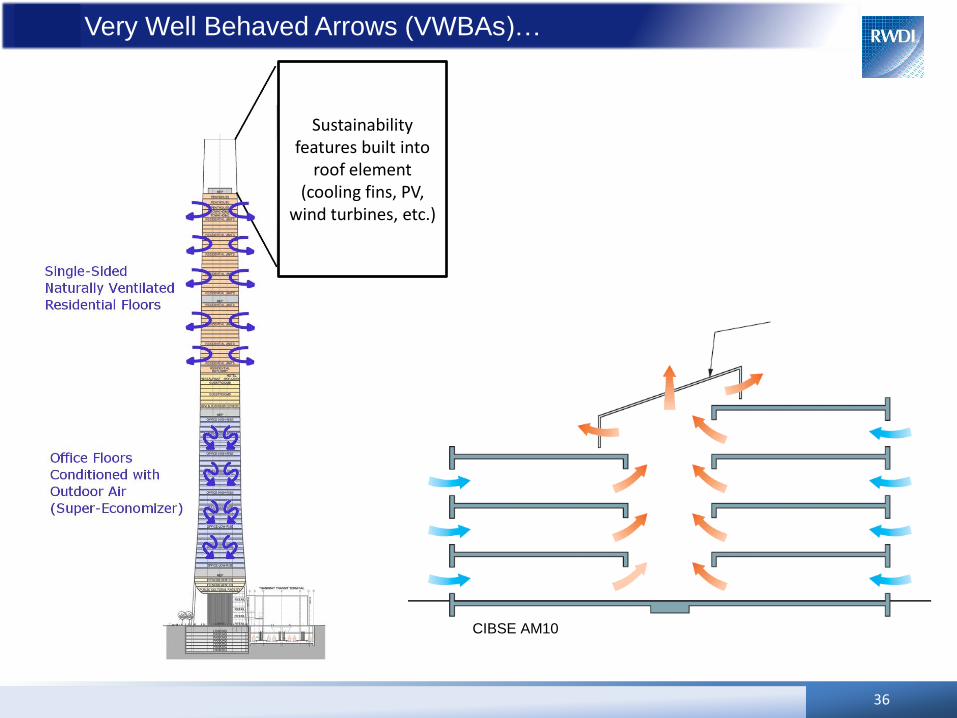
Very Very Well Behaved Arrows (VWBAs)…
36
Sustainability features built into
roof element (cooling fins, PV,
wind turbines, etc.)
CIBSE AM10
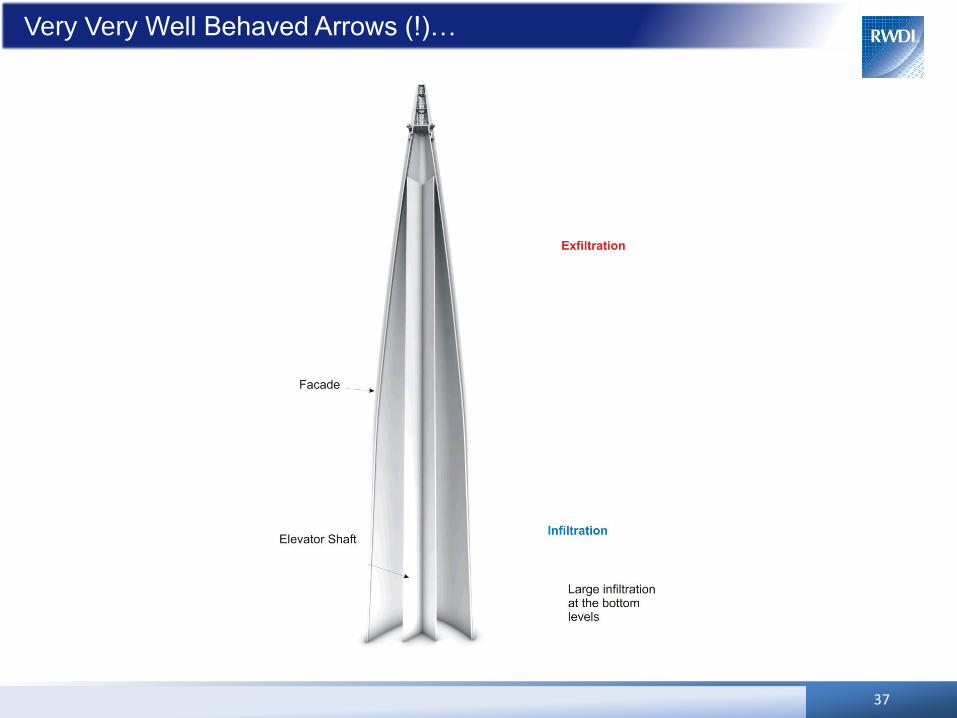
Very Very Well Behaved Arrows (!)…
37
Natural Ventilation Driving Forces
• The Art of balancing driving pressure
differences and restricting pressure losses
• Two driving forces for naturally ventilated
environments
– Buoyancy due to heat gain/load: 0.3 – 3.0 Pa
– Wind driven pressures: 1 – 35 Pa
• One typically draws air from bottom to top
• Natural ventilation tends to be transient
38
The best naturally ventilated buildings are located
in sites that are planned for natural ventilation
The masterplan can contribute to the success of
natural ventilation and prevent it from being
possible.
39
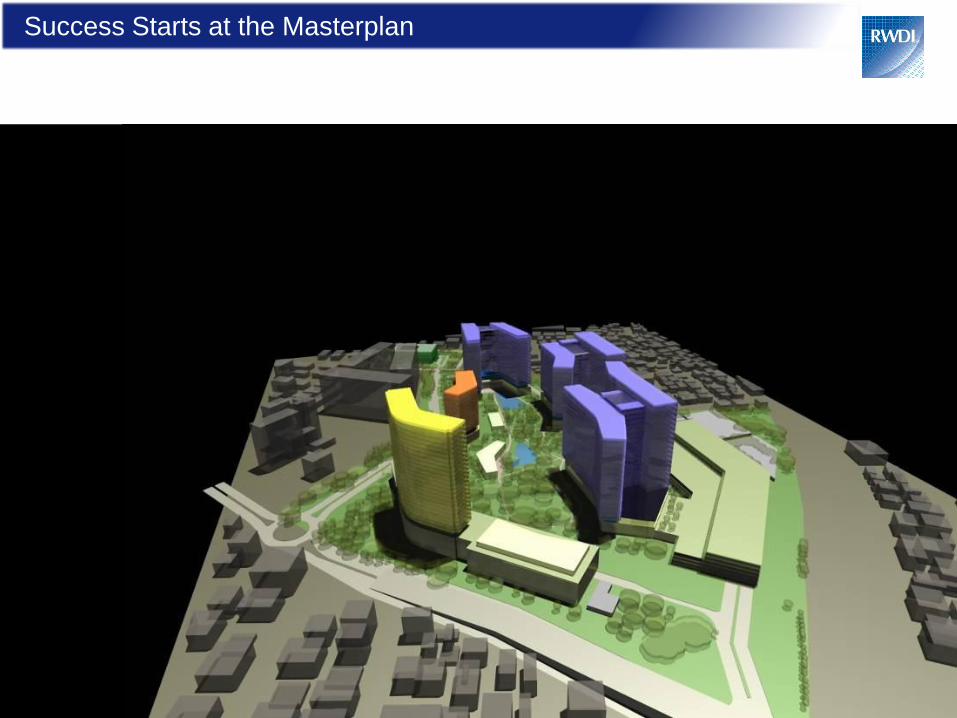
Success Starts at the Masterplan
40
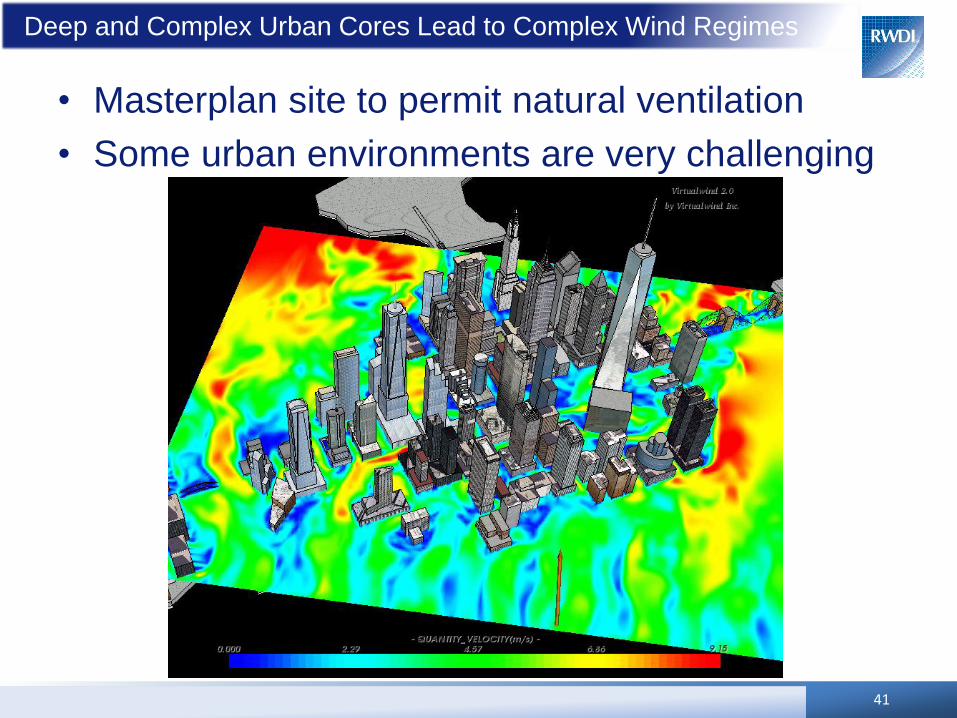
Deep and Complex Urban Cores Lead to Complex Wind Regimes
• Masterplan site to permit natural ventilation
• Some urban environments are very challenging
41
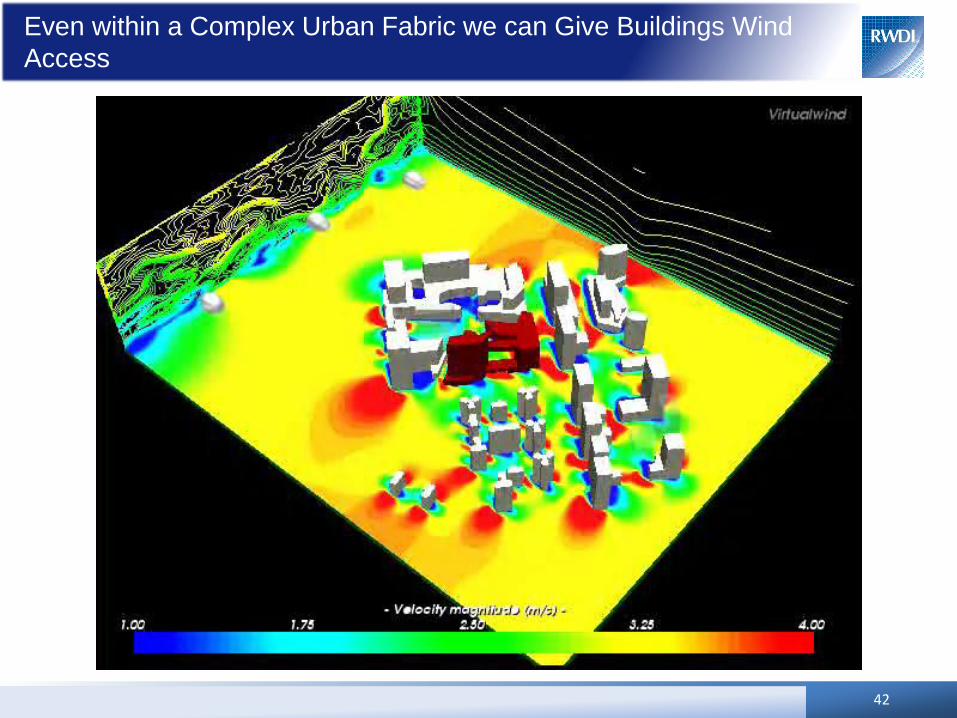
Even within a Complex Urban Fabric we can Give Buildings Wind
Access
42
Masterplan for Natural Ventilation in Dense Urban Fabric
Page 43
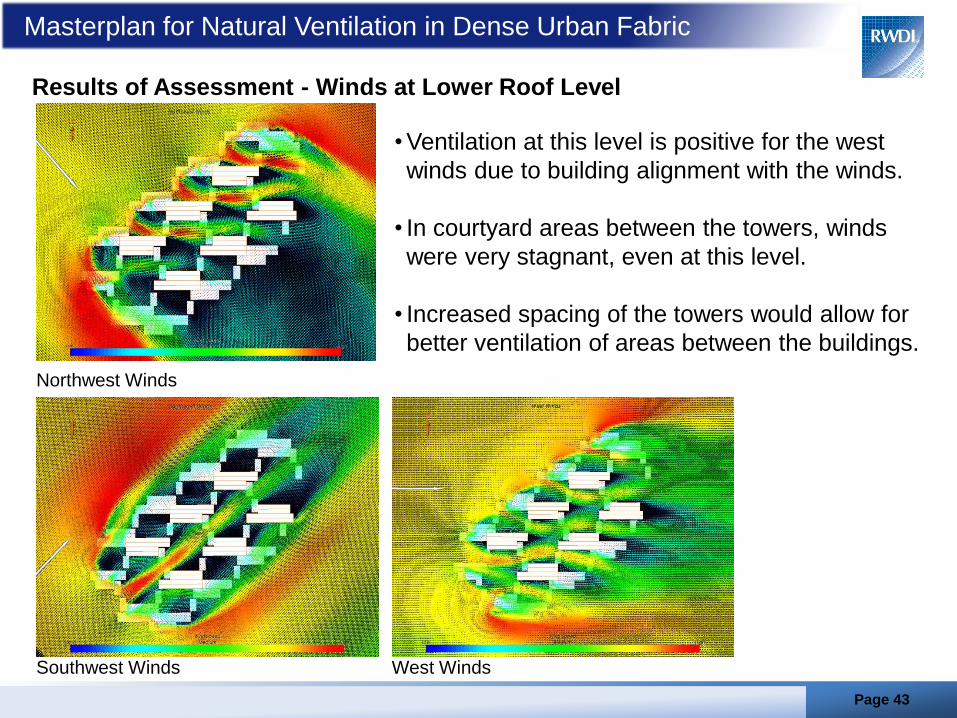
Results of Assessment - Winds at Lower Roof Level
Northwest Winds
Southwest Winds West Winds
• Ventilation at this level is positive for the west
winds due to building alignment with the winds.
• In courtyard areas between the towers, winds
were very stagnant, even at this level.
• Increased spacing of the towers would allow for
better ventilation of areas between the buildings.
EXAMPLE: LAB BUILDING
UNIVERSITY NEAR TORONTO
Guess at wind Cp values
44
Problem Statement
• Energy and network flow modelling tools have
built in wind values
– Varying levels of complexity
– Not always appropriate
• The issue is sometimes how wrong are they?
• Summary of information from Sim Build Paper
45
The Role of Wind in Natural Ventilation Simulations Using Airflow Network Models
J Good, A Frisque, D Phillips
46

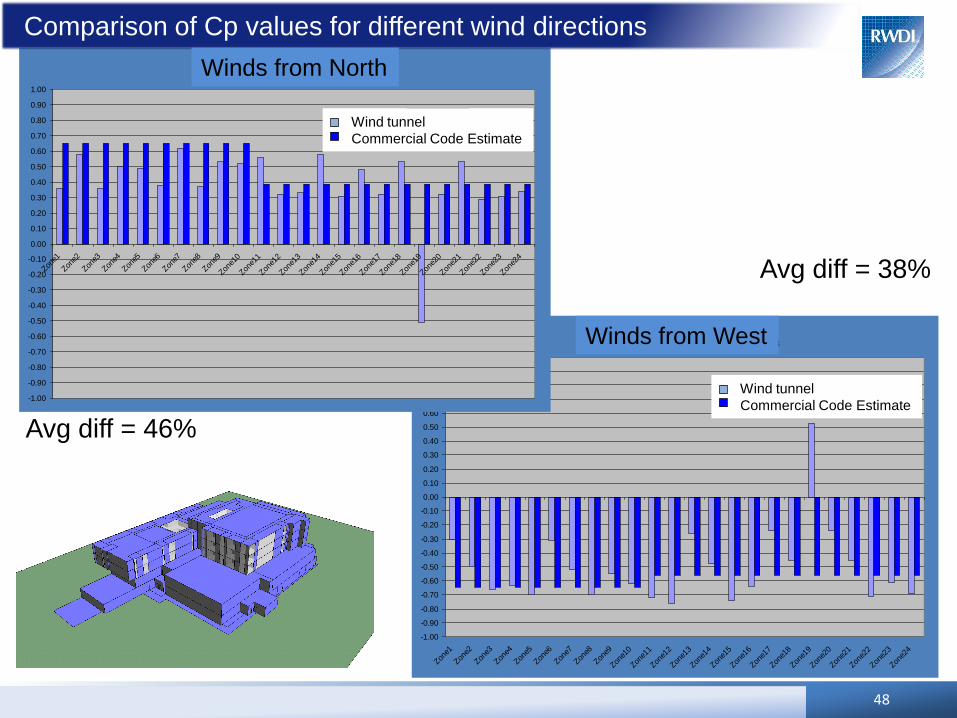
Comparison of Cp values for different wind directions
47
Wind Pressure Coefficient (Cp)
Comparison of Predictions at 180º angle of attack
-1.00
-0.90
-0.80
-0.70
-0.60
-0.50
-0.40
-0.30
-0.20
-0.10
0.00
0.10
0.20
0.30
0.40
0.50
0.60
0.70
0.80
0.90
1.00
Zone1
Zone2
Zone3
Zone4
Zone5
Zone6
Zone7
Zone8
Zone9
Zone1
0
Zone1
1
Zone1
2
Zone1
3
Zone1
4
Zone1
5
Zone1
6
Zone1
7
Zone1
8
Zone1
9
Zone2
0
Zone2
1
Zone2
2
Zone2
3
Zone2
4
Wind Tunnel
IES VE Model
Wind Pressure Coefficient (Cp)
Comparison of Predictions at 90º angle of attack
-1.00
-0.90
-0.80
-0.70
-0.60
-0.50
-0.40
-0.30
-0.20
-0.10
0.00
0.10
0.20
0.30
0.40
0.50
0.60
0.70
0.80
0.90
1.00
Zone1
Zone2
Zone3
Zone4
Zone5
Zone6
Zone7
Zone8
Zone9
Zone1
0
Zone1
1
Zone1
2
Zone1
3
Zone1
4
Zone1
5
Zone1
6
Zone1
7
Zone1
8
Zone1
9
Zone2
0
Zone2
1
Zone2
2
Zone2
3
Zone2
4
Wind Tunnel
IES VE Model
Avg diff = 28%
Avg diff = 29%
Wind tunnel
Commercial Code Estimate
Winds from South
Winds from East
Wind tunnel
Commercial Code Estimate
Wind Pressure Coefficient (Cp)
Comparison of Predictions at 270º angle of attack
-1.00
-0.90
-0.80
-0.70
-0.60
-0.50
-0.40
-0.30
-0.20
-0.10
0.00
0.10
0.20
0.30
0.40
0.50
0.60
0.70
0.80
0.90
1.00
Zone1
Zone2
Zone3
Zone4
Zone5
Zone6
Zone7
Zone8
Zone9
Zone1
0
Zone1
1
Zone1
2
Zone1
3
Zone1
4
Zone1
5
Zone1
6
Zone1
7
Zone1
8
Zone1
9
Zone2
0
Zone2
1
Zone2
2
Zone2
3
Zone2
4
Wind Tunnel
IES VE Model
Wind Pressure Coefficient (Cp)
Comparison of Predictions at 0º angle of attack
-1.00
-0.90
-0.80
-0.70
-0.60
-0.50
-0.40
-0.30
-0.20
-0.10
0.00
0.10
0.20
0.30
0.40
0.50
0.60
0.70
0.80
0.90
1.00
Zone1
Zone2
Zone3
Zone4
Zone5
Zone6
Zone7
Zone8
Zone9
Zone1
0
Zone1
1
Zone1
2
Zone1
3
Zone1
4
Zone1
5
Zone1
6
Zone1
7
Zone1
8
Zone1
9
Zone2
0
Zone2
1
Zone2
2
Zone2
3
Zone2
4
Wind Tunnel
IES VE Model
Comparison of Cp values for different wind directions
48
Avg diff = 46%
Avg diff = 38%
Winds from West
Winds from North
Wind tunnel
Commercial Code Estimate
Wind tunnel
Commercial Code Estimate

EXAMPLE: HIGH SCHOOL
NEAR SEATTLE, WA
49
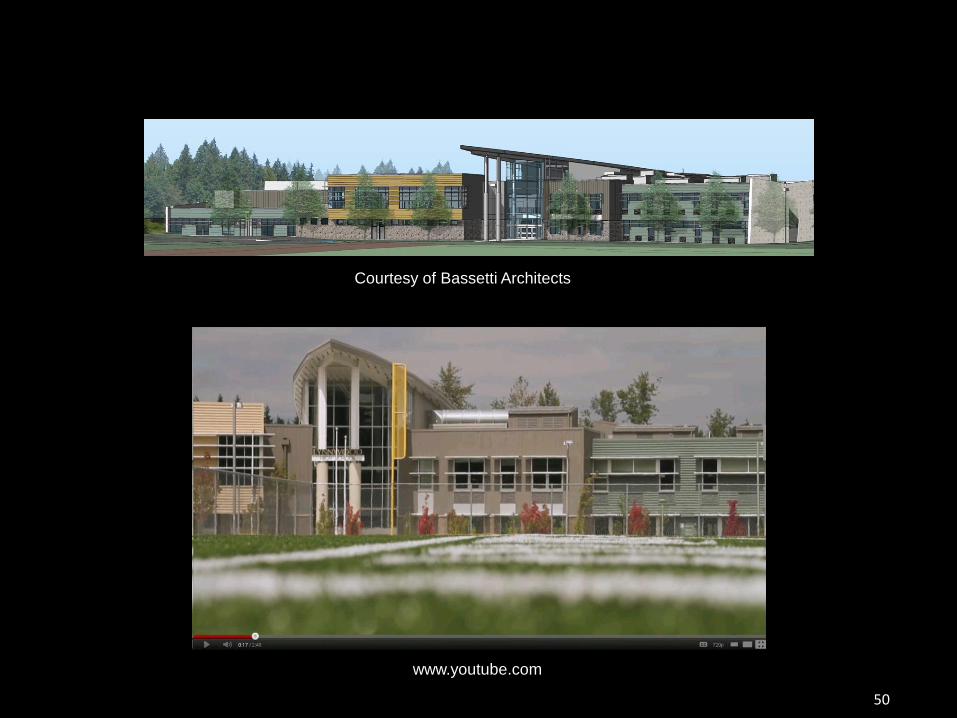
Courtesy Basseti Archicats
50
www.youtube.com
Courtesy of Bassetti Architects

classrooms
Site Plan & Orientation with Winds
51
Classroom wings
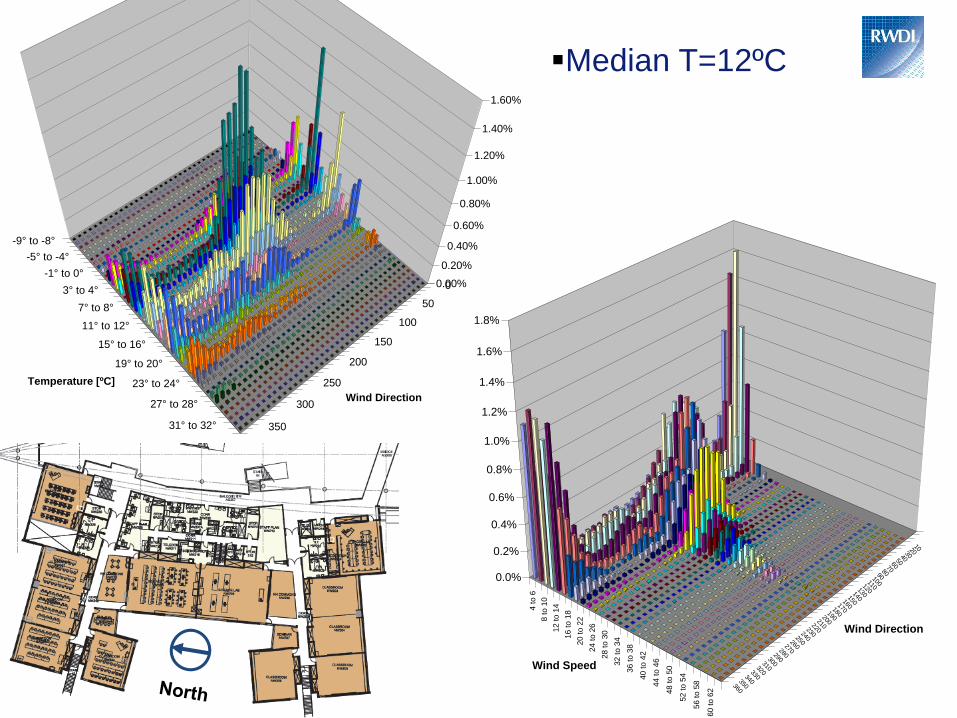
All Seasons (SEATAC)
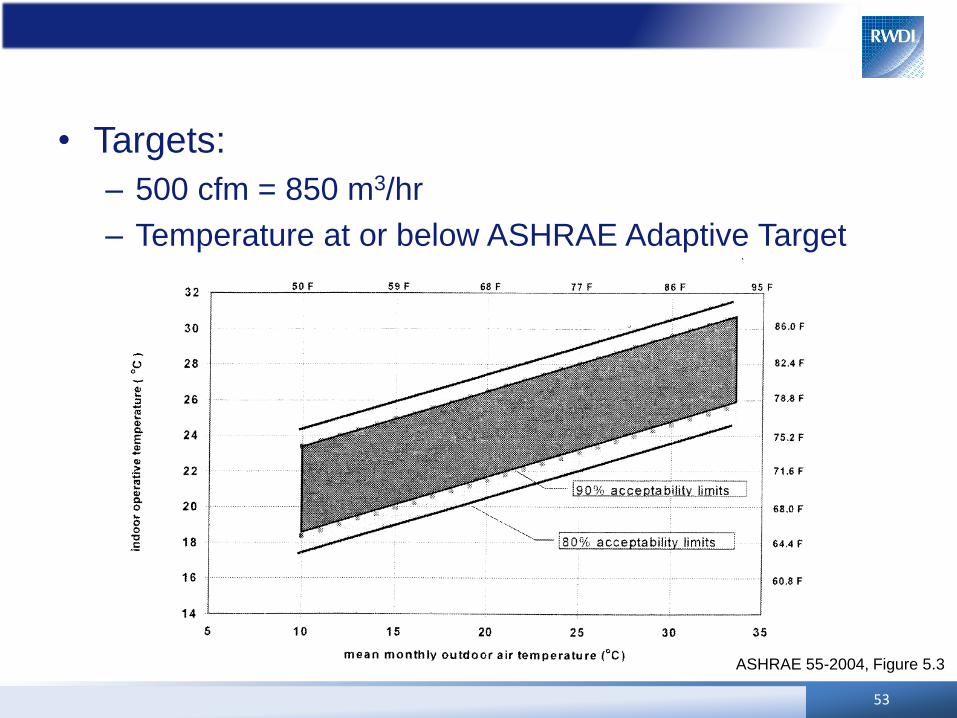
• Targets:
– 500 cfm = 850 m3/hr
– Temperature at or below ASHRAE Adaptive Target
53
ASHRAE 55-2004, Figure 5.3

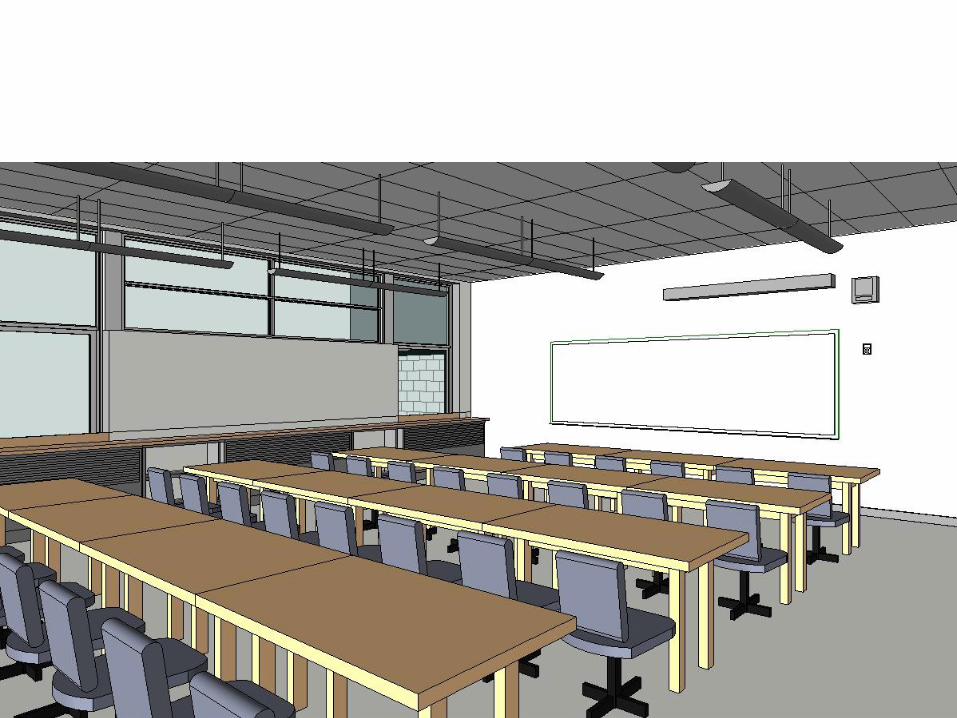
Courtesy Basseti Archicats
54
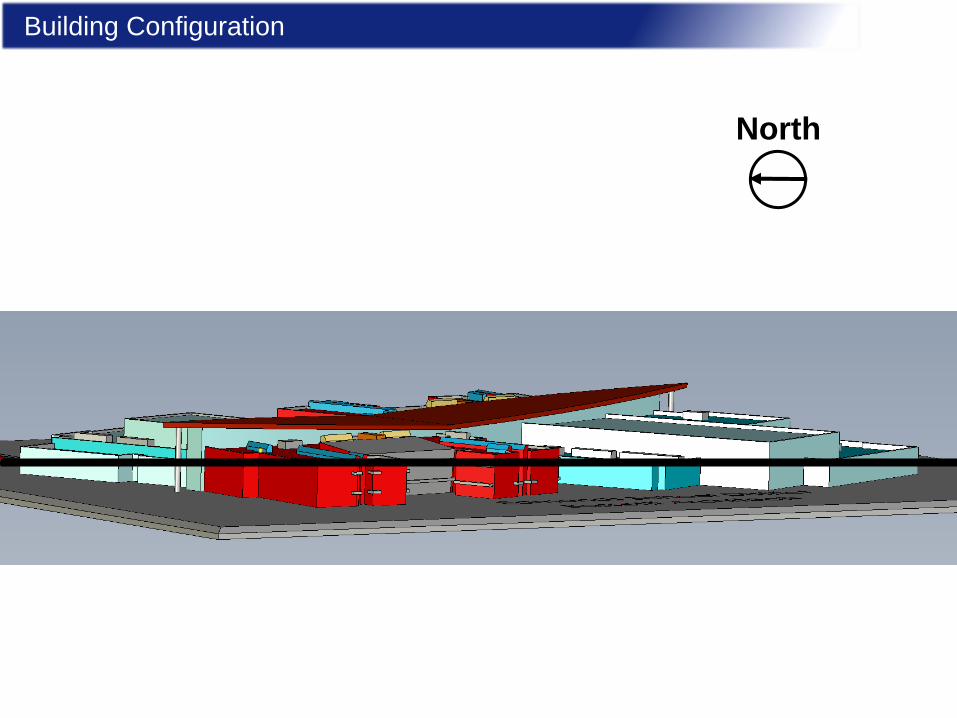
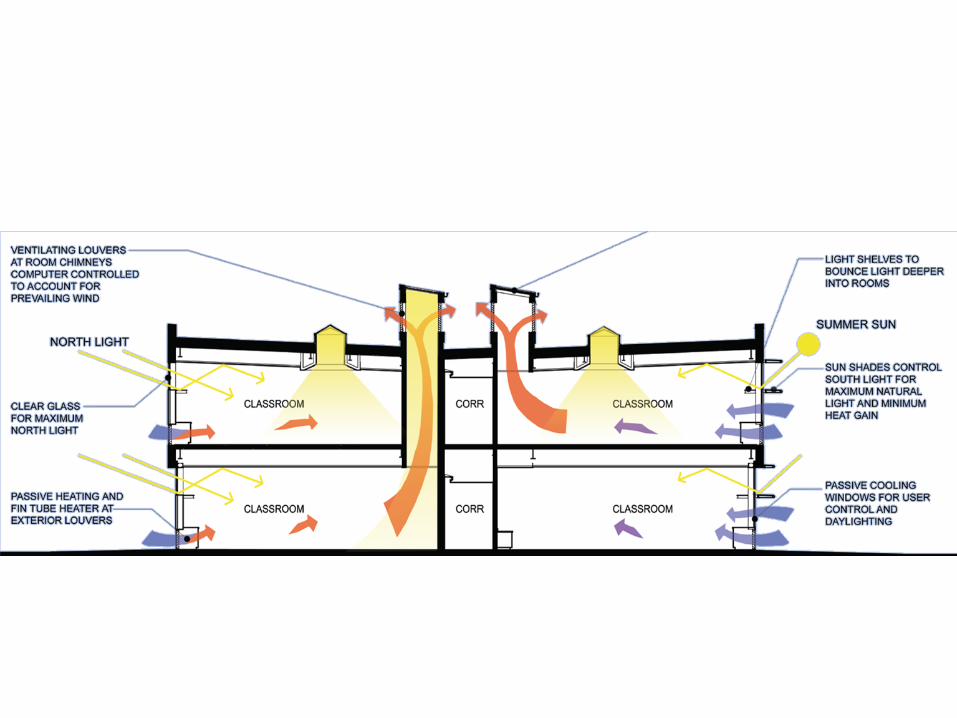
Building Configuration
55
North
56
57

Stacked Arrangement of Rooms
59
Anticipated using one
side of chimney as outlet
Inlets need
to heat air
in Winter
mode
60
102030405060708090100110120130140150160170180190200210220230240250260270280290300310320330340350360
4 t
o 6
8 t
o 1
0
12 t
o 1
4
16 t
o 1
8
20 t
o 2
2
24 t
o 2
6
28 t
o 3
0
32 t
o 3
4
36 t
o 3
8
40 t
o 4
2
44 t
o 4
6
48 t
o 5
0
52 t
o 5
4
56 t
o 5
8
60 t
o 6
2
0.0%
0.2%
0.4%
0.6%
0.8%
1.0%
1.2%
1.4%
1.6%
1.8%
Wind Direction
Wind Speed
0
50
100
150
200
250
300
350
-9° to -8°
-5° to -4°
-1° to 0°
3° to 4°
7° to 8°
11° to 12°
15° to 16°
19° to 20°
23° to 24°
27° to 28°
31° to 32°
0.00%
0.20%
0.40%
0.60%
0.80%
1.00%
1.20%
1.40%
1.60%
Wind Direction
Temperature [ºC]
Median T=12ºC

Heat Loads – Must be Distributed
• Occupants – 31 – 2325 W
• Laptops – 31 – 930 W
• LCD Projector – 150 W
• Printer – 100 W
• Lighting – 1080
• Solar
– depends on month & time of day
– 300 – 2700 W <- ironically both in December
61
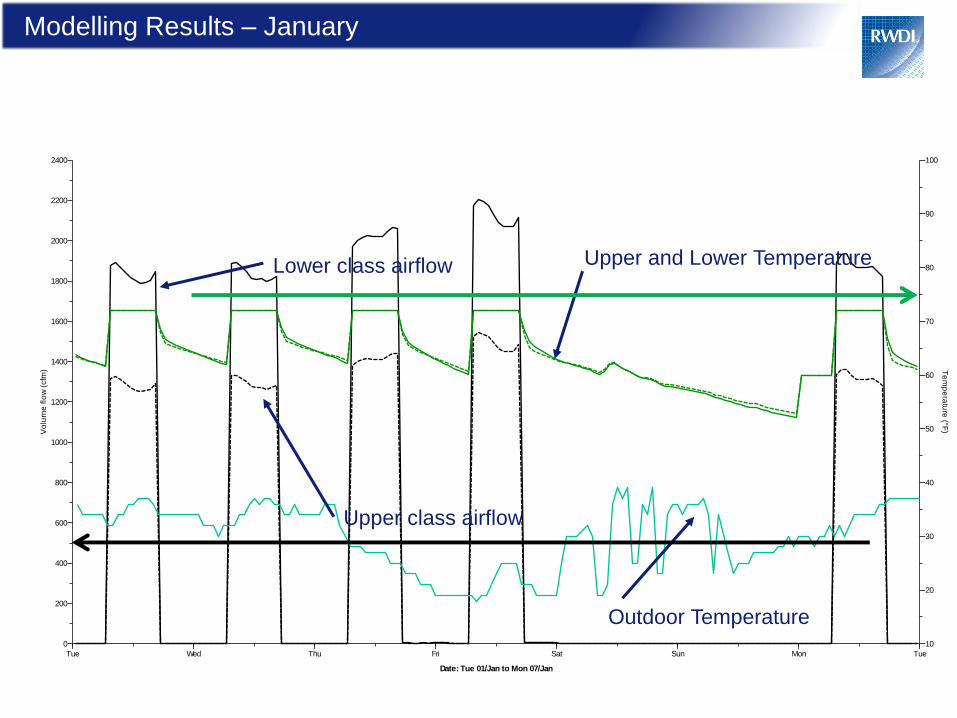
Modelling Results – January
62
Tue Wed Thu Fri Sat Sun Mon Tue
2400
2200
2000
1800
1600
1400
1200
1000
800
600
400
200
0
Vo
lum
e flo
w (
cfm
)
100
90
80
70
60
50
40
30
20
10
Te
mp
era
ture
(°F)
Date: Tue 01/Jan to Mon 07/Jan
MacroFlo external vent: Lower class (1zone 2004 nowind louversonly.aps) MacroFlo external vent: Upper class (1zone 2004 nowind louversonly.aps) Dry-bulb temperature: (1zone 2004 nowind louversonly.aps)
Air temperature: Lower class (1zone 2004 nowind louversonly.aps) Air temperature: Upper class (1zone 2004 nowind louversonly.aps)
Lower class airflow Upper and Lower Temperature
Outdoor Temperature
Upper class airflow
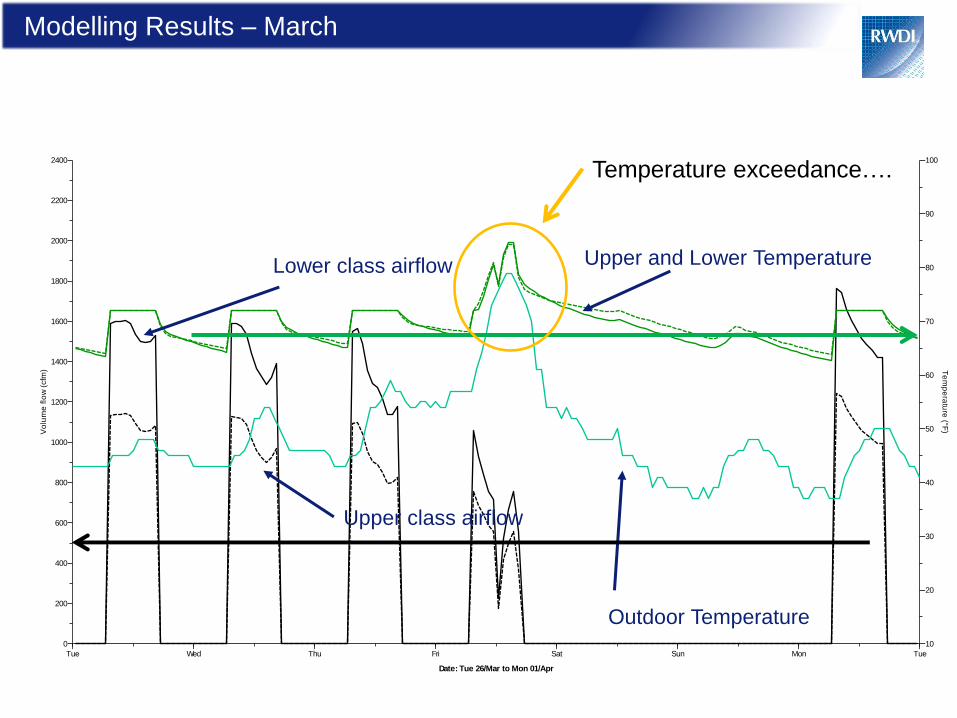
Modelling Results – March
63
Tue Wed Thu Fri Sat Sun Mon Tue
2400
2200
2000
1800
1600
1400
1200
1000
800
600
400
200
0
Vo
lum
e flo
w (
cfm
)
100
90
80
70
60
50
40
30
20
10
Te
mp
era
ture
(°F)
Date: Tue 26/Mar to Mon 01/Apr
MacroFlo external vent: Lower class (1zone 2004 nowind louversonly.aps) MacroFlo external vent: Upper class (1zone 2004 nowind louversonly.aps) Dry-bulb temperature: (1zone 2004 nowind louversonly.aps)
Air temperature: Lower class (1zone 2004 nowind louversonly.aps) Air temperature: Upper class (1zone 2004 nowind louversonly.aps)
Lower class airflow
Upper class airflow
Upper and Lower Temperature
Outdoor Temperature
Temperature exceedance….
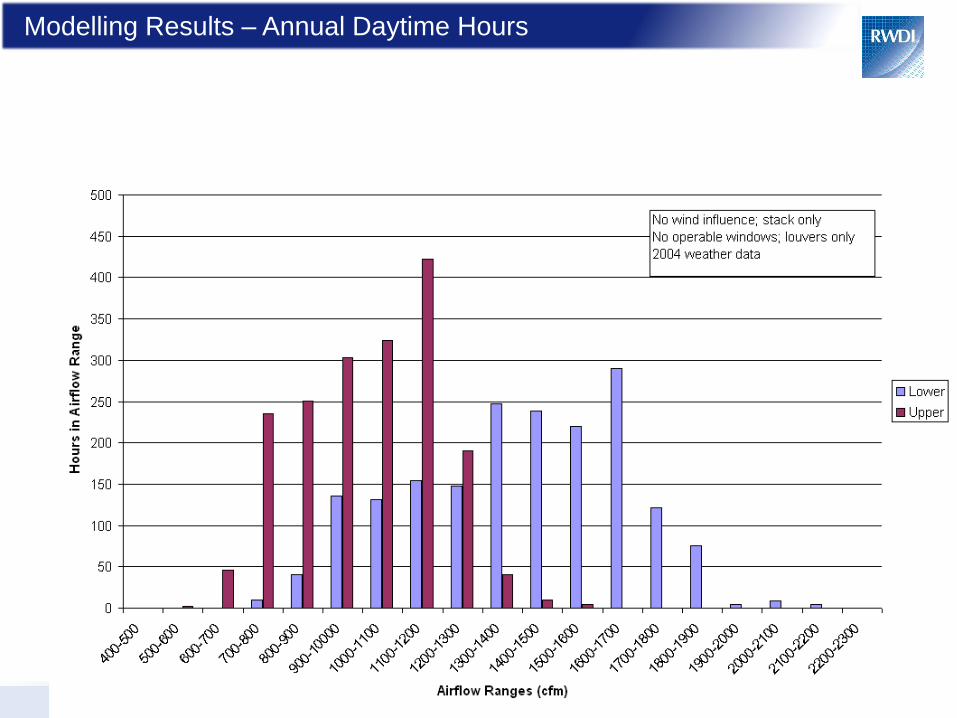
Modelling Results – Annual Daytime Hours
64
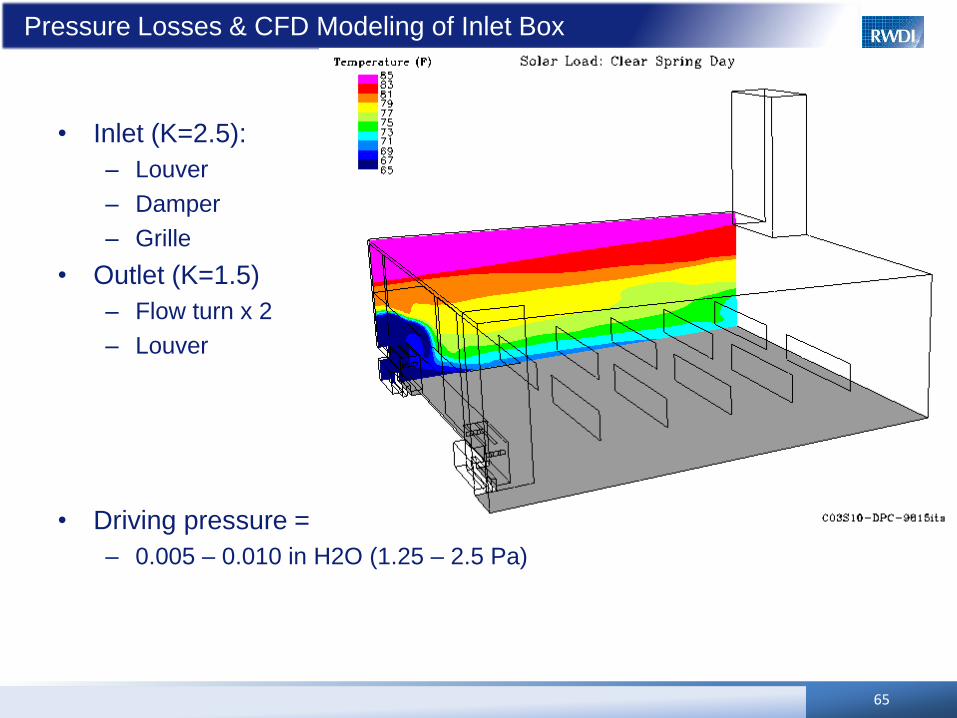
Pressure Losses & CFD Modeling of Inlet Box
• Inlet (K=2.5):
– Louver
– Damper
– Grille
• Outlet (K=1.5)
– Flow turn x 2
– Louver
• Driving pressure =
– 0.005 – 0.010 in H2O (1.25 – 2.5 Pa)
65
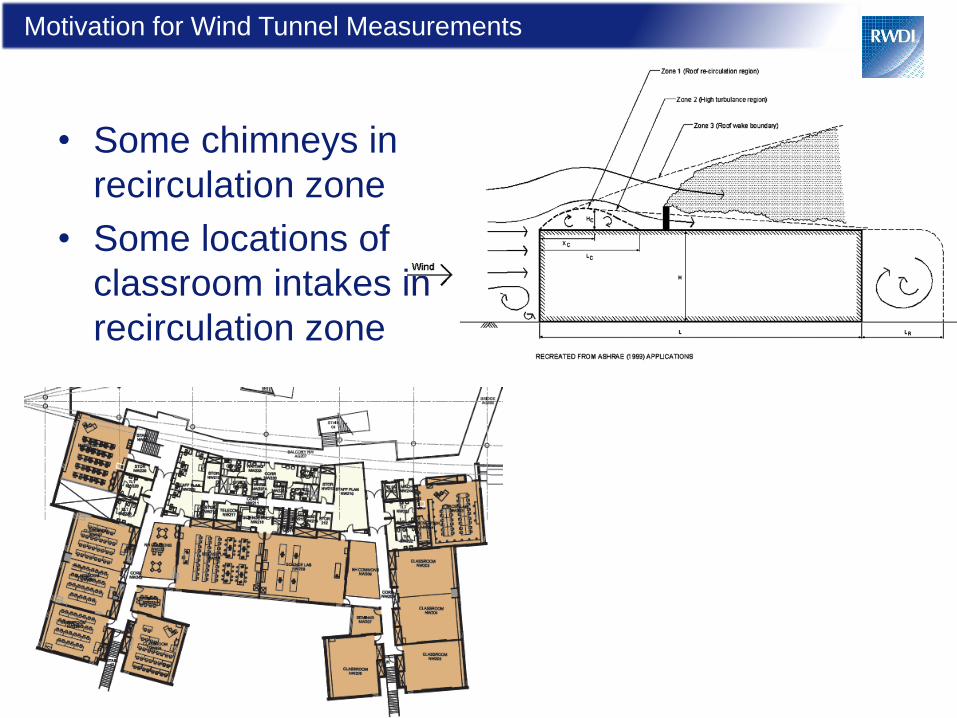
Motivation for Wind Tunnel Measurements
• Some chimneys in
recirculation zone
• Some locations of
classroom intakes in
recirculation zone
66
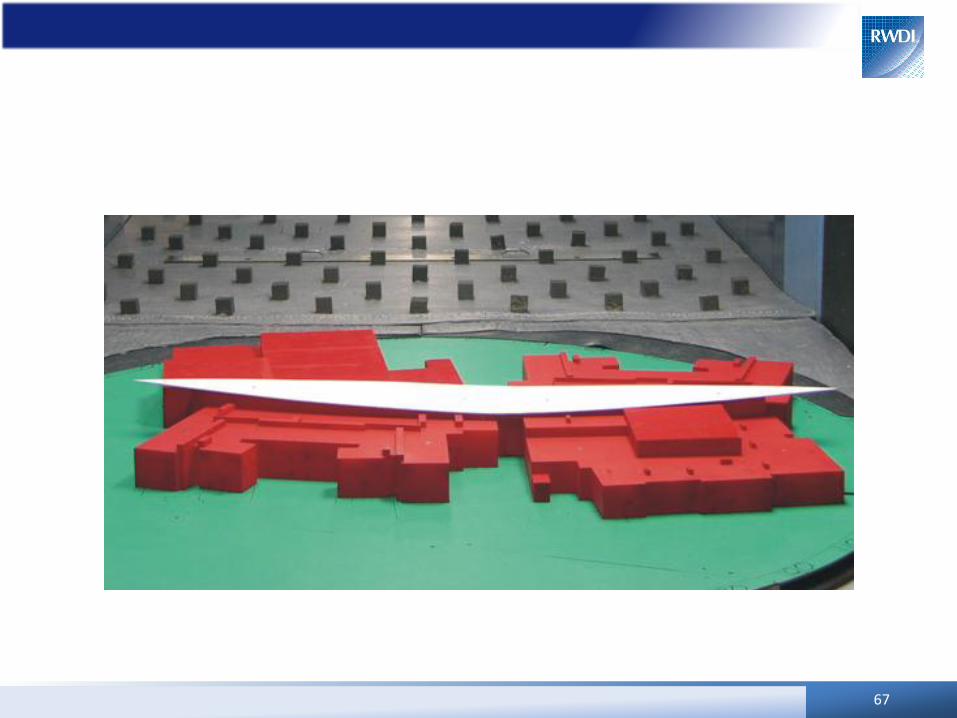
67
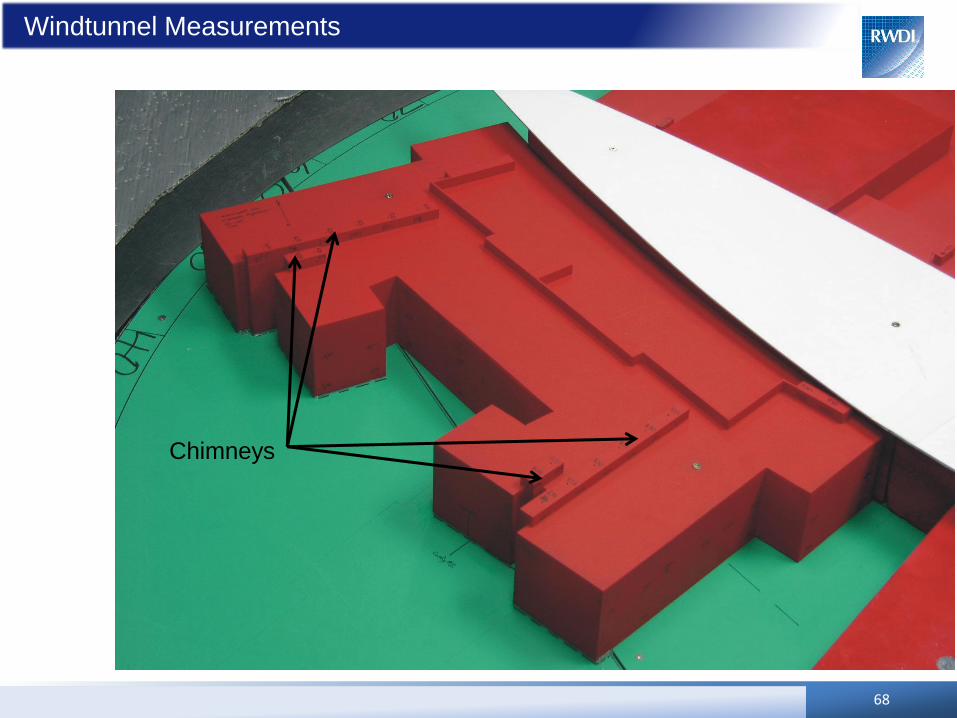
Windtunnel Measurements
68
Chimneys
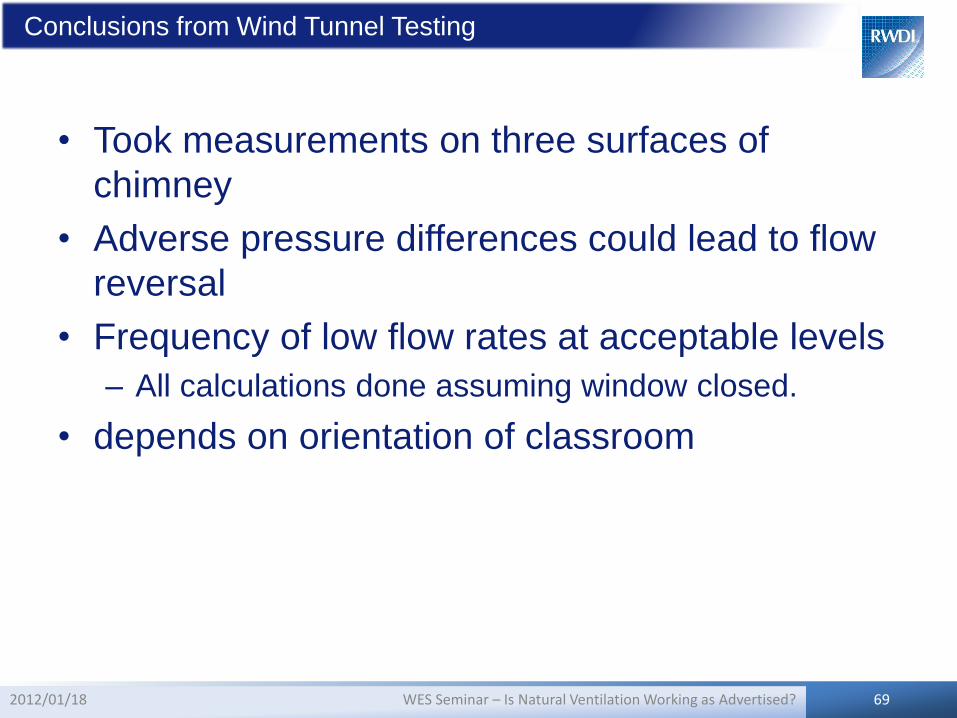
Conclusions from Wind Tunnel Testing
• Took measurements on three surfaces of
chimney
• Adverse pressure differences could lead to flow
reversal
• Frequency of low flow rates at acceptable levels
– All calculations done assuming window closed.
• depends on orientation of classroom
69 WES Seminar – Is Natural Ventilation Working as Advertised? 2012/01/18
NATURAL VENTILATION OF
TALL TOWERS
Hypothetical
70 WES Seminar – Is Natural Ventilation Working as Advertised? 2012/01/18
Natural ventilation in tall towers
• Is difficult
– Wind impacts
– Stack effect
• The benefit is not always apparent
71 WES Seminar – Is Natural Ventilation Working as Advertised? 2012/01/18
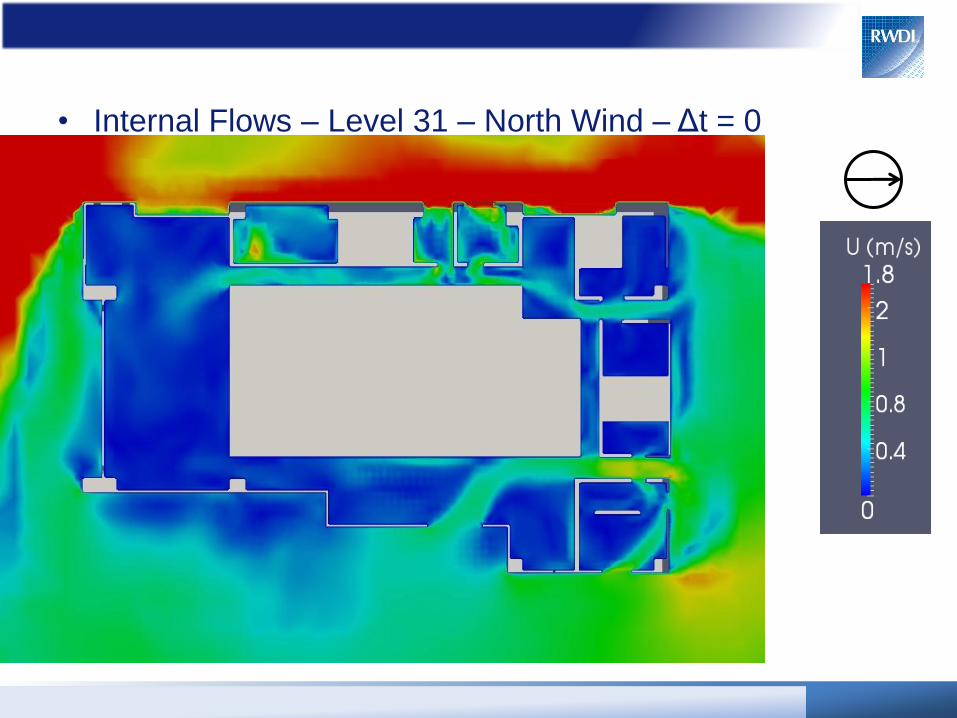
• Internal Flows – Level 31 – North Wind – Δt = 0
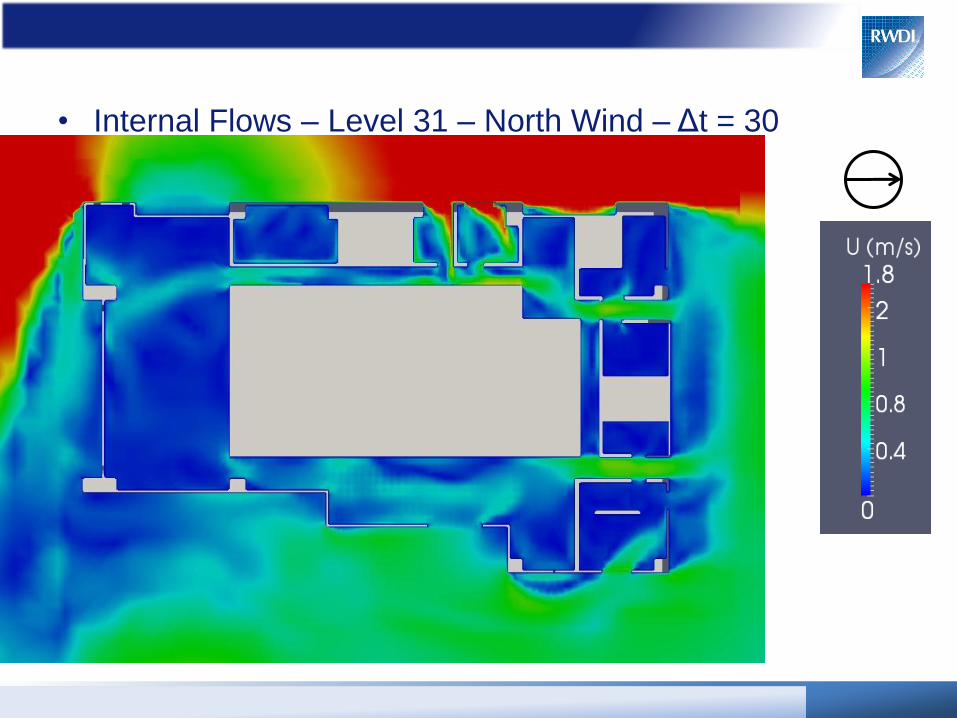
• Internal Flows – Level 31 – North Wind – Δt = 30
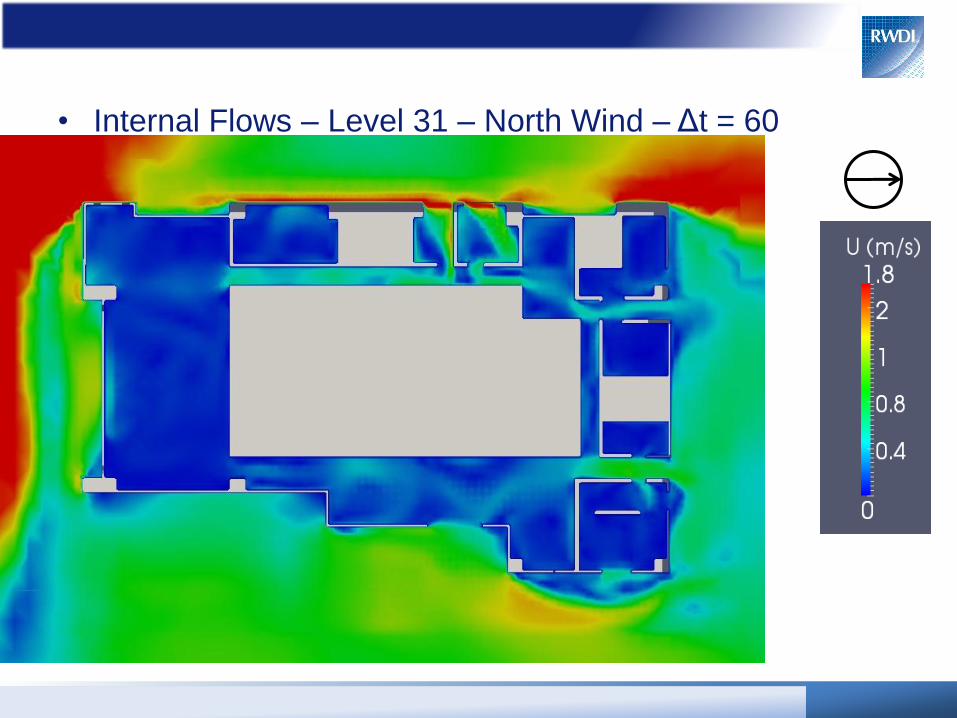
• Internal Flows – Level 31 – North Wind – Δt = 60
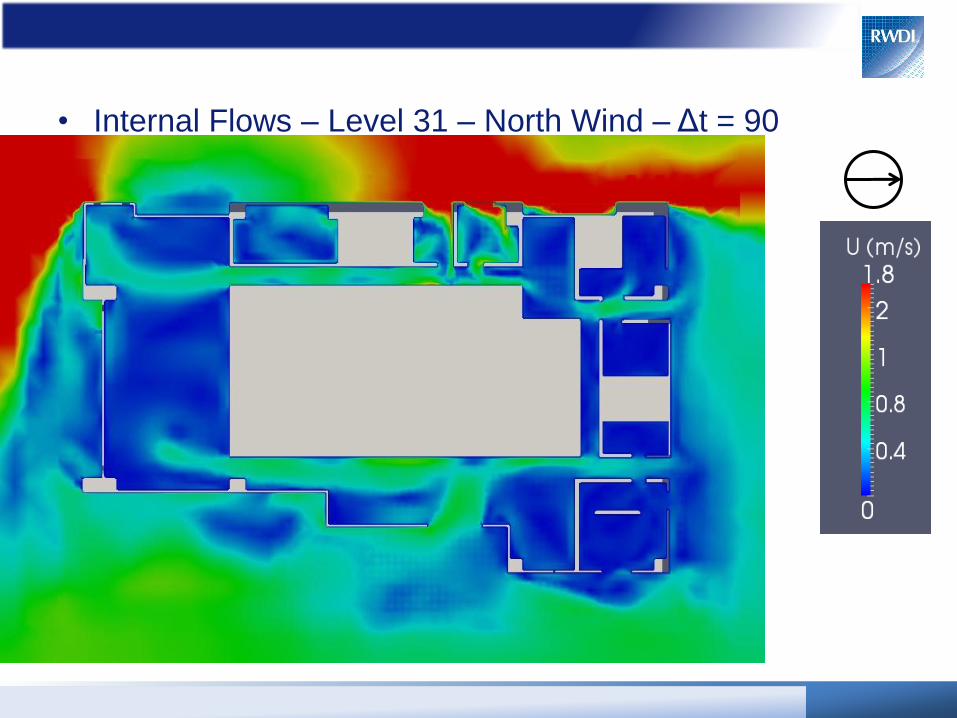
• Internal Flows – Level 31 – North Wind – Δt = 90
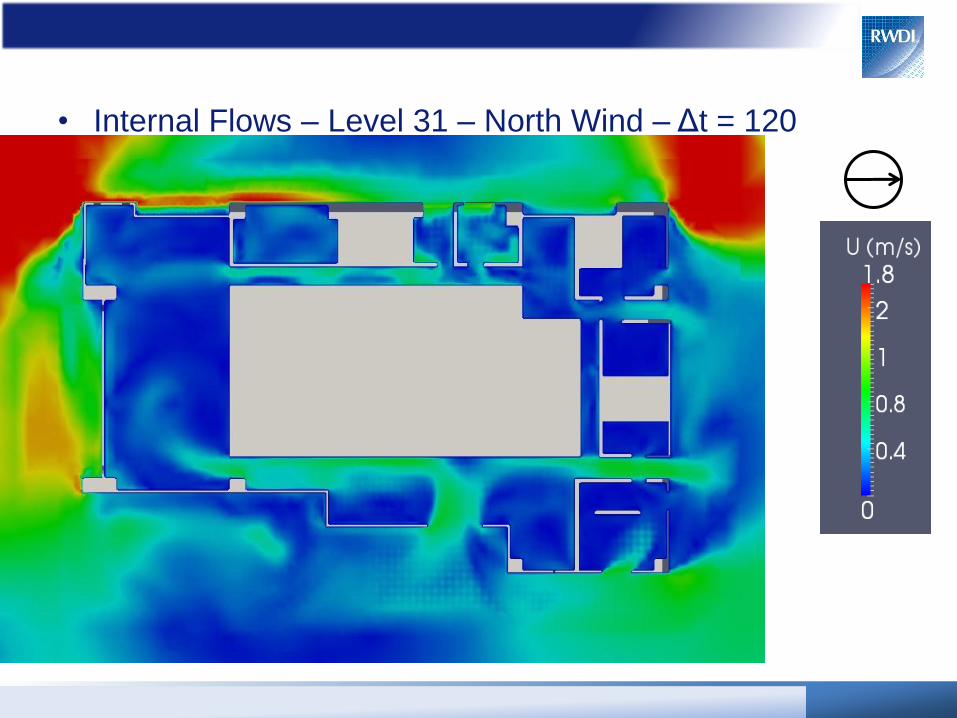
• Internal Flows – Level 31 – North Wind – Δt = 120
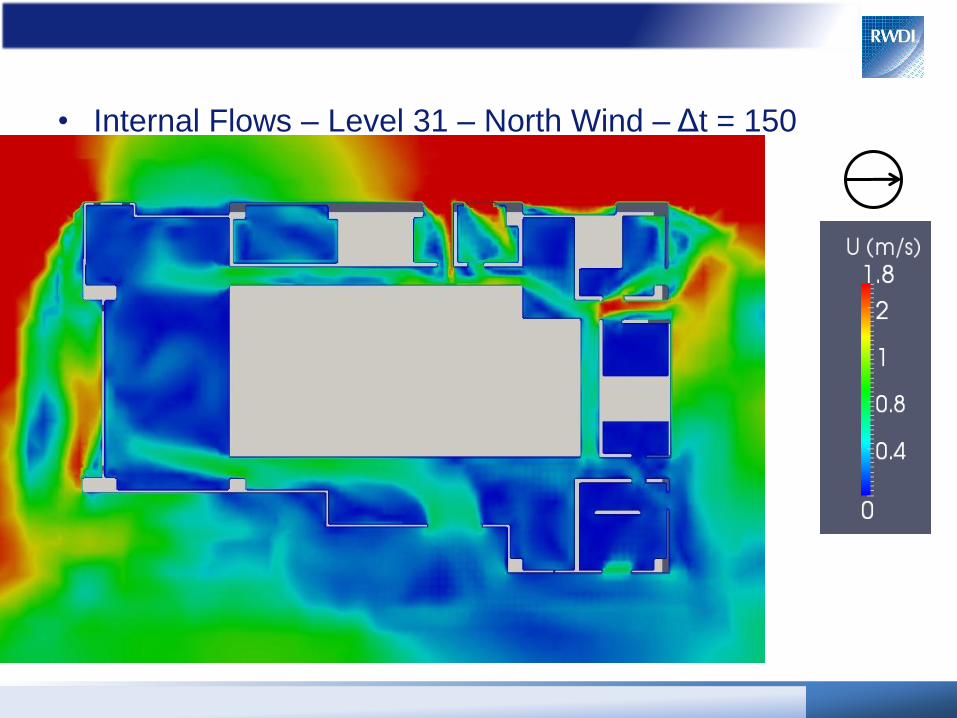
• Internal Flows – Level 31 – North Wind – Δt = 150

• Internal Flows – Level 31 – North Wind – Δt = 180
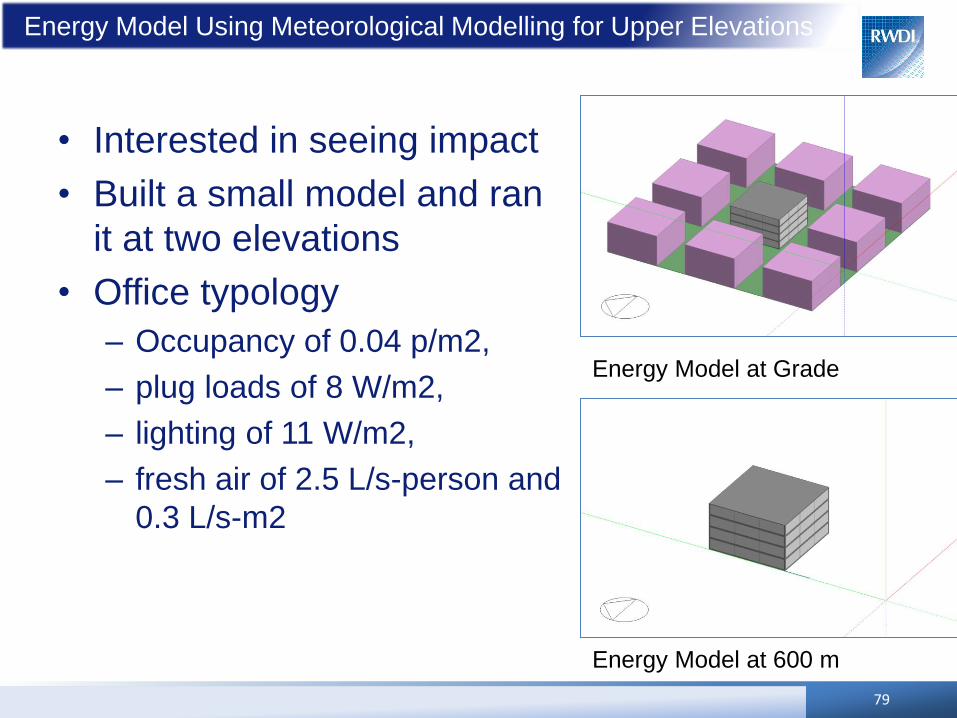
Energy Model Using Meteorological Modelling for Upper Elevations
• Interested in seeing impact
• Built a small model and ran
it at two elevations
• Office typology
– Occupancy of 0.04 p/m2,
– plug loads of 8 W/m2,
– lighting of 11 W/m2,
– fresh air of 2.5 L/s-person and
0.3 L/s-m2
79
Energy Model at 600 m
Energy Model at Grade
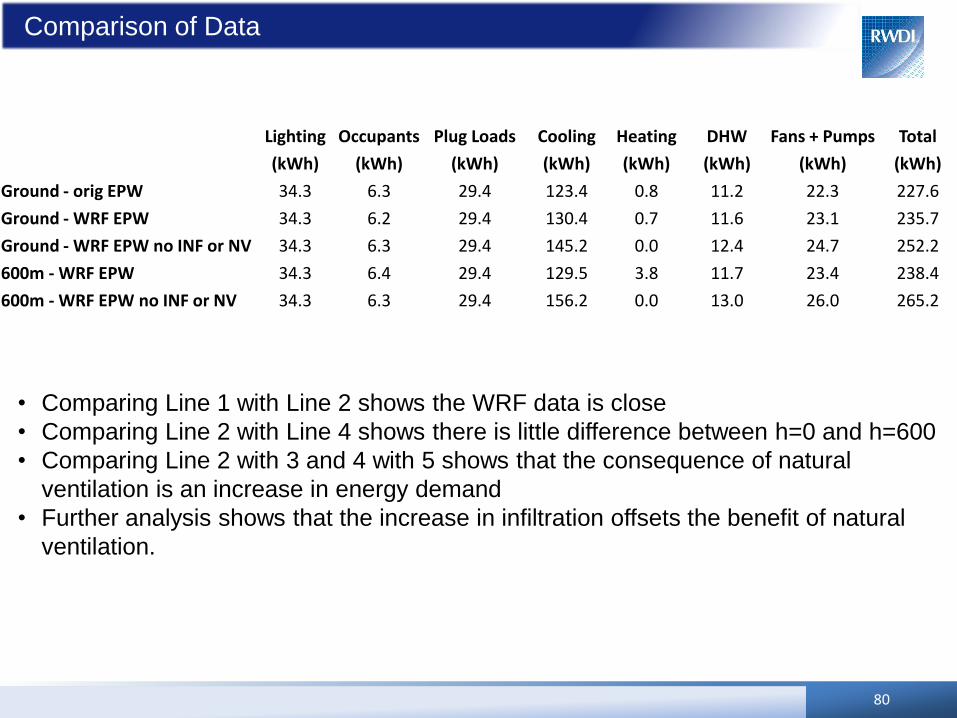
Comparison of Data
Lighting Occupants Plug Loads Cooling Heating DHW Fans + Pumps Total
(kWh) (kWh) (kWh) (kWh) (kWh) (kWh) (kWh) (kWh)
Ground - orig EPW 34.3 6.3 29.4 123.4 0.8 11.2 22.3 227.6
Ground - WRF EPW 34.3 6.2 29.4 130.4 0.7 11.6 23.1 235.7
Ground - WRF EPW no INF or NV 34.3 6.3 29.4 145.2 0.0 12.4 24.7 252.2
600m - WRF EPW 34.3 6.4 29.4 129.5 3.8 11.7 23.4 238.4
600m - WRF EPW no INF or NV 34.3 6.3 29.4 156.2 0.0 13.0 26.0 265.2
80
• Comparing Line 1 with Line 2 shows the WRF data is close
• Comparing Line 2 with Line 4 shows there is little difference between h=0 and h=600
• Comparing Line 2 with 3 and 4 with 5 shows that the consequence of natural
ventilation is an increase in energy demand
• Further analysis shows that the increase in infiltration offsets the benefit of natural
ventilation.
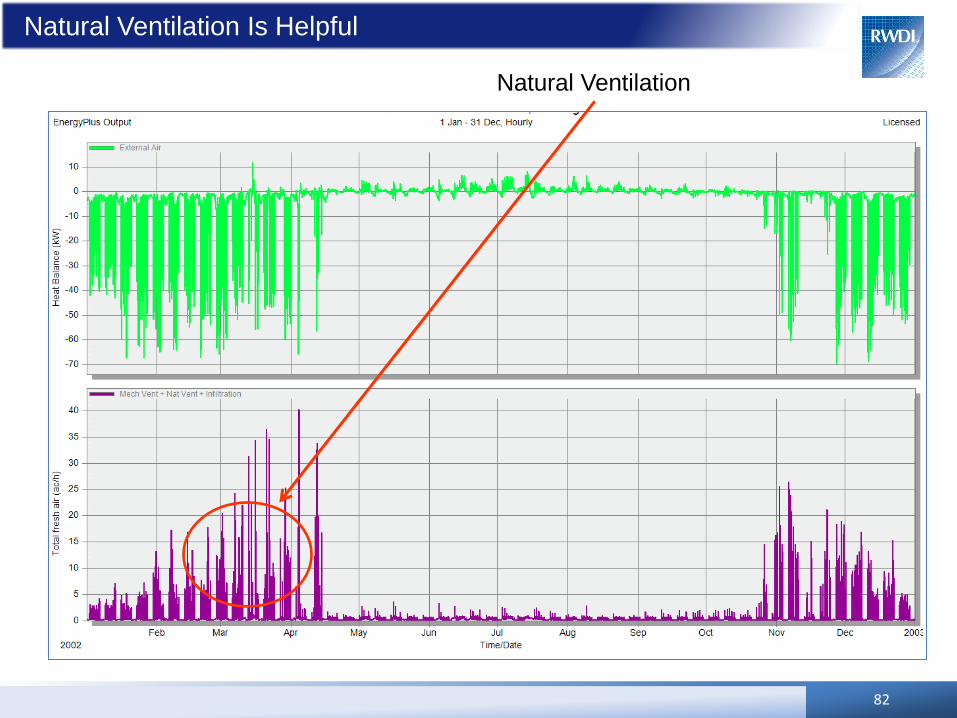
Natural Ventilation Is Helpful
82
Natural Ventilation
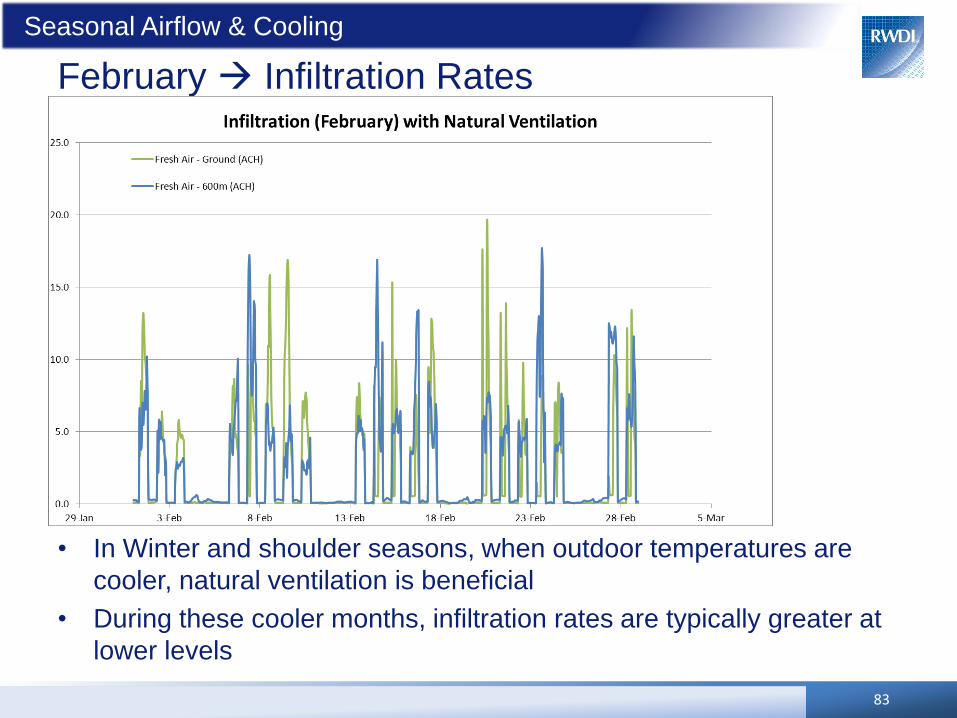
Seasonal Airflow & Cooling
February Infiltration Rates
83
• In Winter and shoulder seasons, when outdoor temperatures are
cooler, natural ventilation is beneficial
• During these cooler months, infiltration rates are typically greater at
lower levels
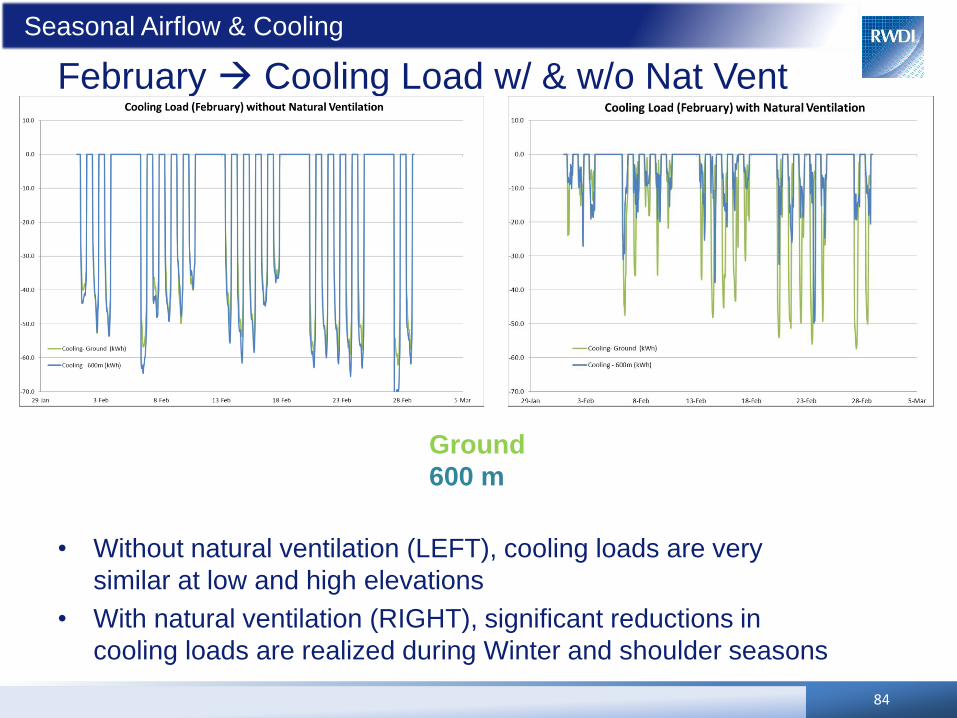
Seasonal Airflow & Cooling
February Cooling Load w/ & w/o Nat Vent
84
• Without natural ventilation (LEFT), cooling loads are very
similar at low and high elevations
• With natural ventilation (RIGHT), significant reductions in
cooling loads are realized during Winter and shoulder seasons
Ground
600 m
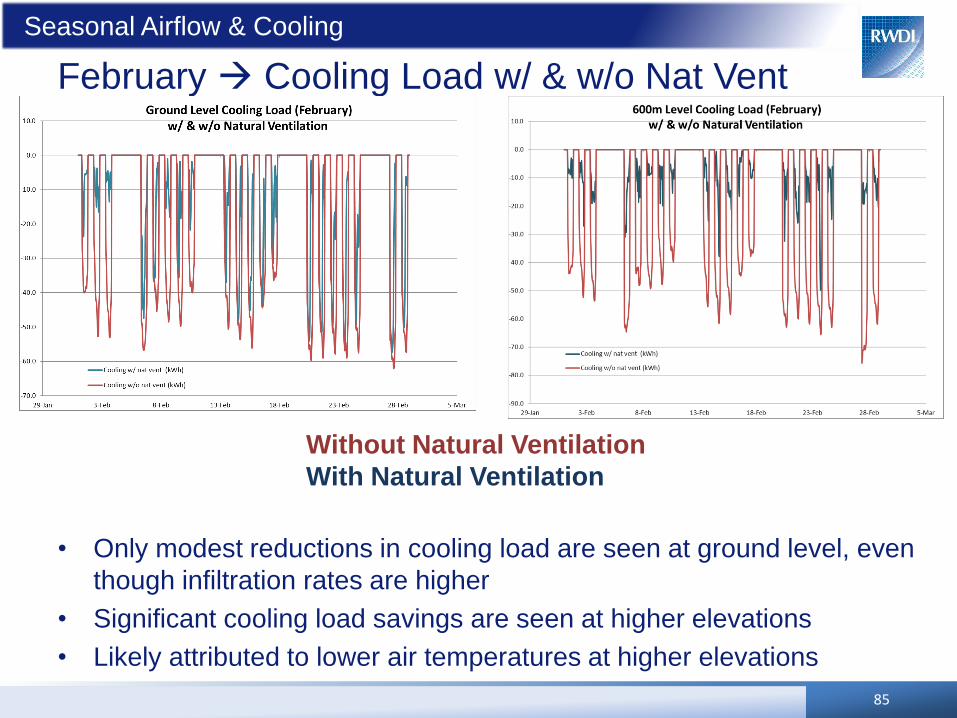
Seasonal Airflow & Cooling
February Cooling Load w/ & w/o Nat Vent
85
• Only modest reductions in cooling load are seen at ground level, even
though infiltration rates are higher
• Significant cooling load savings are seen at higher elevations
• Likely attributed to lower air temperatures at higher elevations
Without Natural Ventilation
With Natural Ventilation
Closing Thoughts
• Lots of opportunity for natural ventilation design
in buildings
– Stack effect control
• We haven’t discussed thermal mass, turbulence
benefits, designing openings, etc.
• This requires close coordination at beginning of
project between architect, MEP, SE, climate
consultant, QS, Construction, FM
89