the anatomy of a recession: what to look for and where we
TRANSCRIPT
1Past performance is no guarantee of future results. Financial term and index definitions are available in theappendix.
The Anatomy of a Recession: What to Look for and WhereWe’re Headed
Josh Jamner, CFAVice President, Investment Strategy Analyst
Fourth Quarter 2021

2Not for distribution to the generalpublic.Confidential and proprietaryinformation.
Table of Contents
Economic Outlook 3Market Outlook 23Inflation 41Valuations 50Market Leadership 55International 63Volatility 71

3Not for distribution to the generalpublic.Confidential and proprietaryinformation.
Economic Outlook

4
Probabilities vs. PossibilitiesThe Wall of Worry
Equity Valuations Fed Policy Error Civil Unrest
Trade Wars North KoreaEscalation
Dollar Debasement COVID-19 Sovereign Debt Crisis
Taper Tantrum Inflation
Corporate Leverage China Over-Tightening
Populism EM Problems Intensify
5
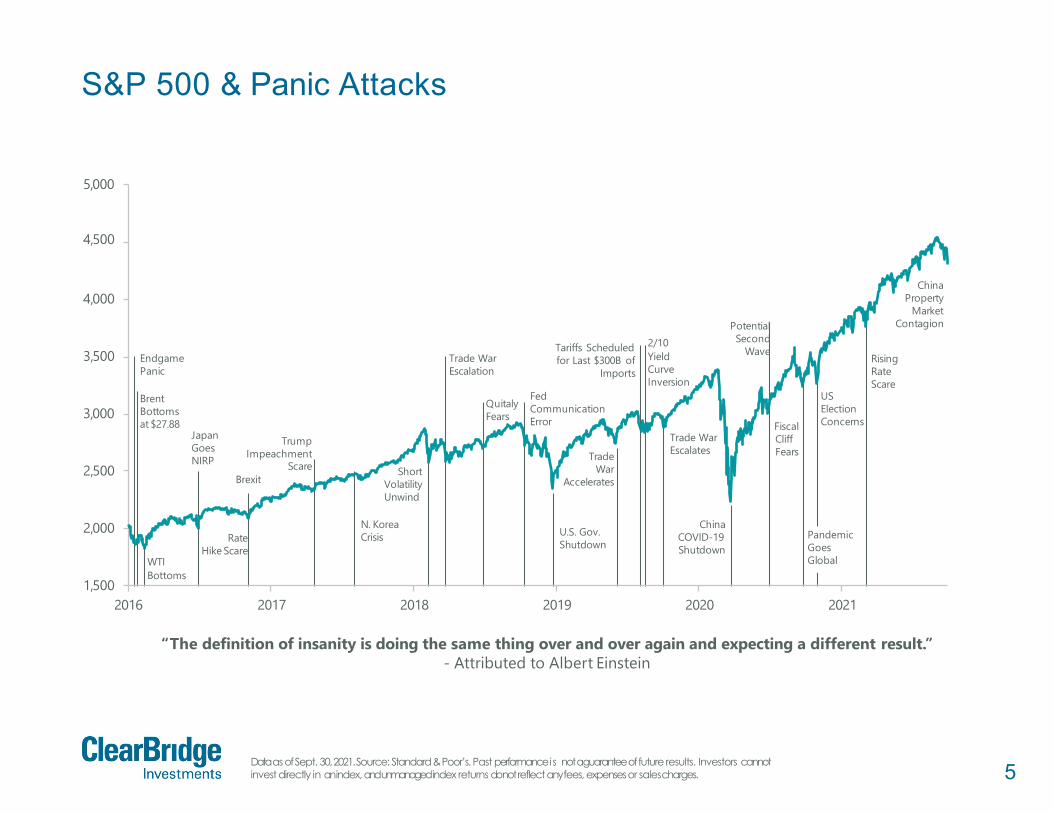
S&P 500 & Panic Attacks
Data as of Sept. 30, 2021. Source: Standard & Poor’s. Past performance is not a guarantee of future results. Investors cannotinvest directly in an index, and unmanaged index returns do not reflect any fees, expenses or salescharges.
1,500
2,000
2,500
3,000
3,500
4,000
5,000
4,500
2016
Trade War
Accelerates
Tariffs Scheduledfor Last $300B of
ImportsEndgamePanic
Brent Bottoms at $27.88
Japan Goes NIRP
WTIBottoms
RateHike Scare
TrumpImpeachment
ScareBrexit
N. KoreaCrisis
ShortVolatilityUnwind
Trade WarEscalation
QuitalyFears
Fed Communication Error
U.S. Gov.Shutdown
2/10Yield Curve Inversion
2017 2018 2019 2020 2021
“The definition of insanity is doing the same thing over and over again and expecting a different result.”- Attributed to Albert Einstein
ChinaCOVID-19Shutdown
Potential Second
Wave
FiscalCliffFears
PandemicGoesGlobal
USElection Concerns
Rising Rate Scare
Trade WarEscalates
China Property
Market Contagion
6
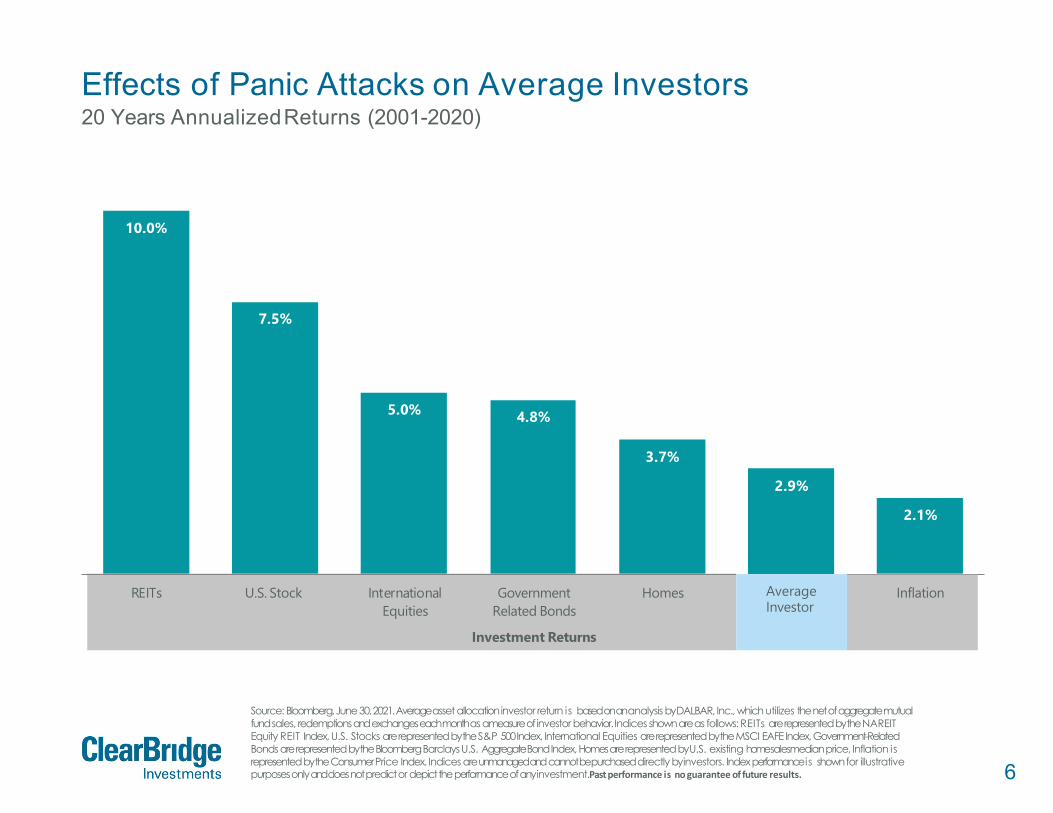
10.0%
7.5%
5.0% 4.8%
3.7%
2.9%
2.1%
REITs U.S. Stock InternationalEquities
GovernmentRelated Bonds
Investment Returns
Homes Average Investor Inflation
Effects of Panic Attacks on Average Investors20 Years AnnualizedReturns (2001-2020)
Source: Bloomberg, June 30, 2021. Average asset allocation investor return is based on an analysis by DALBAR, Inc., which utilizes the net of aggregate mutual fund sales, redemptions andexchanges each month as a measure of investor behavior. Indices shown are as follows: REITs are represented by the NAREIT Equity REIT Index, U.S. Stocks are represented by the S&P 500 Index, International Equities are represented by the MSCI EAFE Index, Government-Related Bonds are represented by the Bloomberg Barclays U.S. Aggregate Bond Index, Homes are represented by U.S. existing home salesmedian price, Inflation is represented by the Consumer Price Index. Indices are unmanaged andcannot be purchased directly by investors. Index performance is shown for illustrative purposes only and does not predict or depict the performance of any investment.Past performance is no guarantee of future results.
AverageInvestor
7
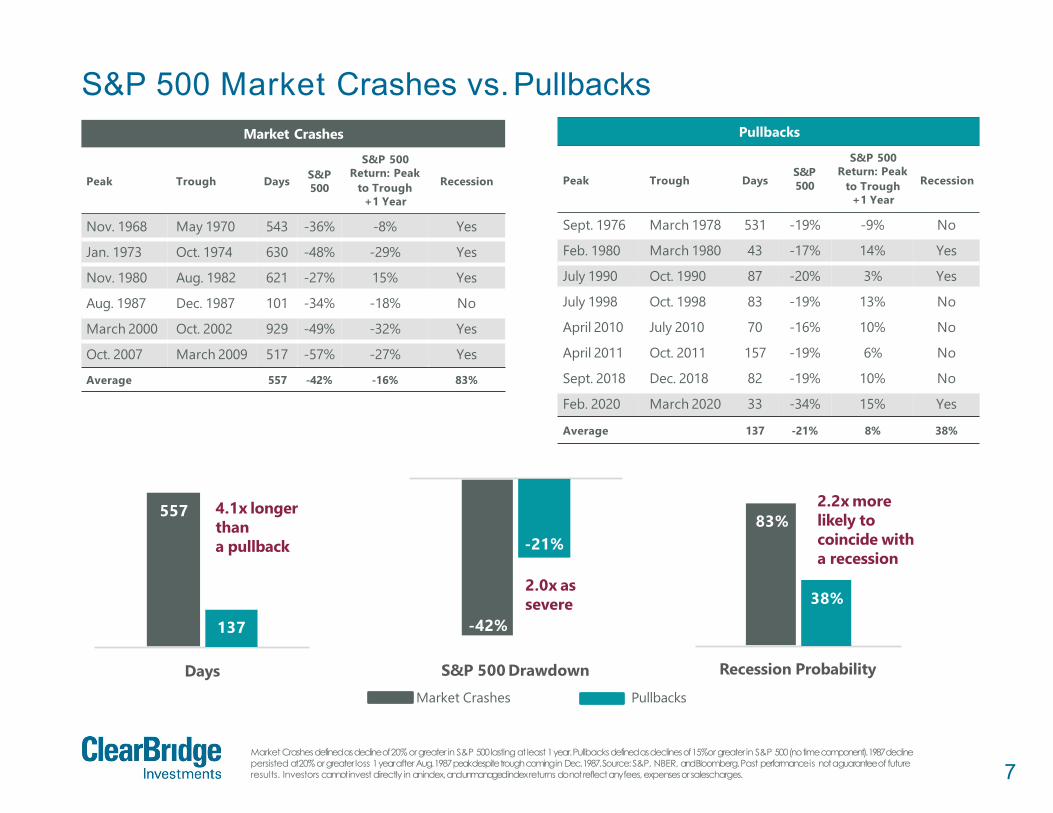
S&P 500 Market Crashes vs.Pullbacks
Market Crashes defined as decline of 20% or greater in S&P 500 lasting at least 1 year. Pullbacks defined as declines of 15%or greater in S&P 500 (no time component). 1987 decline persisted at 20% or greater loss 1 year after Aug. 1987 peak despite trough coming in Dec. 1987. Source: S&P, NBER, and Bloomberg. Past performance is not a guarantee of future results. Investors cannot invest directly in an index, and unmanaged index returns do not reflect any fees, expenses or salescharges.
Market Crashes
Peak Trough Days S&P500
S&P 500Return: Peak
to Trough+1 Year
Recession
Nov. 1968 May 1970 543 -36% -8% Yes
Jan. 1973 Oct. 1974 630 -48% -29% Yes
Nov. 1980 Aug. 1982 621 -27% 15% Yes
Aug. 1987 Dec. 1987 101 -34% -18% No
March 2000 Oct. 2002 929 -49% -32% Yes
Oct. 2007 March 2009 517 -57% -27% Yes
Average 557 -42% -16% 83%
557
137
Days
4.1x longerthana pullback
-42%
-21%
S&P 500 DrawdownMarket Crashes Pullbacks
2.0x assevere
83%
38%
Recession Probability
2.2x morelikely to coincide with a recession
Pullbacks
Peak Trough DaysS&P 500
S&P 500Return: Peak
to Trough+1 Year
Recession
Sept. 1976 March 1978 531 -19% -9% No
Feb. 1980 March 1980 43 -17% 14% Yes
July 1990 Oct. 1990 87 -20% 3% Yes
July 1998 Oct. 1998 83 -19% 13% No
April 2010 July 2010 70 -16% 10% No
April 2011 Oct. 2011 157 -19% 6% No
Sept. 2018 Dec. 2018 82 -19% 10% No
Feb. 2020 March 2020 33 -34% 15% Yes
Average 137 -21% 8% 38%
8
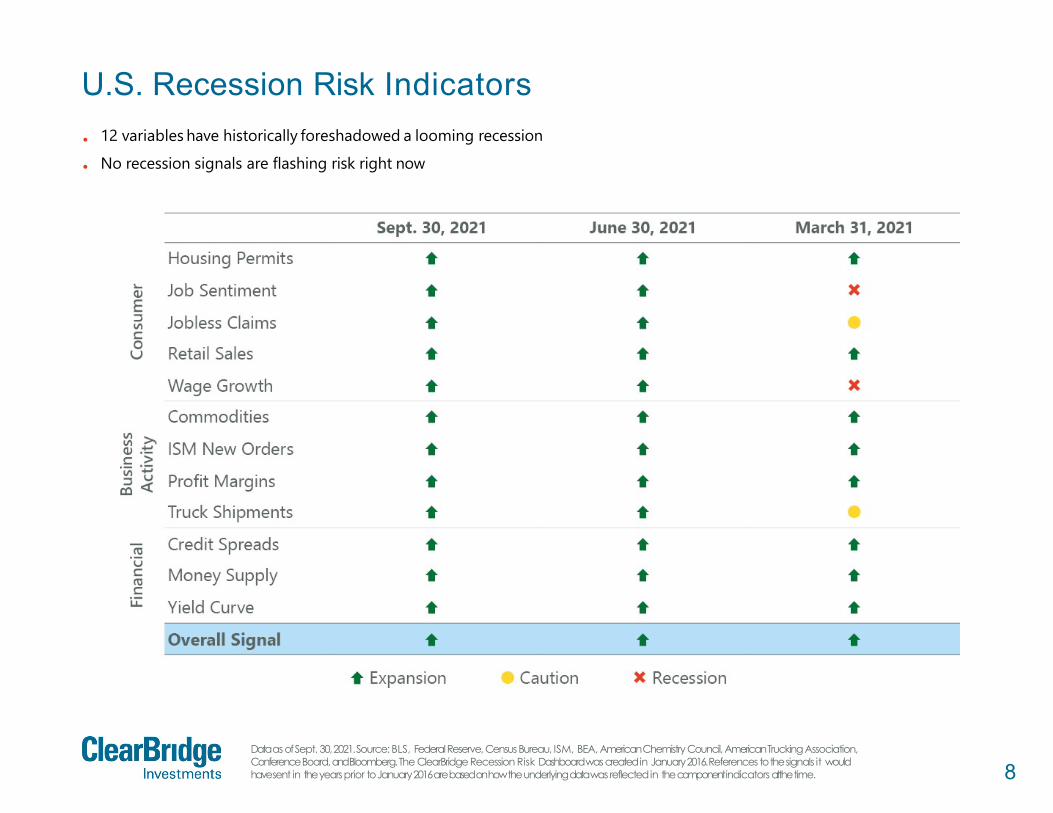
U.S. Recession Risk Indicators
Data as of Sept. 30, 2021. Source: BLS, Federal Reserve, Census Bureau, ISM, BEA, American Chemistry Council, American Trucking Association, Conference Board, and Bloomberg. The ClearBridge Recession Risk Dashboard was created in January 2016. References to the signals it would have sent in the years prior to January 2016 are based on how the underlying data was reflected in the component indicators at thetime.
••
12 variables have historically foreshadowed a looming recession No recession signals are flashing risk right now
9
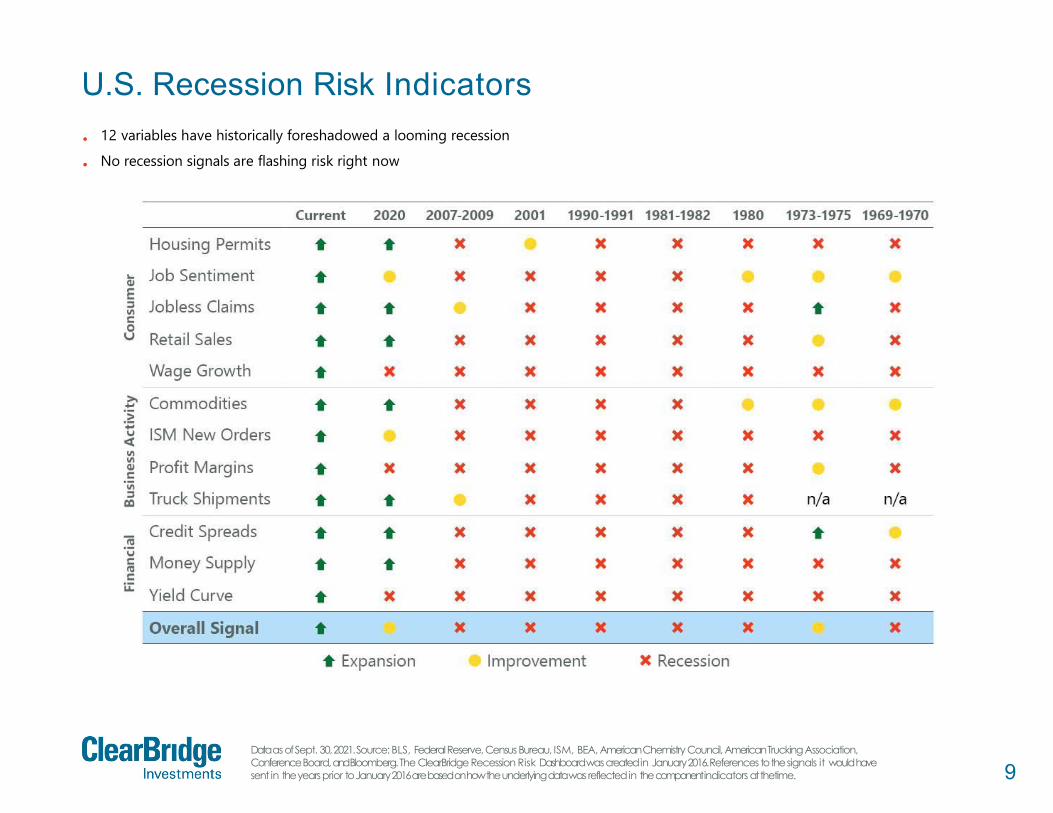
U.S. Recession Risk Indicators
Data as of Sept. 30, 2021. Source: BLS, Federal Reserve, Census Bureau, ISM, BEA, American Chemistry Council, American Trucking Association, Conference Board, and Bloomberg. The ClearBridge Recession Risk Dashboard was created in January 2016. References to the signals it would have sent in the years prior to January 2016 are based on how the underlying data was reflected in the component indicators atthetime.
•
•
12 variables have historically foreshadowed a looming recession
No recession signals are flashing risk right now

10
U.S. Recession Risk DashboardCase Study: 2018-2020
Source: BLS, Federal Reserve, Census Bureau, ISM, BEA, American Chemistry Council, American Trucking Association, ConferenceBoard, and Bloomberg. The ClearBridge Recession Risk Dashboard was created in January 2016. References to the signals it would have sentin the years prior to January 2016 are based on how the underlying data was reflected in the component indicators at the time.
2,718
2,507
2,942
3,231
3,100
2,200
2,400
2,600
2,800
3,000
3,200
3,400
Q2 2018 Q4 2018 Q2 2019 Q4 2019 Q2 2020
S&P
500
Overall Signal:
Overall Signal:
Overall Signal:
Housing Permits
Cons
umer Job Sentiment
Jobless Claims
Retail Sales
Wage Growth
Commodities
Busin
ess
Act
ivity ISM New Orders
Profit Margins
Truck Shipments
Fina
ncia
l Credit Spreads
MoneySupply
Yield Curve

11Source: Strategas. Past performance is not a guarantee of future results. Investors cannot invest directly in an index, and unmanaged index returns do not reflect any fees, expenses or sales charges.
Fiscal Cliff?
11.4%
2.8%2.3%
0.9%
0.0%0%
2%
4%
6%
8%
10.4%
10%
12%
2020 2023
Stim
ulus
asa
%of
GD
P
2021 2022Current With Passage of Biden's Agenda (Estimated)
With Passage of Biden’s Entire Fiscal Agenda
Although stimulus is set to wane in the coming years, higher compensation andhealthy job creation should support consumption and blunt the fiscal drag.

12
Labor Supply Coming
Data as of Sept. 11, 2021, latest available as of Sept. 30, 2021. Source: Bloomberg. Past performance is not a guarantee of future results. Investors cannot invest directly in an index, and unmanaged index returns do not reflect any fees, expenses or salescharges.
10
8
6
4
2
0
12
18
16
14
Mar. 2020
Num
bero
fCla
ims(
Mill
ions
)
Federal UI Benefits
May. 2020 Jul. 2020 Sep. 2020 Oct. 2020 Dec. 2020
Pandemic Emergency Unemployment Compensation (PEUC)
Feb. 2021 Apr. 2021 May. 2021 Jul. 2021 Sep. 2021
Pandemic Unemployment Assistance (PUA)
The federal pandemic unemployment benefit programs expired on September 6th. 8.5 million people lost all benefits, while many more lost the $300/month supplement. Given record job openings and tight labor supply, this should help alleviate the bottleneck.
PUA and PEUC Expiration: 9/6/21
13
60
40
20
0
80
200
180
160
140
120
100
1978 1984 2014 2020
Mor
eO
ptim
isti
c
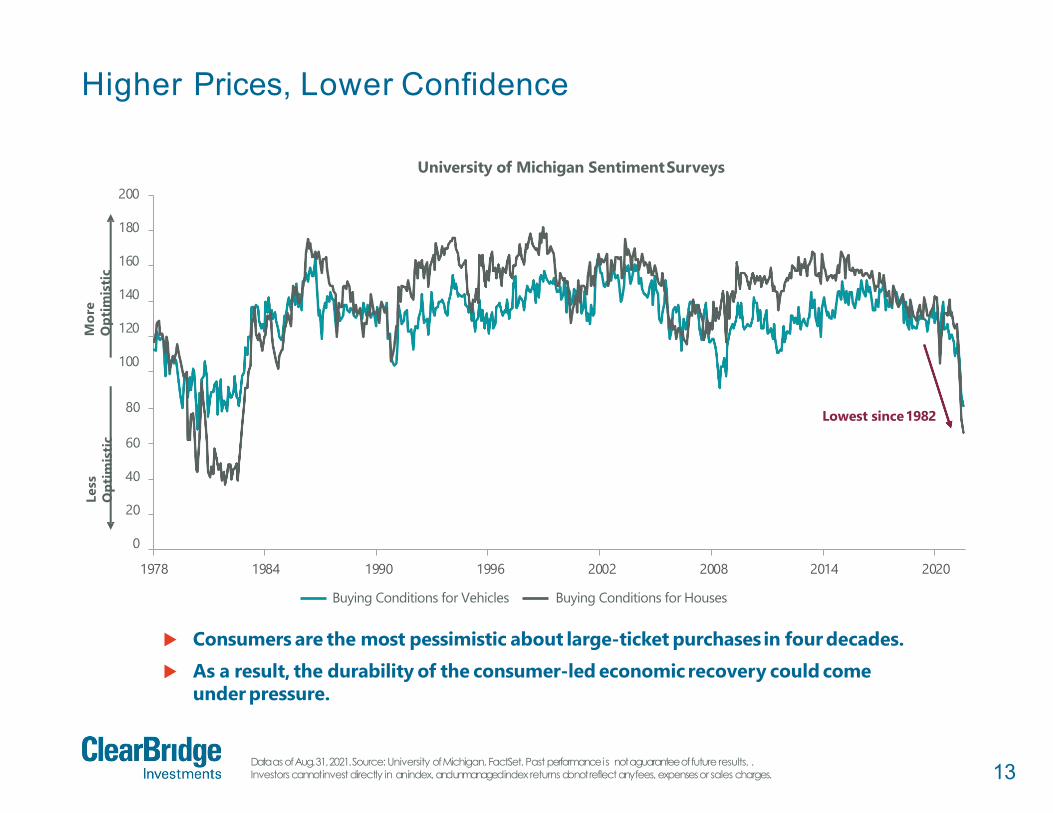
University of Michigan SentimentSurveys
1990 1996
Buying Conditions for Vehicles
2002 2008
Buying Conditions for Houses
Consumers are the most pessimistic about large-ticket purchases in four decades. As a result, the durability of the consumer-led economicrecovery could come
under pressure.
Less
Opt
imis
ticHigher Prices, Lower Confidence
Data as of Aug. 31, 2021. Source: University of Michigan, FactSet. Past performance is not a guarantee of future results. . Investors cannot invest directly in an index, and unmanaged index returns do not reflect any fees, expenses or sales charges.
Lowest since1982
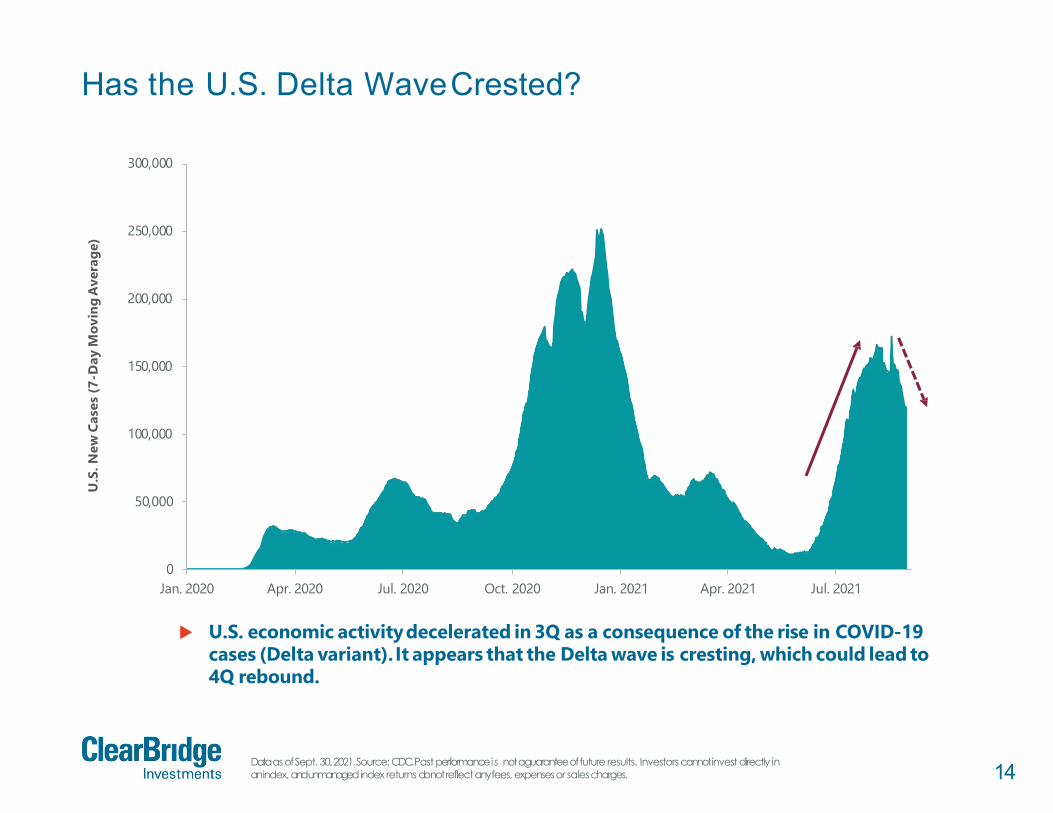
14Data as of Sept. 30, 2021. Source: CDC. Past performance is not a guarantee of future results. Investors cannot invest directly in an index, and unmanagedindex returns do not reflect any fees, expenses or salescharges.
Has the U.S. Delta WaveCrested?
50,000
100,000
150,000
200,000
250,000
300,000
U.S
.New
Case
s(7
-Day
Mov
ing
Ave
rage
)
0Jan. 2020 Apr. 2020 Jul. 2020 Oct. 2020 Jan. 2021 Apr. 2021 Jul. 2021
U.S. economic activitydecelerated in 3Q as a consequence of the rise in COVID-19 cases (Delta variant). It appears that the Delta wave is cresting, which could lead to 4Q rebound.

15The Citi Economic Surprise Index is United States based. Data as of Sept. 30, 2021. Source: FactSet. Past performance is nota guarantee of future results. Investors cannot invest directly in an index, and unmanaged index returns do not reflect any fees, expenses or salescharges.
Economic Surprise to Rebound300
250
200
150
100
50
0
-50
-100
-150
-200
2011 2012 2013 2014 2015 2016 2017 2018 2019 2020 2021
Citi
Econ
omic
Sur
prise
Inde
x
The spread of Delta has caused a slowdown in economic activitydriving data below expectations.
The Citi Economic Surprise Index has reached levels consistent with past non-recessionary troughs, suggesting an inflection higher could be near.

16
Not The Global Financial Crisis: Labor
Post-GFC, it took until 2014 for the labor market to recover to pre-crisis levels. The majority of job losses have been in COVID-19 sensitive industries, which suggests
a faster pace of job creation as the economy normalizes.
Source: DOL,FactSet.
2
4
6
8
10
12
Mill
ion
s
U.S. Job Openings
2004 2006 2008 2010 2012 2014 2016 2018 2020
Recession U.S. Job Openings
Net
Job
s(M
illio
ns)
Net Change in Payroll: February 2020Peak
Feb. 2021 Aug. 2021High COVID-19 Exposure
-1.2 Million
-4.1 Million
0-2-4-6-8
-10-12-14-16-18-20Feb. 2020 Aug. 2020
Low COVID-19 ExposureSource: Bloomberg, BLS, INETOxford.
High and low COVID-19 exposure is based on supply/demand shocks resulting from the COVID-19 pandemic. Aggregate net change in payroll employment in theseindustries is measured relative to February 2020 peak employment levels. High COVID-19 exposure industries account for ~60% of pre-pandemic total non-farm payroll employment; Low COVID-19 exposure industries account for ~40% of pre-pandemic total non-farm payroll employment. Data as of Sept. 30, 2021. Past performance is not a guarantee of future results. Investors cannot invest directly in an index, and unmanaged index returns do not reflect any fees, expenses or salescharges.

17
Sharp Drops in Confidence, in Context
*Non-recessionary periods refer to athree monthchangeof -17.5% or worse, six months before/after recessions included in recessionary periods.Dataas of Aug.31, 2021. Source: Bloomberg, The ConferenceBoard. Past performance is not aguaranteeof future results. Investors cannot investdirectly in anindex, andunmanagedindex returns donotreflectanyfees, expensesor salescharges.
160
180
200
Conference Board Consumer Confidence Index
140
120
100
80
60
40
20
01977 1980 1982 1985 1987 1990 1992 1995 1997 2000 2002 2005 2007 2010 2012 2015 2017 2020
Recession Conference Board Consumer Confidence Index
While persistent declines in consumer confidence tend to presage recessions,sharp butshort-lived declines are not uncommon.
When these latter drops occur amidst economic expansions,they typically prove to be an attractive entrypoint.
Average 12M Return After Drops in Confidence of
Similar/Greater Magnitude: 7.9%
Non-Recessionary*: 15.3%

18Data as of June 30, 2021, latest available as of Sept. 30, 2021. Source: Federal Reserve Bank of St. Louis. Past performanceis not a guarantee of future results. Investors cannot invest directly in an index, and unmanaged index returns do not reflect any fees, expenses or salescharges.
Aren’t Recessions Supposed to be Painful?
$20
$40
$60
$80
$100
$120
$140
1997 1999 2001 2003 2015 2017 2019 2021
U.S
.Hou
seho
ldsN
etW
orth
(Tril
lion)
2005 2007
Recession
2009 2011 2013
U.S. Households NetWorth
Historically, recessions have put a dent in household net worth. Since the end of 2019 (pre-COVID), U.S. household net worth has increased
by $25 trillion (21.3%).
19
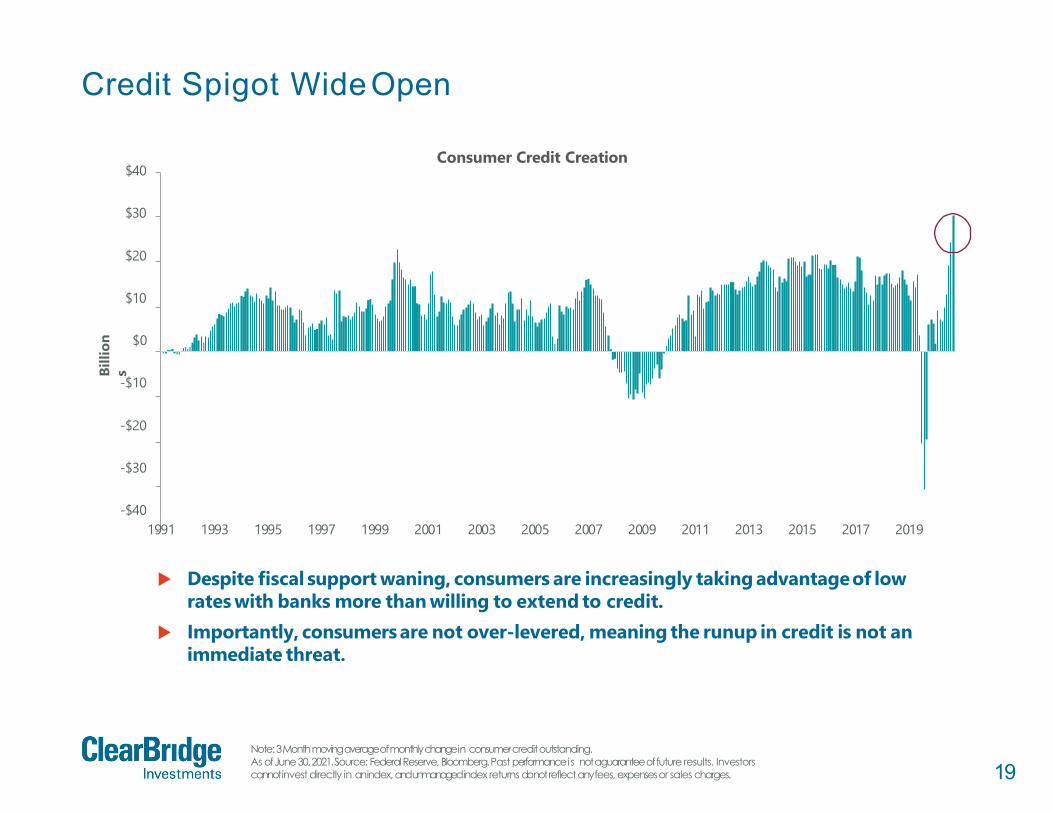
Credit Spigot WideOpen
Note: 3 Month moving average of monthly change in consumer creditoutstanding.As of June 30, 2021. Source: Federal Reserve, Bloomberg. Past performance is not a guarantee of future results. Investors cannot invest directly in an index, and unmanaged index returns do not reflect any fees, expenses or sales charges.
Billi
ons
Consumer Credit Creation$40
$30
$20
$10
$0
-$10
-$20
-$30
-$401991 1993 1995 1997 1999 2001 2003 2005 2007 2009 2011 2013 2015 2017 2019
Despite fiscal support waning, consumers are increasingly taking advantageof lowrates with banks more than willing to extend to credit.
Importantly, consumers are not over-levered, meaning the runup in credit is not animmediate threat.

20
Inventory Rebuild, EconomicTailwind?
Data as of July 31, 2021, latest available as of Sept. 30, 2021. Source: U.S. Census Bureau, FactSet.Past performance is not a guarantee of future results. Investors cannot invest directly in an index, and unmanaged index returns do not reflect any fees, expenses or sales charges.
1.70
1.65
1.60
1.55
1.50
1.45
1.40
1.35
1.30
1.25
1.20
2008 2009 2010 2011 2019 2020 2021
U.S
. Man
ufac
turi
ng a
nd T
rade
Inve
ntor
y/Sa
les
Ratio
2012 2013
Recession
2014 2015 2016 2017 2018
Total Business Inventories/Sales Ratio
Inventory levels relativeto sales have not been this depleted since 2011. Businesseswill likely re-stock inventories in anticipationof growing demand, providing
further economic upside in 2021.
21Data as of June 30, 2021. Source: Bloomberg, Factset, Federal Reserve System. Past performance is not a guarantee of future results. Investors cannot invest directly in an index, and unmanaged index returns do not reflect any fees, expenses or salescharges.
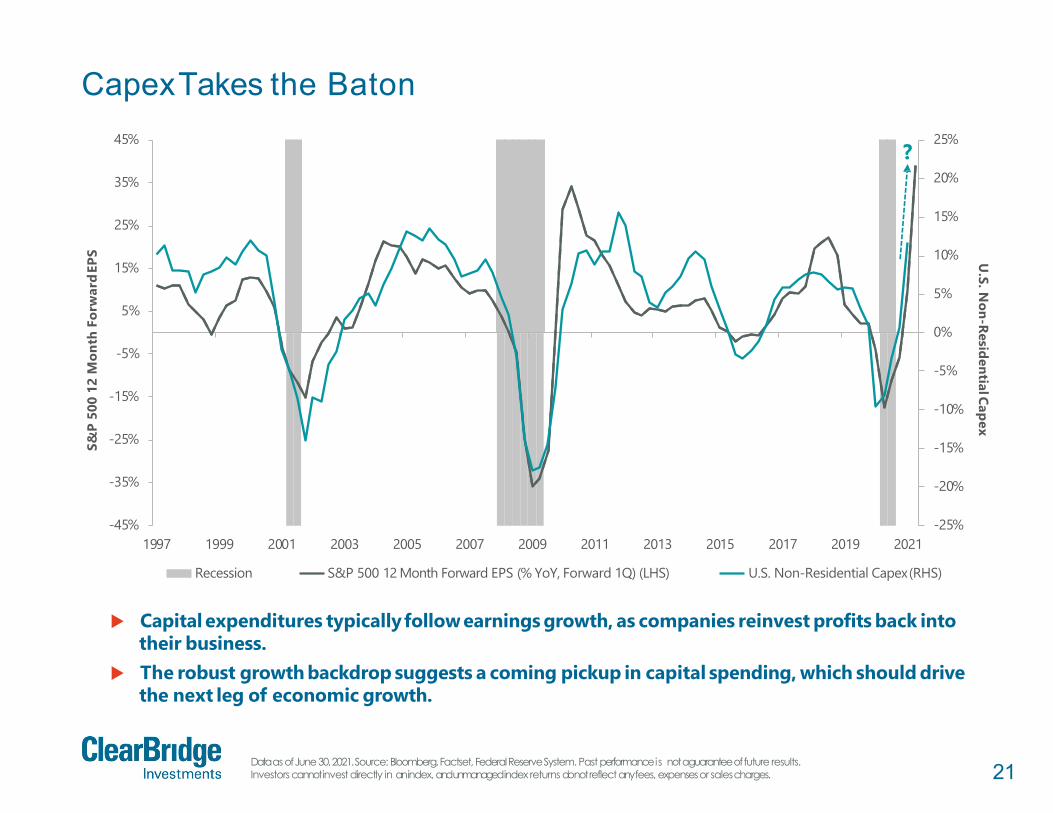
CapexTakes the Baton
-25%
-20%
-15%
-10%
-5%
0%
5%
10%
15%
20%
25%
-45%
-35%
-25%
-15%
-5%
5%
15%
25%
35%
45%
1997 2001 2015
U.S. N
on-ResidentialCapexS&
P 50
0 12
Mon
th F
orw
ard
EPS
1999
Recession
2003 2005 2007 2009 2011 2013
S&P 500 12 Month Forward EPS (% YoY, Forward 1Q) (LHS)
2017 2019 2021
U.S. Non-Residential Capex(RHS)
Capital expenditures typicallyfollowearnings growth, as companies reinvest profits back intotheir business.
The robust growth backdrop suggests a coming pickup in capital spending, which should drivethe next leg of economic growth.
?
22
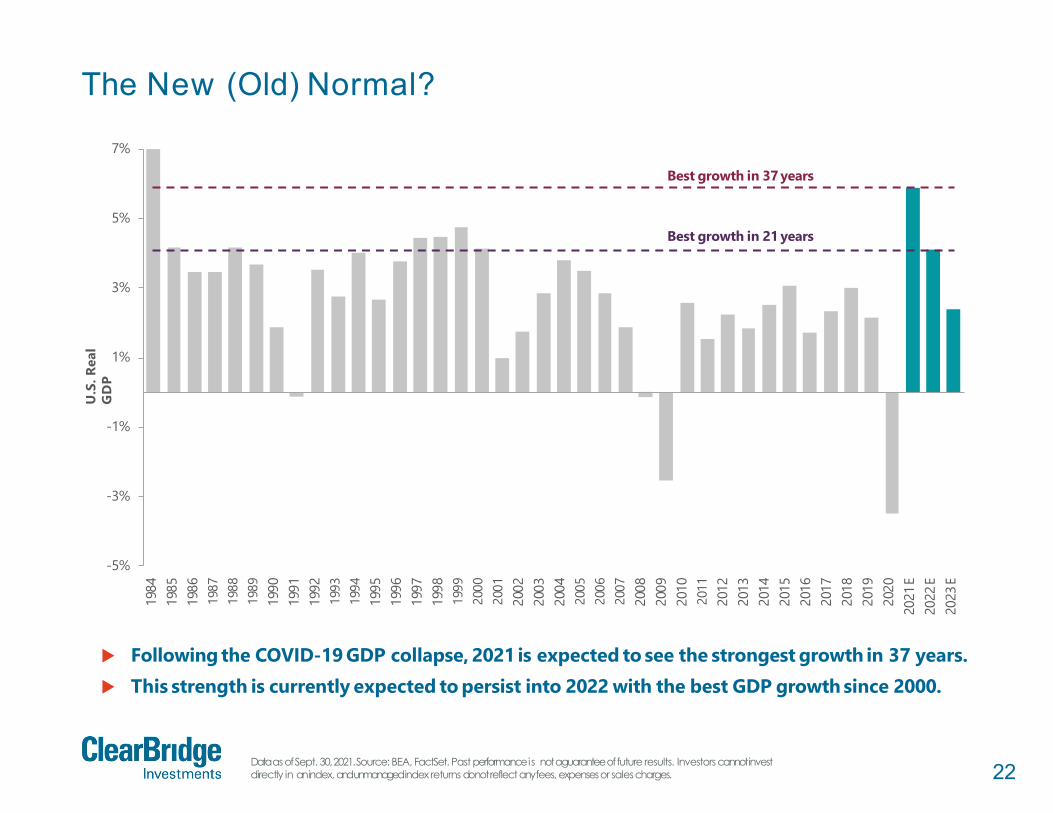
The New (Old) Normal?
Data as of Sept. 30, 2021. Source: BEA, FactSet. Past performance is not a guarantee of future results. Investors cannot invest directly in an index, and unmanaged index returns do not reflect any fees, expenses or salescharges.
-5%
-3%
-1%
1%
3%
5%
7%19
8419
8519
8619
8719
8819
8919
9019
9119
9219
9319
9419
9519
9619
9719
9819
9920
0020
0120
0220
0320
0420
0520
0620
0720
0820
0920
1020
1120
1220
1320
1420
1520
1620
1720
1820
1920
2020
21E
2022
E20
23E
U.S
. Rea
lG
DP
Following the COVID-19 GDP collapse, 2021 is expected to see the strongest growth in 37 years. This strength is currently expected to persist into 2022 with the best GDP growth since 2000.
Best growth in 37 years
Best growth in 21 years

23Not for distribution to the generalpublic.Confidential and proprietaryinformation.
Market Outlook

24
Early Gains Need Digesting
Data as of Sept. 30, 2021. Source: FactSet, S&P Global. Past performance is not a guarantee of future results. Investors cannot invest directly in an index, and unmanaged index returns do not reflect any fees, expenses or sales charges.
210
200
190
180
170
160
150
140
130
120
110
100
90
80
700 12 24 36 48 60 72 84 96 108 120
S&P
500
S&P 500 Rallies After Bear Markets
Number of Weeks
Average Rallies Off 1966, 1970, 1974, 1982, 1987, 2003, 2009, 2018 Lows Rally Since March2020
Followinga substantial rally fromthe lows, equities typically experience lackluster returns as the handoff fromearly to mid-cycle occurs.
A Period of Consolidation at thisPoint in the Cycle is Common
?
25
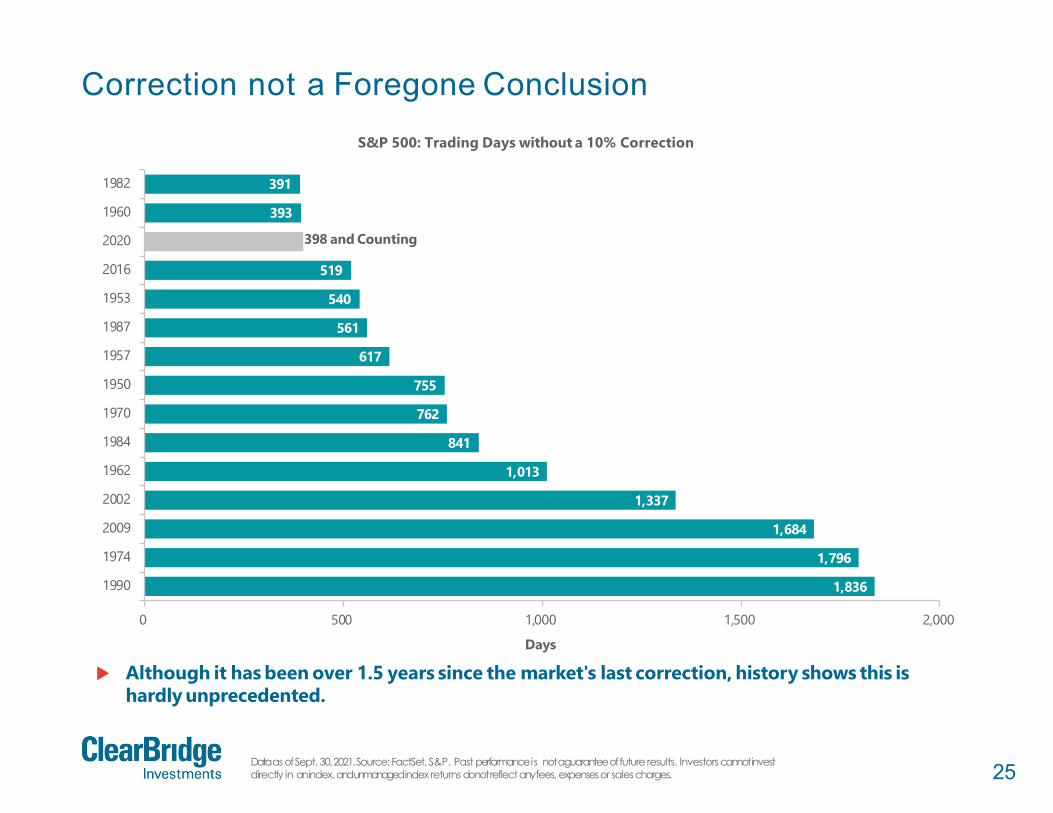
Correction not a Foregone Conclusion
Data as of Sept. 30, 2021. Source: FactSet, S&P. Past performance is not a guarantee of future results. Investors cannot invest directly in an index, and unmanaged index returns do not reflect any fees, expenses or salescharges.
1,836
1,796
1,684
1,337
1,013
841
762
755
617
561
540
519
398 and Counting
393
391
0 500 1,500 2,000
1982
1960
2020
2016
1953
1987
1957
1950
1970
1984
1962
2002
2009
1974
1990
1,000
Days
S&P 500: Trading Days without a 10% Correction
Although it has been over 1.5 years since the market's last correction, history shows this ishardly unprecedented.
26
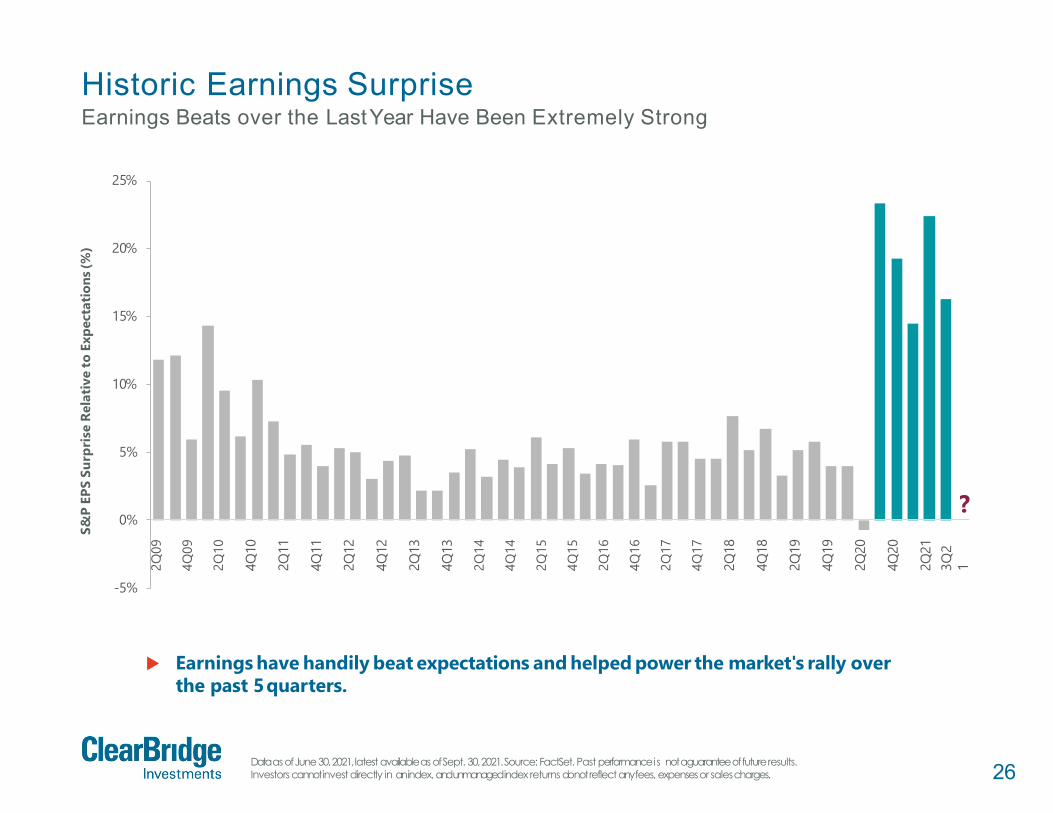
Historic Earnings SurpriseEarnings Beats over the LastYear Have Been Extremely Strong
Data as of June 30, 2021, latest available as of Sept. 30, 2021. Source: FactSet. Past performance is not a guarantee of future results. Investors cannot invest directly in an index, and unmanaged index returns do not reflect any fees, expenses or salescharges.
-5%
0%
5%
10%
15%
20%
25%
S&P
EPS
Surp
rise
Rela
tive
toEx
pect
atio
ns(%
)
Earnings have handily beat expectations and helped power the market's rally overthe past 5quarters.
?
2Q09
4Q09
2Q10
4Q10
2Q11
4Q11
2Q12
4Q12
2Q13
4Q13
2Q14
4Q14
2Q15
4Q15
2Q16
4Q16
2Q17
4Q17
2Q18
4Q18
2Q19
4Q19
2Q20
4Q20
2Q21
3Q2
1

27High for S&P 500 – Sept. 2, 2021; Nasdaq 100 – Sept. 7, 2021; Russell 2000 – March 15, 2021; Stock declines are an average of the individual declines from each stock’s all-time high. Data as of Sept. 30, 2021. Source: FactSet. Past performance is not a guarantee of future results. Investors cannot invest directly in an index, andunmanagedindex returns do not reflect any fees, expenses or sales charges.
Average Stock Has Already Corrected
-5.1% -6.6% -6.3%0%
-5%
-10%
-15%
-20%
-25%
-30%
-35%
-40%
-45%
S&P500 Nasdaq 100 Russell 2000
Index Decline fromHigh
Although benchmarks remain near all-time highs, the average stock within the benchmark has experienced a substantial decline.
-20.7% -17.9%
-44.1%
0%
-5%
-10%
-15%
-20%
-25%
-30%
-35%
-40%
-45%
Average Stock Decline from High
S&P 500 Nasdaq 100 Russell 2000

28
HigherTaxes, Higher Returns?
Source: FactSet Standardized Economics, FRED. Past performance is not a guarantee of future results. Investors cannot invest directly in an index, and unmanaged index returns do not reflect any fees, expenses or salescharges.
4.6%
9.3% 9.0%
5.7%
2.0%2.7% 2.8%
2%
0%
4%
6%
8%
10%
14%12.9%
12%
Tax Hikes('50, '51, '52, '68, '93)
All Other Years All Years
S&P 500 Average Calendar Year Price Returns & Annual U.S. Real GDP Growth Based on Corporate Tax Rate Hikes/Cuts (Since 1945)
Tax Cuts('46, '64, '65, '70, '71,
'79, '87, '88, '18)S&P 500 CY Price (% Change) U.S. Real GDP Growth
Tax HikeYears Historically See the Greatest Price Returns & Growth in GDP
Although many investors fear corporate tax hikes, history suggests they tend to occurduring periods of strong economic growth. This typically offsets the potential drag onequity markets.

29Data as of June 18, 2021, latest available as of Sept. 30, 2021. Source: Factset, S&P Global. Past performance is not a guarantee of future results. Investors cannot invest directly in an index, and unmanaged index returns do not reflect any fees, expenses orsalescharges.
Fed Liftoff, Brief Pullbacks
5%
10%
15%
20%
25%
30%S&P 500 Returns Across Tightening Cycles
0%
-5%
-10%
-15%0 5 10 15 20 25 30 35 40 45 50 55 60 65 70 75 80 85 90 95 100
Number of Weeks
The beginning of a monetary tightening cycle has historically led to a brief (< 2 months) stock marketselloff.
These have historicallyproved to be good buying opportunities for long-term investors.
1987
2013
Average
2004
19941999
1988
30
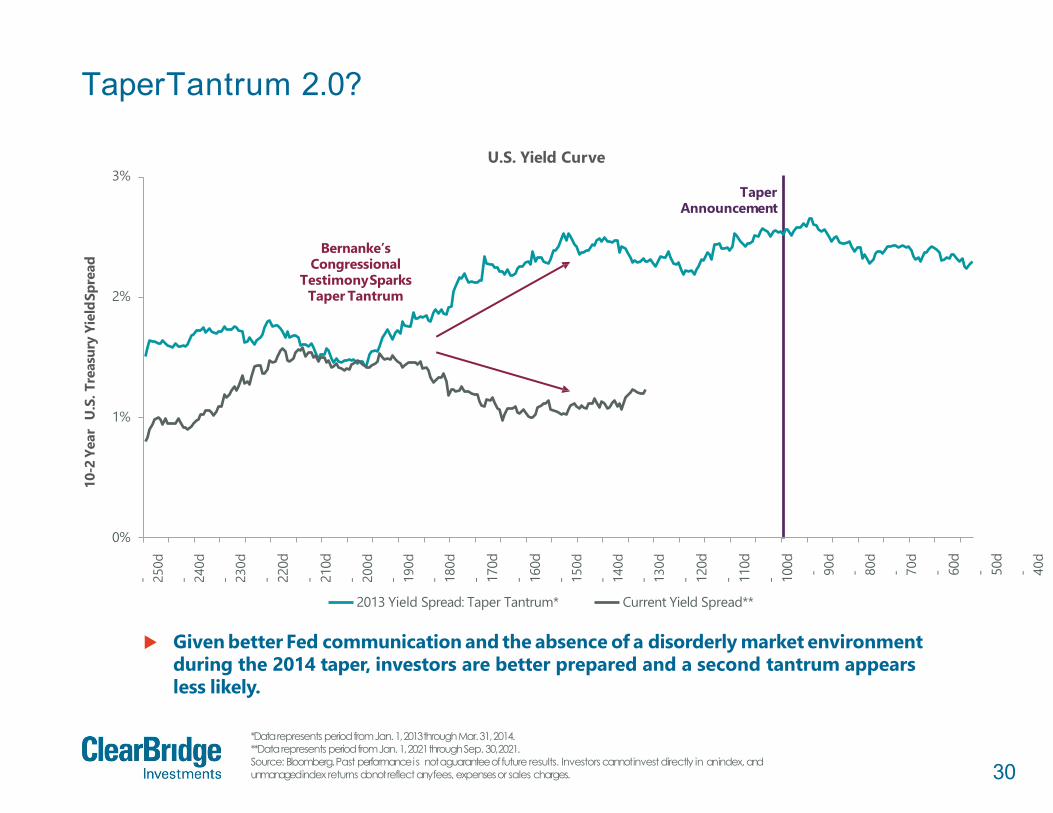
TaperTantrum 2.0?
*Data represents period from Jan. 1, 2013 through Mar. 31, 2014.**Data represents period from Jan. 1, 2021 through Sep. 30,2021.Source: Bloomberg. Past performance is not a guarantee of future results. Investors cannot invest directly in an index, and unmanaged index returns do not reflect any fees, expenses or sales charges.
0%
1%
2%
3%
- 250d
- 240d
- 230d
- 220d
- 210d
- 200d
- 190d
- 180d
- 170d
- 160d
- 150d
- 140d
- 130d
- 120d
- 110d
- 100d - 90d
- 80d
- 70d
- 60d
- 50d
- 40d
10-2
Year
U.S
. Tre
asur
y Yi
eldS
prea
d
U.S. Yield Curve
2013 Yield Spread: Taper Tantrum* Current Yield Spread**
Given better Fed communication and the absence of a disorderly market environment during the 2014 taper, investors are better prepared and a second tantrum appears less likely.
Bernanke’s Congressional
TestimonySparks Taper Tantrum
TaperAnnouncement

31
Higher Rates, Higher Equities
Source: FactSet. Past performance is not a guarantee of future results. Investors cannot invest directly in an index, andunmanaged index returns do not reflect any fees, expenses or salescharges.
Stock Returns During Historical Rising Rate Environments (10-Year Yield Change > 1.5%)
Rising RatesStart Date
Rising RatesEnd Date
Duration(Months)
Change in 10-YearTreasury Yield
S&P 500Gain/Loss
(Annualized)
Russell 2000 Gain/Loss
(Annualized)Dec. 1962 Aug. 1966 45 1.7% 8.1% -March 1967 Dec. 1969 34 3.6% 3.6% -March 1971 Sept. 1975 55 3.2% -0.9% -Dec. 1976 Sept. 1981 58 9.0% 7.3% -May 1983 May 1984 13 3.9% -3.5% -11.8%Aug. 1986 Oct. 1987 14 3.3% 13.6% 5.9%Oct. 1993 Nov. 1994 13 2.9% 1.5% -3.1%Jan. 1996 July 1996 6 1.5% 6.7% 10.1%Oct. 1998 Jan. 2000 16 2.6% 35.5% 44.5%June 2003 June 2006 37 2.1% 9.8% 16.3%Dec. 2008 April 2010 15 1.9% 28.5% 35.7%July 2012 Dec. 2013 18 1.6% 28.0% 35.5%July 2016 Oct. 2018 27 1.9% 16.8% 17.2%
Average: 27 3.0% 11.9% 16.7%% Positive: 100% 84.6% 77.8%
During periods of rising rates, equities have delivered above-averagereturns with particular strength in small cap stocks.
32Data as of Aug. 31, 2021. Source: BLS and Bloomberg. Past performance is not a guarantee of future results. Investors cannot invest directly in an index, and unmanaged index returns do not reflect any fees, expenses or sales charges.
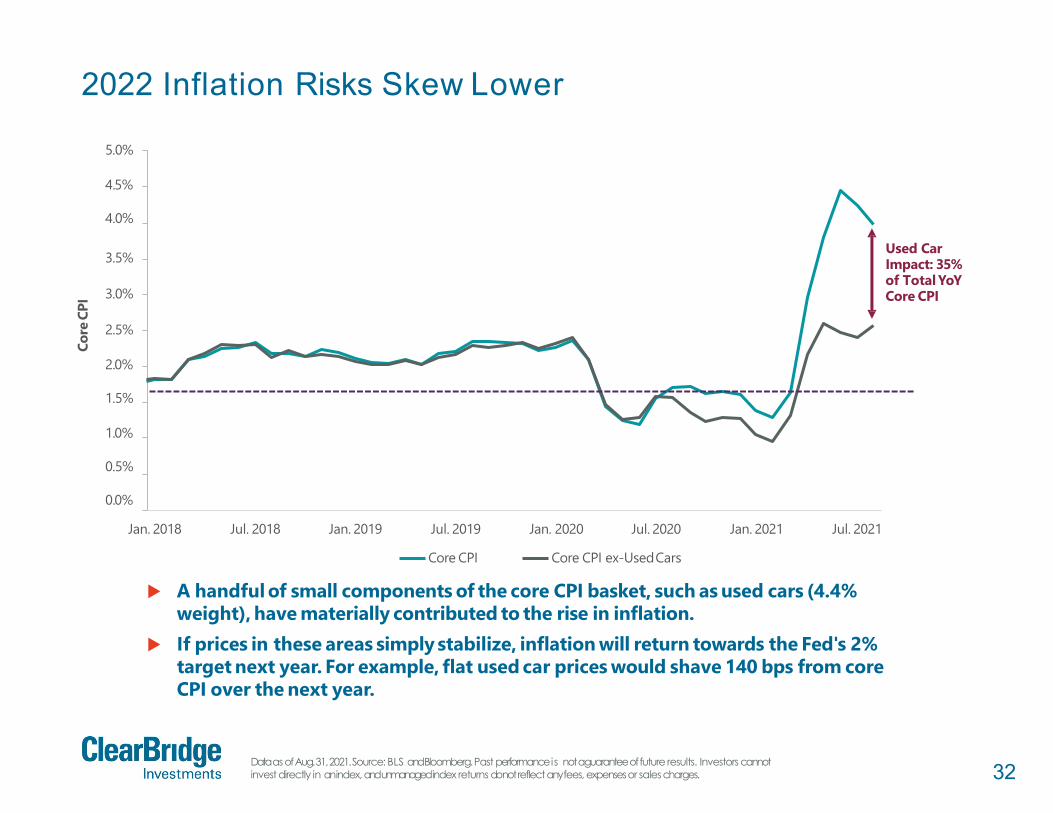
2022 Inflation Risks Skew Lower
2.5%
2.0%
1.5%
1.0%
0.5%
0.0%
3.0%
3.5%
5.0%
4.5%
4.0%
Jan. 2018 Jul. 2018 Jan. 2019 Jan. 2021 Jul. 2021
Core
CPI
Jul. 2019
Core CPI
Jan. 2020 Jul. 2020
Core CPI ex-UsedCars
A handful of small components of the core CPI basket, such as used cars (4.4% weight), have materially contributed to the rise in inflation.
If prices in these areas simply stabilize, inflation will return towards the Fed's 2% target next year. For example, flat used car prices would shave 140 bps from core CPI over the next year.
Used Car Impact: 35% of Total YoY Core CPI

33
Retail Put Replacing Fed Put?
As of Sep. 30, 2021. Source: Goldman Sachs. Past performance is not a guarantee of future results. Investors cannotinvestdirectly in an index, and unmanaged index returns do not reflect any fees, expenses or salescharges.
$600
$800
$1,000
Infl
ows
(Bill
ions
)
Global Equity Inflows By Year
$400
$200
$0
-$200
-$4001996 1998 2000 2002 2004 2006 2008 2010 2012 2014 2016 2018 2020
Investors have allocated more capital to equities in 2021 than over the previous 25 years combined.
With retail investors stepping in to buy the dips, the market has not experienced a significant drawdown this year.
1996-2020 Cumulative Global Equity Inflows = $179 Billion
2021YTD$756
34Data as of Sept. 24, 2021. Source: American Association of Individual Investors. Past performance is not a guarantee of future results. Investors cannot invest directly in an index, and unmanaged index returns do not reflect any fees, expenses or salescharges.
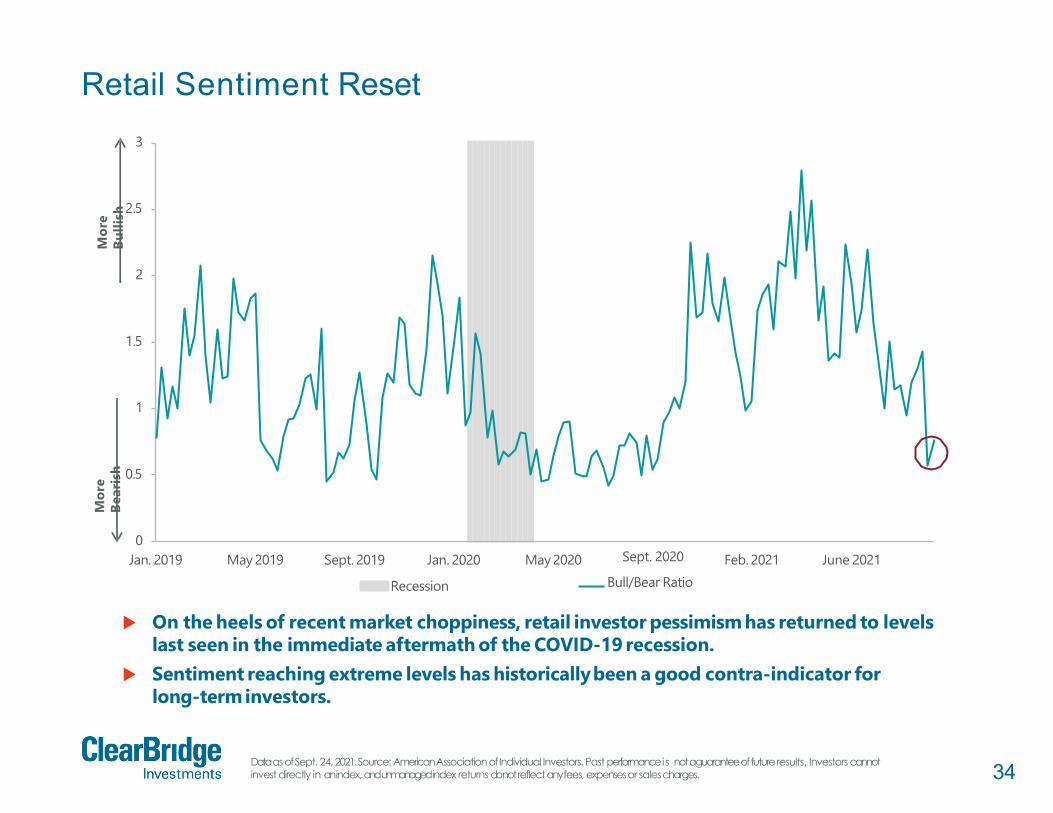
Retail Sentiment Reset
0
0.5
1
1.5
2
2.5
3
Jan. 2019 May 2019 Sept. 2019 May 2020 Feb. 2021 June 2021Jan. 2020
Recession
Sept. 2020
Bull/Bear Ratio
On the heels of recent market choppiness, retail investor pessimism has returned to levels last seen in the immediate aftermath of the COVID-19 recession.
Sentiment reaching extreme levels has historicallybeen a good contra-indicator forlong-terminvestors.
Mor
eBu
llish
Mor
eBe
aris
h
35
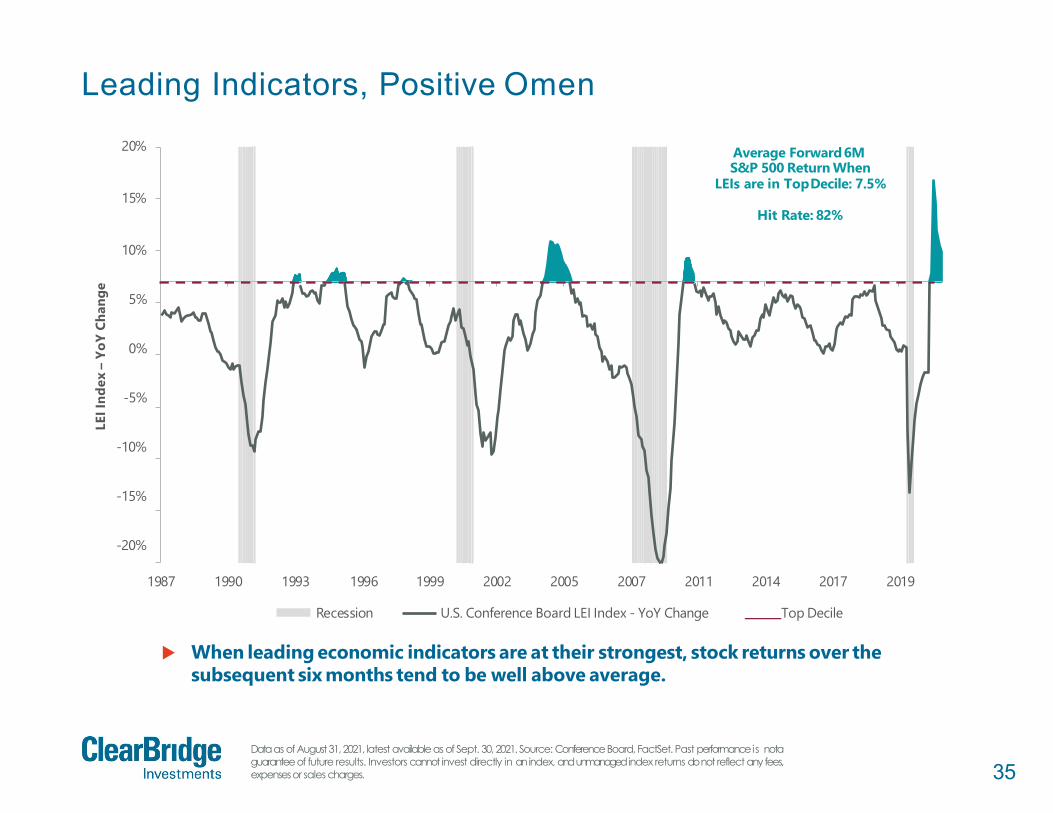
Leading Indicators, Positive Omen
Dataas ofAugust31,2021, latest availableas of Sept. 30, 2021. Source: ConferenceBoard, FactSet. Past performanceis notaguaranteeof future results. Investors cannot invest directly in anindex, andunmanagedindex returns donot reflect anyfees,expensesor sales charges.
10%
5%
0%
-5%
-10%
-15%
-20%
15%
20%
1987 1990 1993 2019
LEII
ndex
–Yo
YCh
ange
1996
Recession
1999 2002 2005 2007 2011
U.S. Conference Board LEI Index - YoY Change
2014 2017
Top Decile
When leading economic indicators are at their strongest, stock returns over thesubsequent six months tend to be well above average.
Average Forward6MS&P 500 Return When
LEIs are in TopDecile: 7.5%
Hit Rate: 82%

36
Corporate Stimulus Just Getting Started
Full year for 2021 is YTD annualized. Data as of June 30, 2021. Source: JP Morgan. Past performance is not a guarantee of future results. Investors cannot invest directly in an index, and unmanaged index returns do not reflect any fees, expenses orsalescharges.
$1,000
$900
$800
$700
$600
$500
$400
$300
$200
$100
$0
1997 1999 2001 2003 2005 2007 2009 2017 2019 2021
Billi
ons
S&P 500 Buyback Announcements
Mid Year Full Year
Buyback announcementshave rebounded sharplyfrom2020 lows on the back of strongearnings and outsized corporate cash reserves.
If the second half of 2021 maintains the pace seen so far, this year will be the second strongest on record for share repurchaseannouncements.
2011 2013 2015
2021 Annualized Pace
37
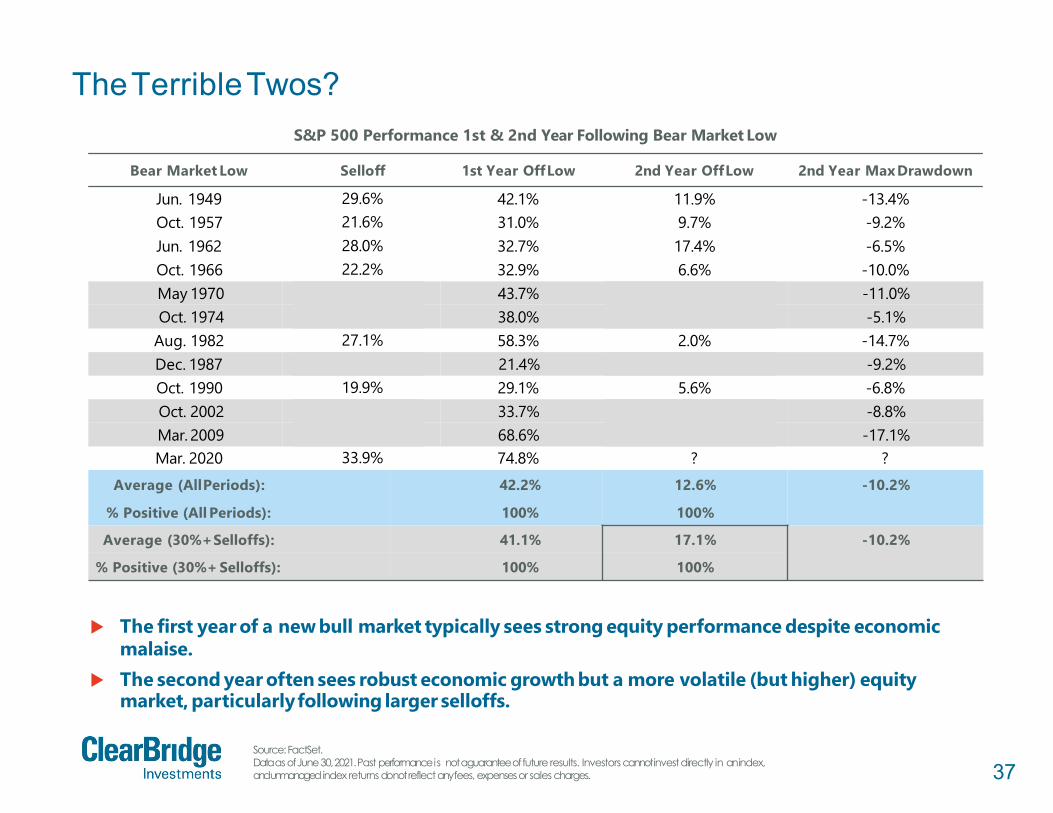
TheTerribleTwos?
Source:FactSet.Data as of June 30, 2021. Past performance is not a guarantee of future results. Investors cannot invest directly in anindex,and unmanagedindex returns do not reflect any fees, expenses or sales charges.
May 1970 36.1% 43.7% 11.1% -11.0%Oct. 1974 48.2% 38.0% 21.2% -5.1%
Dec. 1987 33.5% 21.4% 29.3% -9.2%
Oct. 2002 49.1% 33.7% 8.0% -8.8%Mar. 2009 56.8% 68.6% 15.7% -17.1%
S&P 500 Performance 1st & 2nd Year Following Bear Market Low
Bear Market Low Selloff 1st Year OffLow 2nd Year OffLow 2nd Year MaxDrawdown
Jun. 1949 29.6% 42.1% 11.9% -13.4%Oct. 1957 21.6% 31.0% 9.7% -9.2%Jun. 1962 28.0% 32.7% 17.4% -6.5%Oct. 1966 22.2% 32.9% 6.6% -10.0%
Aug. 1982 27.1% 58.3% 2.0% -14.7%
Oct. 1990 19.9% 29.1% 5.6% -6.8%
Mar. 2020 33.9% 74.8% ? ?Average (AllPeriods): 42.2% 12.6% -10.2%
% Positive (All Periods): 100% 100%
Average (30%+Selloffs): 41.1% 17.1% -10.2%
% Positive (30%+ Selloffs): 100% 100%
The first year of a new bull market typically sees strong equity performance despite economic malaise.
The second year often sees robust economic growth but a more volatile (but higher) equity market, particularlyfollowing larger selloffs.
38
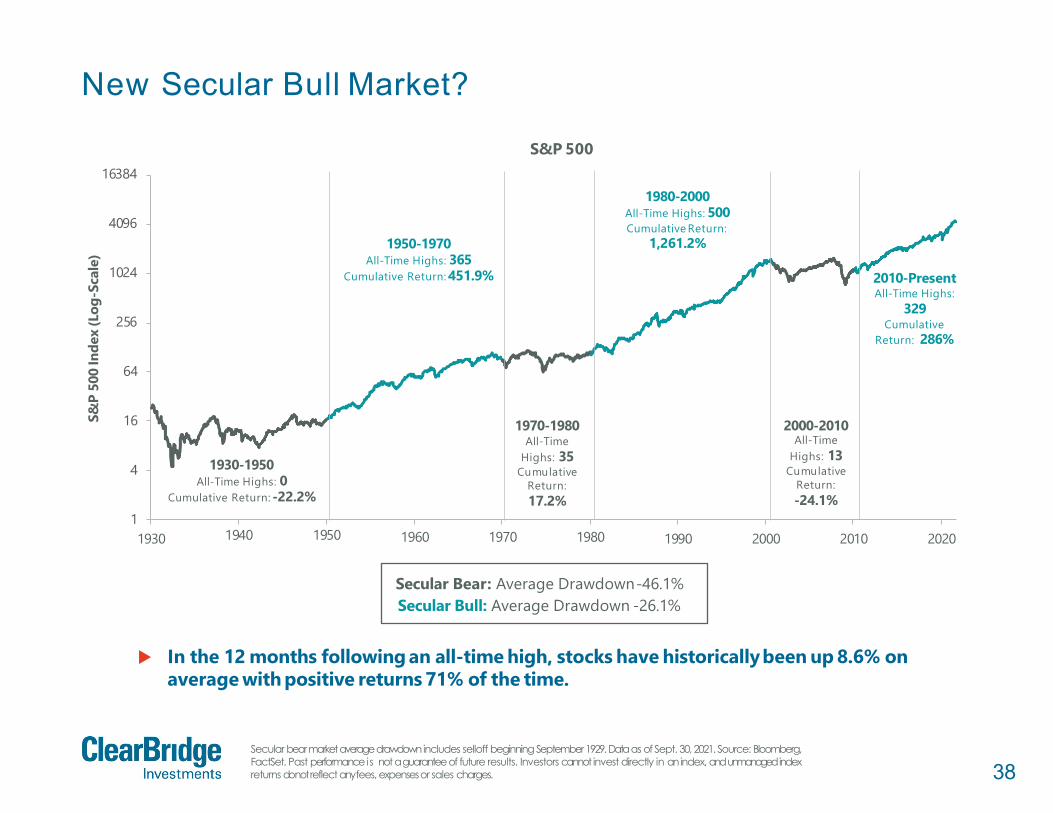
New Secular Bull Market?
Secular bearmarketaveragedrawdownincludes selloff beginning September1929.Dataas of Sept. 30, 2021. Source: Bloomberg,FactSet. Past performanceis not aguaranteeof future results. Investors cannot invest directly in anindex, andunmanagedindexreturns donotreflect anyfees, expensesor sales charges.
1
4
16
64
256
1024
4096
16384
1930 1990 2000 2010 2020
S&P
500
Inde
x(L
og-S
cale
)
S&P 500
In the 12 months following an all-time high, stocks have historicallybeen up 8.6% onaverage with positive returns 71% of the time.
Secular Bear: Average Drawdown-46.1%Secular Bull: Average Drawdown -26.1%
1930-1950All-Time Highs: 0
Cumulative Return: -22.2%
1940 1950
1970-1980All-Time
Highs: 35 Cumulative
Return: 17.2%
1960 1970 1980
2000-2010All-Time
Highs: 13 Cumulative
Return:-24.1%
1950-1970All-Time Highs: 365
Cumulative Return: 451.9%
1980-2000All-Time Highs: 500Cumulative Return:
1,261.2%
2010-Present All-Time Highs:
329Cumulative
Return: 286%

39
Economic and Market SummaryFourth Quarter 2021
All opinions anddataincludedin this commentaryareas of thepublicationdateandaresubject tochange.The opinions andviewsexpressedherein areoftheauthorandmaydiffer fromother portfolio managersor thefirm as awhole,andarenot intendedtobeaforecast of future events, aguaranteeof future results or investmentadvice.This information shouldnotbeusedas thesole basis tomakeanyinvestmentdecision.
U.S. Economic Outlook• U.S. recession risks are well below average• The economy should reaccelerate as Deltasubsides• Consumer Headwinds < Consumer Tailwinds• Business investment (capex) should remain robust
with strong global demand and more reliable supply chains
U.S. Market Outlook• U.S. markets have often experienced a consolidation
at this point in a new bull market• Current headwinds include rising corporate taxes,
tightening monetary policy, and potential sustained inflation
• In our view, this selloff may be a buying opportunity due to multiple positive market factors
Recession Dashboard Overall Signal
Expansion

40
One YearOutlookThemesThat Will Drive the Market Over the Next 12 Months
International
Inflation
Volatility
Market Leadership
Valuations

41Not for distribution to the generalpublic.Confidential and proprietaryinformation.
Inflation
$

42
Inflation Rare Early Cycle
10%
9%
8%
7%
6%
5%
4%
3%
2%
1%
0%
-18 -12 -6 0 30 36 40 48
Core
CPI
YoY
6 12 18 24Months Before and After End of Recession
Core CPI Around End of Historical Recessions (Last 65 Years)
All Low Inflation Regime (< 5%) High Inflation Regime (> 5%)
Historically, inflation does not tend to pose a problem in the first two to three years of a new expansion due to ample spare capacity.
This same dynamic has historicallyplayed out in both high and low inflationaryenvironments.
Note: High/Low Inflation Regime based on Inflation Over/Under 5% at End of Recession. Data as of Sept, 30, 2021. Source: BEA, NBER, Bloomberg. Past performance is not a guarantee of future results. Investors cannot invest directly in an index, and unmanaged index returns do not reflect any fees, expenses or sales charges.

43
U.S. Demographics Point to Muted Inflation
0%
2%
4%
6%
8%
10%
12%
1.5
2.0
2.5
3.0
3.5
4.0
CPIYoY
Fert
ility
Rate
(Chi
ldre
nBo
rnPe
rWom
an)
1950 1955 1960 1965 1970 1975 1980 1985 1990 1995 2000 2005 2010 2015 2020 2025 2030 2035 2040
Fertility Rate (22 YearLag, LHS)* CPI YoY (5 Year Average,RHS)
Demographics tend to lead inflationary pressures by 22 years, historically. This relationship suggests inflationshould remain muted in the U.S. in the coming
decade(s).*Shown is the 'Total Fertility Rate' which measures the number of children that would be born to a woman if she were to liveto the end of her childbearing years and bear children in accordance with the age-specific fertility rates of the specific year. Data as of Dec. 31, 2019,latestavailable as of Sept. 30, 2021. Source: Our World in Data, FactSet. Past performance is not a guarantee of future results. Investors cannot invest directly in an index, and unmanaged index returns do not reflect any fees, expenses or salescharges.

44Data as of Dec. 31, 2020, latest available as of Sept. 30, 2021. Source: World Bank. Past performance is not a guarantee of future results. Investors cannot invest directly in an index, and unmanaged index returns do not reflect any fees, expenses or salescharges.
A New Paradigm: De-Globalization?
32%
30%
28%
26%
Glo
bal T
rade
as
% o
f To
talP
rodu
ctio
n
24%
22%
20%
18%
16%
14%
12%1970 1974 1978 1982 1986 1990 1994 1998 2002 2006 2010 2014 2018
The multi-decade trend of globalization appearsto be stalling which could lead togreater inflationarypressuresresulting fromre-shoring.
Further, the working age in China has peaked which could lead to greater globalwage pressure in the coming years.
?

45
U.S. Debt Levels Set to RiseHigher
Budgetas % ofGDPdataas ofJune 30,2021, latest availableas ofSept. 30,2021.Source: BEA, FactSet. Future debtlevels arebasedonaCongressional Budget Office forecast. Past performance is not aguaranteeof future results. Investors cannot invest directlyin anindex,andunmanagedindex returns donotreflectanyfees, expensesor salescharges.
Barring a change in spending, U.S. debt levels will grow substantially in the coming decades.
200.0
180.0
160.0
140.0
120.0
100.0
80.0
60.0
40.0
20.0
0.0
1790 1815 1840 1865 1890 1915 1940 1965 1990 2015 2040
U.S
. Deb
t as
% o
fG
DP
Federal Debt Held by the Public Since 1790
-30%
-25%
-20%
-15%
-10%
-5%
0%
5%
10%
1929 1939 1949 1959 1969 1979 1989 1999 2009 2019Fe
dera
l Sur
plus
or
Def
icit
as %
of
GD
P(A
nnua
l)
U.S. Budget as a % of GDP Since 1929
WW II
2009 GFC
COVID-19

46
Is U.S. Debt Really an Issue?
Source: Congressional Budget Office. Past performance is not a guarantee of future results. Investors cannot invest directlyin an index, and unmanagedindex returns do not reflect any fees, expenses or salescharges.
0%
1%
2%
3%
4%
1980 2020 2030
Net Interest Payments in Budget as Share of GDP
Despite a dramatic increase in government debt outstanding, total debt servicing costs as apercent of GDP have declined due to falling rates.
While this could become a risk in the next decade, the intermediate-termoutlook appears less troubling.
1990 2000 2010
Net Interest Payments in Budget as Share of GDP Forecast

47Five year period represents period from Sept. 2021 – Sept. 2026; five years forward represents period from Sept. 2026 – Sept. 2031. Data as of Sept. 30, 2021. Source: FactSet. Past performance is not a guarantee of future results. Investors cannot invest directly in an index, and unmanagedindex returns do not reflect any fees, expenses or salescharges.
Long-Term Inflation Not a Concern
0.0%
0.5%
1.0%
1.5%
2.0%
2.5%
3.0%
December 2019 March2020 September 2021
Brea
keve
n U
.S. I
nfla
tionR
ate
June 2020 September 2020 December 2020 March 2021 June 2021
Five Year (2021-2026) Five Years Forward (2026-2031)
Investors are pricing a period of above-target inflation in the coming years. However, these pressures are not expected to persist over the back half of the decade.
Fed’s 2% Target
48
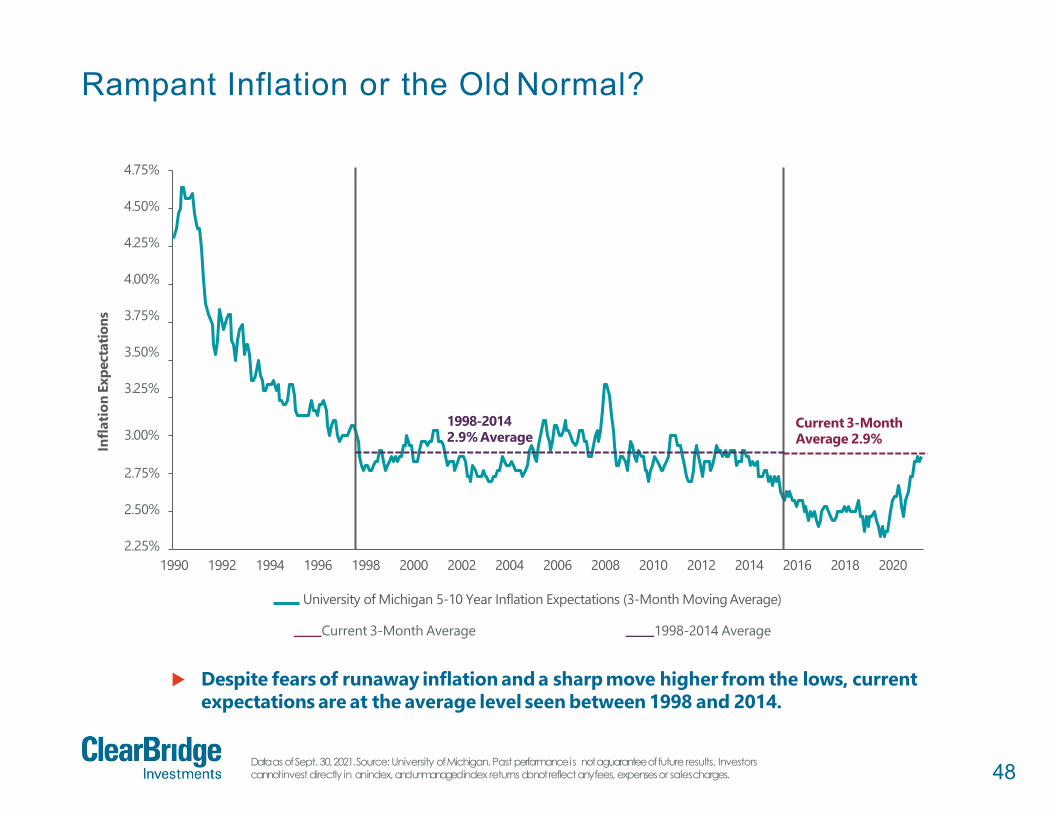
Rampant Inflation or the Old Normal?
Data as of Sept. 30, 2021. Source: University of Michigan. Past performance is not a guarantee of future results. Investors cannot invest directly in an index, and unmanaged index returns do not reflect any fees, expenses or salescharges.
3.00%
4.75%
4.50%
4.25%
4.00%
3.75%
3.50%
3.25%
Infla
tion
Expe
ctat
ions
Current 3-MonthAverage 2.9%
1998-20142.9% Average
2.75%
2.50%
2.25%1990 1992 1994 1996 1998 2000 2002 2004 2006 2008 2010 2012 2014 2016 2018 2020
University of Michigan 5-10 Year Inflation Expectations (3-Month Moving Average)
Current 3-Month Average 1998-2014 Average
Despite fears of runaway inflation and a sharp move higher from the lows, current expectations are at the average level seen between 1998 and 2014.
49
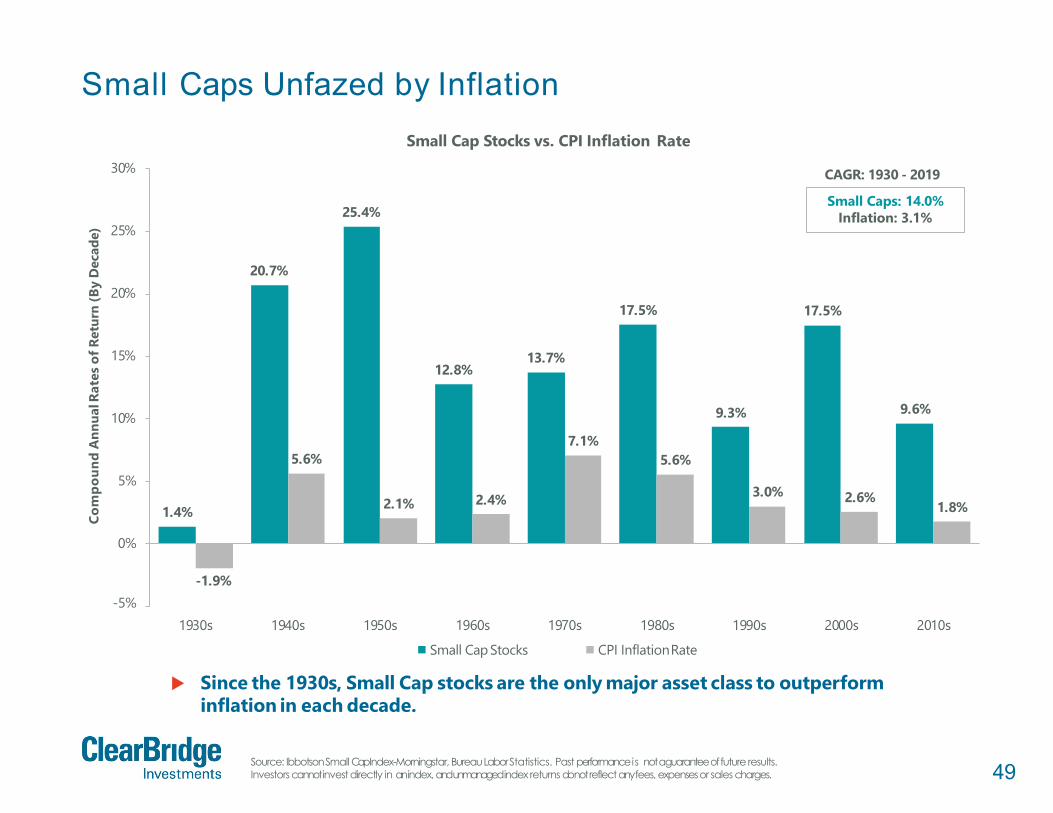
Small Caps Unfazed by Inflation
Source: Ibbotson Small Cap Index-Morningstar, Bureau Labor Statistics. Past performance is not a guarantee of future results. Investors cannot invest directly in an index, and unmanaged index returns do not reflect any fees, expenses or sales charges.
1.4%
20.7%
25.4%
12.8%13.7%
17.5%
9.3%
17.5%
9.6%
5.6%
2.1% 2.4%
7.1%5.6%
3.0% 2.6%1.8%
0%
-1.9%-5%
5%
10%
15%
20%
25%
30%
1930s 1940s 1950s 1970s 1990s 2000s 2010s
Com
poun
dA
nnua
lRat
esof
Retu
rn(B
yD
ecad
e)
Small Cap Stocks vs. CPI Inflation Rate
1960s
Small Cap Stocks
1980s
CPI InflationRate
Since the 1930s, Small Cap stocks are the only major asset class to outperform inflation in each decade.
Small Caps: 14.0%Inflation: 3.1%
CAGR: 1930 - 2019

50Not for distribution to the generalpublic.Confidential and proprietaryinformation.
Valuations
51
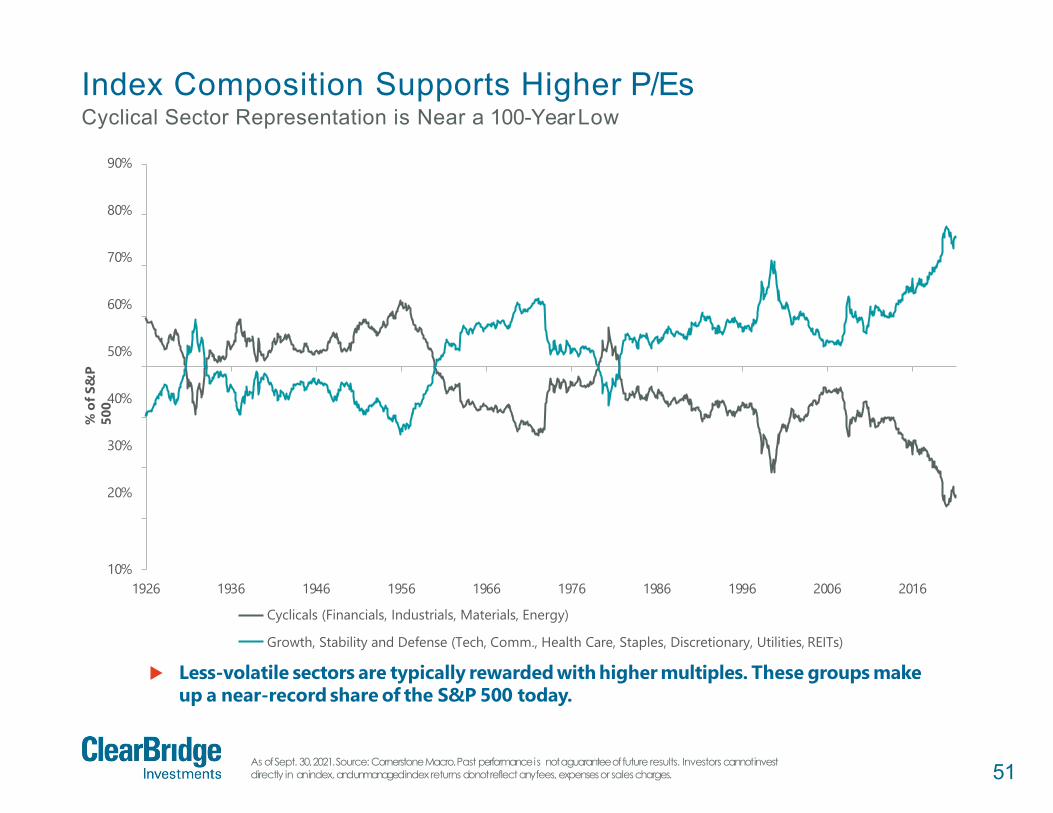
Index Composition Supports Higher P/EsCyclical Sector Representation is Near a 100-YearLow
As of Sept. 30, 2021. Source: Cornerstone Macro. Past performance is not a guarantee of future results. Investors cannot invest directly in an index, and unmanaged index returns do not reflect any fees, expenses or salescharges.
10%
90%
80%
70%
60%
50%
40%
30%
20%
1926
%of
S&P
500
1936 1946 1956 1966 1976 1986 1996 2006 2016
Cyclicals (Financials, Industrials, Materials, Energy)
Growth, Stability and Defense (Tech, Comm., Health Care, Staples, Discretionary, Utilities, REITs)
Less-volatile sectors are typically rewarded with higher multiples. These groups makeup a near-record share of the S&P 500 today.
52
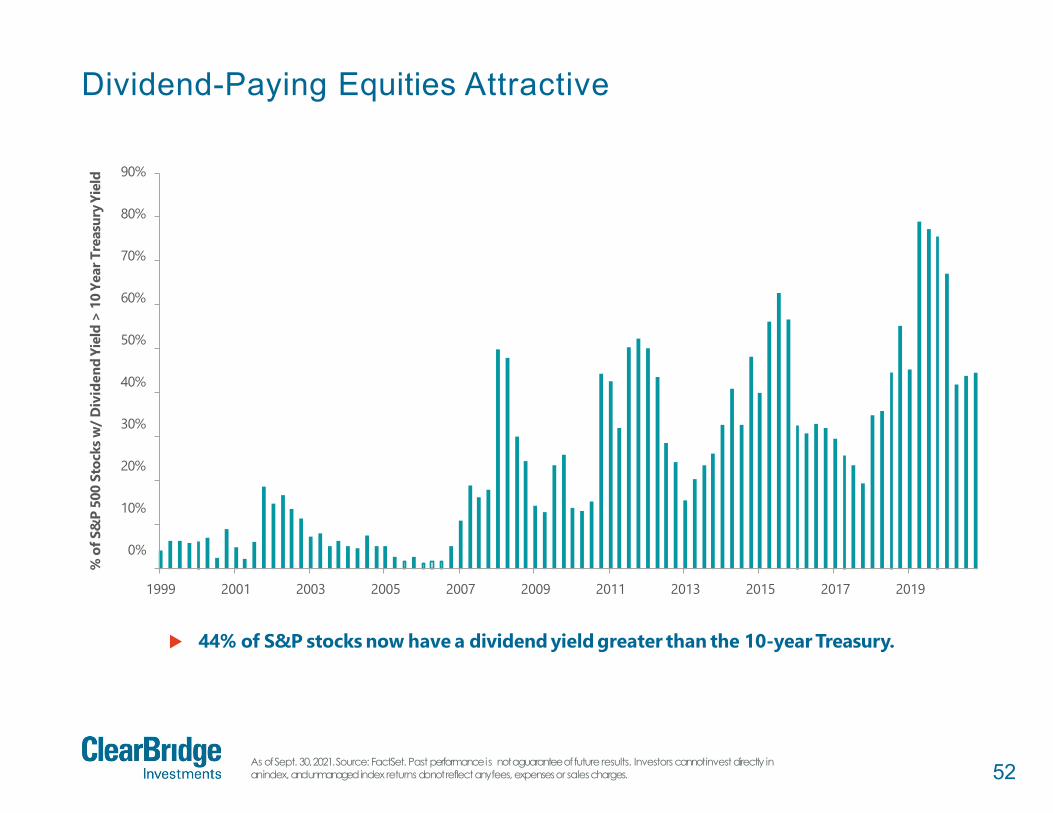
Dividend-Paying Equities Attractive
As of Sept. 30, 2021. Source: FactSet. Past performance is not a guarantee of future results. Investors cannot invest directly in an index, and unmanagedindex returns do not reflect any fees, expenses or salescharges.
90%
80%
70%
60%
50%
40%
30%
20%
10%
0%
1999 2001 2003 2005 2007 2009 2011 2013 2015 2017 2019
%of
S&P
500
Stoc
ksw
/Div
iden
dYi
eld
>10
Year
Trea
sury
Yiel
d
44% of S&P stocks now have a dividend yield greater than the 10-year Treasury.
53
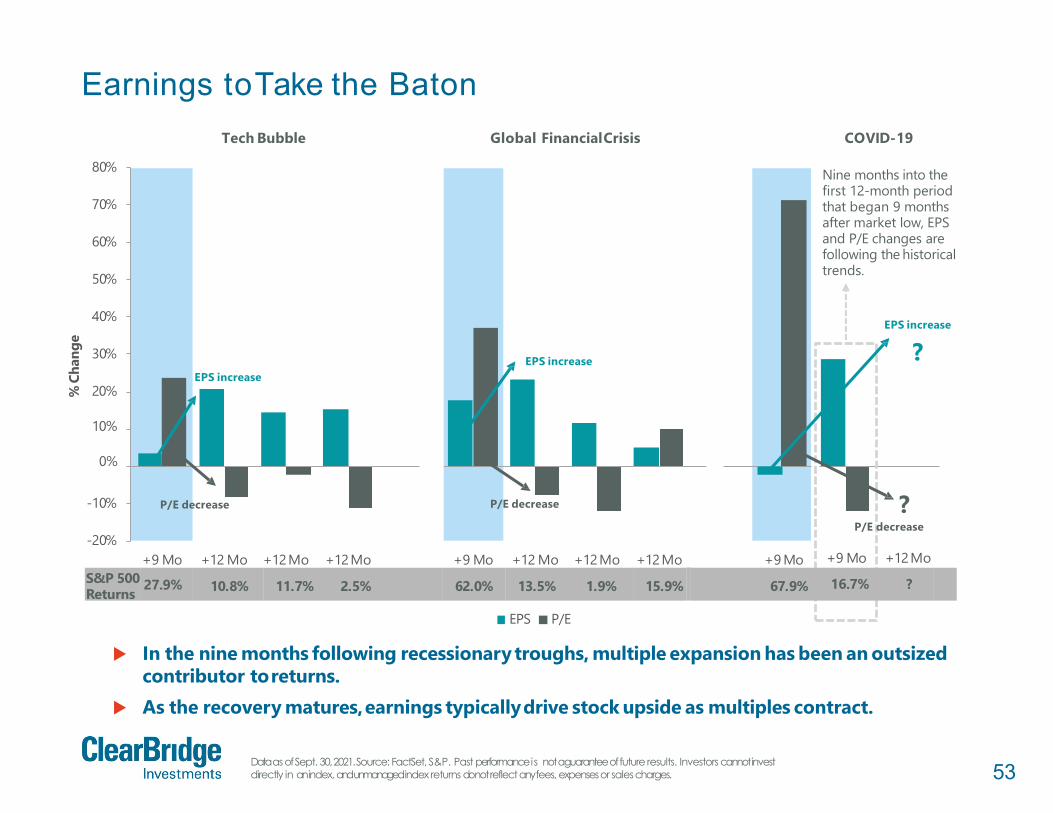
Earnings toTake the Baton
Data as of Sept. 30, 2021. Source: FactSet, S&P. Past performance is not a guarantee of future results. Investors cannot invest directly in an index, and unmanaged index returns do not reflect any fees, expenses or salescharges.
-20%
-10%
20%
10%
0%
30%
40%
50%
60%
70%
80%
+9 Mo +12 Mo +12Mo +12Mo +9 Mo +12 Mo +12Mo +12Mo +9 Mo
%Ch
ange
Tech Bubble Global FinancialCrisis COVID-19
In the nine months following recessionary troughs, multiple expansion has been an outsizedcontributor toreturns.
As the recovery matures,earnings typicallydrive stock upside as multiples contract.
EPS increaseEPS increase
P/E decreaseP/E decrease ?
EPS increase
?
Nine months into the first 12-month period that began 9 months after market low, EPS and P/E changes are following the historical trends.
ReturnsS&P 500 27.9% 10.8% 11.7% 2.5% 62.0% 13.5% 1.9% 15.9%
EPS P/E
67.9%
P/E decrease
+9 Mo +12Mo
16.7% ?

54
Just How Stretched are Valuations?
Data as of Sept. 30, 2021. Source: Bloomberg, FactSet, Federal Reserve, Moody’s, and S&P. Note: NTM = next twelve months; Historical Average P/E represents 1995-present. Past performance is not a guarantee of future results. Investors cannot invest directly in an index, and unmanaged index returns do not reflect any fees, expenses or salescharges.
Historical Average
P/E
SectorMix Impact
InterestRate Impact
2021 EPS"Catch-Up"
OtherCurrent
P/E
16.3x1.0x
1.8x0.5x 0.5x 20.1x
10
15
20
25
NTM
S&P
500
P/E
Mul
tiple
Current vs. Historical P/E Waterfall
++
+ =
5
Current valuations appear rich relative to history. Much of this can be explained by sector mix differences, lower interest rates, and an expected earnings "catch-up" in 2021.
+

55Not for distribution to the generalpublic.Confidential and proprietaryinformation.
Market Leadership

56
Fundamentals FavorValue
Data as of Sept. 30, 2021. Past performance is not a guarantee of future results. Investors cannot invest directly in an index, and unmanaged index returns do not reflect any fees, expenses or sales charges.
Relative P/E and EPS growth point to further upside for Value stocks relative to Growth. Each multiple point of relative P/E equates to between approximately4-5% of relative
performance between Growth and Value.
Source:Bloomberg.
0
15
30
45
Rela
tive
P/E
Russell 1000 Growth P/E Minus Russell 1000 ValueP/E
-151995 2000 2005 2010 2015 2020
Average Russell 1000 Growth Relative to Russell 1000 Value
Average: 7.9
Current:18.2
Source: FactSet,Russell.
29.2%
47.1%53.7%
65.0%
10%
20%
30%
40%
50%
60%
70%
80%
Consensus EPS Growth Russell 1000 Growth vs. Value
2021 Consensus
Growth
2022 Consensus
Value
57
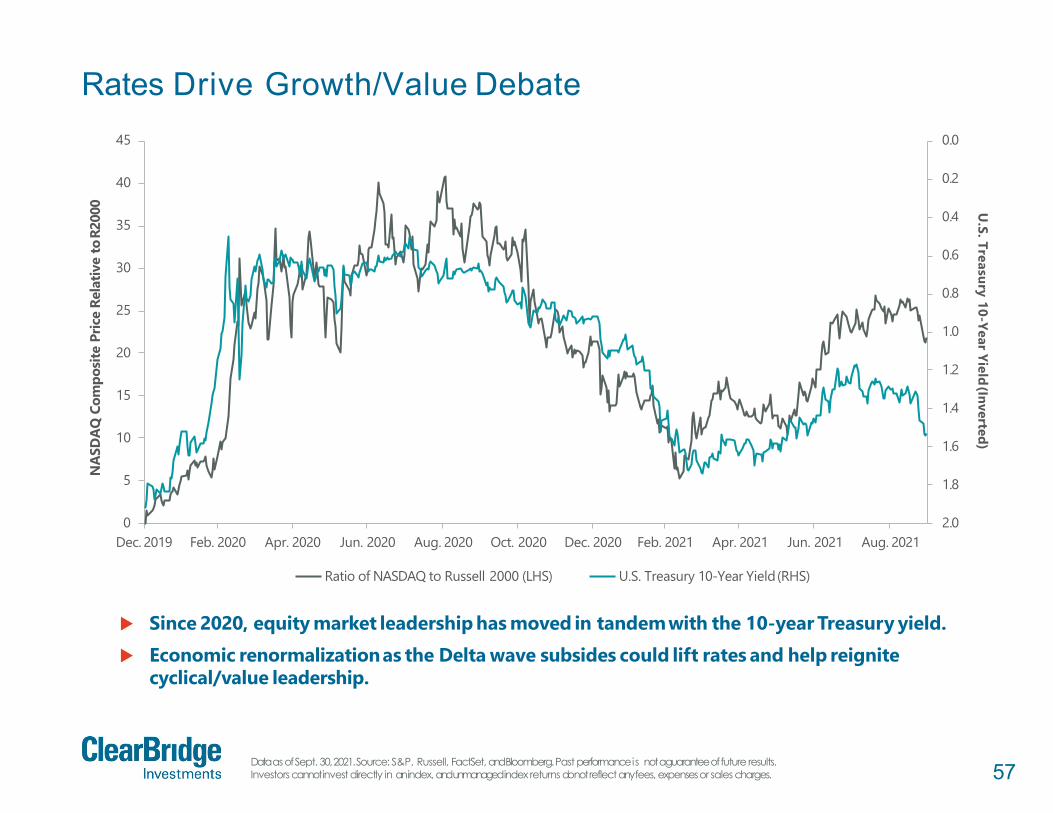
Rates Drive Growth/Value Debate
Data as of Sept. 30, 2021. Source: S&P, Russell, FactSet, and Bloomberg. Past performance is not a guarantee of future results. Investors cannot invest directly in an index, and unmanaged index returns do not reflect any fees, expenses or sales charges.
0.0
0.2
0.4
0.6
0.8
1.0
1.2
1.4
1.6
1.8
2.00
5
10
15
20
25
30
35
40
45
Dec. 2019 Feb. 2020 Apr. 2020 Jun. 2020 Aug. 2020 Oct. 2020 Dec. 2020 Feb. 2021 Apr. 2021 Jun. 2021 Aug. 2021
U.S. Treasury 10-Year Yield(Inverted)
NAS
DAQ
Com
posit
e Pr
ice
Rela
tive
toR2
000
Ratio of NASDAQ to Russell 2000 (LHS) U.S. Treasury 10-Year Yield(RHS)
Since 2020, equity market leadership has moved in tandemwith the 10-year Treasury yield. Economic renormalizationas the Delta wave subsides could lift rates and help reignite
cyclical/value leadership.

58
Are Valuations Justified by Earnings?
Data as of Sept. 30, 2021. Source: FactSet. Past performance is not a guarantee of future results. Investors cannotinvestdirectly in an index, and unmanaged index returns do not reflect any fees, expenses or sales charges. Not a recommendation to buy or sell anysecurity.
Microsof t Apple
Amazon Googl e
Fac ebook
-2%
0%
2%
4%
6%
8%
-2% -1% 0% 1% 2% 3% 4% 5% 6% 7% 8%
Shar
eof
Tota
lMar
ketC
ap
S&P 500 Earnings Share vs. Market Cap Share
Share of Total Earnings
The 5 largest stocks are expected to account for 22% of 2021 earnings. The top 5 contribute more income than market cap.

59Data as of Sept. 30, 2021. Source: Morningstar, Bloomberg. Ibbotson Small Cap from 1960 to 1978, then Russell 2000. Past performance is not a guarantee of future results. Investors cannot invest directly in an index, and unmanaged index returns do not reflect any fees, expenses or salescharges.
Time for Small Caps to Shine?
400
300
200
100
500
600
700
1,000
900
800
1960 1965 1970 1975 2005 2010 2015 2020
U.S
.Sm
allC
aps
Rela
tivet
oLa
rge
Caps
Tota
lRet
urn
1980 1985
Recession
1990 1995 2000
Small Cap Relative to Large Cap
Over the last 60 years, markets have experienced three full Small Cap cycles. Recent Small Cap outperformancefollowing the COVID-19recession could be
the start of a new cycle.
Uptrend:Small CapsOutperform
Downtrend: Large Caps Outperform
?
60
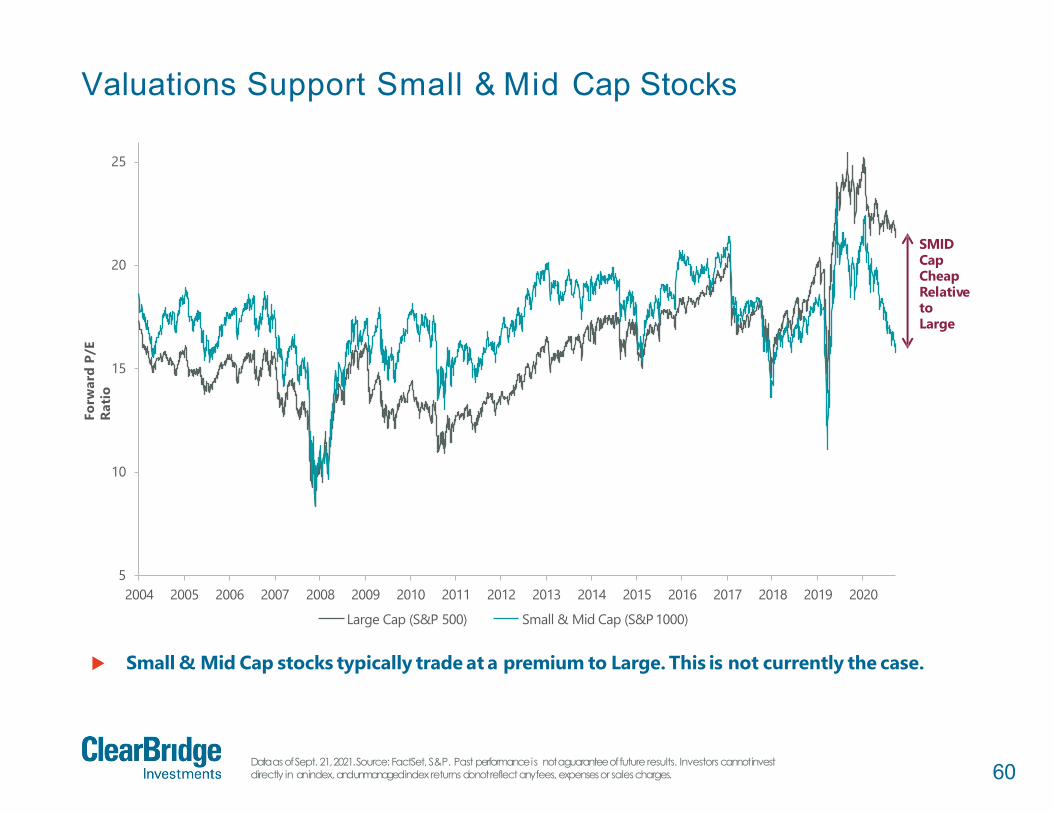
Valuations Support Small & Mid Cap Stocks
Data as of Sept. 21, 2021. Source: FactSet, S&P. Past performance is not a guarantee of future results. Investors cannot invest directly in an index, and unmanaged index returns do not reflect any fees, expenses or salescharges.
10
15
20
25
Forw
ard
P/E
Ratio
52004 2005 2006 2007 2008 2009 2010 2011 2012 2013 2014 2015 2016 2017 2018 2019 2020
Large Cap (S&P 500) Small & Mid Cap (S&P 1000)
Small & Mid Cap stocks typically trade at a premium to Large. This is not currently the case.
SMIDCap Cheap Relative to Large

61
Small & Mid Cap LeadershipTypically Lasts Longer
Small Cap = Russell 2000 Index, Mid Cap = Russell Mid Cap Index, and Large Cap = Russell 1000 Index. Source: FactSet. Past performance is not a guarantee of future results. Investors cannot invest directly in an index, and unmanaged index returns do not reflect any fees, expenses or sales charges. Not a recommendation to buy or sell anysecurity.
Small vs. LargeCap Mid vs. Large Cap
Recession End First12 Months
Second 12 Months
Next 12 Months Recession End First
12 MonthsSecond
12 MonthsNext
12 Months
Nov. 1982 10.4% -9.3% 0.1% Nov. 1982 3.4% -3.7% 1.8%
March 1991 9.7% 0.4% 10.6% March 1991 6.7% 5.2% 4.0%
Nov. 2001 5.6% 19.7% 5.2% Nov. 2001 6.8% 13.8% 6.2%
June 2009 6.9% 6.3% -5.7% June 2009 10.1% 6.9% -5.5%
April 2020 25.8% -5.4%* ? April 2020 10.1% -1.9%* ?
Average (Prior 4
Recessions)8.2% 4.3% 2.6%
Average (Prior 4
Recessions)6.8% 5.6% 1.6%
*5-monthperiod *5-monthperiod
Followinga recession,Small and Mid cap stocks typically outpace their Large cap brethrenover the next three years.
Given weakness in year two so far, an opportunitycould exist if the historical trend holds.

62
Could Spreads Go Even Lower?
0%
1%
2%
3%
4%
5%
6%
7%
8%
9%
0
5
10
15
20
25
Average D
efaultRateA
vera
geSp
read
(Bas
isPo
ints
)(H
undr
eds)
Average Default Rate(2004-Present)
1987 1989 1991 1993 1995 1997 1999 2001 2003 2005 2007 2009 2011 2013 2015 2017 2019 2021
High Yield Spread (LHS)
While credit spreads are near the low end of their historical range, default rates have been substantially lower since 2004.
Lower default rates mean investors may demand less compensationin order to take creditrisk.
Data as of Sept. 30, 2021. Source: Federal Reserve Bank of St. Louis, FactSet. Past performance is not a guarantee of future results. Investors cannot invest directly in an index, and unmanaged index returns do not reflect any fees, expenses or sales charges.
Average Default Rate(1987-2003)

63Not for distribution to the generalpublic.Confidential and proprietaryinformation.
International
International investments are subject to special risks, including currency fluctuations and social, economic and political uncertainties, which could increase volatility. These risks are magnified in emergingmarkets.

64
U.S. vs. International Equity Performance
S&P 500 vs. MSCI EAFE. Data as of Sept. 30, 2021. Source: FactSet. Past performance is not a guarantee of future results. Investors cannot invest directly in an index, and unmanaged index returns do not reflect any fees, expenses or sales charges.
0.0
0.5
1.5
1.0
2.0
2.5
3.0
3.5
1978 1993 1998 2013 2018
Diff
eren
ces B
etw
een
Inde
xes
77.9%
U.S.Outperformed
174.9%
390.5%International
Outperformed
1983 1988
U.S
.O
utpe
rfor
med
U.S.Outperformed
241.8%
95.8%International
Outperformed
2003 2008
Geographic leadership tends to persist for multiple years.
65Note: Other includes Canada, Australia, Sweden, Norway, and SouthAfrica.Source: Goldman Sachs. Past performance is not a guarantee of future results. Investors cannot invest directly in an index, and unmanaged index returns do not reflect any fees, expenses or sales charges.
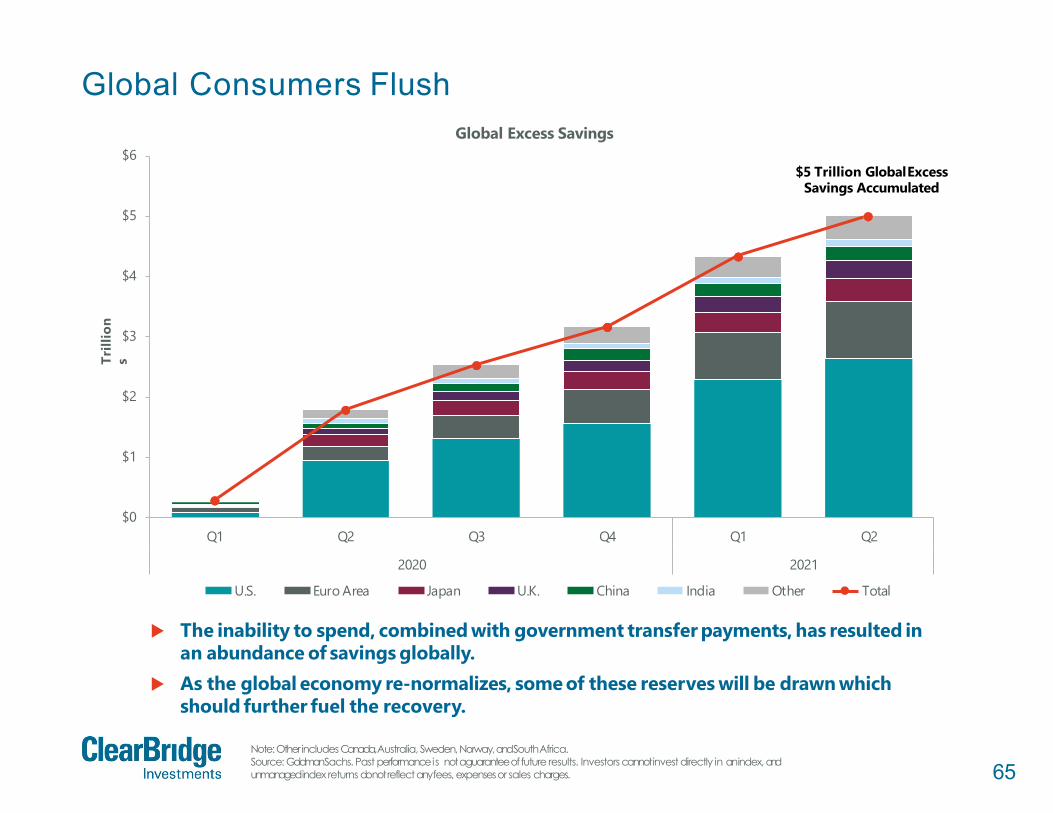
Global Consumers Flush
$0
$1
$2
$3
$4
$5
$6
Q1 Q2 Q3 Q4 Q1 Q2
Trill
ion
sGlobal Excess Savings
2020
U.S. Euro Area Japan U.K. China India
2021
Other Total
The inability to spend, combined with government transfer payments, has resulted in an abundance of savings globally.
As the global economy re-normalizes, some of these reserves will be drawn which should further fuel the recovery.
$5 Trillion GlobalExcess Savings Accumulated
66
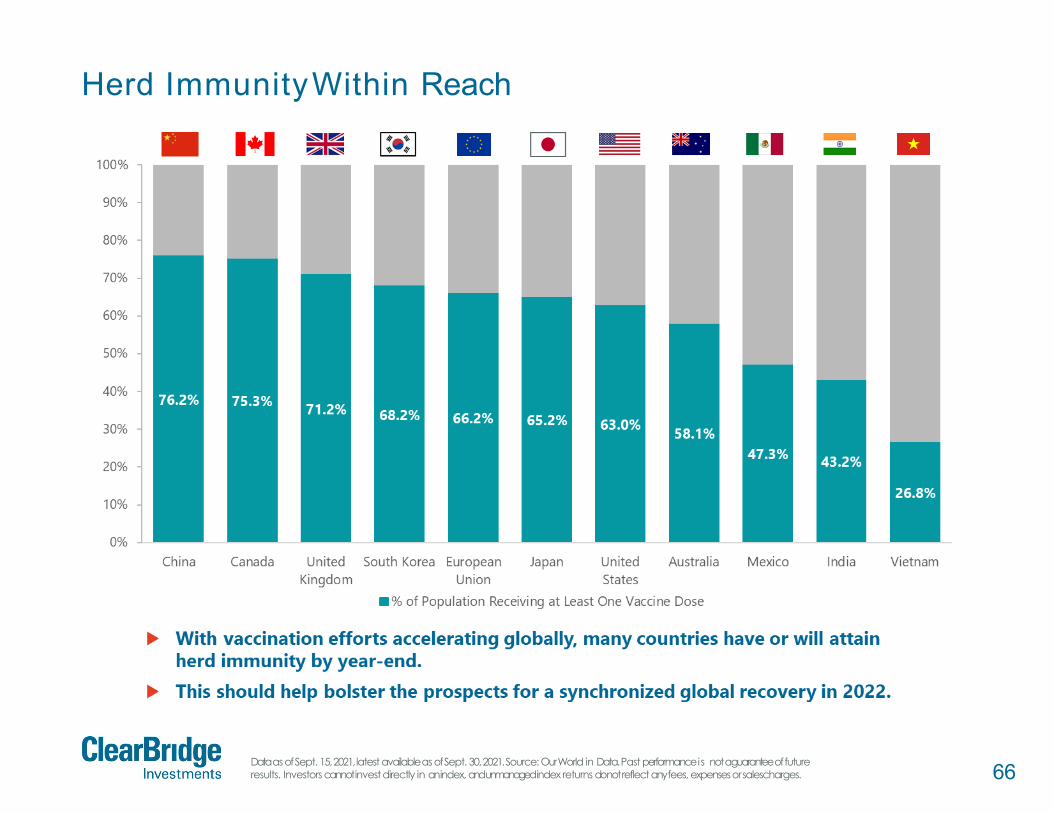
Herd ImmunityWithin Reach
Data as of Sept. 15, 2021, latest available as of Sept. 30, 2021. Source: Our World in Data. Past performance is not a guarantee of future results. Investors cannot invest directly in an index, and unmanaged index returns do not reflect any fees, expenses orsalescharges.
67
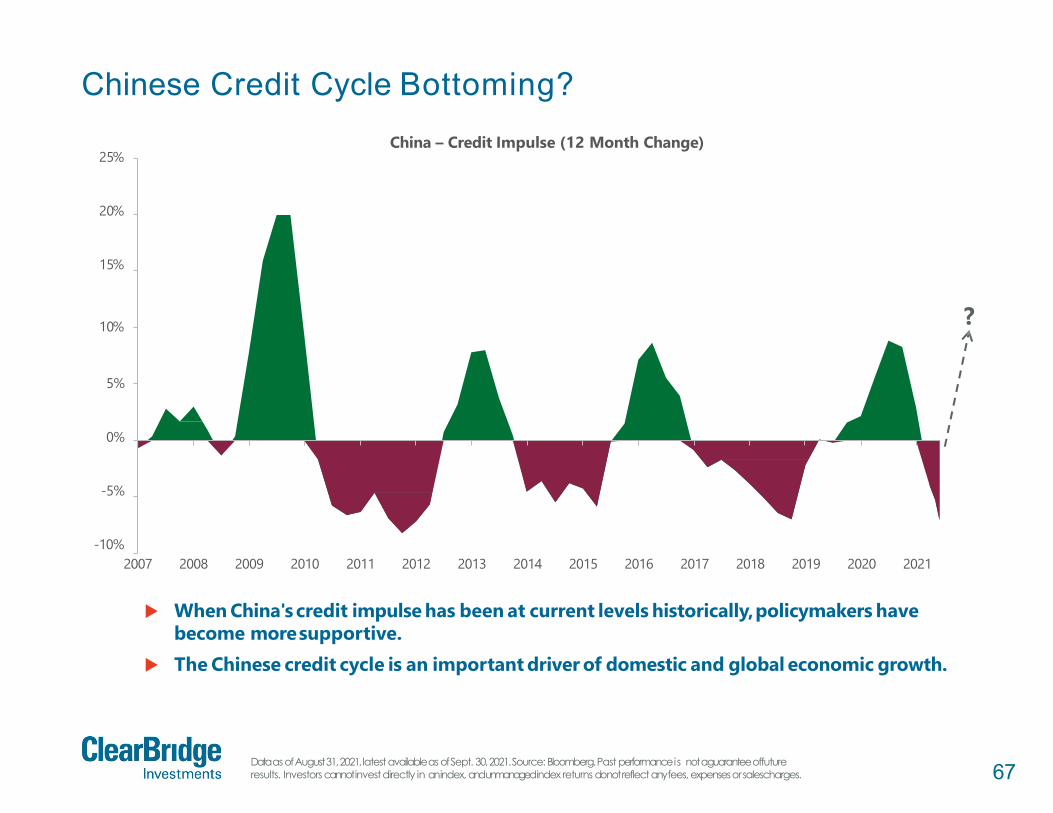
Chinese Credit Cycle Bottoming?
Data as of August 31, 2021, latest available as of Sept. 30, 2021. Source: Bloomberg. Past performance is not a guarantee offuture results. Investors cannot invest directly in an index, and unmanaged index returns do not reflect any fees, expenses orsalescharges.
10%
25%
20%
15%
China – Credit Impulse (12 Month Change)
5%
0%
-5%
-10%2007 2008 2009 2010 2011 2012 2013 2014 2015 2016 2017 2018 2019 2020 2021
When China's credit impulse has been at current levels historically,policymakers havebecome moresupportive.
The Chinese credit cycle is an important driver of domestic and global economic growth.
?

68
Global Markets More Cyclical
Cyclical sectors: Financials, Materials, Industrials, Energy. Cyclical exposure by MSCI Region. Data as of Sept. 30, 2021.Source:FactSet. Past performance is not a guarantee of future results. Investors cannot invest directly in an index, and unmanaged index returns do not reflect any fees, expenses or salescharges.
80%
70%
60%
50%
40%
30%
20%
10%
0%
Canada Europe Japan Emerging Markets All Country Asia World United States
Econ
omic
Sect
or-G
ICS
Dir
ect
Cyclical Exposure as Percent of Benchmark
Energy Financials Industrials Materials
In periods of acceleratingeconomic growth, non-U.S.markets tend to lead given greater cyclical exposure.
Most Cyclical Least Cyclical
69
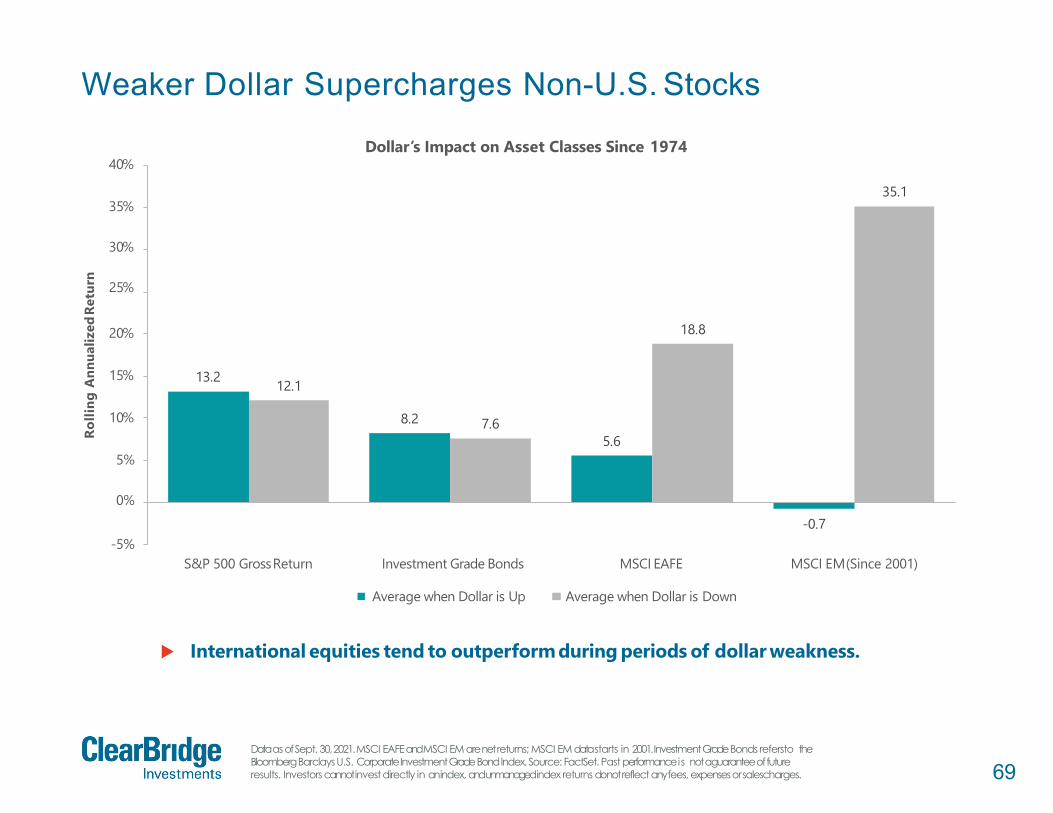
Weaker Dollar Supercharges Non-U.S. Stocks
Data as of Sept. 30, 2021. MSCI EAFE and MSCI EM are net returns; MSCI EM data starts in 2001. Investment GradeBonds refersto the Bloomberg Barclays U.S. Corporate Investment GradeBond Index. Source: FactSet. Past performance is not a guarantee of future results. Investors cannot invest directly in an index, and unmanaged index returns do not reflect any fees, expenses orsalescharges.
13.2
8.25.6
-0.7
12.1
7.6
18.8
35.1
-5%
5%
0%
10%
15%
20%
35%
30%
25%
40%
S&P 500 GrossReturn MSCI EM(Since 2001)
Rolli
ng A
nnua
lized
Retu
rn
Dollar’s Impact on Asset Classes Since 1974
Investment Grade Bonds
Average when Dollar is Up
MSCI EAFE
Average when Dollar is Down
International equities tend to outperformduring periods of dollar weakness.

70
Unprecedented Underestimation
As of Aug. 31, 2021, latest available as of Sept. 30, 2021.. Source: Factset. Past performance is not a guarantee of future results. Investors cannot invest directly in an index, and unmanaged index returns do not reflect any fees, expenses or sales charges.
-2%
-23%
-15%-18%
6% 5%
-7%
-13%
-6%
-16%-13%
-3% -3%
-7%
6%10%
13%
7%
-4%
-28%
-1%
3%
-12%-9%
-6%
-12%-12%
11%
-1%
-9%
16%
-40%
-30%
-20% -17%
-10%
1%0%
10%
20%
1988 1991 1994 1997 2000 2003 2006 2009 2012 2015 2018-37%
2021
% o
fMSC
I Eur
ope
MSCI Europe change in FY1 EPS till Mid-August Median
Normally, European earningsrevisions move lower as the year progresses. Similar to the U.S., analysts were too pessimistic coming into 2020 setting up a
historically strong period of upward revisions and corresponding market rally.
Avg -5%
71Not for distribution to the generalpublic.Confidential and proprietaryinformation.
Volatility
72
65
14 14
21
35
0
5
10
15
20
25
30
35
<-20% -20% - 10% 10% - 20% >20%
Year
s
-10% - 0% 0% - 10%S&P 500 Annual Total ReturnRanges
19271928193319351936193819421943194519501951195419551958196119631967197519761980198219831985198919911995199619971998199920032009201320172019
193019311937197420022008
19411957196619732001
19291932193419391940194619531962196919771981199020002018
19471948195619601970197819841987199219942005200720112015
192619441949195219591964196519681971197219791986198819932004200620102012201420162020
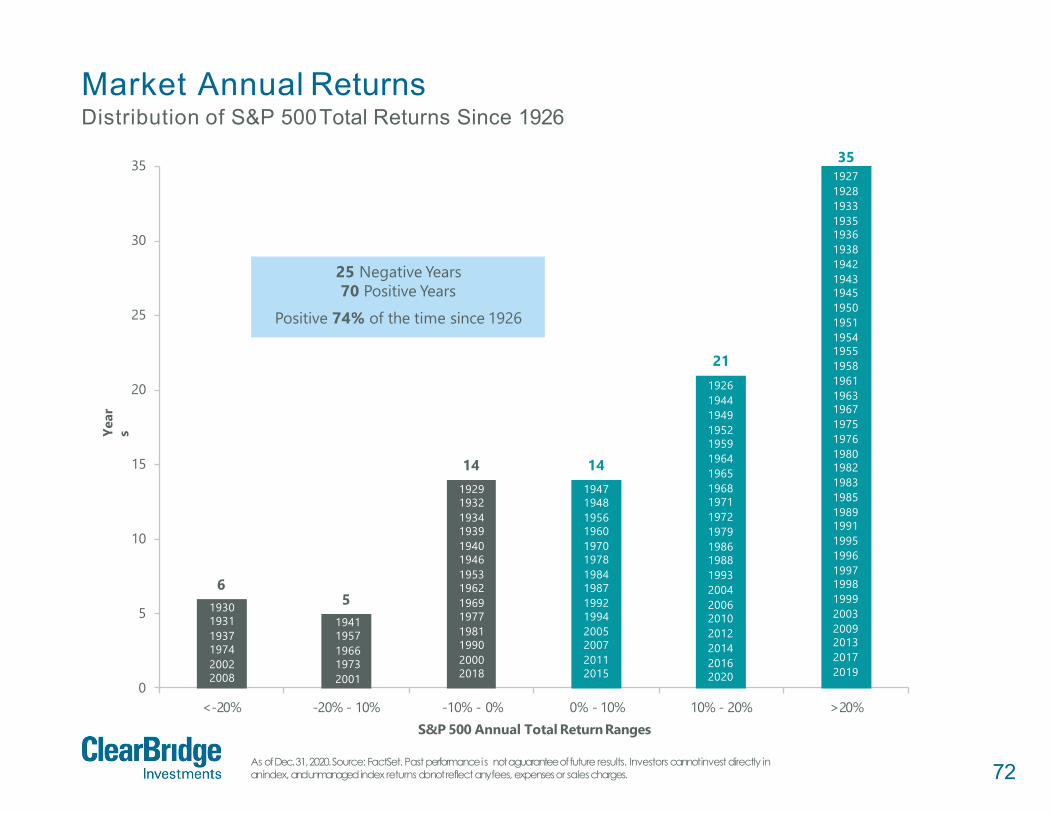
25 Negative Years70 Positive Years
Positive 74% of the time since 1926
Market Annual ReturnsDistribution of S&P 500Total Returns Since 1926
As of Dec. 31, 2020. Source: FactSet. Past performance is not a guarantee of future results. Investors cannot invest directly in an index, and unmanagedindex returns do not reflect any fees, expenses or salescharges.
73
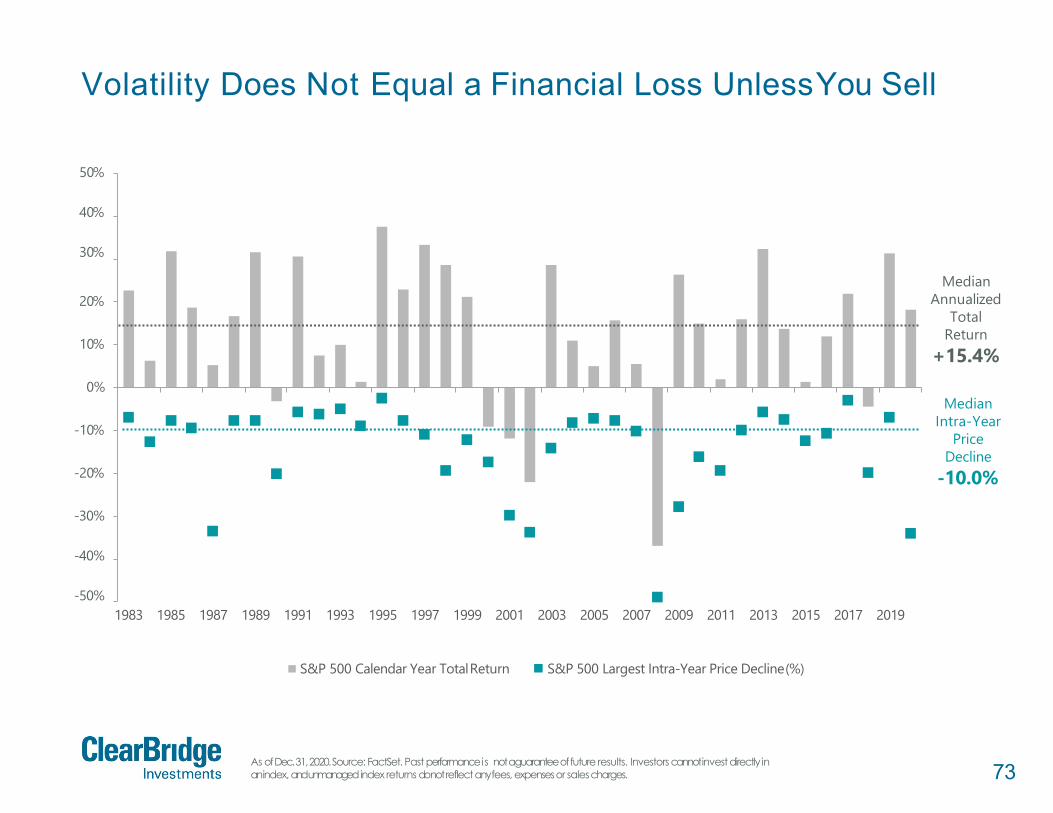
-20%
-10%
0%
10%
20%
50%
40%
30%
-30%
-40%
-50%1983 1985 1987 1989 1991 1993 1995 1997 1999 2001 2003 2005 2007 2009 2011 2013 2015 2017 2019
S&P 500 Calendar Year TotalReturn S&P 500 Largest Intra-Year Price Decline(%)
Median Intra-Year
Price Decline
-10.0%
Median Annualized
Total Return
+15.4%
Volatility Does Not Equal a Financial Loss UnlessYou Sell
As of Dec. 31, 2020. Source: FactSet. Past performance is not a guarantee of future results. Investors cannot invest directly in an index, and unmanagedindex returns do not reflect any fees, expenses or salescharges.

74
Missing the Best Days Can Drastically ReduceReturns
Data as of March 31, 2020. Source: FactSet. Past performance is not a guarantee of future results. Investors cannot invest directly in an index, and unmanaged index returns do not reflect any fees, expenses or salescharges.
Decade Price Return Excluding 10 BestDaysPer Decade Price Return Excluding 10 BestDays
Per Decade
1930 -42% -79% -5% -15%
1940 35% -14% 3% -2%
1950 257% 167% 14% 11%
1960 54% 14% 4% 1%
1970 17% -20% 2% -2%
1980 227% 108% 13% 8%
1990 316% 186% 15% 12%
2000 -24% -62% -3% -10%
2010 190% 95% 11% 7%
Average Since 1930 114% 44% 6% 1%
Cumulative Annualized
Investors that missed the 10 best days in a given decade would have seen 70%lower returns over the course of that decade on average.
28% of the best days (5% or more) took place in the first two months of a bull market.
75
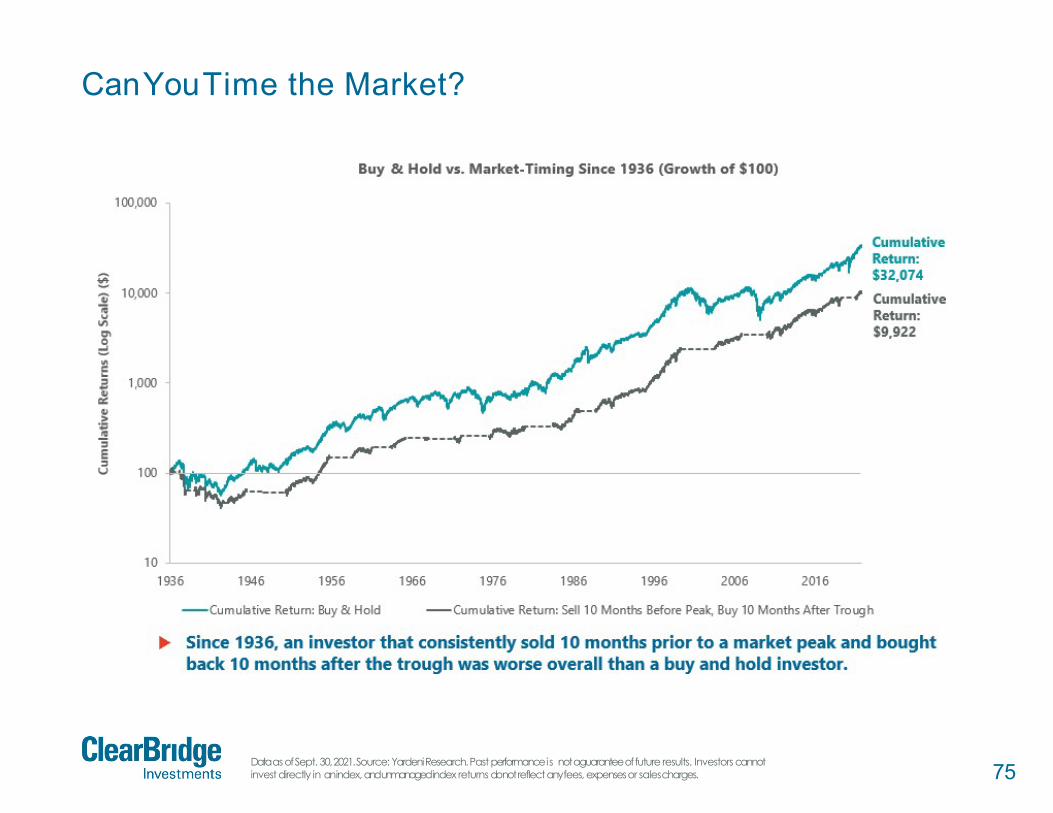
CanYouTime the Market?
Data as of Sept. 30, 2021. Source: Yardeni Research. Past performance is not a guarantee of future results. Investors cannot invest directly in an index, and unmanaged index returns do not reflect any fees, expenses or salescharges.

76
Typical Market Leadership in a Downturn
Note: Average performance: average performance during selloffs of 5% or more, Hit Rate: Hit rate of outperformance during 5%+selloffs, 2005 – present. Benchmarks used: Large Value: S&P 500 Value, Large Blend: S&P 500, Large Growth: S&P 500 Growth; Mid Value: S&P 400 Value, Mid Blend: S&P 400, Mid Growth: S&P 400 Growth; Small Value: S&P 600 Value, Small Blend: S&P 600, Small Growth: S&P 600 Growth. Outperformance frequency calculated relative to S&P 1500 index. Data as of Sept. 30, 2021. Source: S&P, Bloomberg. Past performance is not a guarantee of futureresults. Investors cannotinvest directly in an index, and unmanaged index returns do not reflect any fees, expenses or salescharges.
Smal
l
Mar
ketC
apM
idLa
rge
Value GrowthBlend
Investment Style
Large Cap Value
-13.0%Avg. Perf.
41%Hit Rate
Mid Cap Value
-14.2%Avg. Perf.
24%Hit Rate
Small Cap Value
-14.8%Avg. Perf.
21%Hit Rate
Large Cap
-12.3%Avg. Perf.
76%Hit Rate
Mid Cap
-13.7%Avg. Perf.
31%Hit Rate
Small Cap
-14.2%Avg. Perf.
24%Hit Rate
Large Cap Growth
-11.7%Avg. Perf.
69%Hit Rate
Mid Cap Growth
-13.2%Avg.Perf.
35%Hit Rate
Small Cap Growth
-13.7%Avg. Perf.
41%Hit Rate
MostDefensive
Least Defensive
Less
Def
ensiv
e
Less Defensive

77
Glossary ofTermsBEA: Bureau of Economic Analysis
Bloomberg Barclays US Aggregate Bond Index:an unmanaged index of U.S. investment-grade fixed-incomesecurities.Bloomberg Barclays US Corporate InvestmentGrade Bond Index: an unmanaged index of U.S. investment-grade corporate bond securities.Capex (Capital expenditures):corporatespending on productive assets (such as buildings, machinery and equipment, vehicles) intended to increasecapacity or efficiency for more than one accounting period.CPI (Consumer Price Index):measure of the average change in U.S. consumer prices over time in a fixed market basket of goods and services asdetermined by U.S. Bureau of Labor Statistics.
EPS (Earnings per Share): the portion of a company's profit allocated to each outstanding share of common stock.FAANGM: Shorthand term for a group of leading technology stocks including Facebook, Apple,Amazon, Netflix, Google/Alphabet, and Microsoft.
GDP: Gross Domestic ProductGFC (Great Financial Crisis): the severe economic and market downturn experienced in 2007-2008.
Fed (Federal Reserve Board): the U.S. central bank, responsible for policies designed to promote full economic growth, full employment, and price stability.LEI Index: Conference Board Leading Economic Indicators index.
Mortgage Bankers Association (MBA) Purchase Index:measure of relative change over time in mortgage applications for property purchasesMSCI All Country World Index:unmanaged index of large- and mid-cap stocks in developed and emerging markets.
MSCI EM Index: unmanaged index of large- and mid-cap stocks in 27 emerging market countries.MSCI EAFE Index: unmanaged index of equity securities from developedcountries in Western Europe, the Far East, and Australasia.
MSCI USA Index: unmanaged index of US large- and mid-cap equity securities.NAREIT All-Equity REITS Total Return Index: free-float-adjusted market capitalization weighted index that includes all tax qualified REITS listed in theNYSE, AMEX and NASDAQ National Markets.NFIB (National Federationof Independent Business): a U.S. small business advocacy association, representing over 350,000 small and independentbusiness owners.NFIB Small Business Optimism Index:measure of small business sentiment produced by the National Federation of Independent Business based on itsmonthly survey of small business owners.
P/E Ratio: Price/EarningsratioPMI: Purchasing Manager’s Index
78
Glossary ofTermsQuantitative easing (QE): Monetary policy implemented by a central bank in which it increases the excess reserves of the banking system through the direct purchase of debtsecurities.
Russell 1000 Growth Index: unmanaged index of large-cap stocks chosen for their growth orientation.Russell 1000 Value Index: unmanaged index of large-cap stocks chosen for their value orientation.
Russell 2000 Index: unmanaged index of small-cap stocks.Shibor: Shanghai Interbank OfferedRate
S&P MidCap 400 Index: unmanaged index of 400 US mid-cap stocksS&P 400 Growth Index: unmanaged index of mid-cap stocks having higher price-to-book ratios relative to the S&P 400 MidCap as a whole.
S&P 400 Value Index: unmanaged index of mid-cap stocks having lower price-to-book ratios relative to the S&P 400 MidCap as a whole.S&P 500 Growth Index: unmanaged index of large-cap stocks selected based on sales growth, the ratio of earnings change to price and momentum.
S&P 500 Value Index: unmanaged index of large-cap stocks selected based on the ratios of book value, earnings, and sales to price.S&P 600 Index: unmanaged index of 600 US small-cap stocksS&P 600 Growth Index: unmanaged index of US small-cap growth stocks, selected based on sales growth, the ratio of earnings change to price, andmomentum.S&P 600 Value Index: unmanaged index of US small-cap value stocks, selected based on ratios of book value, earnings, and sales to price.
S&P 500 Index: Unmanaged index of 500stocks that is generally representative of the performanceof larger companies in the U.S.VIX: VIX is the ticker symbol and the popular name for the Chicago Board Options Exchange's CBOE Volatility Index, a popular measure of the stockmarket's expectation of volatility based on S&P 500 index options.
Yield Curve: Comparison of interest rates at a point in time of bonds with equal credit quality but different maturity dates.YoY: Year Over YearU.S. Treasurys: Direct debt obligations issued and backed by the "full faith and credit" of the U.S. government. The U.S. government guarantees the principal and interest payments on U.S. Treasuries when the securities are held to maturity. Unlike U.S. Treasury securities,debt securities issued by the federal agencies and instrumentalities and related investments may or may not be backed by the full faith and credit of the U.S. government. Even when theU.S. government guarantees principal and interest payments on securities, this guarantee does not apply to losses resulting fromdeclines in the marketvalue of these securities.
79
Name and Position IndustryExperience
ClearBridgeTenure Education, Experience and Professional Designations
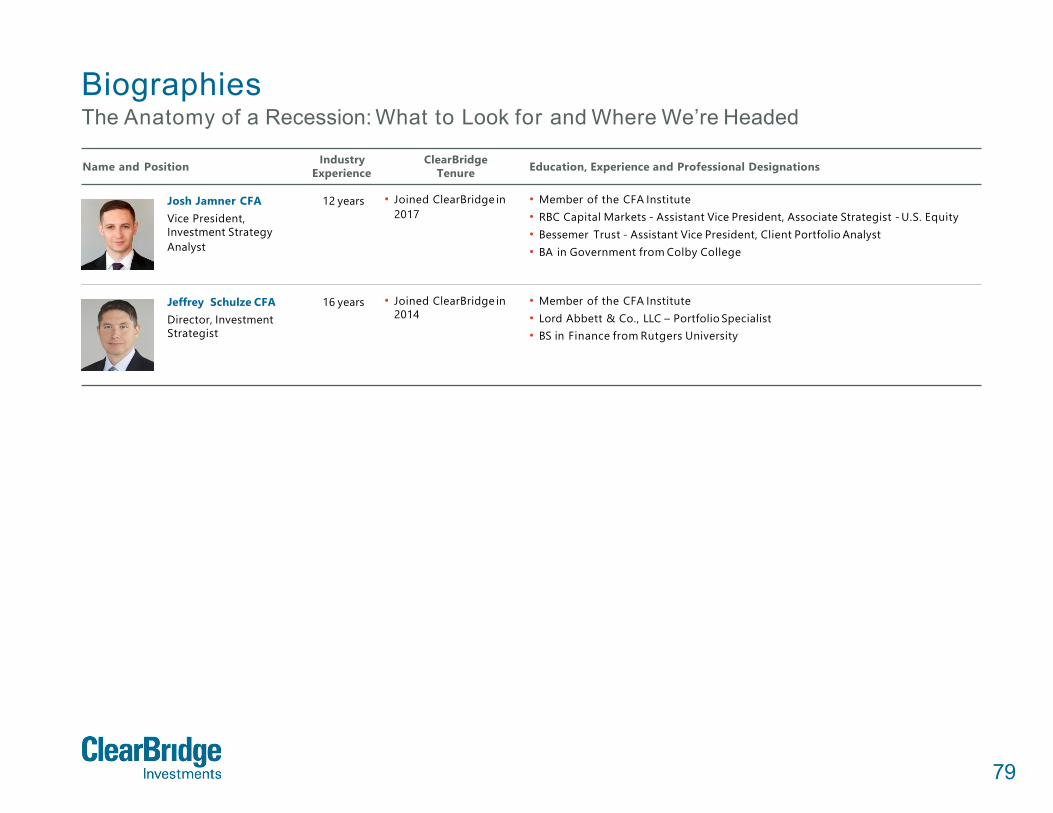
Josh Jamner CFAVice President,Investment StrategyAnalyst
12 years • Joined ClearBridge in2017
• Member of the CFA Institute• RBC Capital Markets - Assistant Vice President, Associate Strategist - U.S. Equity• Bessemer Trust - Assistant Vice President, Client Portfolio Analyst• BA in Government from Colby College
Jeffrey Schulze CFADirector, InvestmentStrategist
16 years • Joined ClearBridge in2014
• Member of the CFA Institute• Lord Abbett & Co., LLC – Portfolio Specialist• BS in Finance from Rutgers University
BiographiesThe Anatomy of a Recession: What to Look for and Where We’re Headed

80
Additional Important Information“Anatomy of a Recession” is a trademark of ClearBridge Investments, LLC. ClearBridge Investments, LLC isa subsidiary of Franklin Resources, Inc.
This material is intended to be of general interest only and should not be construed as individual investment advice or a recommendation or solicitation to buy, sell or hold any security or to adopt any investment strategy. It does not constitute legal or tax advice. This material may not be reproduced, distributed or published without prior written permission from Franklin Templeton.
The views expressed are those of the investment manager and the comments, opinions and analyses are rendered as at publication date and may change without notice. The underlying assumptions and these views are subject to change based on market and other conditions and may differ from other portfolio managers or of the firm as a whole. The information provided in this material is not intended as a complete analysis of every material fact regarding any country, region or market. There is no assurance that any prediction, projection or forecast on the economy, stock market, bond market or the economic trends of the markets will be realized. The value of investments and the income from them can go down as well as up and you may not get back the full amount that you invested. Past performance is not necessarily indicative nor a guarantee of future performance. All investments involve risks, including possible loss ofprincipal.
Any research and analysis contained in this presentation has been procured by Franklin Templeton for its own purposes and may be acted upon in that connection and, as such, is provided to you incidentally.Data from third party sources may have been used in the preparation of this material and FranklinTempleton ("FT") has not independently verified, validated or audited such data. Although informationhas been obtained from sources that Franklin Templeton believes to be reliable, no guarantee can be given as to its accuracy and such information may be incomplete or condensed and may be subject to change at any time without notice. The mention of any individual securities should neither constitute nor be construed as a recommendation to purchase, hold or sell any securities, and the information provided regarding such individual securities (if any) is not a sufficient basis upon which to make an investment decision. FT accepts no liability whatsoever for any loss arising from use of this information and reliance upon the comments,opinions and analyses in the material is at the sole discretion of the user.
Products, services and information may not be available in all jurisdictions and are offered outside theU.S. by other FT affiliates and/or their distributors as local laws and regulation permits. Please consultyour own financial professional or Franklin Templeton institutional contact for further information onavailability of products and services in your jurisdiction.
Issued in the U.S. by Franklin Distributors, LLC, One Franklin Parkway, San Mateo, California 94403 -1906, (800)DIAL BEN/342-5236, franklintempleton.com - Franklin Distributors, LLC, member FINRA/SIPC, is the principaldistributor of Franklin Templeton U.S. registered products, which are not FDIC insured; may lose value; and arenot bank guaranteed and are available only in jurisdictions where an offer or solicitation of such products ispermitted under applicable laws and regulation.
Australia: Issued by Franklin Templeton Investments Australia Limited (ABN 87 006 972 247) (Australian Financial Services License Holder No. 225328), Level 19, 101 Collins Street, Melbourne, Victoria, 3000. Austria/Germany: Issued by Franklin Templeton International Services S.à r.l.,Niederlassung Deutschland , Frankfurt, Mainzer Landstr. 16, 60325 Frankfurt/Main, Tel. 08 00/0 73 80 01 (Germany), 08 00/29 59 11 (Austria), Fax: +49(0)69/2 72 23-120, [email protected], [email protected] Canada: Issued by Franklin Templeton Investments Corp., 200 King Street West, Suite 1500 Toronto, ON, M5H3T4, Fax:(416) 364-1163, (800) 387-0830, www.franklintempleton.ca.
Netherlands: Franklin Templeton International Services S.à r.l., Dutch Branch , World Trade CenterAmsterdam, H-Toren, 5e verdieping, Zuidplein 36, 1077 XV Amsterdam, Netherlands. Tel +31 (0) 20 5752890.
United Arab Emirates: Issued by Franklin Templeton Investments (ME) Limited, authorized and regulated by the Dubai Financial Services Authority. Dubai office: Franklin Templeton, The Gate, East Wing, Level 2, Dubai International Financial Centre, P.O. Box 506613, Dubai, U.A.E., Tel.: +9714 -4284100 Fax:+9714- 4284140.
France: Issued by Franklin Templeton International Services S.à r.l., French branch, 55 avenue Hoche, 75008 Paris France. Hong Kong: Issued by Franklin Templeton Investments (Asia) Limited, 17/F, Chater House, 8 Connaught Road Central, Hong Kong. Italy: Issued by Franklin Templeton International Services S.à.r.l. – Italian Branch, Corso Italia, 1 – Milan, 20122, Italy. Japan: Issued by Franklin Templeton Investments Japan Limited. Korea: Issued by Franklin Templeton Investment Trust Management Co., Ltd., 3rd fl., CCMM Building, 12 Youido-Dong, Youngdungpo-Gu, Seoul, Korea 150-968. Luxembourg/Benelux: Issued by Franklin Templeton International Services S.à r.l. – Supervised by the Commission de Surveillance du Secteur Financier - 8A, rue Albert Borschette, L-1246 Luxembourg - Tel:+352-46 66 67-1 - Fax:+352-46 66 76. Malaysia: Issued by Franklin Templeton Asset Management (Malaysia) Sdn. Bhd. & Franklin Templeton GSC Asset Management Sdn. Bhd. This document has not been reviewed by Securities Commission Malaysia. Poland: Issued by Templeton Asset Management (Poland) TFI S.A.; Rondo ONZ 1; 00-124 Warsaw Romania: Franklin Templeton International Services S.À R.L. Luxembourg, Bucharest Branch, at 78-80 Buzesti Str, Premium Point, 8th Floor, Bucharest 1, 011017, Romania. Registered with Romania Financial
Supervisory Authority under no. PJM07.1AFIASMDLUX0037/10 March 2016 and authorized and regulated in Luxembourg by Commission de Surveillance du Secture Financiere. Telephone: + 40 21 200 9600 Singapore: Issued by Templeton Asset Management Ltd. Registration No. (UEN) 199205211E and Legg Mason Asset Management Singapore Pte. Limited, Registration Number (UEN) 200007942R. Legg Mason Asset Management Singapore Pte. Limited is an indirect wholly owned subsidiary of Franklin Resources, Inc. 7 Temasek Boulevard, #38-03 Suntec Tower One, 038987, Singapore. Spain: Issued by Franklin Templeton International Services S.à r.l. – Spanish Branch , Professional of the Financial Sector under the Supervision of CNMV, José Ortega y Gasset 29, Madrid, Spain. Tel +34 91 426 3600, Fax +34 91 577 1857. South Africa: Issued by Franklin Templeton Investments SA (PTY) Ltd which is an authorised Financial Services Provider. Tel:+27 (21) 831 7400 ,Fax:+27 (21) 831 7422. Switzerland: Issued by Franklin Templeton Switzerland Ltd, Stockerstrasse 38, CH-8002 Zurich. UK: Issued by Franklin Templeton Investment Management Limited(FTIML), registered office: Cannon Place, 78 Cannon Street, London EC4N 6HLTel+44 (0)20 7073 8500. Authorized and regulated in the United Kingdom by the Financial Conduct Authority. Nordic regions: Issued by Franklin Templeton International Services S.à r.l. , Contact details: Franklin Templeton International Services S.à r.l., Swedish Branch, filial, Nybrokajen 5, SE-111 48, Stockholm, Sweden. Tel +46 (0)8 545 012 30, nordicinfo@franklintempleton. com, authorised in the Luxembourg by the Commission de Surveillance du Secteur Financier to conduct certain financial activities in Denmark, in Sweden, in Norway, in Iceland and in Finland. Franklin Templeton International Services S.à r.l., Swedish Branch, filial conducts activities under supervision of Finansinspektionen in Sweden.
Offshore Americas: In the U.S., this publication is made available only to financial intermediaries by Franklin Distributors, LLC, member FINRA/SIPC, 100 Fountain Parkway, St. Petersburg, Florida 33716. Tel:(800) 239-3894 (USA Toll-Free),(877) 389-0076 (Canada Toll-Free), and Fax: (727)299-8736.Investments are not FDIC insured; may lose value; and are not bank guaranteed. Distribution outside theU.S. may be made by Franklin Templeton International Services, S.a.R.L. (FTIS) or other sub-distributors, intermediaries, dealers or professional investors that have been engaged by FTIS to distribute shares ofFranklin Templeton funds in certain jurisdictions. This is not an offer to sell or a solicitation of an offer to purchase securities in any jurisdiction where it would be illegal to do so. Please visit www.franklinresources.com to be directed to your local Franklin Templeton website.
Copyright © 2021 Franklin Templeton. All rights reserved.
CBAX539422 10/21 AOR GLPB

The information provided in this communication is solely for educational purposes and should not be construed as advice or an investment recommendation. Fidelity Investments is a separate company, unaffiliated with ClearBridge Investments.There is no form of partnership, agency affiliation, or similar relationship between ClearBridge Investments and Fidelity Investments, nor is such a relationship created or implied by the information herein. Fidelity Investments has not been involved with the preparation of the content supplied by ClearBridge Investments and does not guarantee or assume any responsibility for its accuracy or completeness.