the analysis of forest dynamics within the carpathians
TRANSCRIPT

Forum geografic. Studii și cercetări de geografie și protecția mediului Year 9, No. 9/ 2010, pp. 115-124
115
THE ANALYSIS OF FOREST DYNAMICS WITHIN THE CARPATHIANS - THE SUBCARPATHIANS CONTACT AREA BY USING THE HISTORICAL CARTOGRAPHY APPROACH AND
OPEN SOURCE GIS SOFTWARE. CASE STUDY: THE LIMPEDEA CATCHMENT (ROMANIA)
Gabriela OSACI-COSTACHE1, Marian ENE
1
1 University of Bucharest, Faculty of Geography, e-mail: [email protected]
Abstract
The paper is an original contribution based on the
diachronic comparison of historical maps from different
periods, with the purpose of capturing and mapping the
landscape history of the Limpedea catchment (tributary
of the Argeş), which stretches almost equally into the
strongly man-altered space of the Subcarpathians, as
well as into the mountain area. The study highlights the
changes undergone by the Arefu - Corbeni
Subcarpathian depression and the neighbouring
mountain area, paying particular attention to the
Carpathian - Subcarpathian interface zone. In order to
achieve its goal, the study relied on large scale maps
from the 1790-1980 period, which were processed in
Open Source GIS (Quantum GIS, GRASS, gvSIG
Sextante, MapAnalyst). The interpretation of
cartographic information using GIS techniques showed a
continuous recession of the forests in the Subcarpathian
part of the catchment and their replacement by
agricultural lands, which led to a gradual decrease of the
naturality degree. In the 1864-1904 period, the extension
of pastures and hay fields to the detriment of the forests
was prevalent, whereas in the second half of the 20th
century larger and larger areas of pastures and hay fields
were turned into orchards or built-up areas.
Keywords: historical cartography, Open Source GIS,
Quantum GIS, GRASS, forest, landscape, land use
Rezumat
Analiza dinamicii pădurii în zona de contact carpaţi -
subcarpaţi prin cartografie istorică în mediu SIG open
source. Cazul Bazinului Limpedea (România). Lucrarea
constituie o contribuţie originală, bazată pe compararea
diacronică a hărţilor istorice din diferite perioade, cu scopul
surprinderii şi cartografierii istoriei peisajului în bazinul
hidrografic al pârâului Limpedea (afluent al Argeşului), bazin
extins în părţi aproximativ egale în spaţiul puternic antropizat
al Subcarpaţilor şi în zona montană. Studiul surprinde atât
modificările din depresiunea subcarpatică Arefu - Corbeni,
cât şi din zona montană şi mai ales din zona de interferenţă
carpatico-subcarpatică. Pentru atingerea scopului propus s-au
folosit hărţi la scară mare din perioada 1790-1980, care au
fost exploatate în mediu GIS Open Source (Quantum GIS,
GRASS, gvSIG, Sextante, MapAnalyst). Interpretarea datelor
conţinute în hărţi cu ajutorul tehnicilor GIS a evidenţiat o
reducere continuă a pădurilor din spaţiul subcarpatic al
bazinului şi înlocuirea acestora cu terenuri agricole, fapt ce a
determinat reducerea treptată a gradului de naturalitate. În
perioada 1864-1904 a predominat extinderea păşunilor şi
fâneţelor în detrimentul pădurilor, iar în partea a doua a
secolului XX, suprafeţe tot mai mari de păşuni şi fâneţe au
fost transformate în livezi sau areale construite.
Cuvinte-cheie: cartografie istorică, GIS Open Source,
Quantum GIS, GRASS, pădure, peisaj, utilizarea terenurilor.
INTRODUCTION
Investigations have proved that over the time,
several cultures and economies overlapped on this
territory and the result was a real “layering” in time
of the landscapes, each of them being in essence a
cultural landscape that reflected the identity of the
territory. Thus, the landscapes depend on “man’s
will and his concrete actions”, which means they
are not “a fabrication or a subjective interpretation”
(Lorenzi, 2007). In order to capture the landscape
history one should turn to historical cartography,
because it reveals the landscape features, their
dynamics in various stages and especially their
location. This is the reason why the cartographic
approach has been tackled widely in the literature
(Corna Pellegrini, 2004; Lago, 2004; Longhi, 2004;
Robinson, 2004; Rosseli, Paulmier, 2006;
Campiani, Garberi, 2008; Osaci-Costache, 2004,
2008, 2009a, 2009b etc.). Therefore, the originality
of our contribution consists in the analysis and
diachronic comparison of large-scale maps with the
purpose of highlighting some aspects concerning
the landscape dynamics based on the employment
of Open Source GIS software (Quantum GIS,
GRASS, gvSIG, Sextante, MapAnalyst).

The analysis of forest dynamics within the Carpathians - the Subcarpathians contact area by using the historical cartography approach and open source GIS software.
Case study: the Limpedea catchment (Romania)
116
The study has sought to investigate from a
cartographic point of view the changes that
occurred in the contact area between the
Subcarpathians and the Carpathians, i.e. in the space
”invaded” more and more by man in his quest for
new resources and new agricultural lands. As study
area, we have chosen the catchment of the
Limpedea stream (35.58 sq km), a left-side tributary
of the Argeş, which stretches almost equally in the
Subcarpathian (18.08 sq km) and Carpathian (17.5
sq km) spaces. In the north, the catchment overlaps
the mountain area (maximum elevation of 1621.9 m
in the Ghiţu peak), whereas in the south it overlaps
the Arefu - Corbeni Subcarpathian depression (with
minimum elevation of 592 m at the confluence of
the Limpedea with the Argeş). In the extreme
southeast there lies the Chiciura peak (1217.9 m),
which is the highest summit in the Romanian
Subcarpathians (Fig. 1).
Fig. 1 The study area (3D model obtained in GRASS
software by using the “NVIZ” module)
From the administrative point of view, the
investigated area belongs to Corbeni Commune,
consisting of several villages. One of these is
Berindeşti, firstly shown at the beginning of the 18th
century on the map drawn by Anton Maria del
Chiaro (1718); it appears on the Russian Map of
1835 with 30 families and on the Russian Map of
1853 with 40 families (Osaci-Costache, 2004). The
other two are Turburea and Poienari, the latter being
shown on the Szathmary Map of 1864. The
Subcarpathian catchment of the Limpedea stream
occupies a part of the Arefu - Corbeni subsequent
tectonic-erosive depression, lying at the contact
between the Subcarpathian and the Carpathian
areas. The depression is made up of Paleogene and
Miocene sedimentary formations (sandstones,
marls, clays and sands), on which landslides,
torrentiality and sheetwash are extremely active
(Nedelea, Dorca, 2001). These processes have been
encouraged by human actions, which have been
responsible not only for the shrinking of forest
vegetation, but also for overgrazing and plowing up
and down the slopes.
At present, forests are found especially in the
mountain area of the catchment (beech forests and
mixed beech-coniferous forests, with different
features depending on elevation, slope aspect and
declivity), as well as on the high Subcarpathian hills
(the northern side of the Chiciura Hill).
At the contact between the Subcarpathians and
the Carpathians, on the southern slopes of the Ghiţu
Massif, on the relatively gently inclined slopes and
on the rather flat surfaces of the Gornoviţa erosion
level, human settlements and agricultural lands
(characteristic for the depression) have gradually
climbed to the highest elevations of the mountain
area, to the detriment of the forests. Consequently,
they have come to occupy the rather steep slopes
lying above 800 m of altitude. For the Făgăraş -
Iezer Mountains, the mean inner limit of permanent
settlements ranges from 600 to 800 m (Mihăilescu,
1936), whereas that of the temporary ones lies
above 1300 m (Geografia României, III, 1987).
Agricultural lands are common in the lower part of
the Limpedea catchment.
A specific feature that has influenced the man-
environment relationships within the contact area
between the Argeş Subcarpathian Hills (Muşcelele
Argeşului) and the Carpathian area is the
development of the settlements’ estates farther into
the mountain area (the Arefu and Nucşoara
communes etc.). This feature, together with the
favourable pedoclimatic conditions and the high
percentage of low declivity surfaces, has
encouraged the gradual rising of the temporary
settlements’ line, north of the investigated area, as
high as 2,035 m (at Bâlea Lake).
SOURCES AND METHODS In order to reach the settled objective, we have
proceeded to the overlapping and diachronic
comparison of several large-scale historical maps,
which cover a period of 190 years. These are the
Specht Map (1790-1791, scale 1:57,600), “Charta
României Meridionale” or the Szathmary Map
(1864, scale 1:57,600), the Lambert’s projection
topographic plan (1904, scale 1:20,000) and the
Gauss-Krüger topographic map (1980, scale
1:25,000). All these cartographic documents have
been processed using the GIS Free and Open Source
softwares under Windows Vista: Quantum GIS
Forum geografic. Studii și cercetări de geografie și protecția mediului Year 9, No. 9/ 2010, pp. 115-124
117
(http://qgis.org/), known as QGIS, (versions 1.0.2. –
Kore, and 1.3.0. – Mimas), as well as “gvGIS”,
version 1.1.2. (www.gvsig.gva.es).
The research has been conducted in several
stages: (a) map scanning; (b) map georeferencing to
a common reference system, which was done in
Quantum GIS; (c) producing of vector layers in
ESRI Shapefile format and creation of a database in
Quantum GIS; (d) quantitative and qualitative
analysis of geographical data using GRASS
(integrated in QGIS; http://grass.osgeo.org/) and
Sextante (integrated in gvSIG;
http://www.//sextantegis.org) softwares; (e)
elaboration of synthesis maps in QGIS. Some final
processing was accomplished with the Open Source
“GIMP” (http://www.gimp.org/) and “Inkscape”
(http://www.inkscape.org/) softwares.
Because of their significant distortions, the maps
dating back to the 18th and 19
th centuries have been
georeferenced on the basis of the control points
corresponding to those also existing on the map of
1980. These have been chosen by the “MapAnalyst”
free software, so that the standard deviation values
be minimum (Fig. 2).
The employment of a common reference system
(WGS84/UTM Zone 5N) and the good overlapping
of the chosen maps have allowed us to compare the
land use between 1864 and 1980, both from a
quantitative and a qualitative point of view.
Fig. 2 Distortion analysis of the Szathmary map
(1864) through Helmert transformation by using
MapAnalyst software
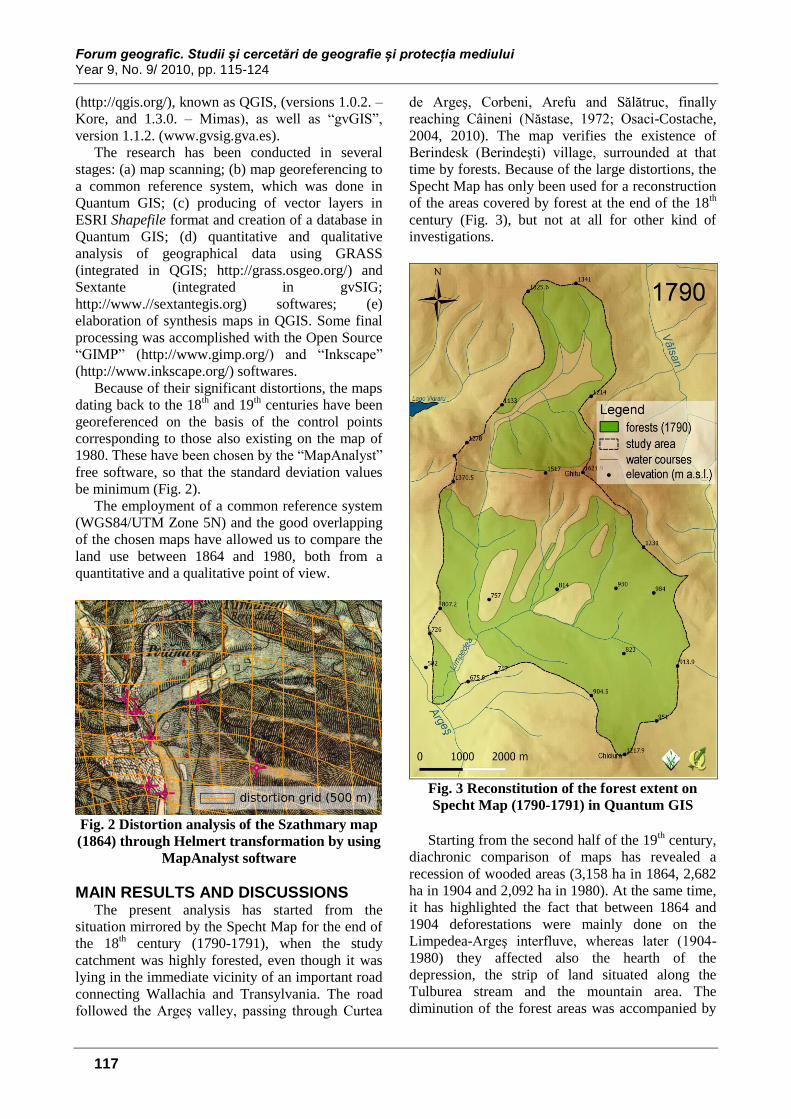
MAIN RESULTS AND DISCUSSIONS The present analysis has started from the
situation mirrored by the Specht Map for the end of
the 18th century (1790-1791), when the study
catchment was highly forested, even though it was
lying in the immediate vicinity of an important road
connecting Wallachia and Transylvania. The road
followed the Argeş valley, passing through Curtea
de Argeş, Corbeni, Arefu and Sălătruc, finally
reaching Câineni (Năstase, 1972; Osaci-Costache,
2004, 2010). The map verifies the existence of
Berindesk (Berindeşti) village, surrounded at that
time by forests. Because of the large distortions, the
Specht Map has only been used for a reconstruction
of the areas covered by forest at the end of the 18th
century (Fig. 3), but not at all for other kind of
investigations.
Fig. 3 Reconstitution of the forest extent on
Specht Map (1790-1791) in Quantum GIS
Starting from the second half of the 19
th century,
diachronic comparison of maps has revealed a
recession of wooded areas (3,158 ha in 1864, 2,682
ha in 1904 and 2,092 ha in 1980). At the same time,
it has highlighted the fact that between 1864 and
1904 deforestations were mainly done on the
Limpedea-Argeş interfluve, whereas later (1904-
1980) they affected also the hearth of the
depression, the strip of land situated along the
Tulburea stream and the mountain area. The
diminution of the forest areas was accompanied by

The analysis of forest dynamics within the Carpathians - the Subcarpathians contact area by using the historical cartography approach and open source GIS software.
Case study: the Limpedea catchment (Romania)
118
a rising of the lower tree line (from 594 m in
1864 to 635 m in 1904 and 680 m in 1980),
whereas the upper tree line continued to remain at
about 1,620 m (Fig. 4). Thus, between 1864 and
1904, the lower tree line rose 41 m and between
1904 and 1980 it rose again by 45 m, which
means a total of 86 m in 116 years (1864-1980).
The phenomenon can be explained by
anthropogenic interventions, which were stronger
on the bottom of the depression (on lower and
gently inclined surfaces), where wooded areas
were turned into agricultural lands.
Fig. 4 Forest distribution in relation to altitude. Reconstitution in Quantum GIS – GRASS based on
cartographic information
The general view of the deforestations that
affected the Limpedea catchment highlights a
marked recession of the wooded area in the
Subcarpathian space in comparison with the
mountain region. At the same time, the analysis of
historical maps reveals several stages of
anthropogenic intervention and points out the fact
that the human pressure was very strong during the
20th century (Fig. 5). The deforestations affected the
wooded areas owned by the state, especially at the
beginning of the period, as it has resulted from the
overlapping of a cartographic document issued in
1900 by the State Forest Service (the Forest map on
categories of ownership, scale 1:200,000).
Fig. 5 Reconstitution in Open Source GIS of the
deforested areas during the 1864-1980 period

Forum geografic. Studii și cercetări de geografie și protecția mediului Year 9, No. 9/ 2010, pp. 115-124
119
The diminishing of wooded lands determined a
continuous lowering of the naturality degree,
expressed as percentage of the forest in the total
area (Ionescu et al., 1989). It must be mentioned,
however, that we have computed the index relying
on the information provided by historical maps
(Fig. 6), while being aware of the fact that man
was not entirely responsible for the recession of
wooded areas. Although, on the whole, the values
slightly decreased (88.76 percent in 1864, 75.38
percent in 1904 and 58.80 percent in 1980), thus
allowing us to include the Limpedea catchment
into the category of intensely forested lands, a
detailed analysis conducted separately for the
Carpathian and the Subcarpathian areas has shown
a different situation. Thus, because deforestation
affected primarily the Subcarpathian space, the
naturality degree of this area dropped, reaching a
value of 32.4 percent in 1980 (according to the
specialists, a value of less than 50 percent leads to
negative ecological interactions; Ionescu et al.,
1989). The differences are big: most of the
mountain sector has currently values higher than
60 percent (often 100 percent), while in the
Subcarpathian region there are large areas with
values of the naturality degree below 11 percent
(with a minimum value of 0 percent at the
confluence with the Argeş).
Fig. 6 The evolution of naturality degree computed based on the information provided by historical maps
Deforestation, the most conspicuous
anthropogenic intervention on the landscape did not
remain without response in the toponymy of the
area. Under these circumstances, the old and present
maps turn to be important sources for getting in
touch with the toponyms, especially with those
belonging to the past centuries. Most of the
toponyms extracted from the maps we used for this
investigation are connected to the deforestation:
Secături (roughly Cleared lands), Poiana Vişinului
(The Cherry Tree Glade) etc. Other remind of the
pastures and hay fields specific for the 19th century:
Izlazul Berindeşti (The Berindeşti Common),
Izlazul Brădetului (The Brădetului Common).
Likewise, there are many toponyms referring to
specific tree species (La Sălcioara – At the Dwarf
Willow), or to the existence of fruit bearing trees
(La Vişini – At the Cherry Trees).
The deforestations were triggered by the new
demands of the inhabitants (agricultural lands,
building sites etc.) and they were followed by an
alteration of the initial land use. Therefore, the land
use has been another investigated aspect.
Comparing the maps, one can notice not only the
deforestation of large areas, but also the fact that
over the time the lands had various uses (Fig. 7).

The analysis of forest dynamics within the Carpathians - the Subcarpathians contact area by using the historical cartography approach and open source GIS software.
Case study: the Limpedea catchment (Romania)
120
Fig. 7 Land use reconstitution based on historical maps in Open Source GIS (Quantum GIS, GRASS)
A comparison between the Specht Map and the
Szathmary Map shows that the dominant
phenomenon for the 1790-1864 period was the
turning of forests into pastures and hay fields.
Cartographic documents (the Szathmary Map) and
written sources suggest the main occupation of the
inhabitants was stockbreeding, often under the form
of transhumance (Osaci-Costache, 2009b). Thus, the
spatial extension of pastures was dictated by the
necessity to provide food both for the local herds
and for those belonging to the Transylvanian
shepherds, as the study area was lying near a
passing track of transhumant herds. This sheep
itinerary was climbing upstream the Argeş River,
passing through Corbeni, then reaching Căpăţânenii
Ungureni (Fig. 5), from where it headed to Arefu
and farther away to the Frunţi Mountains and the
Făgăraş Massif (Popp, 1933). Along this way, Arefu
and Corbeni used to be the villages where sheep
counting was done (Constantinescu-Mirceşti, 1976),
while Arefu, Căpăţânenii Ungureni and Căpăţânenii
Pământeni were resting places for the tired herds
(Popp, 1933; Fig. 5).
At the beginning of the 20th century, large areas
of pastures and hay fields developed on the site of
the former forests. One can also notice an extension
of built-up areas and orchards, the latter reaching a
large development at the end of the last century
(1980). The extension of the orchards after 1960
was encouraged by the socialist legislation, which
turned the pastures and the hay fields into socialist
plantations (Bold et al., 1960).
The gradual extension of built-up areas within
the permanent settlements (29 ha in 1904 and 39 ha
in 1980) was accompanied by an increase in their
absolute elevation (Fig. 8). Unlike the forests, which
continuously withdrew to higher elevations, the
built-up areas stretched both up and down (Fig. 8).
Consequently, the amplitude of built-up areas grew
from 171 m (1864) to 289 m (1980). Most of the
isolated households shown on the topographic plan
of 1904 (67.21%) were included in the 20th century
in the compact built-up area. At the same time,
32.79 percent of the isolated households kept their
position, remaining far away from the compact
built-up area, but preserving their potential to
become future nuclei for its further expansion, as it
happened between 1904 and 1980.
The increasing human pressure was
accompanied by the rising of the upper line of
temporary settlements. The altitudinal spreading of
isolated buildings (chambers, dwellings, huts,
isolated houses with or without courtyards) meant
both a lowering of the absolute minimum elevation
and an increase of the absolute maximum altitude.
Looking strictly at the vertical location of
sheepfolds one can also ascertain an increase in
their absolute altitude (from 1,130 m in 1904 to
1,490 m in 1980), determined by the quest for new
pastures, inasmuch as stockbreeding has been a
traditional occupation in this area. This also
explains the vast lands covered by pastures and hay
fields during the former centuries.
Another consequence of the agricultural land
expansion to the detriment of the forest was the
tillage of highly inclined surfaces (Fig. 9). For
instance, if at the beginning of the 20th
century the
buildings occupied the lands lying at gradients

Forum geografic. Studii și cercetări de geografie și protecția mediului Year 9, No. 9/ 2010, pp. 115-124
121
between 0 and 18o, at the end of the same century
they came to seize the slopes with declivities as
high as 34o (the highest frequency, however,
being specific for the 8-15o interval). With respect
to the pastures and hay fields, which represent the
dominant land use in the Subcarpathian area of
the Limpedea catchment, one can notice that if in
1980 they recorded a maximum gradient of 37o, in
1980 this value reached 40o.
However, in 1980
most of the Subcarpathian pastures and hay fields
were found on slopes lying at gradients between 7
and 15o. The same phenomenon is also obvious
for the orchards: an increase of the land gradient
from a maximum of 15o in 1900 to 37
o in 1980. In
the mountain area of the catchment, gradients
often exceed 50o and, consequently, the slopes are
covered by woods (Fig. 9).
Fig. 8 Correlation between the built-up area and the relief elevation on the basis of cartographic information, in
the years 1864, 1904 and 1980

The analysis of forest dynamics within the Carpathians - the Subcarpathians contact area by using the historical cartography approach and open source GIS software.
Case study: the Limpedea catchment (Romania)
122
Fig. 9 Correlation based on cartographic data between land use and declivity at the beginning and the end of the
20th
century (fragment)
CONCLUSIONS
The large-scale historical maps made in the last
190 years have proved to be the best witnesses of
the landscape features. Their analysis and
comparison have highlighted a landscape
profoundly altered by man. Over the time, the
human intervention has had various intensities, but
it has particularly influenced the Subcarpathian area
and the contact strip between the Subcarpathians
and the Carpathians. As far as the mountain space is
concerned, it has been affected to a lesser extent. At
the end of the 18th century, a big part of the
investigated catchment was covered by forests, but
the wooded area declined significantly in the
following centuries, as a result of their turning into
pastures, hay fields, orchards and built-up areas.
This phenomenon entailed an increase in human
pressure, concomitantly with a lowering of the
naturality index. The dwellings and sheepfolds,
which are specific for the local traditional economy,
grew numerically and spread to higher elevations in
the mountain area.
The use of Open Source GIS software (Quantum
GIS, GRASS, gvGIS, Sextante and MapAnalyst)
has proved to be very productive for the quantitative
and qualitative analysis of historical maps, as well
as for their diachronic comparison, obviously
improving the results obtained through classical
methods. The overlapping of maps (based on the
same reference system) in GIS environment has
highlighted the landscape dynamics under the
influence of human activities and allowed for its
reconstitution in various stages. At the same time,
this technique has also allowed for the correlation
between the present features of the landscapes and
their genesis.
REFERENCES
Academia Româna. Institutul de Geografie (1987)
Geografia României. Vol. III. Carpaţii
Româneşti şi Depresiunea Transilvaniei, Editura
Academiei, Bucureşti.
Academia Română. Institutul de Geografie (1992),
Geografia României. Vol. IV. Regiunile
pericarpatice: Dealurile şi Câmpia Banatului şi
Crişanei, Podişul Mehedinţi, Subcarpaţii,
Piemontul Getic, Podişul Moldovei, Editura
Academiei, Bucureşti.

Forum geografic. Studii și cercetări de geografie și protecția mediului Year 9, No. 9/ 2010, pp. 115-124
123
Bold I., Lazăr Şt., Nicolae I. (1960), Organizarea
teritoriului – factor activ în înfiinţarea livezilor de
tip socialist din regiunea Piteşti, Revista de geodezie
şi organizarea teritoriului, IV, 4, pp. 48-54.
Campiani E., Garberi M.L. (2008), Cambiamenti di
uso del suolo dal 1853 ad oggi nel territorio
della Provincia di Ferrara, Atti 12a Conferenza
Nazionale ASITA, vol. I, L’Aquila, pp. 601-605.
Constantinescu-Mirceşti C. (1976), Păstoritul
transhumant şi implicaţiile lui în Transilvania şi
Ţara Românească în secolele XVIII-XIX, Editura
Academiei, Bucureşti.
Corna Pellegrini G. (2004), Paesaggi storico-
culturali, Atlante dei tipi geografici, Istituto
Geografico Militare, Firenze, pp. 614-619.
Ionescu Al., Săhleanu V., Bîndiu C. (1989),
Protecţia mediului înconjurător şi educaţia
ecologică, Editura Ceres, Bucureşti.
Lago L. (2004), Il contributo della cartografia
storica, Atlante dei tipi geografici, Istituto
Geografico Militare, Firenze, pp. 21-27.
Longhi A. (2004), La storia del territorio per il
progetto del paesaggio, Edizione Artistica
Piemontese, Torino.
Lorenzi R. (2007), La stratigrafia paesaggistica:
proposta di metodo per la mappatura dei
paesaggi storici, in Persi P. (ed.), Recondita
armonia. Il paesaggio tra progetto e governo del
territorio, III Convegno Internazionale sui Beni
Culturali Territoriali, 5-6-7 ottobre 2006, Urbino,
pp. 145-152.
Mihăilescu V. (1936), L’évolution de l’habitat rural
dans les collines de la Valachie entre 1700-1900,
Buletinul Societăţii Regale Române de
Geografie, LV, pp. 158-164.
Năstase A. (1972), Drumurile din Muntenia în
secolul al XVIII-lea, Buletinul Societăţii de
Ştiinţe Geografice din România, II (LXXII), pp.
154-159.
Nedelea A., Dorca C. (2001), Depresiunea
subcarpatică Arefu-Corbeni. Alunecările
produse în anii 1999-2000, Comunicări de
geografie, V, pp. 143-148.
Osaci-Costache G. (2004), Muşcelele dintre
Dâmboviţa şi Olt în documente cartografice.
Reconstituirea şi dinamica peisajului geografic
în secolele XVIII-XX, Editura Universitară,
Bucureşti.
Osaci-Costache G. (2008), La storia del territorio
sulla base delle carte storiche. Studio di caso: i
Subcarpazi ubicati tra i fiumi Argeş e Vâlsan
(Romania), Atti 12a Conferenza Nazionale
ASITA, vol. II, L’Aquila, pp. 1549-1554.
Osaci-Costache G. (2009a), Cartografia storica in
ambiente GIS Open Source (Quantum GIS e
gvSIG) per l’analisi delle dinamiche
dell’utilizzazione dei terreni: il caso della città
di Curtea de Argeş nel Novecento, Analele
Universităţii „Ştefan cel Mare”, Secţiunea
Geografie, XVIII, pp. 233-242.
Osaci-Costache G. (2009b), L’applicazione della
cartografia retrospettiva agli studi territoriali:
vecchi paesaggi rurali nello spazio subcarpatico
ubicato tra i fiumi Topolog e Doamnei
(Romania)/Applying the Retrospective
Cartography in the Territorial Studies: Old
Rural Landscapes in the Subcarpathian Space
Between the Topolog and Doamnei Rivers
(Romania), in Persi P. (ed.), Territori contesi.
Campi del sapere, identità locali, istituzioni,
progettualità paesaggistica. IV Convegno
Internazionale Beni Culturali, Edizione Istituto
Interfacoltà di Geografia, Università degli studi
di Urbino “Carlo Bo”, Pollenza, pp. 107-112.
Osaci-Costache G. (2009c), Ricostituzione sulla base
dei dati cartografici dei paesaggi subcarpatici tra
l’Olt e il Topolog (Romania) nei secoli XVIII-XX,
con speciale riguardo al paesaggio
viticolo/Reconstitution by cartographic data of the
subcarpathian landscapes between the Olt and the
Topolog river (Romania) in the 18th-20th
centuries, with special regard on the viticultural
landscape, Atti del Convegno internazionale ”I
paesaggi del vino. Cartografia e paesaggi”,
Perugia, 8-10 maggio 2008, Bollettino
dell’Associazione Italiana di Cartografia, XLVI,
136-137, pp. 211-222.
Osaci-Costache G. (2010), Vie e luoghi nello spazio
subcarpatico romeno tra i fiumi Dâmboviţa e
Olt: impressioni cartografiche dei secoli
passati/Routes and places in the Romanian
Subcarpathian area between Dâmboviţa and Olt
rivers: cartographic impressions of the past
centuries, in Persi P. (ed.), Territori emotivi –
Geografie emozionali. Genti e luoghi: sensi,
sentimenti ed emozioni/Emotion & Territories –
Emotional Geographies. People and places:
senses, feelings and emotions, V Convegno
Internazionale Beni Culturali, Edizione
Dipartimento di Psicologia e del Territorio,

The analysis of forest dynamics within the Carpathians - the Subcarpathians contact area by using the historical cartography approach and open source GIS software.
Case study: the Limpedea catchment (Romania)
124
Università degli Studi di Urbino “Carlo Bo”,
Fano, pp. 147-153.
Popp M. (1933), Contribuţii la vieaţa pastorală din
Argeş şi Muscel (originea ungurenilor),
Buletinul Societăţii Regale Române de
Geografie, 52, pp. 134-282.
Robinson E. (2004), Coastal changes along the
coast of Vere, Jamaica over the past two
hundred years: data from maps and air
photographs, Quaternary International, 120, pp.
153-161.
Rosselli W., Paulmier É. (2006), Changes in the
quality of the Valais Rhone Plain landscapes
(Switzerland) based on historical map, Revue
Forestière Française, 58 (4), pp. 361-366.
Ţuţuianu O. (2006), Evaluarea şi raportarea
performanţei de mediu. Indicatori de mediu,
Editura AGIR, Bucureşti.
Vallega A. (2008), Indicatori per il paesaggio,
FrancoAngeli, Milano.
http://grass.osgeo.org/
http://qgis.org/
http://www.gvsig.gva.es
http://www.sextantegis.org/