the analysis of 18th century glass trade beadsfrom fort
TRANSCRIPT

Northeast Historical Archaeology
Volume 37 Article 5
2008
The Analysis of 18th Century Glass TradeBeadsfrom Fort Niagara: Insight intoCompositionalVariation and ManufacturingTechniquesAaron Shugar
Ariel O’Connor
Follow this and additional works at: http://orb.binghamton.edu/neha
Part of the Archaeological Anthropology Commons
This Article is brought to you for free and open access by The Open Repository @ Binghamton (The ORB). It has been accepted for inclusion inNortheast Historical Archaeology by an authorized editor of The Open Repository @ Binghamton (The ORB). For more information, please [email protected].
Recommended CitationShugar, Aaron and O’Connor, Ariel (2008) "The Analysis of 18th Century Glass Trade Beadsfrom Fort Niagara: Insight intoCompositionalVariation and Manufacturing Techniques," Northeast Historical Archaeology: Vol. 37 37, Article 5.https://doi.org/10.22191/neha/vol37/iss1/5 Available at: http://orb.binghamton.edu/neha/vol37/iss1/5

58 Glass Trade Beads From Old Fort Niagare/Shugar and O'Connor
Introduction Glass trade beads were commonly used by Europeans to win Native friendship and to trade for various articles. At Fort Niagara in Western New York, glass and wampum trade beads have been found from both 17th and 18th century contexts. Previous investigations have dealt with the historical and archaeolog-ical evidence of the use of wampum at Fort Niagara (Peña 2006). Glass trade beads have been studied thoroughly from various archae-ological sites in the north-east (Hancock et al 1994, 1996, 1999, 2000; Karklins 1983; Sempowski et al 2000). Scott (2009) describes the glass beads excavated at Fort Niagara between 1979 and 1991. This paper presents the findings from the scientific analysis of a group of 416 out of 445 18th century glass trade beads excavated from Fort Niagara in 2007.
History of the Site The history of Fort Niagara spans from Native American pre-contact years through 20th-century military training, and its ideal
location at the entrance to the Great Lakes system was cause for contest during the 17th and 18th centuries. The French established the first post at Fort Niagara in 1679 and erected a more permanent structure in 1726, now known as the “French Castle”. Following a 19-day siege during the French & Indian War, the British gained control of the site in 1759. The British remained at the post through the American Revolution but had to yield the site, by treaty, to the United States in 1796. The fort was recaptured by the British in 1813 but was again ceded to the United States in 1815 after the War of 1812. Following this war the site remained a peaceful border post, expanding after the Civil War and serving as a training station for American soldiers in both World Wars. Fort Niagara’s collections include one of the United States’ paramount compilations of original 18th and 19th century military archi-tecture and artifacts. Architectural collections include six 18th century buildings, one of which is the oldest building in North America between the Appalachian Mountains and the Mississippi River, and extensive areas of 18th and 19th century fortifications.
The Analysis of 18th Century Glass Trade Beadsfrom Fort Niagara: Insight into Compositional Variation and Manufacturing Techniques
Aaron N. Shugar and Ariel O’Connor An assemblage of 445 archaeological glass trade beads excavated from Old Fort Niagara, Youngstown, New York in 2007 were analyzed to determine their manufacturing technology and elemental composition. Analytical techniques included reflected light microscopy, handheld X-ray fluorescence (XRF), and scanning electron microscopy with energy dispersive X-ray spectroscopy (SEM-EDS). Optical microscopy revealed the manufacturing technology of the beads and uncovered discrepancies between the current method of visual identification for bead type and color and the structures and colors revealed through scientific analysis. Elemental analysis revealed a new turquoise blue bead composition.
Un assemblage de 445 billes de traite en verre mises au jour lors de fouilles archéologiques au site de Fort Niagara dans l’état de New York en 2007 ont fait l’objet d’une analyse afin de déterminer la technologie util-isée pour leur fabrication ainsi que les éléments dont elles sont composées. Les techniques analytiques utili-sées comprennent la microscopie à lumière réfléchie, la fluorescence X portative et la microscopie électronique à balayage avec spectrométrie dispersive en énergie à rayons X (SEM/EDX). La microscopie photonique a révélé la technologie utilisée pour la manufacture de ces billes. Elle a aussi permis la découverte d’écarts entre la méthode présentement utilisée pour l’identification visuelle des types de billes et des couleurs, et la struc-ture et couleur des billes telles que révélées par l’analyse scientifique. Enfin, l’analyse des éléments compo-sant les billes a dévoilé une nouvelle composition lors de l’analyse d’une bille de couleur turquoise.

Northeast Historical Archaeology/Vol. 37, 2008 59
Collection of beads The glass trade beads investigated in this study were excavated from a location associated with a mid-18th-century French building known today as Structure 408 but labeled on French-era maps as the “officers’ quarters” and British-era maps as the “Command’rs room”. From the varied archaeological finds associ-ated with this structure, it has been suggested that this was the location for the majority of trade (Peña 2006). Initial dating of the glass beads was established based on related ceramic finds. Tin glazed earthenwares with decoration characteristic of 1760 Liverpool production have been found in addition to several creamware ceramics which post-date 1762. This evidence firmly places the glass beads in the second half of the 18th century and more likely in the third quarter of the 18th century (Peña, pers. com. 2008). Compositional analysis of trade beads has shown distinct variation in chemistry over time (Hancock et al 1994, 1996, 1997). The present analysis and study of these glass trade beads will provide more information con-cerning their elemental composition and man-ufacturing technology, help to refine and/or confirm the current dating, and ultimately may provide insight into the complex trade routes that existed in the Northeast during the 18th century.
Initial Classification Onsite classification of bead type was estab-lished using the Kidd Classification System (Kidd and Kidd 1983, Karklins 1985). Archaeologists have focused their attention of studying glass trade beads on typological clas-sifications, recording manufacturing technique, color, decoration, and shape. The established Kidd classification system (1983) has been extended by some (e.g., Karklins, 1985) and has become the norm for classifying trade beads in eastern North America. Certain bead types have become time markers for dating European contact. This classification technique has been used extensively to allow inter and intra site comparisons of beads and has been found useful in establishing dates for contact period archaeological sites. By comparing the bead’s color, shape, visual layering structure, and method of production with illustrated
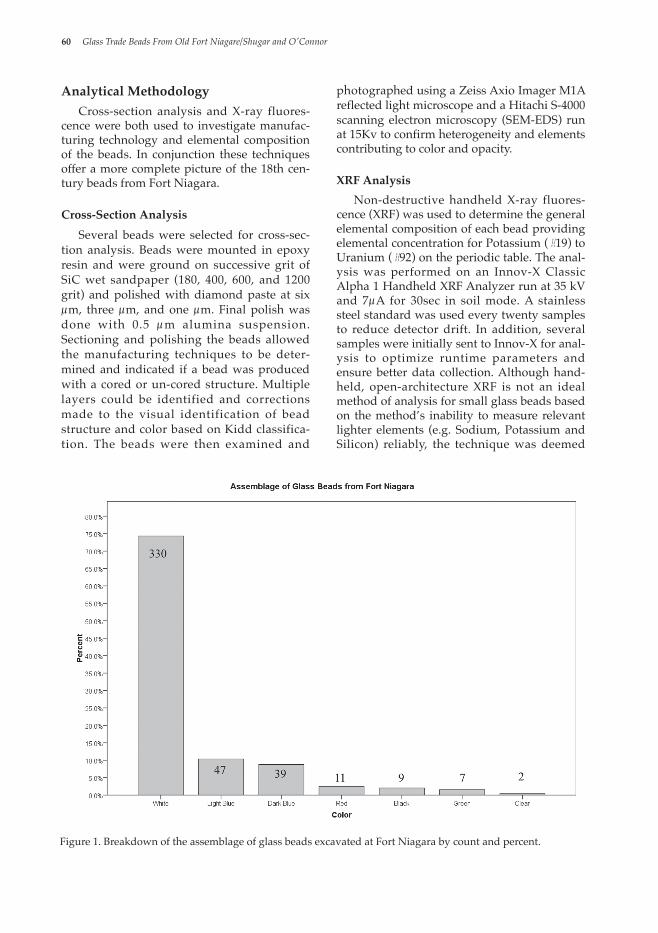
examples, all 445 beads from Fort Niagara were grouped and assigned Kidd numbers. The majority of the beads in this assemblage were un-cored, rounded drawn beads (Kidd type II). There are two wound beads in the col-lection as well as four tubular beads (Kidd type III). The breakdown of colors is as fol-lows; white (330 beads, 74.2%, Kidd type IIa12), turquoise blue (47 beads, 10.6%, Kidd type IIa37), dark blue (39 beads, 8.8%, Kidd type IIa56), red (11 beads, 2.5%, Kidd type IIa2), black (9 beads, 2%, Kidd type IIa7), green (7 beads, 1.6%, Kidd type IIa27), and clear (2 beads, 0.4%, Kidd type IIa19) (fig. 1). Previous investigations of the chemistry of trade beads excavated in the Northeast have focused on the white (Hancock et al 1997, 1999; Sempowski et al 2000), blue (Hancock et al 1994, 1996, 2000) and red (Sempowski et al 2001) beads. With the majority of beads in this collection being either white or blue, this study will focus on these two colors only. Several key papers have established beads as time markers based on distinct changes in elemental composition over time. In some cases these compositions can be associated with specific production centers (Hancock et al 1994, 1996; Kenyon et al 1995a; Moreau, J.F. et al., 2002). These elemental changes in composi-tion are found in the colorants and opacifiers, and, in particular, the alkali metals (sodium and potassium). These alkali metals are essen-tial ingredients in glassmaking, serving as a flux, reducing the temperature at which the silica glass former melts. Based on previous compositional analysis, five separate periods spanning approximately 350 years were established for blue trade beads but these periods have been shown to be sim-ilar for all colors. These periods are; 1. Early French regime (1580-1650), 2. Late French regime (1660-1760), 3. Early British regime 1760-1840), 4. Victorian era (1840-1900), and 5. Early 20th century (1900-1930) (Hancock et al 1994). The white trade beads show similar dis-tinctions with slight variations from the estab-lished dating of the blue beads. Changes in white bead chemistry can be discerned in the alkalis and opacifiers used over time but with some overlap, for example, the elements used to opacify white glass change from tin (1600-1700), to antimony (1650-1890), to arsenic (1800-1949) (Moreau, J.F. et al 2002).
60 Glass Trade Beads From Old Fort Niagare/Shugar and O'Connor
Analytical Methodology Cross-section analysis and X-ray fluores-cence were both used to investigate manufac-turing technology and elemental composition of the beads. In conjunction these techniques offer a more complete picture of the 18th cen-tury beads from Fort Niagara.
Cross-Section Analysis Several beads were selected for cross-sec-tion analysis. Beads were mounted in epoxy resin and were ground on successive grit of SiC wet sandpaper (180, 400, 600, and 1200 grit) and polished with diamond paste at six µm, three µm, and one µm. Final polish was done with 0.5 µm alumina suspension. Sectioning and polishing the beads allowed the manufacturing techniques to be deter-mined and indicated if a bead was produced with a cored or un-cored structure. Multiple layers could be identified and corrections made to the visual identification of bead structure and color based on Kidd classifica-tion. The beads were then examined and
photographed using a Zeiss Axio Imager M1A reflected light microscope and a Hitachi S-4000 scanning electron microscopy (SEM-EDS) run at 15Kv to confirm heterogeneity and elements contributing to color and opacity.
XRF Analysis Non-destructive handheld X-ray fluores-cence (XRF) was used to determine the general elemental composition of each bead providing elemental concentration for Potassium (#19) to Uranium (#92) on the periodic table. The anal-ysis was performed on an Innov-X Classic Alpha 1 Handheld XRF Analyzer run at 35 kV and 7µA for 30sec in soil mode. A stainless steel standard was used every twenty samples to reduce detector drift. In addition, several samples were initially sent to Innov-X for anal-ysis to optimize runtime parameters and ensure better data collection. Although hand-held, open-architecture XRF is not an ideal method of analysis for small glass beads based on the method’s inability to measure relevant lighter elements (e.g. Sodium, Potassium and Silicon) reliably, the technique was deemed
Figure 1. Breakdown of the assemblage of glass beads excavated at Fort Niagara by count and percent.

Northeast Historical Archaeology/Vol. 37, 2008 61
appropriate for investigating the coloring and opacifying agents used in the beads. In addi-tion, without inter-instrument standardization, the collected data may not be directly relatable to published data of comparable beads using more established techniques of analysis (such as INAA or ICP). There is, however, excellent intra-group correlative data that can be com-piled for analysis and the resulting elemental ratios can be compared to alternative tech-niques. Ultimately, additional chemical charac-terization should be performed using more traditional methods of analysis to assess the handheld XRF results.
Results and Discussion
Cross-section analysis Microscopic examination indicates that the beads are slightly weathered with some surface pitting and have a thin corrosion layer.
Examination of the mounted and polished beads clearly indi-cates the potential for significant misclassification and improper Kidd assignments by visual examination alone. This is based on the ability to identify varying manufacturing techniques and multiple layering structures which are only observable through microscopy. The blue (initial classification of IIa56) and white (initial classification of IIa12) beads both revealed that they are cored with an outer colorless band of glass approxi-mately 0.02 mm thick sur-rounding the central colored glass matrix (fig. 2). This was not apparent with visual exami-nation of the whole bead alone. The cross section of the blue bead showed a fairly homoge-neous glass matrix with few small inclusions and seeds. The outer surface displayed a thin layer of corrosion. The cross sec-tion of the white bead showed a heterogeneous glass opacified and colored by calcium anti-monate as determined by
SEM-EDS (fig. 3). The outer band of clear glass had no detectable calcium antimonate crystals, as confirmed by SEM-EDS.
XRF Analysis Although XRF is a proven technique for acquiring elemental data, two influences can have a negative effect on analysis and the reli-ability of the resulting data. XRF is a surface sensitive technique and, as such, is susceptible to changes in surface chemistry. Corrosion of glass constitutes a depletion of alkali metals from the glass structure altering the surface composition of the glass. In addition, the beads all appear to be cored with a thin layer of clear glass surrounding the colored core. Although the XRF does provide data for the entire bead, the thin glass layer will have an influence on the resulting data in correspondence with the glass composition. It should only affect the data related to the alkali metals used in the
Figure 2. Images of the white (top) and blue (bottom) beads prior to being cross sectioned (left) and after (right). The beads are 2.4 - 2.8 mm in diam-eter. Note that the clear glass layer visible on the surface of the bead in the sectioned image on the right is not discernable in the images at left.

62 Glass Trade Beads From Old Fort Niagare/Shugar and O'Connor
glass and not the coloring and opacifying agents that are the subject of this investigation.
Blue Beads Visually, the blue beads from Fort Niagara fall into two major categories; a dark blue and a light turquoise blue. Copper, manganese, and cobalt are metals that can be used to pro-duce varying degrees of blue ranging from turquoise blue and violet blue to dark blue colors in glass (Bamford, 1977). Turquoise blue beads typically have copper as their major col-orant, ranging from between a half a percent to over 5%. Manganese in excess of over 1000 ppm may add some violet coloration to glass. Very small concentrations of cobalt are required to alter the color of glass to a deep blue (as low as 200 ppm). In fact, cobalt is such a powerful colorant that it takes as much as 24 times the amount of copper and 13 times the amount of manganese to obtain comparable intensities in color (Bamford, 1977: 63-66). Elemental composition clearly distinguished between the two blue colored beads found at Old Fort Niagara, with cobalt coloring the dark blue beads and copper coloring the majority of the turquoise blue beads.
Dark Blue Beads The 39 dark blue beads are colored by cobalt with a mean of 516 ppm (tab. 1). They have rela-tively high manganese levels (852 ppm) which may add to the depth of their color. This compo-sition closely matches the one dark blue bead that was ana-lyzed from Ashuapumushuan (Moreau et al 1997) having almost identical levels of manga-nese, cobalt, copper, tin and anti-mony. For all the blue beads, in particular the dark blue beads, there is a strong positive correla-tion between arsenic and cobalt (fig. 4). This relationship has pre-viously been reported by Hancock et al 2000 in which they suggest the correlation is related to the possible co-sourcing of arsenic and cobalt in the mineral
form smaltite. This particular mineral is found in the Harz Mountains of eastern Germany, which are relatively close to Amsterdam and Venice, both known glass trade bead making centers. One variation (from Hancock et al 2000) is an arsenic cobalt atomic ratio of approximately two to one whereas the Fort Niagara data show the exact opposite. This difference may be due to the use of a handheld XRF as opposed to neutron activation analysis as an analytical technique, warranting further investigation.
Turquoise Blue Beads The turquoise blue beads can be catego-rized into two groups based on their chemical composition (tab. 1). Group one is character-ized by low levels of copper (0.98%), and high levels of lead (2.09%). Group two is character-ized by very low copper content (273 ppm), relatively high cobalt content (196 ppm) and manganese content (1175 ppm), and exception-ally high antimony content (1.97%). Previous studies of the chronological changes in the chemistry of turquoise blue beads suggest that the ratios of chlorine to sodium (Cl/Na) and potassium to sodium (K/Na) may be used
Figure 3. Optical micrograph of a white bead showing outer homogeneous glass layer (~ 0.02 mm thick at the left) and an inner heterogeneous glass matrix with multiple calcium antimonate inclusions and air bubbles.

Northeast Historical Archaeology/Vol. 37, 2008 63
Figure 4. Plot of cobalt vs. arsenic showing the positive correlation. The ratio here is approximately 2.5:1 Co:As.
Table 1. Mean composition of white and blue beads.
Mean of White and Blue Beads
Color Mn Co Cu As Sn Sb Pb CaWhite Mean 1301 -31 202 124 -320 22303 1496 66652
N 324 324 324 324 324 324 324 324
Std Deviation 771 113 174 2200 122 5405 2344 14050
WhitePb rich
Mean 163 -669 2106 808 346 210 249750 27973
N 6 6 6 6 6 6 6 6
Std Deviation 86 218 1446 2526 146 171 57651 11444
DarkBlue
Mean 852 516 173 189 -4 610 1486 47618
N 39 39 39 39 39 39 39 39
Std Deviation 843 182 96 63 59 727 1249 13014
LightBlue
Mean 316 -5 9847 -15 38 199 20928 40463
N 33 33 33 33 33 33 33 33
Std Deviation 148 166 3151 271 76 197 74999 8171
LightBlue Sb rich
Mean 1175 196 273 72 -290 19683 1361 62718
N 14 14 14 14 14 14 14 14
Std Deviation 499 107 341 29 73 2196 753 19774

64 Glass Trade Beads From Old Fort Niagare/Shugar and O'Connor
in conjunction with changes in colorants and opacifying agents to attribute beads to various time periods and producers (Hancock et al 1994, 1996). Using the handheld XRF we are unable to collect reliable data for sodium, chlo-rine, and potassium making comparable anal-yses of the alkalis to previously published reports unfeasible. In addition, with the surface corrosion and depletion of alkalis, the data obtained would not be reliable. For that reason, this study relies on the coloring and opacifying agents for attributions. The role of arsenic and antimony as opaci-fiers in glass changed in the 17th and 18th cen-turies, with both becoming more prominent and replacing tin as the most common opaci-fiers for all glass. Previous studies of compa-rable turquoise blue beads have shown that limited levels of antimony (>0.5%) are present in 18th century beads (Kenyon et al 1995b) but most other studies of blue beads (i.e. Hancock et al 1994) show a curious lack, based on his-torical grounds alone, of both arsenic and anti-mony in 18th century samples. Fourteen of the 47 turquoise blue beads have over 16,000 ppm of antimony (between 16,357 to 25,195 ppm) and relatively low copper content but signifi-cant manganese content ranging from 224 ppm to 1.12 wt% (with a mean of 1175 ppm) (fig. 5 and 6). High antimony turquoise blue beads are relatively rare, and only a handful has been found in the Northeast (Hancock, pers. com. 2008; Kenyon et al 1995b). Only 17 beads with high antimony content have been identified from the Early British regime (1760-1840). The sites where these beads were found include Grimsby (1), Ft. Frontenac (1), Petit Macatina (1), Peribonka River (3) and Moose Factory level III (9). Two additional antimony-rich beads, one from Ashuapmushuan and the other from Chicoutimi, have been reported with con-centrations over 10,000 ppm (Hancock et al 1996). There is a recognizable decrease in copper content in the Early British regime with beads from Moose Factory having as low as 0.78% copper but none as low as the antimony rich beads from Fort Niagara. All the other high antimony beads have relatively normal copper levels around 1-2%. The beads from Fort Niagara appear to be colored by manganese instead of copper.
There are several higher manganese blue beads from the Late French regime at Bead Hill, Molson-Huron period I, Chicoutimi, and Ft Frontenac (manganese levels from 1300-1900) but these beads do not have substantial amounts of antimony. The replacement of copper by manganese as a colorant is curious and the origin of these beads should be explored in more detail.
White beads The white beads can be categorized into two groups. The first group (6 beads) has very high levels of lead (24.98%) with low levels of calcium (2.8%). Interestingly, there are fairly high levels of copper in this group (2106 ppm) and traces of antimony (210 ppm) and manga-nese (163 ppm). These beads containing high levels of lead and low tin have no known com-parisons. This may be because the majority of previous analyses were done by INAA which is unable to reliably detect lead. Lead does pro-vide some level of opacity and depth to the glass but has previously not been reported in drawn beads. High lead potash wound beads are found and these may be related to some extent. In any case these six beads should be studied in more detail. The second group comprises 324 of the 330 white beads and has high concentrations of antimony (2.23%) and calcium (6.67%) with no tin or cobalt. Traces of arsenic (124 ppm) and copper (202 ppm) are present. manganese (1301 ppm) and lead (1496 ppm) are also present in more substantial levels. The first group of beads is closely comparable to group 3.1 of the Ashuapmushuan site assemblage (Moreau et al 2002) which were dated based on their chem-istry to the mid to late 18th century. This date fits nicely with the stratigraphically-related ceramic assemblage found at Fort Niagara. In addition, the chemistry of the first group of white beads matches the previously reported data based on two separate factors. First, a shift occurred in the chemistry of the opacifying agent of white beads from using tin to anti-mony to arsenic over time (Sempowski et al 2000). By 1655-70 it appears that the transi-tion of opacifying both cored and un-cored beads of all shapes and sizes with antimony instead of tin was initiated. By the last quarter of the 17th century this process was

Northeast Historical Archaeology/Vol. 37, 2008 65
Figure 5. Antimony vs copper in the turquoise blue beads. The high antimony beads have a mean of only 273 ppm copper.
Figure 6. Antimony vs manganese in turquoise blue beads showing the increased concentration of manganese in association with higher antimony

66 Glass Trade Beads From Old Fort Niagare/Shugar and O'Connor
complete and a l l beads enter ing the Northeast were opacified by antimony. Beads opacified by arsenic were introduced in the late 18th century (Hancock et al 1997; Sempowski et al 2000). Second, there appears to be a shift in manufacturing technique moving away from producing solid (un-cored) colored glass, to cored colored glass beads which were made with an opacified core sur-rounded by clear glass. By the early 18th cen-tury, this transition appears complete. There is some evidence from Seneca sites that the Dutch West India Company was likely a commercial supplier for the antimony rich beads in the late 17th century (Sempowski et al 2000). It is quite probable that the same source of glass beads still existed in the mid-to late 18th century.
Conclusions
Cross-section analysis Cross-section analysis is a valuable tool in determining the manufacturing technology of glass beads. Properly establishing the layered structure will allow for a more accurate place-ment in the Kidd classification system. For most identifications, visual characterization is sufficient to ascertain the accurate colors and design. Unfortunately, even careful examina-tion under a binocular microscope did not reveal the cored outer colorless glass layer found on the blue and white mounted beads in this study, especially when there is a thin layer of corrosion present. The irreversibility of mounting beads makes this method of analysis impractical for all but a few samples and unde-sirable for larger or rarer beads. If possible, perhaps a representative bead for each color found at a site could be further investigated to more accurately identify the bead’s production and corrosion depth. These samples could then guide archaeologists in the field in classifying the remainder of the beads excavated. Interestingly one can overcome some of the adverse effects of the corrosion layer by satu-rating the bead with ethanol. This saturates the corrosion and provides a more accurate color assessment and better classification and is a feasible option for archaeologists wanting to make more accurate assignments in the field.
Elemental Composition Analysis of glass trade beads by handheld XRF has many benefits but also has some draw-backs. The technique itself is well proven and provides a quick, sensitive, non-destructive method for the analysis of glass. With its ease of use and portability, it can be used on site to provide archaeologists with instant results. Ultimately this could help direct excavations and save time. Unfortunately handheld XRF is restricted with respect to the identification of alkali metals which have a proven themselves to be invaluable as chronological markers. This inability to collect reliable alkali data limits attempts to identify sources for the origin of the glass. The colorants and opacifiers alone are not always enough to determine manufac-turing locales. Fortunately, the resulting data does provide comparable ratios of concentra-tions for opacifiers and colorants which can be compared to other studies. The data did prove to have some intriguing results. Cobalt was found to be the colorant for the dark blue beads and a previous correlation between cobalt and arsenic was confirmed. Two compositional groupings were exposed for the turquoise blue beads, the first being a traditional copper-colored blue, the second being a new compositional group containing high antimony and manganese and low copper. An assemblage of 14 beads in this group sug-gested that they may have arrived as one col-lection and Fort Niagara may have been the initial port of entry for these beads to be further distributed. Further elemental analysis of these beads should be performed to investigate their alkali metals for a more detailed comparison to other known glasses of the period. The white beads also fell into two groups. The first was a high antimony opacified glass which closely matches known mid- to late-18th-century white glass beads from the region and may well have been produced in Dutch glassmaking centers. The second is a high lead white glass which has no comparisons in the literature. Accurate descriptions of bead typology are important for comparative purposes between collections and manufacturing sites, and obser-vations made using reflective light micros-copy and XRF have indicated that visual examination is not sufficient to accurately

Northeast Historical Archaeology/Vol. 37, 2008 67
describe certain bead color combinations, especially in the presence of corrosion. The relative dating of the glass trade beads from Fort Niagara to the third quarter of the 18th century based on ceramic finds seems to fit nicely with the elemental chemistry of the beads. The white beads all fall into the center of the production period of high antimony dating from 1650-1890 and before the introduction of arsenic (1800-1949). The blue beads also fall nicely into the Early British regime (1760-1840). Although this period shows variation in alkali metals, it does indicate an increase in the use of antimony as an opacifier as the beads from Fort Niagara demonstrate. The beads studied here clearly do not fall into the Victorian Era (1840-1900), as they do not contain arsenic which was introduced to replace antimony during this phase. The high levels of manganese found in the Fort Niagara beads also ties in nicely with the Early British regime, since later beads have very low levels of manganese, made from rela-tively pure raw materials. This firmly confirms the estimated date of the third quarter of the 18th century as the date of the beads’ arrival in Fort Niagara.
Acknowledgements We would like to thank Elizabeth S. Peña and Susan Maguire for providing the samples and for their enthusiasm and support. We would like to thank Peter J. Bush at the Universi ty of Buffalo South Campus Instrumentation Center for SEM analysis, Jessica Feuer and Innov-X for the use of their handheld XRF analyzer, and Ron Hancock for his thoughts and comments while writing this paper.
ReferencesBamford, C.R. 1977 Colour generation and control in glass.
Elsevier Scientific Publishing Company, Amsterdam.
Dubin, Louis Sherr 1987 The History of Beads: From 30,000 B.C. to the
Present. Harry N. Abrams, Inc., New York.
Hancock, R.G.V., S. Aufreiter, and I. Kenyon 1997 European white glass trade beads as chron-
ological and trade markers. In Mat. Res. Soc. Symp. 462, ed. by Pamela B. Vandiver, James R. Druzik, John F. Merkel, and John Stewart, 181-191. Materials Research Society, Warrendale.
Hancock, R. G. V., S. Aufreiter, I. Kenyon, M. Latta 1999 White Glass Beads from the Auger Site,
Southern Ontario, Canada. Journal of Archaeological Science 26: 907-912.
Hancock, R.G.V., S. Aufreiter, J.-F Moreau, and Ian Kenyon
1996 Chemical Chronology of Turquoise Blue Glass Trade Beads from the Lac-Saint-Jen Region in Québec. In Archaeological chem-istry: organic, inorganic, and biochemical anal-ysis, ed. by Mary Virginia Orna, 23-36. ACS Symposium Series 625, Washington DC.
Hancock, R.G.V., A. Chafe, and Ian Kenyon 1994 Neutron activation analysis of sixteenth
and seventeenth century European blue glass trade beads from the eastern Great Lakes area of North America. Archaeometry 36 (2): 253-266.
Hancock, R.G.V., J. McKechnie, S. Aufreiter, Karlis Karkl ins , Mima Kapches , Martha Sempowski, J.-F. Moreau, and Ian Kenyon
2000 Non-destructive analysis of European cobalt blue glass trade beads. Journal of Radioanalytical and Nuclear Chemistry, 244 (3): 569-573.
Karklins, Karlis 1983 Dutch Trade Beads in North America. In
Proceedings of the 1982 Glass Trade Bead Conference, ed. by C.F. Hayes III, 111-126. . Rochester Museum and Science Center, Research Records 16.
1985 Guide to the Description and Classification of Glass Beads. In Glass Beads, 2nd ed, Studies in Archaeology, Architecture, and History, Parks Canada, Ottawa.
Kenyon, Ian, S. Kenyon, R.G.V. Hancock, S. Aufreiter 1995a Neutron Activation Analysis of Some 19th -
Century Facetted Glass Trade Beads from Ontario, Canada, That Have Chemical Compositions Resembling Bohemian Glass. The Bead Forum 27: 4-9.
1995b Neutron activation analysis of A.D. 1660 - 1930 European copper-coloured blue glass trade beads from Ontario, Canada. Archaeometry 37 (2): 323-337.

68 Glass Trade Beads From Old Fort Niagare/Shugar and O'Connor
Kidd, Kenneth. E. and Martha. A. Kidd 1983 A Classification System for Glass Beads for
the Use of Field Archaeologists. In Proceedings of the 1982 Glass Trade Bead Conference, ed. by C.F. Hayes III. 219-255. Rochester Museum and Science Center, Research Records 16.
Moreau, J.-F. 1994 Des Perles de la ‘Protohistoire’ au
Saguenay-Lac-Saint-Jean? In Recherches Amerindinnes au Quebec. XXIV (1-2): 31-48.
Moreau, J.-F., R. G. V. Hancock, S. Aufreiter and Ian Kenyon
1997 Taphonomical and Chronological Studies of a Concentration of European Glass Trade Beads from Ashuapmushuan Central Quebec (Canada). In Proceeding of the VII Nordic Conference on the Application of Scientific Methods in Archaeology. ed by H. Jungner and M. Lavento,173-181. Helsinki Helsingfors.
2002 Late French (1700-1750) to Early English (1750-1800) Regime White Glass Trade Beads from a Presumed Decorated Bag Found at the Ashuapmushuan Site (Eastern Central Québec), Canada. In Proceedings of the 31st International Symposium on Archaeometry, ed by E. Jerem and K. Biró, 613-619. Archaeopress – Archaeolingua, BAR – Centr. Eur. Ser. 1.
Peña, Elizabeth S. 2006 Wampum Diplomacy: The Historical and
Archaeological Evidence for Wampum at Fort Niagara . Northeas t His tor i ca l Archaeology 35: 15-28.
Scott, Patricia Kay 2009 An Archaeological View of Old Fort
Niagara, Volume IV: Excavated Beads. Ms. on file at Old Fort Niagara State Historic Site library.
Sempowski, Martha L., A.W. Nohe, J.-F. Moreau, Ian Kenyon, Karlis Karklins, S. Aufreiter, and R.G.V. Hancock
2000 On the transition from tin-rich to antimo-ny-rich European white soda-glass trade beads for the Senecas of Northeastern North America. Journal of Radioanalytical and Nuclear Chemistry, 244 (3): 559-566.
Sempowski, Martha L., A.W. Nohe, R.G.V. Hancock, J.-F. Moreau, F. Kwok, S. Aufreiter, Karlis Karklins, J. Baart, C. Garrad and Ian Kenyon
2001 Chemical analysis of 17th-century red glass trade beads from Northeastern North America and Amsterdam. Archaeometry 43 (4): 503-515.
Weyl, W.A. 1959 Coloured glasses, Dawson’s of Pall Mall,
London.
Aaron Shugar's research focuses on the chemical analysis of archaeological metals and glass from around the world. He is an assistant pro-fessor in the Art Conservation Deparment at Buffalo State College.
Aaron N. ShugarArt Conservation DepartmentBuffalo State College1300 Elmwood AvenueRockwell Hall 230Buffalo, NY [email protected]
Ariel O'Connor recently recieved her Masters degree in Art Conservation at Buffalo State College. She is currently the Andew W. Mellon Conservation Fellow at The Sherman Fairchild Center for Objects Conservation at the Metropolitan Museum of Art.
Ariel O'ConnorAndrew W. Mellon Conservation FellowThe Sherman Fairchild Center for Objects ConservationThe Metropolitan Museum of Art1000 Fifth AvenueNew York, NY [email protected]