the agenda
DESCRIPTION
SMM Press Conference 8 th Sept 2014 World Shipbuilding Dr Professor Martin Stopford Managing Director, Clarkson Research. The Agenda. Shipyards surviving better than expected. Wow, it says I’m going to make $ billions. Shipping Market Trends World Economy & Ship Demand - PowerPoint PPT PresentationTRANSCRIPT

CLARKSON RESEARCH SERVICES LTD
SMM Press Conference 8th Sept 2014
World ShipbuildingDr Professor Martin Stopford
Managing Director, Clarkson Research

CLARKSON RESEARCH SERVICES LTD
“This is turning into a long shipping recession. Meanwhile the increase in fuel costs and regulatory standards presents the biggest technical challenge for fifty years”
Shipyards surviving
better than expected
1. Shipping Market Trends2. World Economy & Ship Demand3. Newbuilding Contracts & Future Supply4. Shipyard Capacity & Orderbook5. Regional Shipbuilding Trends6. Energy, Environment & Innovation
CLARKSON RESEARCH SERVICES LTD
Recession now in year 6 and still
searching for light at the end
of the tunnel

CLARKSON RESEARCH SERVICES LTD
0
5
10
15
20
25
30
35
40
45
5019
93
1995
1997
1999
2001
2003
2005
2007
2009
2011
2013
Cla
rkse
a In
dex
$000
/day
(Clarksea Index shows weighted average earnings of tankers, bulkers, containerships & gas.)
2004$39,000/day
2008$50,000/day
2000$24,000/
day
$8,500/day$12,000/day
Chart 1: Shipping Market Earnings 1993-2014
$12,145/day
$27,178/day
Earnings are NOT adjusted for inflation
CLARKSON RESEARCH SERVICES LTD
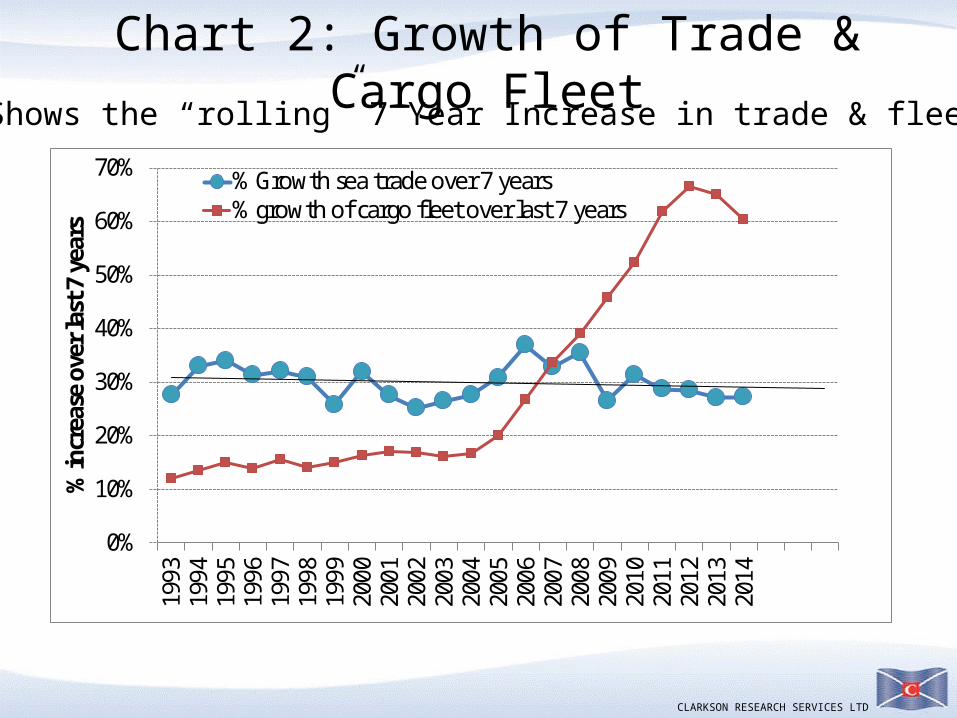
Chart 2: Growth of Trade & Cargo Fleet
0%
10%
20%
30%
40%
50%
60%
70%19
9319
9419
9519
9619
9719
9819
9920
0020
0120
0220
0320
0420
0520
0620
0720
0820
0920
1020
1120
1220
1320
14
% in
crea
se o
ver l
ast 7
yea
rs
% Growth sea trade over 7 years% growth of cargo fleet over last 7 years
Shows the “rolling” 7 Year Increase in trade & fleet
World Fleet grows faster than trade
Sea trade steady at 4%
growthFleet grows slower than trade
CLARKSON RESEARCH SERVICES LTD
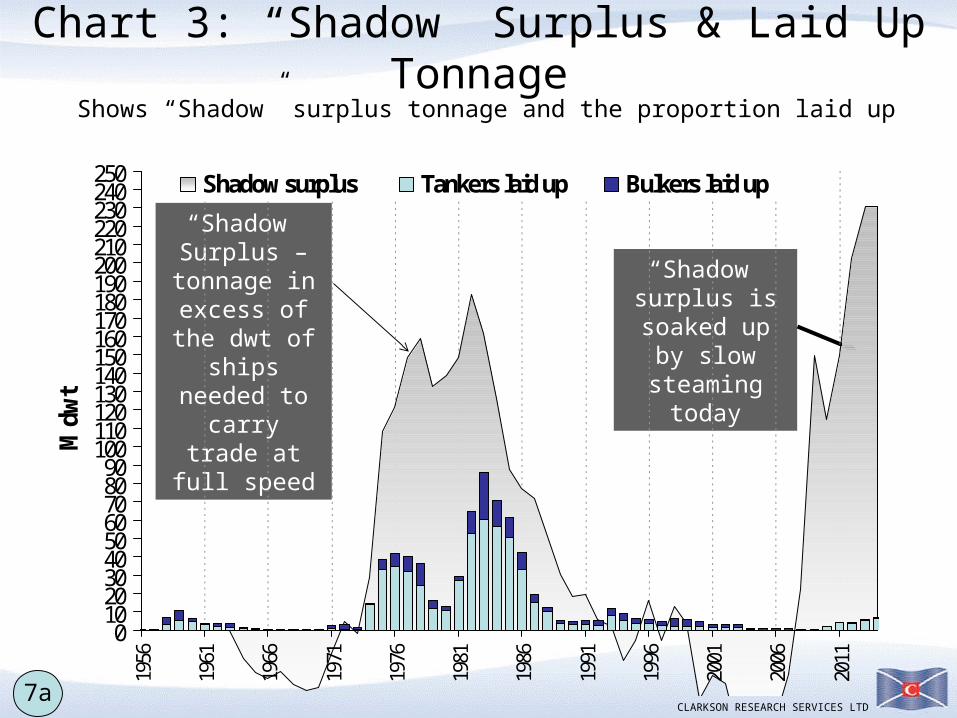
Chart 3: “Shadow” Surplus & Laid Up Tonnage
0102030405060708090
100110120130140150160170180190200210220230240250
1956
1961
1966
1971
1976
1981
1986
1991
1996
2001
2006
2011
M d
wt
Shadow surplus Tankers laid up Bulkers laid up
Shows “Shadow” surplus tonnage and the proportion laid up
“Shadow” surplus is
soaked up by slow steaming
today
“Shadow” Surplus – tonnage in
excess of the dwt of ships needed to
carry trade at full speed
7a
CLARKSON RESEARCH SERVICES LTD
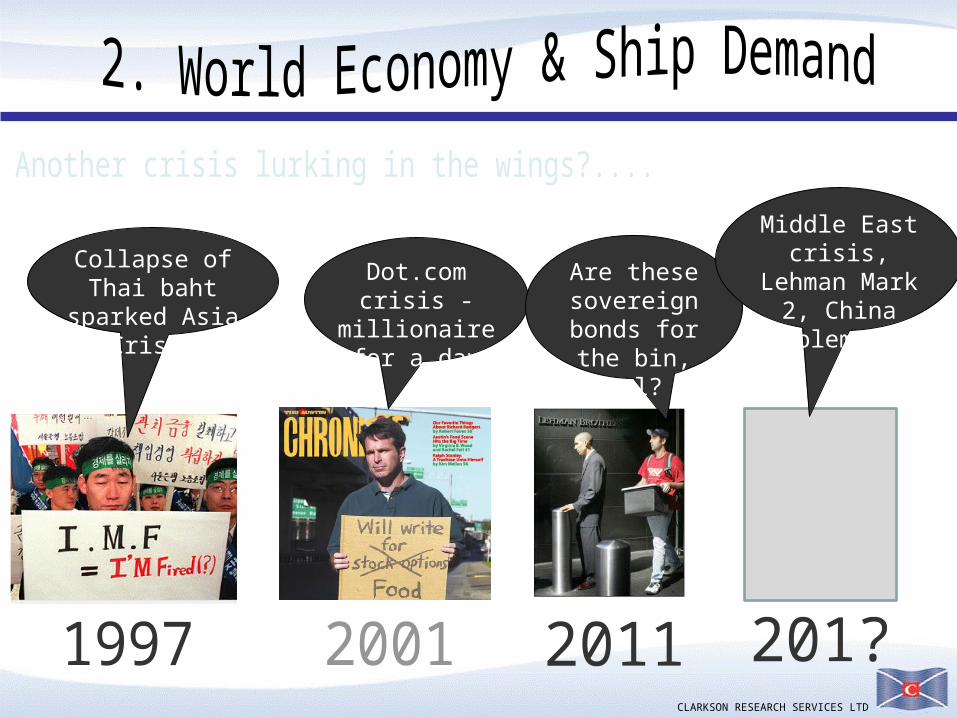
Dot.com crisis - millionaire for
a day
Are these sovereign
bonds for the bin, pal?
Collapse of Thai baht sparked Asia Crisis
Middle East crisis, Lehman Mark 2, China problems???

CLARKSON RESEARCH SERVICES LTD
-10%-8%-6%-4%-2%0%2%4%6%8%
10%12%14%
1966
1968
1970
1972
1974
1976
1978
1980
1982
1984
1986
1988
1990
1992
1994
1996
1998
2000
2002
2004
2006
2008
2010
2012
2014
Chart 4: World GDP & Sea Trade GrowthWorld GDP (red line) and sea trade (blue line)
Crisis 11973
1st Oil Crisis
2001Dot.com
crisis
Crisis 219792nd OilCrisis
1991 Financial
Crisis
1997Asia Crisis
Crisis 62007
Credit Crisis
% change Oil Crisis
Credit Crisis
?
The sea trade
growth trend is 3.8% pa

CLARKSON RESEARCH SERVICES LTD
I LOVE ordering
new ships
I ‘ve really gone off
ordering ships
I should never have ordered those bulkers
Loan
I made millions ordering against
timecharters
One of those nice shipyards arranged some
credit, sir
2

CLARKSON RESEARCH SERVICES LTD
Chart 5: Shipbuilding Orders 1963-2014
020406080
100120140160180200220240
1963
1965
1967
1969
1971
1973
1975
1977
1979
1981
1983
1985
1987
1989
1991
1993
1995
1997
1999
2001
2003
2005
2007
2009
2011
2013
Millio
nDW
T De
liver
ies
Source Maritime Economics 3rd Ed Martin Stopford (Updated August 2012)
OrdersOrders in 2013 for 169.7m dwt was the 3rd highest
ever!
15
CLARKSON RESEARCH SERVICES LTD
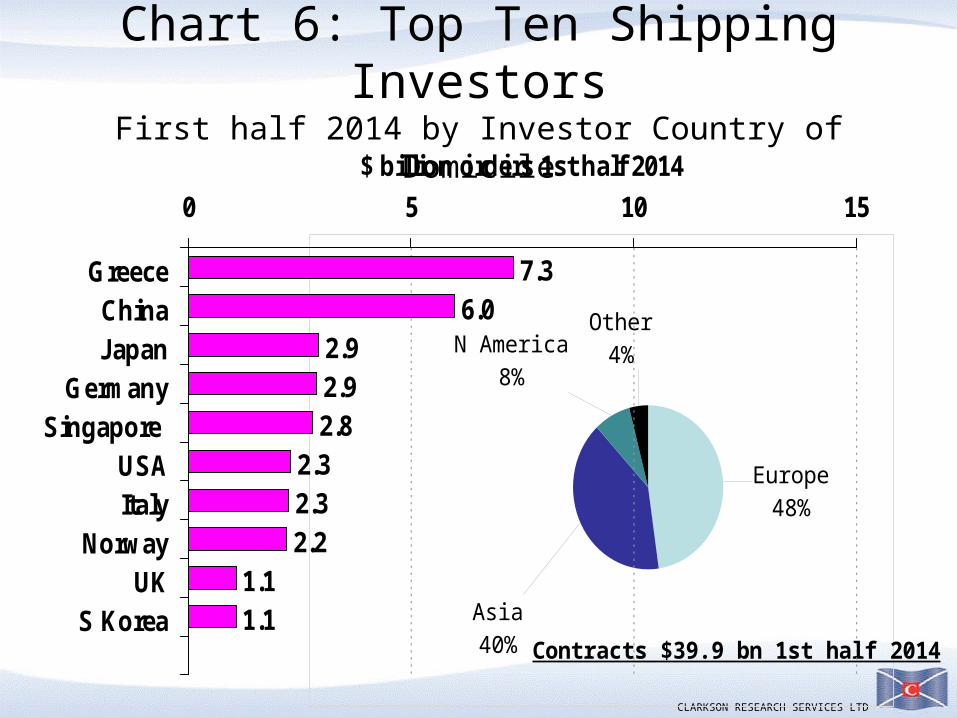
Chart 6: Top Ten Shipping InvestorsFirst half 2014 by Investor Country of Domicile
7.36.0
2.92.92.8
2.32.32.2
1.11.1
0 5 10 15
GreeceChinaJapan
GermanySingapore
USAItaly
NorwayUK
S Korea
$ billion orders 1st half 2014
Europe48%
Asia40%
N America8%
Other4%
Contracts $39.9 bn 1st half 2014

CLARKSON RESEARCH SERVICES LTD
The shipyards are winding down from the biggest boom ever, but
sales still active and volatile . Marine
equipment sales about $70 bn in 2013, up 30%
from $53 bn in 2012Marine equipment market busy with eco-ships

CLARKSON RESEARCH SERVICES LTD
Chart 7: The Shipbuilding Cycle
0
20
40
60
80
100
120
140
160
180
1963
1967
1971
1975
1979
1983
1987
1991
1995
1999
2003
2007
2011
2015
Million DwtShipyards adjust capacity downwards after 2000s boom
Deliveries
Tankers; 21.4; 20%
Bulkers; 62.8; 58%
Containers; 15.9; 15%
Offshore; 2.2; 2% Other; 5.6; 5%
2013 Deliveries m dwt
In 2010 deliveries peaked at 169m dwt
Forecast106 m dwt
in 2015
Demolition

CLARKSON RESEARCH SERVICES LTD
Chart 8: Number of Active Shipyards
677637 618 625
664 696759
808
907983
11231168
10201098
696
918
0100200300400500600700800900
100011001200
1998
1999
2000
2001
2002
2003
2004
2005
2006
2007
2008
2009
2010
2011
2012
2013
2014
Num
ber o
f Yar
ds
Source: Clarkson Research
CLARKSON RESEARCH SERVICES LTD
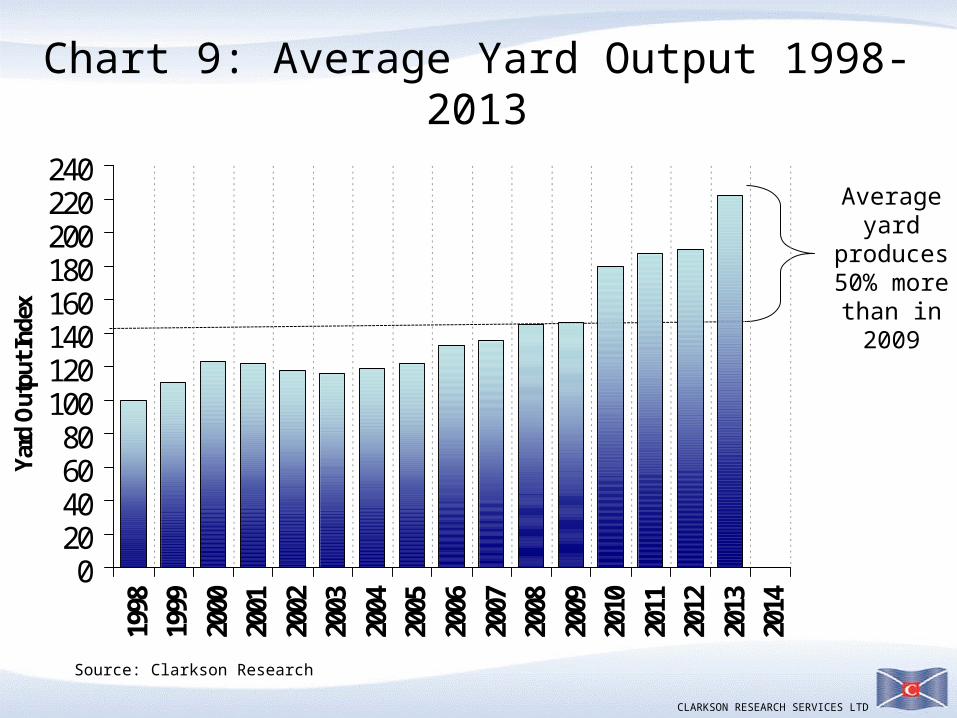
Chart 9: Average Yard Output 1998-2013
020406080
100120140160180200220240
1998
1999
2000
2001
2002
2003
2004
2005
2006
2007
2008
2009
2010
2011
2012
2013
2014
Yard
Out
put I
ndex
Average yard
produces 50% more
than in 2009
Source: Clarkson Research

CLARKSON RESEARCH SERVICES LTD
Chart 10: World Cargo Ship Demolition
0
10
20
30
40
50
60
7019
73
1976
1979
1982
1985
1988
1991
1994
1997
2000
2003
2006
2009
2012
0%
1%
2%
3%
4%
5%
6%
7%
8%
Shows the demolition (bars) on left axis & % fleet demolished on right
Million Dwt % fleet
M Dwt demolished in year (left
axis)
% cargo fleet scrapped
(right axis)

CLARKSON RESEARCH SERVICES LTD
China and S Korea “neck & neck” for top
position

CLARKSON RESEARCH SERVICES LTD
0
10
20
30
40
50
60
70
80
90
10019
0319
0819
1319
1819
2319
2819
3319
3819
4319
4819
5319
5819
6319
6819
7319
7819
8319
8819
9319
9820
0320
0820
13
% to
tal s
hips
laun
ched
Source; Lloyds Register of Shipping, Clarkson Research
FIGURE 15.1 Shipbuilding market shares 1902-2013
Korea
Japan
EuropeBritain
other countries
Scandin-avia
USA China
See: page 616
Chart 11: Regional Shipbuilding Shares 1903-2013
CGT35.9%GT35.4%
CGT33.8%GT35%
CGT18.4%GT20.4%
GT1.7%

CLARKSON RESEARCH SERVICES LTD
www.clarksons.com 19August 2014
Bulker Tanker Containership Gas Offshore Other Total
Builder M.CGT M.CGT M.CGT M.CGT M.CGT M.CGT M.CGT
China P.R. 7.8 1.4 1.8 0.2 0.9 1.1 13.3
S. Korea 1.4 3.5 4.8 1.6 0.7 0.5 12.5
Japan 5.1 0.6 0.3 0.3 0.1 0.6 6.8
Philippines 0.4 0.0 0.1 0.0 0.6
Norway 0.3 0.0 0.4
Vietnam 0.2 0.0 0.1 0.0 0.3
Germany 0.0 0.3 0.3
Taiwan 0.3 0.0 0.3
USA 0.0 0.2 0.2
France 0.2 0.2
Other 0.1 0.3 0.1 0.0 1.0 0.6 2.2
Total 15.1 5.8 7.3 2.1 3.2 3.5 37.0
Chart 12: 2013 Shipyard Output by Country2013 Output by Country and Ship Type

CLARKSON RESEARCH SERVICES LTD
• After 30 years of technical stability shipping faces technical challenge
• The key issues are:_– Bunker price
escalation– Regulations & carbon
footprint
CLARKSON RESEARCH SERVICES LTD
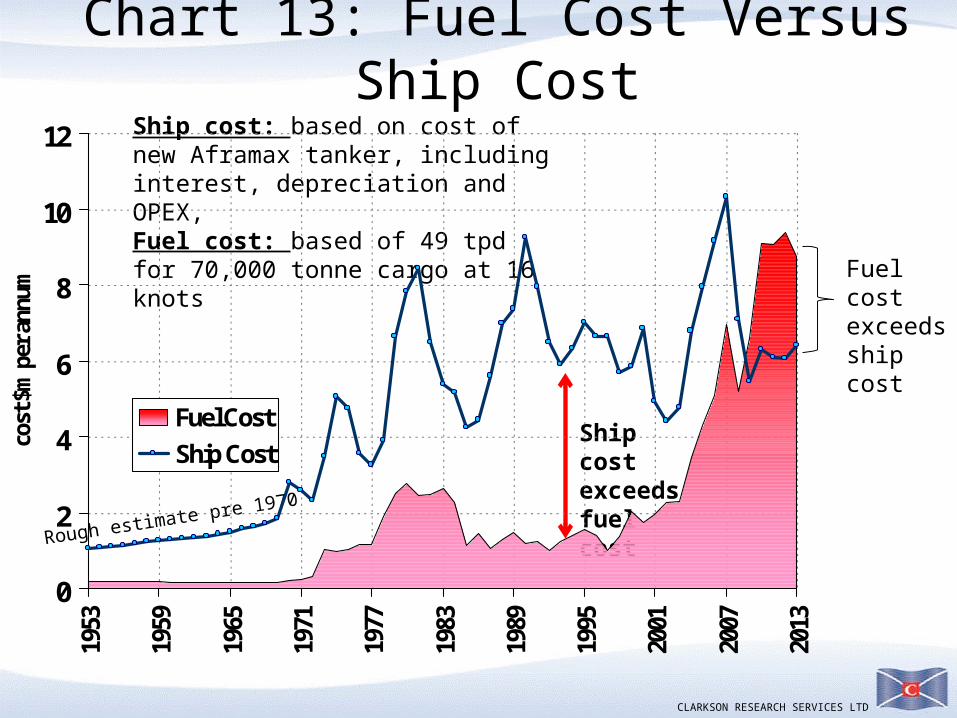
Chart 13: Fuel Cost Versus Ship Cost
0
2
4
6
8
10
12
1953
1959
1965
1971
1977
1983
1989
1995
2001
2007
2013
cost
$m
per
ann
um
Fuel Cost
Ship Cost
Ship cost: based on cost of new Aframax tanker, including interest, depreciation and OPEX, Fuel cost: based of 49 tpd for 70,000 tonne cargo at 16 knots
Rough estimate pre 1970
Fuel cost exceeds ship cost
Ship cost exceeds fuel cost

CLARKSON RESEARCH SERVICES LTD
Chart 14: Fuel Consumption 60,000 dwt Bulkers
0
20
40
60
80
100
120
140
20
25
30
35
40
45
50
55
60
1965
1968
1970
1972
1974
1976
1978
1980
1982
1984
1986
1988
1991
1994
1997
2004
2006
2008
2010
2012
2014
2016
Oil Priceat $2013 pricesPre 2014 vessel service speedOrderbook vessel's service speed
Year of Build
Fuel consumptionTPD at 14.5 knots Oil price in
2013 $s
Bulkers delivered in
2013 no more fuel
efficient than in 1986
New generation ecoships on way
CLARKSON RESEARCH SERVICES LTD
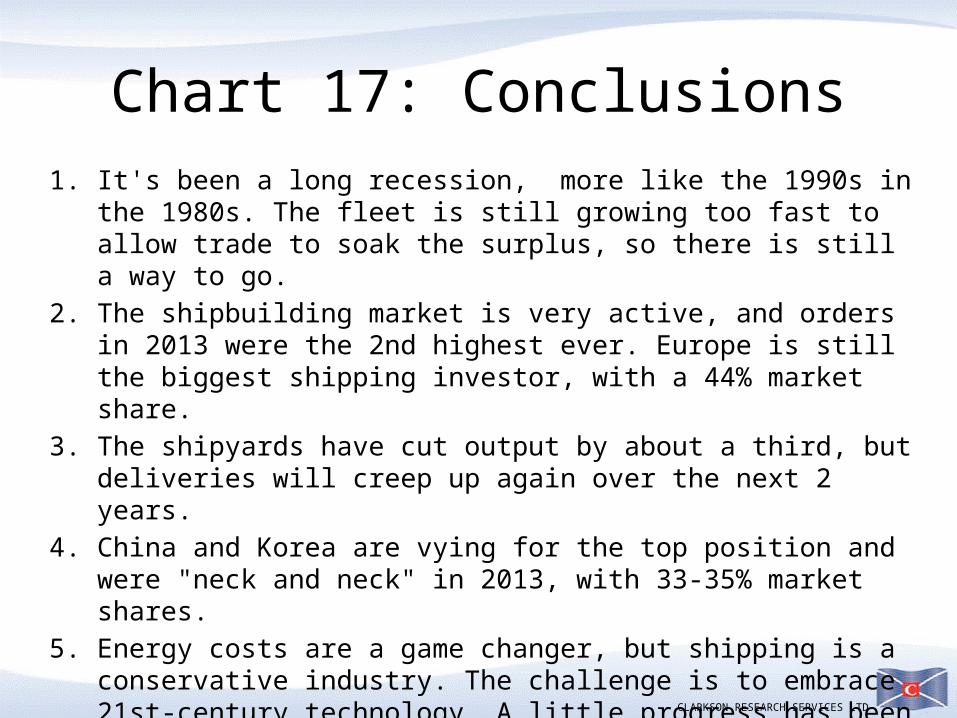
Chart 17: Conclusions1. It's been a long recession, more like the 1990s in the 1980s. The
fleet is still growing too fast to allow trade to soak the surplus, so there is still a way to go.
2. The shipbuilding market is very active, and orders in 2013 were the 2nd highest ever. Europe is still the biggest shipping investor, with a 44% market share.
3. The shipyards have cut output by about a third, but deliveries will creep up again over the next 2 years.
4. China and Korea are vying for the top position and were "neck and neck" in 2013, with 33-35% market shares.
5. Energy costs are a game changer, but shipping is a conservative industry. The challenge is to embrace 21st-century technology. A little progress has been made but there’s still along way to go.
6. •Change is vital and the new technology is on show at SMM. So enjoy the exhibition and see how shipping is facing up to the challenge