the african continental free trade area - tralac
TRANSCRIPT
The African Continental Free Trade Area
A tralac guide
3rd ed.
August 2018
2
Where does the AfCFTA fit in Africa’s development agenda? The Agreement establishing the African Continental Free Trade Area (AfCFTA)
was signed at the 10th Extraordinary Summit of the AU Assembly on 21 March
2018 in Kigali, Rwanda.
The AfCFTA is the continent’s most ambitious integration initiative. The main
objectives of the AfCFTA are:
• create a single continental market for goods and services, with free
movement of business persons and investments
• expand intra-Africa trade across the regional economic communities
and the continent in general
• enhance competitiveness and support economic transformation
Eight RECs have been officially recognised as building blocs of the AfCFTA:
ECCAS, ECOWAS, EAC, SADC, COMESA, AMU, CEN-SAD and IGAD.
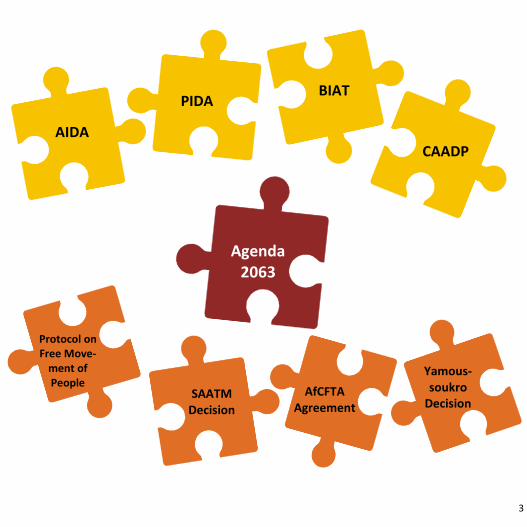
Agenda 2063 is Africa’s framework for structural transformation. It builds on,
and aims to facilitate the implementation of existing continental initiatives
(AIDA, PIDA, BIAT and CAADP). The establishment of AfCFTA, single African air
transport market (SAATM) and free movement of people are Agenda 2063
flagships. The AU has adopted legal instruments for effective implementation
of these flagship projects. Importantly, the UN Agenda 2030’s 17 SDGs are in
the 20 goals of Agenda 2063. By implementing Agenda 2063, Africa will also
meet its global commitments under the SDGs.
3
Agenda 2063
PIDA
AIDA
BIAT
CAADP
SAATM Decision
Protocol on Free Move-
ment of People
AfCFTA Agreement
Yamous-soukro
Decision
4
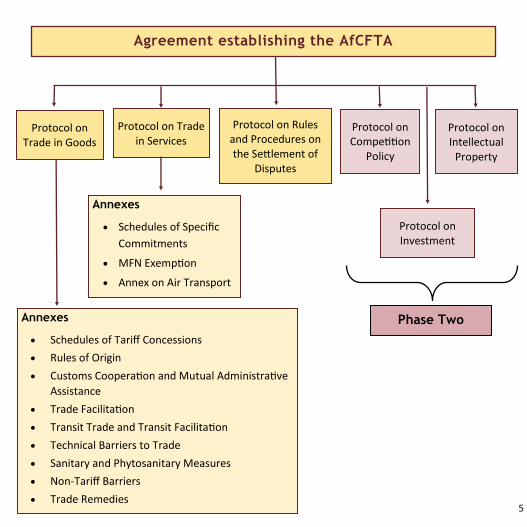
The AfCFTA Agreement is a framework agreement, covering Trade in Goods
and Services, Investment, Intellectual Property Rights and Competition Policy.
The Protocols on Trade in Goods, Trade in Services, Investment, Intellectual
Property Rights, and Competition Policy, as well as Dispute Settlement, form
an integral part of the Agreement. The Protocols on Trade in Goods and Trade
in Services, each have a number of Annexes covering substantive disciplines.
Trade in Goods and Trade in Services are being negotiated in Phase 1; with
negotiations on a number of issues (e.g. tariff concessions, rules of origin for
goods and schedules of specific commitments for services) still ongoing.
Phase 2 of the negotiations will cover Investment, Competition and Intellect-
ual Property.
The legally-scrubbed documents (signed on 16 May 2018) are available to
download on the tralac website:
Agreement establishing the African Continental Free Trade Area
Compiled Annexes to the AfCFTA Agreement
Additional legal texts, resources and publications are available on the AfCFTA
Resources page.
Architecture of the AfCFTA
5
Protocol on Intellectual
Property
Agreement establishing the AfCFTA
Protocol on Rules and Procedures on the Settlement of
Disputes
Protocol on Trade in Services
Protocol on Trade in Goods
Protocol on Investment
Protocol on Competition
Policy
Annexes
• Schedules of Specific
Commitments
• MFN Exemption
• Annex on Air Transport
Annexes
• Schedules of Tariff Concessions
• Rules of Origin
• Customs Cooperation and Mutual Administrative
Assistance
• Trade Facilitation
• Transit Trade and Transit Facilitation
• Technical Barriers to Trade
• Sanitary and Phytosanitary Measures
• Non-Tariff Barriers
• Trade Remedies
Phase Two
6
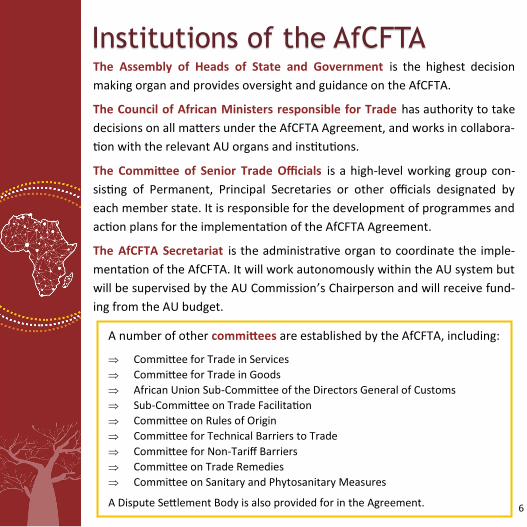
The Assembly of Heads of State and Government is the highest decision
making organ and provides oversight and guidance on the AfCFTA.
The Council of African Ministers responsible for Trade has authority to take
decisions on all matters under the AfCFTA Agreement, and works in collabora-
tion with the relevant AU organs and institutions.
The Committee of Senior Trade Officials is a high-level working group con-
sisting of Permanent, Principal Secretaries or other officials designated by
each member state. It is responsible for the development of programmes and
action plans for the implementation of the AfCFTA Agreement.
The AfCFTA Secretariat is the administrative organ to coordinate the imple-
mentation of the AfCFTA. It will work autonomously within the AU system but
will be supervised by the AU Commission’s Chairperson and will receive fund-
ing from the AU budget.
A number of other committees are established by the AfCFTA, including:
Committee for Trade in Services
Committee for Trade in Goods
African Union Sub-Committee of the Directors General of Customs
Sub-Committee on Trade Facilitation
Committee on Rules of Origin
Committee for Technical Barriers to Trade
Committee for Non-Tariff Barriers
Committee on Trade Remedies
Committee on Sanitary and Phytosanitary Measures
A Dispute Settlement Body is also provided for in the Agreement.
Institutions of the AfCFTA
7
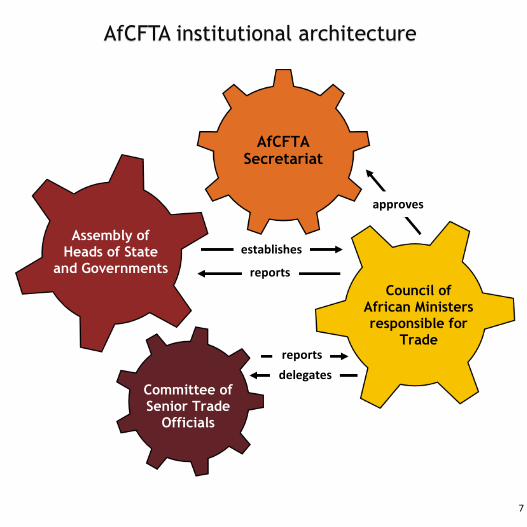
AfCFTA Secretariat
Council of African Ministers responsible for
Trade
Committee of Senior Trade
Officials
Assembly of Heads of State
and Governments
approves
delegates
reports
reports
establishes
AfCFTA institutional architecture

8
The AfCFTA will bring together 55 African countries with a combined
population of more than 1.2 billion people, including a growing middle class,
and a combined gross domestic product of more than US$3.4 trillion in 2016.
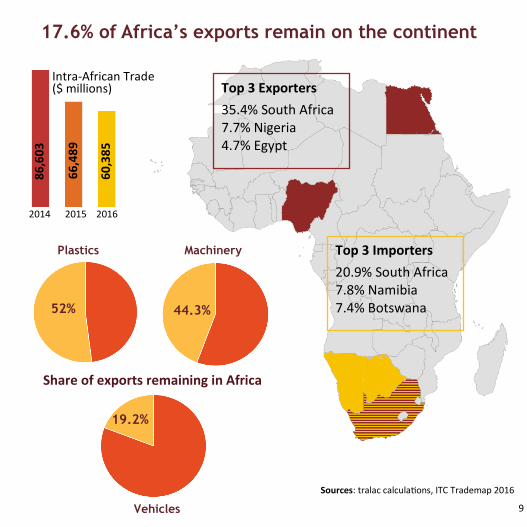
Intra-African trade remains low by comparison with other regions such as
Europe and Asia. In 2016, intra-African exports accounted for 17.6% of Afri-
ca’s total exports.
The total value of intra-African trade – based on total exports – decreased
from $86.6 billion in 2014 to $60.4 in 2016.
South Africa is the largest exporter by far followed by Nigeria and Egypt. SADC
members dominate imports.
Precious metals #2
Machinery #3
Mineral fuels #1
Most traded goods in Africa at HS2 level
Intra-African trade at a glance
9
Intra-African Trade ($ millions)
2014 2015 2016
86
,60
3
66
,48
9
60
,38
5
17.6% of Africa’s exports remain on the continent
Top 3 Exporters
35.4% South Africa 7.7% Nigeria 4.7% Egypt
Top 3 Importers
20.9% South Africa 7.8% Namibia 7.4% Botswana
Share of exports remaining in Africa
Plastics Machinery
Vehicles
44.3% 52%
19.2%
Sources: tralac calculations, ITC Trademap 2016

10
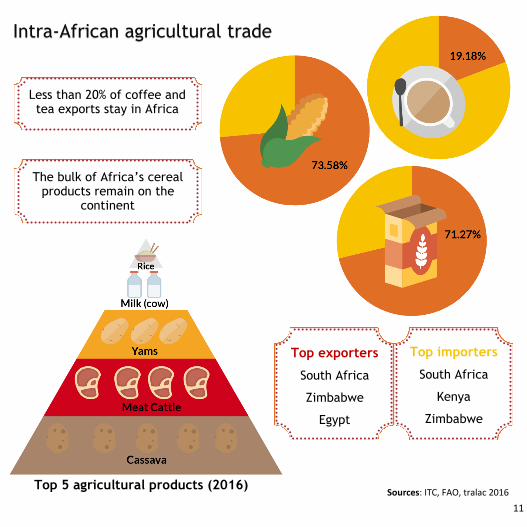
In 2016, intra-African agricultural trade was valued at $12,477 million repre-
senting some 20.7 % of total intra-African exports and 22.7 % of intra-African
imports.
South Africa dominates both exports and imports; with its exports slightly
more than double its imports from Africa.
Zimbabwe is the second main exporter and third main importer.
Africa’s most significant agricultural export by value is coffee, followed by tea.
Cereal is Africa’s most important agricultural import.
Tobacco dominates intra-African exports, followed by sugars, fats and oils.
Around half of these exports remain on the continent.
Agricultural trade
11
Top 5 agricultural products (2016) Sources: ITC, FAO, tralac 2016
Less than 20% of coffee and tea exports stay in Africa
The bulk of Africa’s cereal products remain on the
continent
Top exporters
South Africa
Zimbabwe
Egypt
Top importers
South Africa
Kenya
Zimbabwe
Intra-African agricultural trade
12
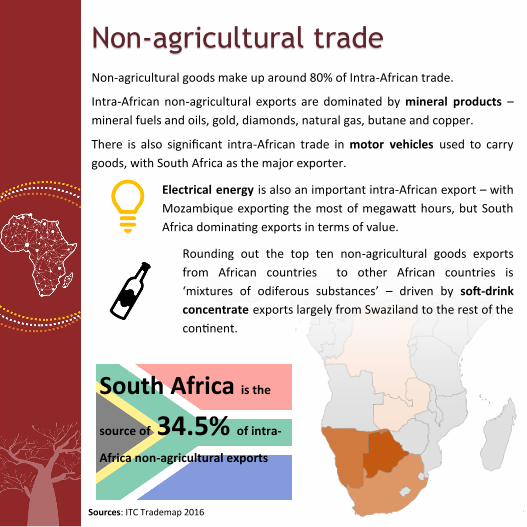
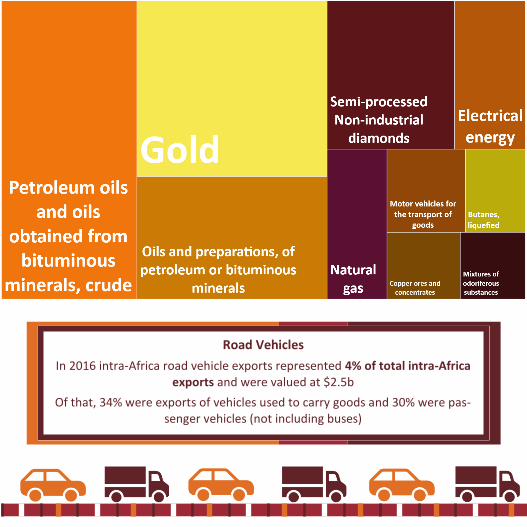
Non-agricultural goods make up around 80% of Intra-African trade.
Intra-African non-agricultural exports are dominated by mineral products –
mineral fuels and oils, gold, diamonds, natural gas, butane and copper.
There is also significant intra-African trade in motor vehicles used to carry
goods, with South Africa as the major exporter.
Electrical energy is also an important intra-African export – with
Mozambique exporting the most of megawatt hours, but South
Africa dominating exports in terms of value.
Rounding out the top ten non-agricultural goods exports
from African countries to other African countries is
‘mixtures of odiferous substances’ – driven by soft-drink
concentrate exports largely from Swaziland to the rest of the
continent.
South Africa is the
source of 34.5% of intra-
Africa non-agricultural exports
Sources: ITC Trademap 2016
Non-agricultural trade
13
Road Vehicles
In 2016 intra-Africa road vehicle exports represented 4% of total intra-Africa exports and were valued at $2.5b
Of that, 34% were exports of vehicles used to carry goods and 30% were pas-senger vehicles (not including buses)
14
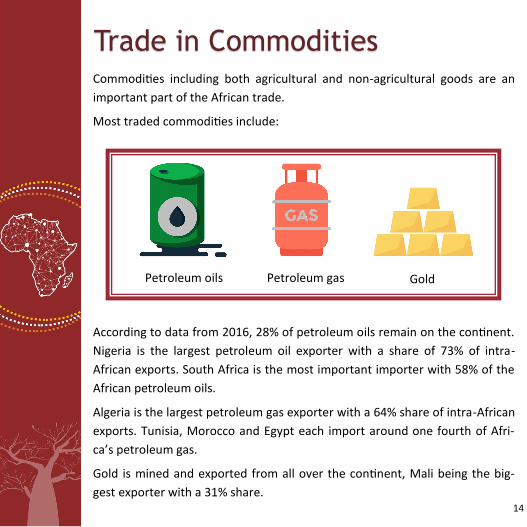
Commodities including both agricultural and non-agricultural goods are an
important part of the African trade.
Most traded commodities include:
According to data from 2016, 28% of petroleum oils remain on the continent.
Nigeria is the largest petroleum oil exporter with a share of 73% of intra-
African exports. South Africa is the most important importer with 58% of the
African petroleum oils.
Algeria is the largest petroleum gas exporter with a 64% share of intra-African
exports. Tunisia, Morocco and Egypt each import around one fourth of Afri-
ca’s petroleum gas.
Gold is mined and exported from all over the continent, Mali being the big-
gest exporter with a 31% share.
Petroleum oils Gold Petroleum gas
Trade in Commodities

15
Top exporters
Top importers
Petroleum oils
• Nigeria; largest exporter
(73% of intra-African ex-
ports)
• South Africa; biggest
importer (58% of African
petroleum oils)
Petroleum gas
• Algeria; largest exporter
(64% of intra-African
exports)
• Tunisia, Morocco and
Egypt import around 1/4
of Africa’s petroleum gas
Gold
• Mali; biggest exporter
(31% of intra-African
exports)
Sources: ITC Trademap 2016
16
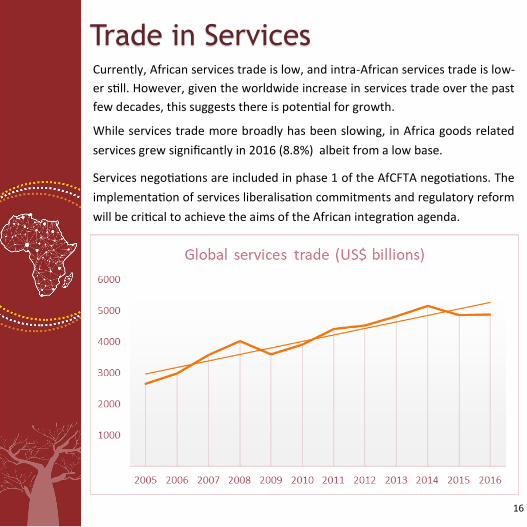
Currently, African services trade is low, and intra-African services trade is low-
er still. However, given the worldwide increase in services trade over the past
few decades, this suggests there is potential for growth.
While services trade more broadly has been slowing, in Africa goods related
services grew significantly in 2016 (8.8%) albeit from a low base.
Services negotiations are included in phase 1 of the AfCFTA negotiations. The
implementation of services liberalisation commitments and regulatory reform
will be critical to achieve the aims of the African integration agenda.
Trade in Services
17
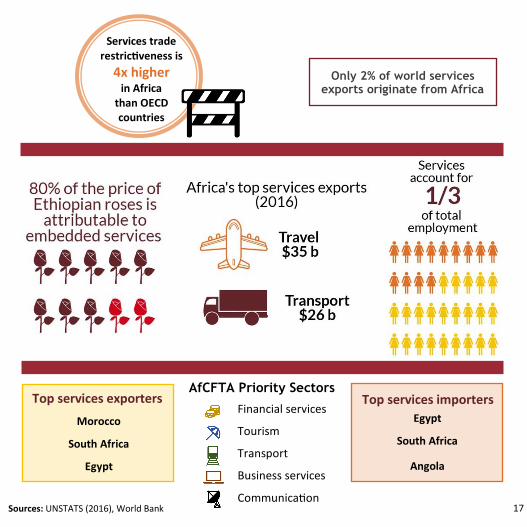
Only 2% of world services exports originate from Africa
Morocco
South Africa
Egypt
Top services exporters Top services importers
Egypt
South Africa
Angola
Sources: UNSTATS (2016), World Bank
Services trade restrictiveness is
4x higher
in Africa than OECD countries
Financial services
Tourism
Transport
Business services
Communication
AfCFTA Priority Sectors
18
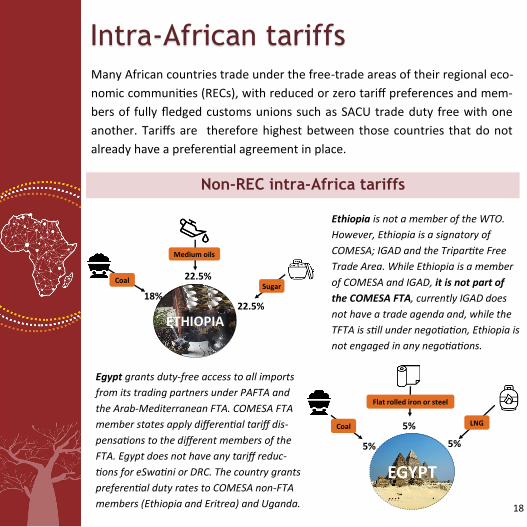
Many African countries trade under the free-trade areas of their regional eco-
nomic communities (RECs), with reduced or zero tariff preferences and mem-
bers of fully fledged customs unions such as SACU trade duty free with one
another. Tariffs are therefore highest between those countries that do not
already have a preferential agreement in place.
EGYPT
5%
Coal
5%
LNG 5%
Flat rolled iron or steel
ETHIOPIA
Sugar
22.5% 18%
22.5%
Medium oils
Coal
Egypt grants duty-free access to all imports
from its trading partners under PAFTA and
the Arab-Mediterranean FTA. COMESA FTA
member states apply differential tariff dis-
pensations to the different members of the
FTA. Egypt does not have any tariff reduc-
tions for eSwatini or DRC. The country grants
preferential duty rates to COMESA non-FTA
members (Ethiopia and Eritrea) and Uganda.
Non-REC intra-Africa tariffs
Ethiopia is not a member of the WTO.
However, Ethiopia is a signatory of
COMESA; IGAD and the Tripartite Free
Trade Area. While Ethiopia is a member
of COMESA and IGAD, it is not part of
the COMESA FTA, currently IGAD does
not have a trade agenda and, while the
TFTA is still under negotiation, Ethiopia is
not engaged in any negotiations.
Intra-African tariffs
19
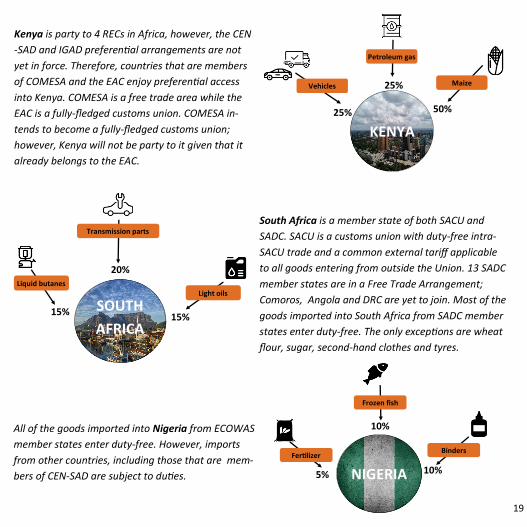
SOUTH
AFRICA
Light oils
Transmission parts
Liquid butanes
15%
20%
15%
KENYA
25%
Vehicles
Petroleum gas
Maize
50%
25%
NIGERIA
Frozen fish
Fertilizer Binders
5% 10%
10% All of the goods imported into Nigeria from ECOWAS
member states enter duty-free. However, imports
from other countries, including those that are mem-
bers of CEN-SAD are subject to duties.
South Africa is a member state of both SACU and
SADC. SACU is a customs union with duty-free intra-
SACU trade and a common external tariff applicable
to all goods entering from outside the Union. 13 SADC
member states are in a Free Trade Arrangement;
Comoros, Angola and DRC are yet to join. Most of the
goods imported into South Africa from SADC member
states enter duty-free. The only exceptions are wheat
flour, sugar, second-hand clothes and tyres.
Kenya is party to 4 RECs in Africa, however, the CEN
-SAD and IGAD preferential arrangements are not
yet in force. Therefore, countries that are members
of COMESA and the EAC enjoy preferential access
into Kenya. COMESA is a free trade area while the
EAC is a fully-fledged customs union. COMESA in-
tends to become a fully-fledged customs union;
however, Kenya will not be party to it given that it
already belongs to the EAC.

20
MFN tariffs for key Cement, salt,
earths & stones etc
Mineral fuels & oils
Inorganic chemicals, rare
earths etc Fertilizers
HS25 HS27 HS28 HS31
Angola 50 20 20 2
Botswana 10 20 20 0
Cabo Verde 10 20 0 0
Cameroon 20 20 20 5
CAR 20 10 20 10
Chad 20 20 20 5
DRC 20 10 5 5
Djibouti 26 26 26 2
eSwatini 10 20 20 0
Gabon 20 20 20 5
The Gambia 20 10 20 5
Ghana 20 10 10 0
Guinea 20 20 10 0
Guinea-Bissau 20 10 20 5
Lesotho 10 20 20 0
Liberia 25 15 25 2.5
Madagascar 10 20 5 0
Mauritania 20 20 13 5
Mozambique 20 7.5 2.5 2.5
Namibia 10 20 20 0
Nigeria 20 10 20 5
Rwanda 25 25 25 0
Sierra Leone 30 20 5 5
Tunisia 20 20 20 0
Zambia 25 25 0 0
Zimbabwe 20 45 10 25
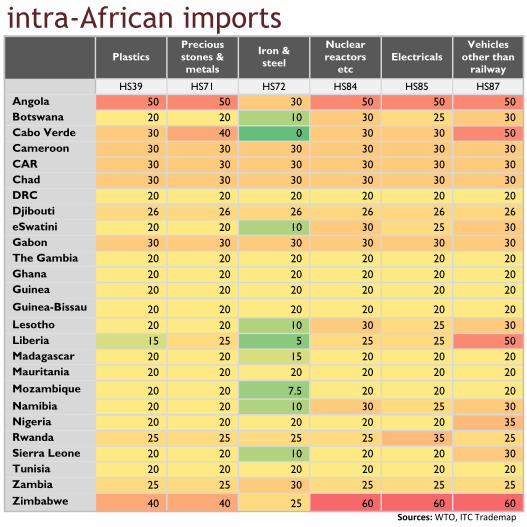
21
intra-African imports
Plastics Precious
stones & metals
Iron & steel
Nuclear
reactors etc
Electricals Vehicles
other than railway
HS39 HS71 HS72 HS84 HS85 HS87
Angola 50 50 30 50 50 50
Botswana 20 20 10 30 25 30
Cabo Verde 30 40 0 30 30 50
Cameroon 30 30 30 30 30 30
CAR 30 30 30 30 30 30
Chad 30 30 30 30 30 30
DRC 20 20 20 20 20 20
Djibouti 26 26 26 26 26 26
eSwatini 20 20 10 30 25 30
Gabon 30 30 30 30 30 30
The Gambia 20 20 20 20 20 20
Ghana 20 20 20 20 20 20
Guinea 20 20 20 20 20 20
Guinea-Bissau 20 20 20 20 20 20
Lesotho 20 20 10 30 25 30
Liberia 15 25 5 25 25 50
Madagascar 20 20 15 20 20 20
Mauritania 20 20 20 20 20 20
Mozambique 20 20 7.5 20 20 20
Namibia 20 20 10 30 25 30
Nigeria 20 20 20 20 20 35
Rwanda 25 25 25 25 35 25
Sierra Leone 20 20 10 20 20 30
Tunisia 20 20 20 20 20 20
Zambia 25 25 30 25 25 25
Zimbabwe 40 40 25 60 60 60 Sources: WTO, ITC Trademap

22
Infrastructure Reliable infrastructure is key for the private sector to trade successfully.
Improvements in this field have been identified as crucial to boost intra-
African trade. It is addressed on both the continental and regional levels.
The Logistics Performance Index (LPI) – developed by the World Bank – is
based on a questionnaire sent to professionals in the logistics sector. It ranks
the countries in the areas of customs, international shipments, quality and
competence, tracking and tracing, timeliness and infrastructure.
In the global ranking Rwanda climbed from the third last position (#148) to
position #62 within 9 years.
Dwell time in Mombasa port decreased from 13 days in 2006 to 2-3 days in 2016
Border clearance time at Malaba between Kenya and Uganda fell from 24 hours (December 2012) to 6 hours (January 2013)
Time to move cargo from Mombasa to Kampala dropped from 18 days to 3 days and costs decreased by 50% be-tween 2013 and 2014.
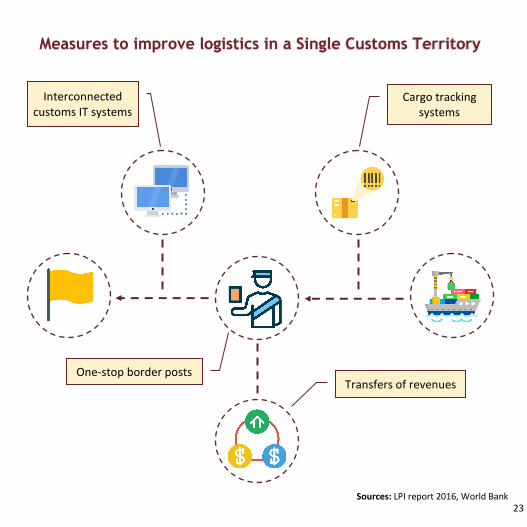
23
Cargo tracking systems
Interconnected customs IT systems
One-stop border posts Transfers of revenues
Sources: LPI report 2016, World Bank
Measures to improve logistics in a Single Customs Territory

24
About tralac
www.tralac.org | [email protected] | @tradelawcentre
Copyright © tralac, 2018
Readers are encouraged to quote and reproduce this material for educa-tional, non-profit purposes, provided the source is acknowledged.
Trade Law Centre (tralac) is a public benefit organisation based in the Western Cape re-
gion of South Africa. We develop technical expertise and capacity in trade governance
across Africa.
We are committed to the principles of rules-based governance at the national, regional
and international levels. We believe that better governance and strong institutions are
essential elements for inclusive and sustainable growth.
tralac’s activities are anchored on three pillars:
i) inform stakeholders through quality, accessible analysis and information
provision;
ii) capacitate individuals and institutions through partnerships that focus on
capacity in institutions; and
iii) empower, especially marginalised stakeholders to participate more effec-
tively in trade policy and governance debates and processes.