the affordable care act and entrepreneurship lock: an
TRANSCRIPT
Undergraduate Economic Review Undergraduate Economic Review
Volume 17 Issue 1 Article 5
2020
The Affordable Care Act and Entrepreneurship Lock: An Updated The Affordable Care Act and Entrepreneurship Lock: An Updated
Examination of Employer-Based Healthcare’s Effect on Self-Examination of Employer-Based Healthcare’s Effect on Self-
employment by Demographic Group employment by Demographic Group
Sean Ruddy George Washington University, [email protected]
Follow this and additional works at: https://digitalcommons.iwu.edu/uer
Part of the Economic Policy Commons, Health Economics Commons, Health Policy Commons, and the Social Welfare Commons
Recommended Citation Ruddy, Sean (2020) "The Affordable Care Act and Entrepreneurship Lock: An Updated Examination of Employer-Based Healthcare’s Effect on Self-employment by Demographic Group," Undergraduate Economic Review: Vol. 17 : Iss. 1 , Article 5. Available at: https://digitalcommons.iwu.edu/uer/vol17/iss1/5
This Article is protected by copyright and/or related rights. It has been brought to you by Digital Commons @ IWU with permission from the rights-holder(s). You are free to use this material in any way that is permitted by the copyright and related rights legislation that applies to your use. For other uses you need to obtain permission from the rights-holder(s) directly, unless additional rights are indicated by a Creative Commons license in the record and/ or on the work itself. This material has been accepted for inclusion by faculty at Illinois Wesleyan University. For more information, please contact [email protected]. ©Copyright is owned by the author of this document.

The Affordable Care Act and Entrepreneurship Lock: An Updated Examination of The Affordable Care Act and Entrepreneurship Lock: An Updated Examination of Employer-Based Healthcare’s Effect on Self-employment by Demographic Group Employer-Based Healthcare’s Effect on Self-employment by Demographic Group
Abstract Abstract This paper capitalizes on a natural experiment created by differences in Medicaid expansion under The Patient Protection and Affordable Care Act (ACA). A difference and difference model comparing states that did and did not expand Medicaid is conducted to investigate if providing an alternative and low-cost source of health insurance affects self-employment rates overall and across different demographic groups. The results suggest that living in a state that expanded Medicaid was associated with a 1.4 percent increase in the likelihood that an individual will be self-employed and that this effect is heterogeneous across different demographics, being largest among African Americans.
Keywords Keywords Affordable Care Act, ACA, Entrepreneurship Lock, Health Policy, Job Lock, small business, small business formulation, business formulation
This article is available in Undergraduate Economic Review: https://digitalcommons.iwu.edu/uer/vol17/iss1/5

Introduction
Newly formed businesses are the engine of the American economy. Firms less than a year old
are wholly responsible for yearly net job growth in the United States and without firm creation,
net employment would likely fall by about 1 percent a year (Kane 2010; Haltiwanger, et al.
2008). Firms that survive past their first year experience a higher average growth rate of 16
percent and make disproportionately large contributions to output and productivity growth
(Haltiwanger, et al. 2008; Haltiwanger, et al. 2016). In fact, new businesses are so critical to
economic growth that some economist have argued that “to the extent that policy interventions
aimed at small businesses ignore the important role of firm age, we should not expect much of an
impact on the pace of job creation.” (Haltiwanger, et al. 2013 pg 360)
Despite the important economic impact newly formed firms have on output, the rate of
business formulation has been declining since the mid-2000s. As shown in Graph 1, this decline
began before the Great Recession and has not improved in the years thereafter, suggesting that
the decline is not solely due to fluctuations in the business cycles. To spur additional economic
growth and reverse this trend, existing barriers to entrepreneurship and self-employment should
be removed.
Graph 1. Business Formations within 4 Quarters (BF4Q) - Actual and Projected,
Seasonally Adjusted
Note: Business formulation within 4 quarters (BF4Q) is a forward-looking measure of business applications that
turned into businesses with payroll within four quarters of their application. The above graph shows actual BF4Q
through Q4 of 2014 and is estimates thereafter. This graph is from US Census Bureau (2018).
One such barrier to entrepreneurship in the United States may be both the availability and
prohibitive cost of healthcare. Before the 2008 financial crisis, small business owners
consistently cited health insurance costs as one of their greatest concerns (SBA 2009). In 2010,
1
Ruddy: ACA and Entrepreneurship Lock
Published by Digital Commons @ IWU, 2020
45 percent of people who purchased their own health insurance did so because they were self-
employed (KFF 2010).
The Patient Protection and Affordable Care Act (ACA) tried to alleviate this problem.
Passed in 2010, the ACA’s main goal was to reduce the number of uninsured people in the
United States, but some supporters claimed that it would also spur business creation. When
talking about ACA before its passage, Speaker of the House Nancy Pelosi (2010) said:
“Imagine an economy where people could follow their aspirations,...Where they could be
self-employed or start a business, not be job-locked in a job because they have health care
there, and if they went out on their own it would be unaffordable to them.” (para. 27)
While the Act was successful at reducing the number of uninsured people in the United States by
about 20 million people (Antonisse & Rudowitz 2019), questions remain if the ACA created
gains in self-employment and if those gains were uniform across different demographic groups.
This paper attempts to answer this question by using data from the Current Population
Survey (CPS) to construct a difference in difference model comparing self-employment rates
overall and by demographic group in states that expanded Medicaid under ACA to states that did
not. This paper will also be the first to account for state political factors in examining Medicaid’s
impact on entrepreneurship, thereby supplementing previous research in the area.
Is employer-based healthcare a barrier to self-employment?
Economists have theorized that employer-based health insurance may decrease job mobility as
workers fear separating from their current job and losing their employer-provided group health
insurance only to be forced into the more expensive individual health insurance market (Holtz-
Eakin 1993). This idea, called “Job Lock,” has been widely studied by economists over the last
30 years. A paper by Grueber and Madrian (2002) that reviewed 50 studies on job lock
concluded that there is “on net strong evidence of job lock” (pg. 35). A systematic review of
literature examining the existence of job lock by the Government Accountability Office (GAO
2011) found that 29 of 31 examined studies provided supporting evidence (pg. 6). With a
relatively strong empirical backing that job lock between salaried positions exist, some
economists have begun to ask if employer-based health insurance creates similar barriers to
entrepreneurship and self-employment.
The prevalence of the employer-based healthcare system and a lack of affordable
insurance alternatives may create specific barriers to self-employment and “entrepreneurship
lock” via two main channels. First, employer-based non-portable health insurance increases the
already high risk of starting a new business by forcing would be entrepreneurs to forgo existing
employer-based insurance to pursue self-employment (risk channel). Second, the high cost of
individual health insurance coverage may diminish the amount of capital an entrepreneur has to
2
Undergraduate Economic Review, Vol. 17 [2020], Iss. 1, Art. 5
https://digitalcommons.iwu.edu/uer/vol17/iss1/5

launch their business or use as collateral to secure outside financing (credit channel) (Olds
2016a).
The first paper to empirically examine the existence of entrepreneurship lock was by
Holtz-Enkin, Penrod and Rosen (1996). The trio used data from the Survey of Program
Participation (SIPP) and the Panel Study of Income Dynamics (PSID) to investigate if a lack of
health insurance portability affects the likelihood that an individual will become self-employed.
Using a difference in difference model, they examined individuals with existing employer-based
health insurance. They compared variations in the probability that an individual will become
self-employed between those whose spouse had employer-based insurance (portable insurance)
and those whose spouse did not (non-portable insurance). This within group comparison attempts
to avoids erroneous conclusions from the “good job” problem, where having employer based
health insurance may indicate that an individual has a good job and would be less likely to leave
this job to become self-employed than someone with a bad job without health insurance.
Additionally, the trio uses a respondent’s self-reported health status to produce a second
difference in difference estimator that proxies the value an individual put on their insurance, with
worse health indicating that an individual values their healthcare more. They predict that poorer
health and non-portable health insurance creates a lower propensity to become an entrepreneur.
Contrary to their prediction, Holtz-Enkin, Penrod, and Rosen do not find evidence that a lack of
health insurance portability affects self-employment. However, their results suffer from large
standard errors. The trio explained their results by arguing that starting a business is a risky
endeavor, and those who choose to undertake it are unswayed by the additional risks of losing
health insurance coverage.
Yet, other researchers have found robust evidence of entrepreneurship lock. Fairle, Kapur
and Gates supplement Holz-Enkin, Penrod, and Rosen’s model by taking advantage of the
continuous surveying methods of the Current Population Survey (CPS) and created matched
panel data. With this methodology, they found a large negative effect of poor health status and
non-portable insurance in predicting self-employment, suggesting that employer-based health
care does create entrepreneurship lock. Their findings are similar to those by Madrian (1998),
who found that a lack of health insurance portability accounts for a 25 percent reduction in the
business creation, and results from Wellington (2001), who estimated that a guaranteed
alternative source of healthcare would increase business formulation by somewhere between 2.3
to 4.4 percent for husbands and 1.2 to 4.6 percent for wives.
Fairle, Kapur and Gates (2010) also pioneered a new methodology to examine
entrepreneurship lock in their paper. They performed a regression discontinuity analysis
examining the probability that elderly full-time male workers are self-employed just before and
just after they turn 65, when they become eligible for Medicare. They find that business
ownership rates increase between the ages 64 to 65 but do not increase similarly over other age
gains between 55 and 75 years old, providing additional evidence of entrepreneurship lock.
Table 1 below summarizes this previous research on entrepreneurship lock.
3
Ruddy: ACA and Entrepreneurship Lock
Published by Digital Commons @ IWU, 2020

Table 1. Empirical Evidence on Entrepreneurship Lock
Study Data Set/Years
Studied Population
Studied Finding
Consistent with
entrepreneur-
ship lock?
Relevant Findings
“Health Insurance and
the Supply of
Entrepreneurs” by Holtz-
Eakin, Penrod, and Rosen
(1994)
Survey of
Program
Participation
(SIPP);1984-
1986 Panel Study of
Income
Dynamics
(PSID); 1984
Workers with
Employer-Based
Health Insurance
Before
Separating
No The coefficient on the
interaction term
between having
employer-based health
insurance and spousal
family-based health
insurance was
statistically
insignificant.
“Is Employer-Based
Health Insurance a
Barrier to
Entrepreneurship?” by
Fairle, Kapur, and Gates
(2010)
Matched
Current
Population
Survey (CPS);
1996-2003
Workers with
Employer-Based
Health Insurance
Before
Separating
Yes The coefficient on the
interaction term
between spouse’s
healthcare coverage and
health is large, negative,
and statistically
significant.
“Health Insurance
Coverage and
Entrepreneurship” by
Wellington (2001)
Current
Population
Survey (CPS);
1993
Non-disabled
Employed
Married White
Husbands and
Wives between
the ages of 25
and 62
Yes A guaranteed alternative
source of healthcare
would increase business
formulation by
somewhere in between
2.3 to 4.4 percent for
husbands and 1.2 to
percent for 4.6 for
wives. "The Effect of Health
Insurance on Transitions
to Self-Employment" by
Madrian (1998)
Survey of
Program
Participation
(SIPP);1984-
1993
Workers with
Employer-Based
Health Insurance
Before
Separating
Yes Health insurance
coverage status has a
statistically significant
effect on self-
employment and that a
lack of portable health
insurance seems to
reduce business creation
by 25 percent.
The Impact of an Alternative Healthcare Source on “Entrepreneurship Lock”
In addition to establishing the existence and prevalence of entrepreneurship lock, researchers
have examined if alternative sources of healthcare, mainly those provided by the public sector,
can promote business formulation. Public health insurance may diminish entrepreneurship lock
by providing a portable low-cost alternative to employer-based insurance thus alleviating both
the risk and credit barriers to self-employment.
4
Undergraduate Economic Review, Vol. 17 [2020], Iss. 1, Art. 5
https://digitalcommons.iwu.edu/uer/vol17/iss1/5

Olds (2016a) examined how the implementation of the national State Child Health
Insurance Program (SCHIP) affected self-employment rates. Using a difference in regression
discontinuity model, where families just above the income cutoff for SCHIP and just below the
income cutoff for SCHIP are compared before and after the program’s implementation, Olds
found that SCHIP expanded self-employment among covered parents by 15 percent. Olds also
examined if SCHIP promoted business formulation via the risk or credit channel. He found that
the increase in self-employment occurs almost entirely from a reduction in risk while only
minimally impacting credit. Olds thereby extends previous research by Bansak and Raphael
(2008), who found that SCHIP improved job mobility for males in families with non-portable
health insurance, to the field of business formulation.
Other economists have found evidence that government policy that provided new
alternatives for healthcare promoted business formulation. DeCicca (2010) examined if New
Jersey's Individual Health Coverage Plan (IHCP) spurred additional self-employment. IHCP
helped create an individual healthcare market with coverage and renewal guarantees in the state.
He found that IHCP increased self-employment rates in the state by 1.1 to 1.6 percent, a 14 to 20
percent increase from previous self-employment rates. Becker and Tulzman (2015) studied the
impact of Massachusetts’s 2006 Health Care reform, much of which served as a precursor to the
Affordable Care Act, on entrepreneurship in the state using a traditional difference in difference
model and an Instrumental Variable (IV) specification. They found that the reform caused self-
employment rates in the state to rise by 1.2 to 1.5 percent and that the likelihood of becoming
self-employed at the individual level rose by 6.3 percent. They also found this effect differed
greatly by gender, as women were 15 percent more likely to become self-employed after the
reform compared to a 3.2 percent increase in the probability for men.
Despite the myriad of natural experiments created by the passage and implementation of
the Affordable Care Act and a body, albeit it a relatively small one, of existing literature on the
subject, there seems to only be two studies that examined changes in self-employment due to the
ACA. Lee (2019) leveraged differences in the state by state implementation of the Medicaid
expansion under the Affordable Care Act to create a natural experiment that provides evidence of
how this expansion affects the probability of self-employment. Using this difference in
difference approach, Lee found that the Medicaid expansion caused a 0.8 to 1.6 percent increase
in self-employment rates among low-income childless adults. Additionally, he found that newly
covered childless adults became 8 to 11 percent more likely to be self-employed due to a lack in
the risk of not being uninsured. Callison and Sicilian (2018) also examined the Medicaid
expansion under the ACA but looked broadly at its effects on labor market outcomes. While they
did find evidence that the expansion increased labor market freedom, they find no evidence that
the expansion increased self-employment rates overall. They did, however, find evidence that
self-employment rose for specific demographic groups, such as white women. Table 2 below
summarizes this previous research on how access to alternative healthcare impacts
entrepreneurship.
5
Ruddy: ACA and Entrepreneurship Lock
Published by Digital Commons @ IWU, 2020

Table 2. Empirical Evidence of Alternative Healthcare on Entrepreneurship
Study Data Set/Years
Studied Population
Studied Relevant Findings
“Entrepreneurship and Public
Health Insurance” by Olds
(2016a)
Current Population
Survey (CPS) and
the Survey of
Program
Participation
(SIPP); 1992-2013
Non-farmer
households with at
least one child
under 18
The creation of the State Child
Health Insurance Program
(SCHIP) expanded self-
employment among covered
parents by 15 percent.
“Health Insurance
Availability and
Entrepreneurship” by
DeCicca (2010)
Behavioral Risk
Factor Surveillance
System (BRFSS);
1991-1996
Individuals
between the ages of
25 and 59
New Jersey's Individual Health
Coverage Plan (IHCP) increased
self-employment rates in the
state by 1.1 to 1.6 percent, a 14
to 20 percent increase from
previous self-employment rates. “Self-Employment and Health
Care Reform: Evidence from
Massachusetts” by Becker
and Tulzman (2015)
Current Population
Survey (CPS);
1995-2012
Individuals
between the ages of
16 and 64 that are
not employed in
agricultural
industries or the
military
The Massachusetts Healthcare
reform caused self-employment
rates in the state to rise by 1.2 to
1.5 percent and caused the
likelihood of becoming self-
employed at the individual level
to rise by 6.3 percent. “Health Insurance and the
Supply of Entrepreneurs:
Evidence from the ACA
Medicaid Expansion” by Lee
(2019)
Current Population
Survey (CPS);
2003-2017
Non-disabled
childless adults
between the ages of
26 and 64 in low-
income households
ACA’s Medicaid expansion
caused a 0.8 to 1.6 percent
increase in self-employment
rates among low-income
childless adults and that newly
covered childless adults were 8
to 11 percent more likely to be
self-employed. “Economic freedom and the
affordable care act: Medicaid
expansions and labor mobility
by race and ethnicity” by
Callison and Sicilian (2018)
Current Population
Survey (CPS);
2008-2018
Individuals
between the ages of
18 and 65 in low-
income households
No evidence that the ACA’s
Medicaid expansion increased
self-employment overall but they
did find evidence that the
expansion promoted self-
employment among some
demographic groups.
The Patient Protection and Affordable Care Act
The Patient Protection and Affordable Care Act (ACA) represented the most significant changes
to the healthcare system in the United States since the passage of Medicare and Medicaid in
1965. ACA made many large-scale policy changes, including (Altman & Schatman 2011 pg
253):
• Ending the practice wherein insurance companies could deny coverage to an individual
because of a pre-existing condition
• Creating state-run insurance exchanges for individuals and small businesses
• Creating tax credits for low-income individuals and small businesses to buy private
coverage
6
Undergraduate Economic Review, Vol. 17 [2020], Iss. 1, Art. 5
https://digitalcommons.iwu.edu/uer/vol17/iss1/5

• Expanding Medicaid to individuals at 138 percent of the federal poverty line (FPL)
These changes could spur entrepreneurship by both increasing the availability and decreasing
the cost of nonemployer-based health insurance. While three of these components were
implemented as planned, the Medicaid expansion was not. In June of 2012, the Supreme Court
ruled in National Federation of Independent Business (NFIB) v. Sebelius that it was
unconstitutional to force states to expand Medicaid eligibility. States were therefore given the
choice to expanded Medicaid creating a natural experiment. States could choose to expand
coverage through legislation, an executive order, or a ballot initiative. To date 35 states and DC
have expanded Medicaid, leaving only 15 states yet to expand the program (KFF 2020).
While other papers have utilized this natural experiment to examine the effect of the
Medicaid expansions on self-employment, this paper will supplement previous research in
several ways. First, it will build upon the existing literature on entrepreneurship lock and social
insurance by providing additional evidence of how Medicaid expansion impacts firm creation.
Second, this paper supplements Lee’s existing research by adding an additional year, and
supplements Callison and Sicilian research by adding an additional five years of previously
unexplored data. Third, this paper will be one of only a few papers to examine the expansions
effect on entrepreneurship by demographic group. Finally, this will be the first paper to include
state political factors in the analysis, thereby accounting for a previously ignored possible
omitted variable.
Data
The data comes from the Annual Social and Economic Supplement (ASEC) of the Current
Population Survey (CPS) conducted by the US Census Bureau. CPS is a monthly nationally
representative survey of households that collects information on labor force participation and
workforce statistics. ASEC is a yearly supplement to the basic monthly CPS survey and is
conducted in March with over 75,000 households. ASEC asks respondents a wide variety of
questions about their households and their activities over the previous year including
demographic information, employment status, income, health status, and health coverage. ASEC
provides information about the respondents from the year prior to the survey year. The data used
ranges from the 2004 to 2019 ASEC surveys, therefore allowing analysis from 2003 to 2018.
The sample is restricted to childless adults between the ages of 26 and 64 to avoid biases
that may arise from alternative health insurance. As previously mentioned, ACA allowed young
adults under the age of 26 to be covered by their parent’s employer-based health insurance and
individuals above 65 years old are eligible for Medicare. The sample is restricted to childless
adults specifically to avoid additional basis from programs like SCHIP and because childless
adults saw the largest expansion of Medicaid eligibility under the ACA reforms. This sample is
also further restricted into two samples based on income.
7
Ruddy: ACA and Entrepreneurship Lock
Published by Digital Commons @ IWU, 2020

The first restricted sample (Sample A) only includes those below 300 percent of the
federal poverty line (FPL). While ACA only expanded Medicaid to individuals with below 138
percent of FPL, Medicaid eligibility is based off modified adjusted gross income (MAGI), which
includes certain deductions that likely would not be reported by respondents in the survey. The
self-employed may also underreport their income in tax filings to be below 138 percent of the
FPL to be eligible for Medicaid but may report a higher income in the survey.1 Finally, since the
survey asks about income from the previous year there could be recall bis. The 300 percent
sample is used to adjust for these factors. This 300 percent sample could be biased by individuals
who use subsidies available to those below 400 percent of the FPL under ACA. To account for
these problems the analysis is also conducted with a sample restricted to those below 138 percent
of the FPL (Sample B).
State that expanded Medicaid after the initial expansion in 2014 are excluded from the
analysis. States that are operating their Medicaid program with a Section 1115 waiver, which
allows the state to implement an alternative expansion plan than the one stipulated under federal
law, are also excluded from the analysis. Massachusetts and Vermont are excluded as they
almost fully expanded Medicaid before 2014. Wisconsin is excluded because the state refused to
take part in the Medicaid expansion under ACA but did expand Medicaid up to 100 percent of
the FPL. With these exceptions, the analysis includes 31 states, 16 that expanded Medicaid and
15 that did not. Table 3 below outlines whether a state is excluded from the analysis, in the
control group, or in the treatment group and why. The Appendix also has a map (graph A) that
shows which states are in the treatment group (blue), control group (brown), and are excluded
from the analysis (purple).
Table 3. States Included in Analysis
No Medicaid Expansion Medicaid Expansion
Included in Analysis:
Alabama, Florida, Georgia, Kansas,
Mississippi, Missouri, Nebraska,
South Carolina, South Dakota,
Tennessee, Texas, Wyoming,
Oklahoma, North Carolina
Included in Analysis:
Washington, California, Nevada,
Colorado, Minnesota, North
Dakota, Illinois, West Virginia,
Maryland, Delaware, New Jersey,
New York, Connecticut, Rhode
Island, Kentucky, Oregon
Excluded from Analysis:2
Arizona┴, Massachusetts∞, New
Mexico┴, Ohio┴, Maine╪
Louisiana╪, Montana╪┴, Virginia╪┴,
Utah┴, Iowa┴, Michigan╪┴, New
Hampshire╪┴, Alaska╪,
Pennsylvania╪, Arkansas┴, Utah╪┴,
Hawaii, Vermont¥, Wisconsin€,
Idaho╪ Indiana╪┴,
All the information on ACA Medicaid expansion is from Kaiser Family Foundation (KFF): https://www.kff.org/health-reform/state-
indicator/state-activity-around-expanding-medicaid-under-the-affordable-care-act/?currentTimeframe=0&sortModel=%7B%22colId%22:%22Location%22,%22sort%22:%22asc%22%7D#note-4
1 Empirical evidence has shown that the self-employed at much more likely to report income near some arbitrary
change in income that effects eligibility or marginal tax rates (called “bunching”). For greater discussion of
bunching see Kleven (2016). 2 ┴ indicates a state approved Section 1115 waivers to operate their Medicaid expansion programs in ways not
otherwise allowed under federal law. ╪ indicates that a state expanded Medicare after 2014. ∞ indicates that a state
implemented reforms similar to the Affordable Care Act before 2014. Under MassHealth Medicaid Waivers, adults
were covered up to 133% of the FPL in Massachusetts. €Wisconsin expanded Medicare up to 100% of the FPL but
did not join the expansion under ACA. ¥Vermont Fully expanded Medicaid before 2014.
8
Undergraduate Economic Review, Vol. 17 [2020], Iss. 1, Art. 5
https://digitalcommons.iwu.edu/uer/vol17/iss1/5
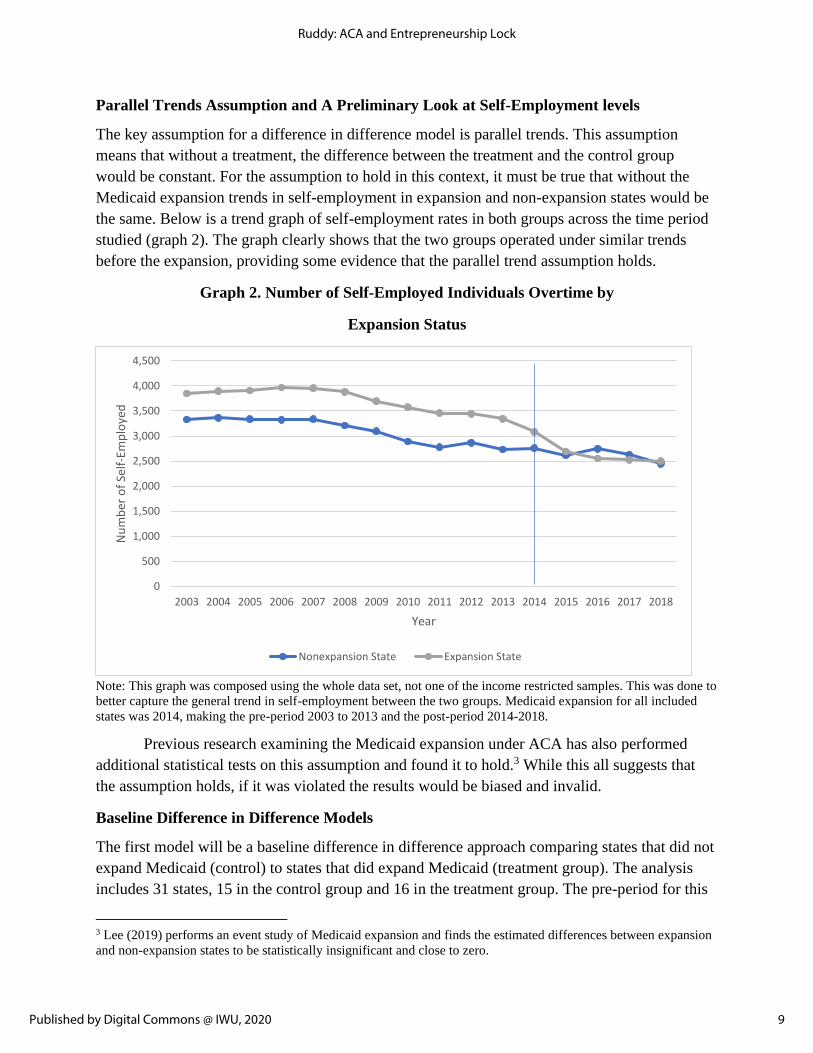
Parallel Trends Assumption and A Preliminary Look at Self-Employment levels
The key assumption for a difference in difference model is parallel trends. This assumption
means that without a treatment, the difference between the treatment and the control group
would be constant. For the assumption to hold in this context, it must be true that without the
Medicaid expansion trends in self-employment in expansion and non-expansion states would be
the same. Below is a trend graph of self-employment rates in both groups across the time period
studied (graph 2). The graph clearly shows that the two groups operated under similar trends
before the expansion, providing some evidence that the parallel trend assumption holds.
Graph 2. Number of Self-Employed Individuals Overtime by
Expansion Status
Note: This graph was composed using the whole data set, not one of the income restricted samples. This was done to
better capture the general trend in self-employment between the two groups. Medicaid expansion for all included
states was 2014, making the pre-period 2003 to 2013 and the post-period 2014-2018.
Previous research examining the Medicaid expansion under ACA has also performed
additional statistical tests on this assumption and found it to hold.3 While this all suggests that
the assumption holds, if it was violated the results would be biased and invalid.
Baseline Difference in Difference Models
The first model will be a baseline difference in difference approach comparing states that did not
expand Medicaid (control) to states that did expand Medicaid (treatment group). The analysis
includes 31 states, 15 in the control group and 16 in the treatment group. The pre-period for this
3 Lee (2019) performs an event study of Medicaid expansion and finds the estimated differences between expansion
and non-expansion states to be statistically insignificant and close to zero.
0
500
1,000
1,500
2,000
2,500
3,000
3,500
4,000
4,500
2003 2004 2005 2006 2007 2008 2009 2010 2011 2012 2013 2014 2015 2016 2017 2018
Nu
mb
er o
f Se
lf-E
mp
loye
d
Year
Nonexpansion State Expansion State
9
Ruddy: ACA and Entrepreneurship Lock
Published by Digital Commons @ IWU, 2020

analysis will be 2003 to 2013 and the post-period will be from 2014 to 2018. The baseline
regression has the following specification:
Self-Employmentist = αo+β1 (ExpS * Postt) + Xist + δs + τt + εist
Where Self-Employmentist represents a binary outcome variable for individual i in state s during
time t. ExpS is an indicator variable for if a state expanded Medicaid and is interacted with Postt,
an indicator variable for if the state is in the expansion period. Xist is a set of demographic
variables including age, sex, race, education, marital status, and if the individual was born in a
foreign country.4 δs and τt represents fixed state and time effects respectively and are included to
remove specific time invariant state characteristics and time variant exogenous shocks. Standard
errors are clustered at the state level and basic linear probability model (LPM) regressions are
used. This model is based on a similar methodological framework used by Lee (2019).
To examine if the expansion had homogenous effects on different demographics groups,
the baseline model is run with gender and racially specific regressions.5 Demographic specific
regressions are run for men, women, whites, African Americans, Asians, and Native Americans.
Gender specific regressions are also run for each racial group.
Self-employment is the main outcome variable of this regression, but self-employment is
not identical to entrepreneurship. While a direct measure of entrepreneurship would be
preferable, this is not possible due to data availability. Self-employment serves as a strong proxy
for entrepreneurship, capturing risk-tasking and other characteristics traditionally linked with
entrepreneurship (Parker 2009). Using self-employment also allows for the comparison of these
results to previous research on entrepreneurship lock, which almost exclusively uses self-
employment.
Difference in Difference Model with Gubernatorial Regressor
As with any regression model, if there is some omitted variable that is correlated with both the
treatment variable (Medicaid expansion) and the outcome variable (self-employment) the
coefficient estimates will be biased. Partisan control of a state’s executive branch and a state’s
general political climate overtime may be such a factor. Medicaid expansion is not random but
instead a consequence of political, usually partisan, action by a state’s government. Additionally,
the political climate of a state likely influences the business landscape, as the two major political
parties have differing policy approaches regarding how to support businesses and development.
4 Foreign birth status is included as a control variable because foreign born workers are more likely to be self-
employed than native born workers (Hipple & Hammond 2016). Foreign birth status is also included to allow for
comparison of the results to previous work (Lee 2019). 5 For example, the racial regression for African Americans only uses observations from African American
respondents. Therefore, ExpS * Postt represents the difference between the probability that an African American
individual will be self-employed with the Medicaid expansion to the likelihood they would be self-employed
without the Medicaid expansion.
10
Undergraduate Economic Review, Vol. 17 [2020], Iss. 1, Art. 5
https://digitalcommons.iwu.edu/uer/vol17/iss1/5

While state fixed effects are included in the baseline model, partisan control of state
governmental offices changes over the course of the study period and is therefore not time-
invariant. To control for this possible omitted variable, I include a specification of the baseline
model with additional regressors to account for political variation in the states between 2003 and
2018. This model has the following specification:
Self-Employmentist = αo+β1 (ExpS * Postt) + β2 RepGovst + β3RepLegst +
β4MixedLegst + Xist + δs + τt + εist
Where all previous variables are the same as the baseline and RepGovst is a dummy variable for
if state had a Republican governor during a given year, RepLegst is a dummy variable for if the
Republican party was in control of both chambers of a state’s legislature, and MixedLegst is a
dummy variable for if both chambers of a state legislature was not controlled by the same party
for a given year.6 The model accounts for variation within the executive and legislative branches
in a state as Medicaid could be expanded via the legislative process or via a simple executive
order. Democratic variables are excluded from this regression to prevent multicollinearity.
Descriptive Statistics
Table 4 below provides descriptive statistics from the 300 percent FPL sample (Sample
B) for the treatment and control group in both the pre and post period. It contains information
demographics, education, economic factors, and variables related to healthcare. The table shows
that the mean for every variable moves in the same direction between treatment and control
group in the pre and post time periods for both groups (except for self-employment). The
treatment group appears to have fewer males, native born citizens, and married people. The
treatment group appears to be slightly more educated and have higher incomes with fewer
incorporated business. The difference in the sizes of business between the two groups flips, with
the treatment group originally having more small firms, less than 25 people, in the pre-expansion
period but fewer smaller firms in the post period. There are less self-employed people in the
treatment group before expansion, but more following expansion compared to the control group.
This could either suggest that the Medicaid expansion did increase self-employment or that there
are different trends between the two groups, thereby violating the parallel trends assumptions.
Finally, the treatment group seems to have poorer health in both periods and less employer-based
healthcare. Not surprisingly, the treatment group seems to have a larger gain in Medicaid than
the control group in the post period.
6 These variables are independently coded for each year. Rhode Island is the only state in the analysis to have a
Governor who was not part of either the Republican or Democratic Party, as Lincoln Chafee began his Governorship
as an independent. However, Chafee began identifying as a democrat halfway through his term.
11
Ruddy: ACA and Entrepreneurship Lock
Published by Digital Commons @ IWU, 2020

Table 4. Summary Statistics of Important Variables for Sample of 300 percent of FPL
Variable Non-expansion
State (Pre)
Expansion State
(Pre)
Non-expansion
State (Post)
Expansion State
(Post)
Demographic
Age 46.82 45.37 47.31 45.80
Male .5166 .5238 .5042 .5160
Born in US .8250 .7103 .8256 .7217
Married .3480 .3009 .3215 .2835
Education
Less than HS .2304 .2182 .1836 .1839
HS .3848 .3539 .3915 .3636
Bachelors .0998 .1284 .1155 .1331
Masters .0260 .0335 .0318 .0394
Professional .0079 .0109 .0084 .0112
Economic
Family Income 21,751 22,258 24,404 25,221
Self-Employment .0674 .0643 .0568 .0623
Incorporated
Business
.0100 .0089 .0102 .0096
Small Firm .9898 .9883 .9861 .9787
Health
Poor Health .2889 .2466 .2734 .2456
Employer Based
Healthcare
.3410 .3386 .2646 .2602
Medicaid .1417 .1761 .1754 .3099
Observations (n) 55,949 69,735 26,876 26,876
The Effect of Medicaid Expansion on Self-Employments Rates
Table 5 shows the output from the baseline regression on self-employment for both samples.
There are several interesting findings in this output. First, both samples find that self-
employment in expansion states was statistically significantly higher by about 1.5 percent
compared to non-expansion states. However, this increase is only significant at 10 percent
significance level in the 138 percent sample (likely due to the smaller number of observations in
this sample). These results are slightly larger than those found by Lee (2019).
Second, it seems that the Medicaid expansion did not have equal effects for all
subgroups. The larger 300 percent sample finds significant increases for both genders, whites,
and African Americans, with black men having the largest gains. The smaller 138 percent sample
finds similar results for African Americans but at a large magnitude, as their self-employment
rates are found to be 3.49 percent higher in expansion states than in non-expansion states when
using this sample. While other ethnic groups also experience higher levels of self-employment
across the board (the only exception being Native American women), these effects are smaller,
sometimes less than 1 percent, and are not statistically significant (once again likely due to
smaller sample sizes). These results seem to suggest that while Medicaid expansion increased the
12
Undergraduate Economic Review, Vol. 17 [2020], Iss. 1, Art. 5
https://digitalcommons.iwu.edu/uer/vol17/iss1/5

self-employment rate across the board, these gains were concentrated within the African
American community.
Table 5. Results from Baseline Difference in Difference Regressions by Demographic
Group
VARIABLES Baseline
Males
Only
Females
Only
White
Only
Black
Only
Asian
Only
Nav.
Amer.
Only
Sample A:
FPL<300%
Exp*Post 0.0154*** 0.0163** 0.0143*** 0.0133** 0.0263** -0.000131 0.0375
(0.00419) (0.00708) (0.00506) (0.00599) (0.0104) (0.0223) (0.0346)
Observations (A) 179,201 92,732 86,469 126,451 36,129 8,755 3,463
R-squared (A) 0.018 0.016 0.013 0.019 0.012 0.028 0.045
Sample B: FPL<138%
Exp*Post 0.0146* 0.0224* 0.00655 0.0125 0.0349*** 0.000699 0.0795
(0.00752) (0.0132) (0.00685) (0.0112) (0.0121) (0.0356) (0.0699)
Observations (B) 74,830 36,971 37,859 50,267 17,230 3,633 1,822
R-squared (B) 0.018 0.014 0.014 0.019 0.015 0.039 0.085
State FE Yes Yes Yes Yes Yes Yes Yes
Time FE Yes Yes Yes Yes Yes Yes Yes
VARIABLES
White
Female
Black
Female
Asian
Female
Nav.
Amer.
Female
White
Male
Black
Male
Asian
Male
Nav.
Amer
Male
Sample A:
FPL<300%
Exp*Post 0.0109* 0.0253** 0.0171 -0.0430 0.0151 0.0272** -0.0172 0.102**
(0.00541) (0.0122) (0.0262) (0.0432) (0.0102) (0.0129) (0.0341) (0.0468)
Observations (A) 60,063 18,199 4,468 1,596 66,388 17,930 4,287 1,867
R-squared (A) 0.014 0.008 0.034 0.052 0.016 0.012 0.031 0.066
Sample B: FPL<138%
Exp*Post 0.00331 0.0251*** 0.00741 -0.0109 0.0176 0.0440** 0.00990 0.139
(0.00912) (0.00746) (0.0612) (0.0271) (0.0197) (0.0210) (0.0232) (0.120)
Observations (B) 25,129 8,946 1,936 860 25,138 8,284 1,697 962
R-squared (B) 0.015 0.012 0.053 0.083 0.012 0.018 0.045 0.140
State FE Yes Yes Yes Yes Yes Yes Yes Yes
Time FE Yes Yes Yes Yes Yes Yes Yes Yes
Robust Standard Errors clustered at state level in parentheses. *** p<0.01, ** p<0.05, *p<0.1. Sample is restricted to
childless adults between the ages of 26 and 64. Individual characters are controlled for (i.e. age, gender, race,
education, marital and foreign birth status).
13
Ruddy: ACA and Entrepreneurship Lock
Published by Digital Commons @ IWU, 2020
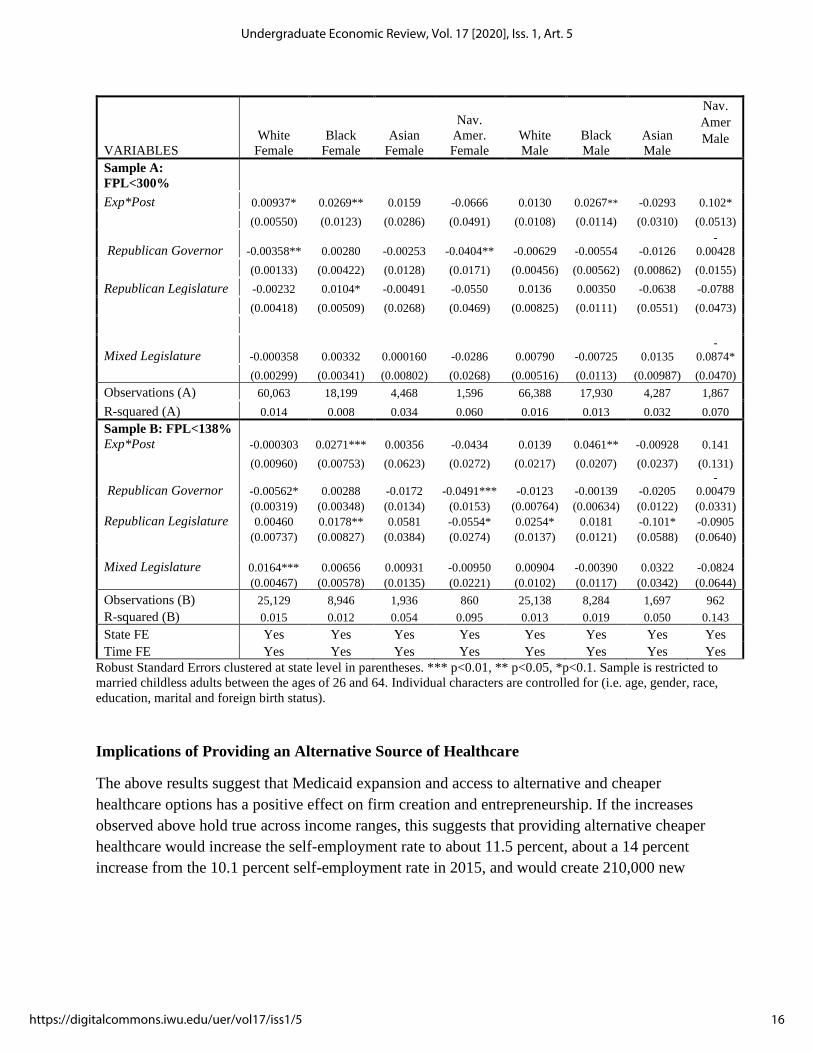
The Effect of Medicaid Expansion on Self-Employment Under Differing Partisan Control
of the State Governmental Offices
Table 6 includes the output from the baseline regression with the additional gubernatorial
regressor. While the 300 percent sample still shows expansion states to have a statistically
significant higher self-employment rate, albeit it at a diminished magnitude, the addition of the
gubernational regressors reduces the magnitude of the expansion effect in the 138 percent sample
so that it is statistically insignificant. While the overall increase is diminished, there are similar
effects of expansion on African Americans, men, and all the other demographic groups as in the
baseline, providing some additional reassurance of the subgroup baseline results.
While the gubernatorial regressor coefficients may reflect interesting trends, these
variables are designed as controls within this model and their coefficients should not be viewed
as causal. It is likely inappropriate to interpret these results as evidence that Republican or
Democratic state control is better or worse at spurring entrepreneurship across different
demographic subgroups. There are many other factors that partisan control maybe capturing
including a state’s general political and business policy climate or some other unobserved factor.
Instead, a different model with the explicit goal of capturing the causal effect of a party’s control
of state political offices on entrepreneurship would have be constructed. The above results are,
however, helpful in showing that any effects of Medicaid expansion are not solely due to
political factors.
14
Undergraduate Economic Review, Vol. 17 [2020], Iss. 1, Art. 5
https://digitalcommons.iwu.edu/uer/vol17/iss1/5

Table 6. Results from Difference in Difference Regressions with Partisan Regressors
by Demographic Group
VARIABLES Baseline
Males
Only
Females
Only
White
Only
Black
Only
Asian
Only
Nav.
Amer.
Only
Sample A:
FPL<300%
Exp*Post 0.0141*** 0.0146* 0.0134** 0.0114* 0.0268*** -0.00672 0.0292
(0.00436) (0.00763) (0.00518) (0.00624) (0.00962) (0.0225) (0.0374)
Republican Governor -0.00429** -0.00570 -0.00276** -0.00505** -0.00145 -0.00885 -0.0191*
(0.00206) (0.00345) (0.00133) (0.00239) (0.00390) (0.00810) (0.0106)
Republican Legislature 0.00798** 0.0145** 0.000528 0.00618 0.00655 -0.0341 -0.0629
(0.00386) (0.00619) (0.00369) (0.00463) (0.00677) (0.0347) (0.0428)
Mixed Legislature 0.00377 0.00693 -0.000371 0.00435 -0.00240 0.00860 -0.0584
(0.00301) (0.00418) (0.00265) (0.00331) (0.00692) (0.00707) (0.0353)
Observations (A) 179,201 92,732 86,469 126,451 36,129 8,755 3,463
R-squared (A) 0.018 0.016 0.013 0.019 0.012 0.028 0.049
Sample B: FPL<138%
Exp*Post 0.0121 0.0198 0.00404 0.00685 0.0371*** -0.0122 0.0701
(0.00808) (0.0143) (0.00729) (0.0127) (0.0123) (0.0399) (0.0762)
Republican Governor -0.00750*** -0.0104* -0.00470* -0.00928** 0.00105 -0.0223** -0.0213
(0.00249) (0.00524) (0.00274) (0.00361) (0.00371) (0.00941) (0.0191)
Republican Legislature 0.0177*** 0.0259** 0.00957 0.0147* 0.0180* -0.0245 -0.0593
(0.00605) (0.00984) (0.00638) (0.00780) (0.00900) (0.0249) (0.0444)
Mixed Legislature 0.0109* 0.00833 0.0133** 0.0130* 0.00103 0.0223 -0.0385
(0.00619) (0.00846) (0.00496) (0.00675) (0.00817) (0.0136) (0.0399)
Observations (B) 74,830 36,971 37,859 50,267 17,230 3,633 1,822
R-squared (B) 0.018 0.014 0.014 0.018 0.015 0.040 0.087
State FE Yes Yes Yes Yes Yes Yes Yes
Time FE Yes Yes Yes Yes Yes Yes Yes
15
Ruddy: ACA and Entrepreneurship Lock
Published by Digital Commons @ IWU, 2020
VARIABLES
White
Female
Black
Female
Asian
Female
Nav.
Amer.
Female
White
Male
Black
Male
Asian
Male
Nav.
Amer
Male
Sample A:
FPL<300%
Exp*Post 0.00937* 0.0269** 0.0159 -0.0666 0.0130 0.0267** -0.0293 0.102*
(0.00550) (0.0123) (0.0286) (0.0491) (0.0108) (0.0114) (0.0310) (0.0513)
Republican Governor -0.00358** 0.00280 -0.00253 -0.0404** -0.00629 -0.00554 -0.0126
-
0.00428
(0.00133) (0.00422) (0.0128) (0.0171) (0.00456) (0.00562) (0.00862) (0.0155)
Republican Legislature -0.00232 0.0104* -0.00491 -0.0550 0.0136 0.00350 -0.0638 -0.0788
(0.00418) (0.00509) (0.0268) (0.0469) (0.00825) (0.0111) (0.0551) (0.0473)
Mixed Legislature -0.000358 0.00332 0.000160 -0.0286 0.00790 -0.00725 0.0135
-
0.0874*
(0.00299) (0.00341) (0.00802) (0.0268) (0.00516) (0.0113) (0.00987) (0.0470)
Observations (A) 60,063 18,199 4,468 1,596 66,388 17,930 4,287 1,867
R-squared (A) 0.014 0.008 0.034 0.060 0.016 0.013 0.032 0.070
Sample B: FPL<138%
Exp*Post -0.000303 0.0271*** 0.00356 -0.0434 0.0139 0.0461** -0.00928 0.141
(0.00960) (0.00753) (0.0623) (0.0272) (0.0217) (0.0207) (0.0237) (0.131)
Republican Governor -0.00562* 0.00288 -0.0172 -0.0491*** -0.0123 -0.00139 -0.0205
-
0.00479
(0.00319) (0.00348) (0.0134) (0.0153) (0.00764) (0.00634) (0.0122) (0.0331)
Republican Legislature 0.00460 0.0178** 0.0581 -0.0554* 0.0254* 0.0181 -0.101* -0.0905
(0.00737) (0.00827) (0.0384) (0.0274) (0.0137) (0.0121) (0.0588) (0.0640)
Mixed Legislature 0.0164*** 0.00656 0.00931 -0.00950 0.00904 -0.00390 0.0322 -0.0824
(0.00467) (0.00578) (0.0135) (0.0221) (0.0102) (0.0117) (0.0342) (0.0644)
Observations (B) 25,129 8,946 1,936 860 25,138 8,284 1,697 962
R-squared (B) 0.015 0.012 0.054 0.095 0.013 0.019 0.050 0.143
State FE Yes Yes Yes Yes Yes Yes Yes Yes
Time FE Yes Yes Yes Yes Yes Yes Yes Yes
Robust Standard Errors clustered at state level in parentheses. *** p<0.01, ** p<0.05, *p<0.1. Sample is restricted to
married childless adults between the ages of 26 and 64. Individual characters are controlled for (i.e. age, gender, race,
education, marital and foreign birth status).
Implications of Providing an Alternative Source of Healthcare
The above results suggest that Medicaid expansion and access to alternative and cheaper
healthcare options has a positive effect on firm creation and entrepreneurship. If the increases
observed above hold true across income ranges, this suggests that providing alternative cheaper
healthcare would increase the self-employment rate to about 11.5 percent, about a 14 percent
increase from the 10.1 percent self-employment rate in 2015, and would create 210,000 new
16
Undergraduate Economic Review, Vol. 17 [2020], Iss. 1, Art. 5
https://digitalcommons.iwu.edu/uer/vol17/iss1/5

businesses (Hipple & Hammond 2016).7 Assuming all these new firms have employees, then the
addition of these firms would create 1.281 million new jobs.8 This is likely a large overestimate,
as younger firms are more likely to be unincorporated and not have employees. If a slightly more
realistic assumption that only a fourth of new firms are employer is used, then 320,250 new jobs
would be created.9
Significant increases in self-employment and the formulation of new young small firms
could lead to substantial increases in innovations within the United States. In industries with the
greatest number of innovations, small firms have a 6.64 times greater innovation-per-employee
rate than larger firms (Acs& Audretsch 1988). Additionally, research by Allison, Lemley,
Moore, and Trunkey (2003) found that individual inventors, small businesses, and small non-
profit entities have a higher proportion of litigated patents than larger firms. 39.2 percent of
ligated patents in their sample were initially issued to small entities whereas only 13.6 percent of
litigated patents in the sample were initially issued to larger firms. This difference in patent
ligation suggests that small and younger firms not only produce more innovation-per-employee,
but that these patent innovations are also of higher value.10 New small firms that arise from the
provision of an alternative source of health insurance could therefore spur a greater volume of
valuable innovations.
Increases to the self-employment rate are particularly importance today given the
declining level of self-employment over the last few decades. The self-employment rate has
fallen from 12.1 percent in 1994 to 10.1 percent in 2015. The unincorporated self-employment
rate specifically, fell from 8.7 percent to 6.4 percent over the same time period (Hipple &
Hammond 2016). Graph 3 below shows the declining trend in the overall and unincorporated
self-employment rate between 1994 and 2015. One analysis found that the firm creation rate has
fallen by 27 percent and that this lower rate led to a loss of 1.7 million jobs between 2006 and
2011 (Gourio & Siemer 2014). If, as this paper’s analysis suggests, alternative healthcare spurs
business formulation, then providing these alternatives could be a strong tool in reversing this
current downward trend.
7 The estimate of 210,000 new firms come from a 1.4 percent increase in the 15 million people who identified as
self-employed in 2015. This is likely a large overestimate as becoming self-employed is not the same as starting a
business or new firm. 8 These projections are based of the estimates that new firms had 6.1 employees on average in 2011 (Hathaway,
Bell-Masterson & Stangler 2013). These projections are a large overestimate considering that not all increases in
self-employment lead to business with employees. 9 75 percent of small businesses were not employers (SBA 2012). The job creation estimate is based of the
assumption that alternative health care would create 52,500 new employer firms and that they would have an
average of 6.1 employees. This is still likely a large overestimate of the effects of new firms. 10 Litigation is used as a proxy for the value of patents in the study as litigated patents have a higher number of
claims, cite more prior art and are cited by other patents more often than issued patents. For a greater explanation of
why litigation us used as an indicator of patent value see Allison, Lemley, Moore, and Trunkey (2003).
17
Ruddy: ACA and Entrepreneurship Lock
Published by Digital Commons @ IWU, 2020

Graph 3. Self-employment rates by Incorporation Status, 1994-2015
Source: Page 3 of Hipple & Hammond 2016
These finding also have considerable significance given the current healthcare debate in
the United States. During the 2020 presidential elections and primary cycle, Democratic
candidates have proposed a variety of different plans to expanded alternative access to
healthcare. The most contentious and ambiguous of these plans has been a Medicare for All
system, under which the entire US population would be eligible for Medicare. While this paper
does not shed insight into the feasibility or cost of such a plan, it does provide some evidence
that a Medicare for All type system could increase self-employment.
These findings also suggest that providing alternative healthcare could be especially
powerful in promoting minority businesses. If these findings hold across all income groups and
all new firms were unincorporated, then an alternative source of insurance would increase the
unincorporated self-employment rate for African Americans from 3.6 percent to about 6.3
percent, almost doubling it (Hipple & Hammond 2016). Under the same assumptions, the female
unincorporated self-employment rate would rise from 5.2 percent to about 6.5 percent (Hipple &
Hammond 2016). Graph 4 below shows these projected changes in self-employment overall and
by demographic group. These increases could be important to federal agencies charged with
promoting small business development, such as the Small Business Administration (SBA), and
agencies trying to promote minority business development, such as the Minority Business
Development Agency (MBDA).
18
Undergraduate Economic Review, Vol. 17 [2020], Iss. 1, Art. 5
https://digitalcommons.iwu.edu/uer/vol17/iss1/5

Graph 4. Current and Projected Change in Self-Employment Rate by Demographic Group
Limitations of the Model
There are several limitations to the results presented above and the general model used for this
analysis. Notably, self-employment is only a proxy for entrepreneurship and not a direct measure
of it. Further, these results would be invalid if the parallel trends assumption is violated. There
are also a variety of other limitations to the model that threaten the validity of the results.
The first limitation of the analysis is that Medicaid expansion in a state does not mean an
increase in coverage. Eligible individuals may not enroll in the program. Expansion does not
capture the size of scope enrollment increases. Additionally, income is often not static over the
course of a year and someone may be eligible to enroll in Medicaid one month but not the next
or may re-enroll over the course of a year. However, increased access to alternative insurance
options may reduce risk and lower entrepreneurship lock even if an individual does not actually
enroll in Medicaid.
The second limitation of the analysis is a lack of statistical weights. There are several
differences between the treatment and control group that could skew results or even invalidate
them if these differences are correlated with self-employment. Other researchers have
compensated for these differences by creating propensity weight scores and further research on
this topic could supplement this analysis by including such scoring. Additionally, the data used
for this paper comes from CPS which is a repeated cross-sectional dataset that may experiences
changes in the consumption of its random sample overtime. While ASEC weights provided with
the CPS survey are used to account for some of this variation, unaccounted changes may still
exist and affect results.
10.1%
3.6%
5.2%
11.5%
6.3% 6.5%
1.4%
2.7%
1.3%
0.0%
2.0%
4.0%
6.0%
8.0%
10.0%
12.0%
14.0%
Overall African American Female
Current Self-Employment Rate
Projected Self-Empoyed Rate with Alternative Healthcare Source
Change due to Alternative Healthcare Source
19
Ruddy: ACA and Entrepreneurship Lock
Published by Digital Commons @ IWU, 2020

The third limitation of this analysis is that is does not account for a possible demand
shock. Medicaid recipients may have additional income from not paying for healthcare or health-
related costs. If new recipients consume more goods locally as a result of these funds, it could
create a demand shock that has producers increase output and make self-employment more
attractive. In an attempt to account for this limitation and determine if a demand shock occurred,
a difference in difference model is presented in the Appendix that has the same specification as
the baseline model but with wage-earners as the output variable instead of self-employment
(Table A and B). If a demand shock occurred, we would expect the coefficient on ExpS * Postt
to be positive, statistically significant, and similar to the coefficient found in the baseline self-
employment model. Results are also presented for wage-earners in the model with partisan
regressors. The coefficient on these regressors are statistically insignificant and negligible in
magnitude, suggesting that the increase in self-employment is not due solely to a demand shock.
The fourth limitation of the modeling is the small number of observations and R-squared
values for some of the regressions. Some of the demographic specific analyses have a rather low
level of observations, with the gender-specific Native American regressions having less than
1,000 observations. Given the large amount of noise in self-employments rates, a small number
of observations likely makes these results rather imprecise. The regressions also have rather low
R-squared value, below .02 in most cases. This R-squared value cannot be compared to other
papers on this subject as most do not provide these values.11 While this value is rather low, R-
squared values do not represent the validity of a model.
The fifth and final limitation of the modeling is that it only applies to low-income
individuals. Since the samples are limited to 300 percent and 138 percent of the FPL, the results
are not representative of the entire income spectrum, as assumed in the implication section. Since
Medicaid was only expanded to these lower-income groups, the expansion would likely have
little to no effect on other higher income populations. Therefore, the results may not be
externally valid for higher income populations. Future research into this natural experiment and
other issues relating to entrepreneurship lock should attempt to supplement the modeling used in
this analysis and account for these limitations.
Other Areas for Future Research
Besides improvements to the above model, there are several other areas future researchers could
explore. First, future researchers could use an Instrumental Variable (IV) model to measure the
effect of self-employment outcomes by demographic groups for those who actually enrolled in
Medicaid (compliers), instead of those who simply lived in an expansion state.12 This research
would provide greater insight into the outcomes for those who actually enrolled in Medicaid
instead of the net effect. If possible, it would also be useful to compare eligible individuals who
11 While most papers on predicting entrepreneurship did not include R-squared values, those that do vary widely
from 0.1 (Luo & Chong) to 0.8 (Becker & Tuzman 2015). 12 For previous work using IV modeling and ACA Medicaid expansion see Lee (2019).
20
Undergraduate Economic Review, Vol. 17 [2020], Iss. 1, Art. 5
https://digitalcommons.iwu.edu/uer/vol17/iss1/5

enrolled in Medicaid to eligible individuals who did not enroll and measure differences in self-
employment outcomes between the two groups.
Another area future researcher should examine is if different demographic groups
experienced reduced entrepreneurship lock through a different mechanism. These results could
find, for example, if African Americans respond more to a reduction in risk (the risk channel) or
additional capital (the credit channel). These results would be useful for policymakers, as they
could target a channel specifically to spur entrepreneurship among certain target populations. In
the Appendix, a preliminary analysis of the mechanisms through which the Medicaid expansion
reduced entrepreneurship lock is presented (Table C and D), but a more robust model is likely
needed.
Finally, future researchers should examine the quality (e.g. if a firm is incorporated, has
employees, etc.) of new businesses produced by the Medicaid expansion. In the implications
section, it was assumed that the newly self-employed mirrored the general proportion of small
and new businesses. However, this may not be true as low-income households have different
characteristics than the general population. Research by Balkin (1989) found that low-income
households tend to start business that are smaller and less sophisticated than higher income
groups. While this sort of analysis is currently hampered by a lack of strong information about
firm characteristics, especially information that includes demographic information about the
owner, if new data sources become available researchers maybe better able to answer this
question.13
Conclusion
This paper examined the effect expanding Medicaid under the Affordable Care Act (ACA) had
on reducing entrepreneurship lock and increasing self-employment levels of different
demographic groups. This project built off previous research on the Medicaid expansion by
including partisan control variables within regressions and by including previously unused years
of new data. The results found that Medicaid expansion improved self-employment rates by
about 1.4 percent when accounting for political factors within a state, and that the increase in
self-employment was greatest among the African American community. If valid and applicable
to the entire income spectrum, the results suggest that providing an alternative source of
healthcare could create up to 210,000 new businesses and create 1.281 million new jobs. Future
research should expand upon these findings by addressing some of the limitation of this study
and by exploring alternative and differently targeted specifications to the modeling.
References
Acs, Z. J., & Audretsch, D. B. (1988). Innovation in large and small firms: an empirical
analysis. The American economic review, 678-690.
13 One such new data maybe collected under Section 1071 of the Dodd-Frank Act. This section requires the
Consumer Financial Protection Bureau (CFPB) to collect information on small business loan applications, including
sex, race, and ethnicity.
21
Ruddy: ACA and Entrepreneurship Lock
Published by Digital Commons @ IWU, 2020

Allison, J. R., Lemley, M. A., Moore, K. A., & Trunkey, R. D. (2003). Valuable patents. Geo. Lj,
92, 435.
Antonisse, L., & Rudowitz, R. (2019, February 28). An Overview of State Approaches to
Adopting the Medicaid Expansion. Retrieved March 8, 2020, from
https://www.kff.org/medicaid/issue-brief/an-overview-of-state-approaches-to-adopting-
the-medicaid-expansion/
Balkin, S. (1989). Self-employment for low-income people. Greenwood Publishing Group.
Bansak, C., & Raphael, S. (2008). The State Children's Health Insurance program and job
mobility: identifying job lock among working parents in near-poor households. ILR
review, 61(4), 564-579.
Becker, T., & Tuzemen, D. (2014). Self-employment and health care reform: evidence from
Massachusetts. Federal Reserve Bank of Kansas City Working Paper, (14-16).
Callison, K., & Sicilian, P. (2018). Economic freedom and the affordable care act: Medicaid
expansions and labor mobility by race and ethnicity. Public Finance Review, 46(2), 301-
324.
DeCicca, P. (2010). Health insurance availability and entrepreneurship. Upjohn Institute
Working Paper, (10-167). https://research.upjohn.org/up_workingpapers/167/
Fairlie, R. W., Kapur, K., & Gates, S. (2011). Is employer-based health insurance a barrier
to entrepreneurship?. Journal of Health Economics, 30(1), 146-162.
Flood, S., King, M., Rodgers, R., Ruggles, S., & Warren, J. R. (2018). Current Population
Survey: Version 6.0 [dataset]. Integrated Public Use Microdata Series. Minneapolis,
MN: IPMUS, 2018. https://doi.org/10.18128/D030.V6.0
Gourio, F., Messer, T., & Siemer, M. (2014). What Is the Economic Impact of the Slowdown in
New Business Formation?. Chicago Fed Letter, (326), 1.
Government Accountability Office. (2011). Health care coverage: Job lock and the potential
impact of the Patient Protection and Affordable Care Act.
https://www.gao.gov/assets/590/586973.pdf
22
Undergraduate Economic Review, Vol. 17 [2020], Iss. 1, Art. 5
https://digitalcommons.iwu.edu/uer/vol17/iss1/5
Gruber, J., & Madrian, B. C. (2002). Health insurance, labor supply, and job mobility: A critical
review of the literature (No. w8817). National Bureau of Economic Research.
Haltiwanger, J., Jarmin, R., & Miranda, J. (2008). Business formation and dynamics by business
age: Results from the new business dynamics statistics. CES preliminary paper.
http://webserver03.ces.census.gov/docs/bds/bds_paper_CAED_may2008_dec2.pdf
Downloaded May, 18, 2010.
Haltiwanger, J., Jarmin, R. S., & Miranda, J. (2013). Who creates jobs? Small versus large
versus young. Review of Economics and Statistics, 95(2), 347-361.
Haltiwanger, J., Jarmin, R. S., Kulick, R., & Miranda, J. (2016). High growth young firms:
contribution to job, output, and productivity growth. In Measuring entrepreneurial
businesses: current knowledge and challenges (pp. 11-62). University of Chicago Press.
Hathaway, I., Bell-Masterson, J., & Stangler, D. (2013). The return of business creation.
Available at SSRN 2307926.
Hipple, S. F., & Hammond, L. A. (2016). Self-Employment In The United States. US Bureau of
Labor Statistics. Retrieved from https://www.bls.gov/spotlight/2016/self-employment-in-
the-united-states/pdf/self-employment-in-the-united-states.pdf
Holtz-Eakin, D. (1993). Job-lock: an impediment to labor mobility? Is health insurance
crippling the labor market? (No. 10). Public Policy Brief.
Holtz-Eakin, D., Penrod, J. R., & Rosen, H. S. (1996). Health insurance and the supply of
entrepreneurs. Journal of Public Economics, 62(1-2), 209-235.
Kaiser Family Foundation. (2010). Survey of People Who Purchase Their Own Insurance.
https://www.kff.org/wp-content/uploads/2013/01/8077-r.pdf
Kaiser Family Foundation. (2020, February 19). Status of State Action on the Medicaid
Expansion Decision. Retrieved from https://www.kff.org/health-reform/state-
indicator/state-activity-around-expanding-medicaid-under-the-affordable-care-
act/?currentTimeframe=0&sortModel={"colId":"Location","sort":"asc"}#note-4
Kane, T. (2010). The Importance of Startups in Job Creation and Job Destruction, Kauffman
Foundation Research Series: Firm Formation and Economic Growth. http://www.
kauffman. org/uploadedFiles/firm_formation_importance_of_startups. pdf.
23
Ruddy: ACA and Entrepreneurship Lock
Published by Digital Commons @ IWU, 2020

Kleven, H. J. (2016). Bunching. Annual Review of Economics, 8(1), 435–464. doi:
10.1146/annurev-economics-080315-015234
Lee, K. M. (2019). Health Insurance and the Supply of Entrepreneurs: Evidence from the ACA
Medicaid Expansion. Available at SSRN 3462896.
Luo, B., & Chong, T. T. L. (2019). Regional differences in self-employment in China. Small
Business Economics, 53(3), 813-837.
Madrian, B. (1998). The effect of health insurance on transitions to self-employment (No. 98-5).
Chicago-Population Research Center.
Olds, G. (2016a). Entrepreneurship and public health insurance. Harvard Business School.
Olds, G. (2016b). Food stamp entrepreneurs. Harvard Business School.
Parker, S., & Parker, S. (2009). The economics of entrepreneurship . Cambridge, UK ;:
Cambridge University Press.
Pelosi, N. (2010, March). 2010 Legislative Conference for National Association of Counties.
Washington D.C.
Small Business Administration. (2009). The Small Business Economy: A Report to the
President. Retrieved February 6, 2020, from
https://www.sba.gov/sites/default/files/files/sb_econ2009.pdf
Small Business Administration Office of Advocacy. “Frequently Asked Questions.” Small
Business Administration, September 2012.
https://www.sba.gov/sites/default/files/FAQ_Sept_2012.pdf.
Tozzi, J. (2010, March 26). Health Reform Expected to Untether Job-Locked Entrepreneurs.
Retrieved February 6, 2020, from https://www.bloomberg.com/news/articles/2010-03-
25/health-reform-expected-to-untether-job-locked-entrepreneurs
US Census Bureau. (2018, February 8). Business Formation Statistics: A New Census Bureau
Product that Takes the Pulse of Early-Stage U.S. Business Activity. Retrieved April 21,
2020, from https://www.census.gov/newsroom/blogs/research-matters/2018/02/bfs.html
Wellington, A. J. (2001). Health insurance coverage and entrepreneurship. Contemporary
Economic Policy, 19(4), 465-478.
24
Undergraduate Economic Review, Vol. 17 [2020], Iss. 1, Art. 5
https://digitalcommons.iwu.edu/uer/vol17/iss1/5

Appendix
Graph A. Map of States Included in Analysis
25
Ruddy: ACA and Entrepreneurship Lock
Published by Digital Commons @ IWU, 2020
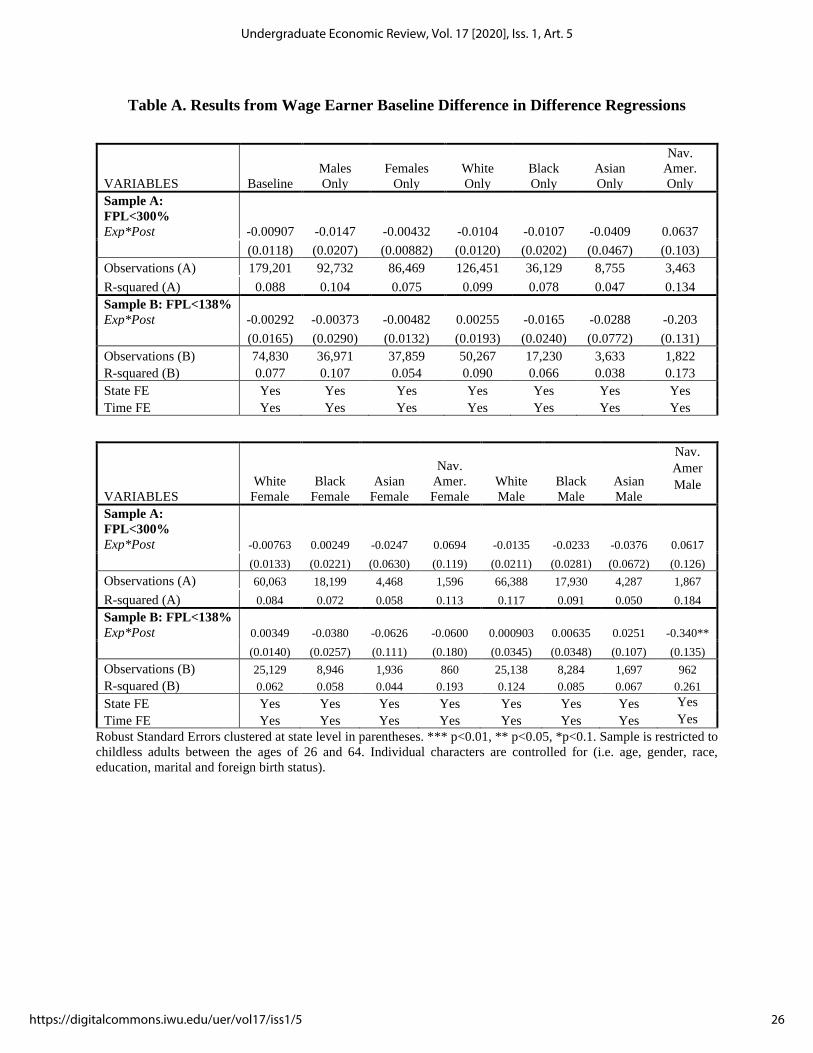
Table A. Results from Wage Earner Baseline Difference in Difference Regressions
VARIABLES Baseline
Males
Only
Females
Only
White
Only
Black
Only
Asian
Only
Nav.
Amer.
Only
Sample A:
FPL<300%
Exp*Post -0.00907 -0.0147 -0.00432 -0.0104 -0.0107 -0.0409 0.0637
(0.0118) (0.0207) (0.00882) (0.0120) (0.0202) (0.0467) (0.103)
Observations (A) 179,201 92,732 86,469 126,451 36,129 8,755 3,463
R-squared (A) 0.088 0.104 0.075 0.099 0.078 0.047 0.134
Sample B: FPL<138%
Exp*Post -0.00292 -0.00373 -0.00482 0.00255 -0.0165 -0.0288 -0.203
(0.0165) (0.0290) (0.0132) (0.0193) (0.0240) (0.0772) (0.131)
Observations (B) 74,830 36,971 37,859 50,267 17,230 3,633 1,822
R-squared (B) 0.077 0.107 0.054 0.090 0.066 0.038 0.173
State FE Yes Yes Yes Yes Yes Yes Yes
Time FE Yes Yes Yes Yes Yes Yes Yes
VARIABLES
White
Female
Black
Female
Asian
Female
Nav.
Amer.
Female
White
Male
Black
Male
Asian
Male
Nav.
Amer
Male
Sample A:
FPL<300%
Exp*Post -0.00763 0.00249 -0.0247 0.0694 -0.0135 -0.0233 -0.0376 0.0617
(0.0133) (0.0221) (0.0630) (0.119) (0.0211) (0.0281) (0.0672) (0.126)
Observations (A) 60,063 18,199 4,468 1,596 66,388 17,930 4,287 1,867
R-squared (A) 0.084 0.072 0.058 0.113 0.117 0.091 0.050 0.184
Sample B: FPL<138%
Exp*Post 0.00349 -0.0380 -0.0626 -0.0600 0.000903 0.00635 0.0251 -0.340**
(0.0140) (0.0257) (0.111) (0.180) (0.0345) (0.0348) (0.107) (0.135)
Observations (B) 25,129 8,946 1,936 860 25,138 8,284 1,697 962
R-squared (B) 0.062 0.058 0.044 0.193 0.124 0.085 0.067 0.261
State FE Yes Yes Yes Yes Yes Yes Yes Yes
Time FE Yes Yes Yes Yes Yes Yes Yes Yes
Robust Standard Errors clustered at state level in parentheses. *** p<0.01, ** p<0.05, *p<0.1. Sample is restricted to
childless adults between the ages of 26 and 64. Individual characters are controlled for (i.e. age, gender, race,
education, marital and foreign birth status).
26
Undergraduate Economic Review, Vol. 17 [2020], Iss. 1, Art. 5
https://digitalcommons.iwu.edu/uer/vol17/iss1/5

Table B. Results from Wage Earners Difference in Difference Regressions with Partisan
Regressors
VARIABLES Baseline
Males
Only
Females
Only
White
Only
Black
Only
Asian
Only
Nav.
Amer.
Only
Sample A:
FPL<300%
Exp*Post -0.00905 -0.0148 -0.00451 -0.00851 -0.0141 -0.0401 0.0538
(0.0123) (0.0219) (0.00802) (0.0128) (0.0208) (0.0487) (0.106)
Republican Governor 0.000591 0.000380 -0.000315 0.00688* -0.0177** -0.00148 -0.0294
(0.00376) (0.00594) (0.00485) (0.00362) (0.00651) (0.0176) (0.0267)
Republican Legislature -0.00610 -0.0120 0.00240 -0.00608 -0.0131 -0.0559 0.0545
(0.0128) (0.0219) (0.0137) (0.0149) (0.0187) (0.0389) (0.0419)
Mixed Legislature -0.00295 -0.00760 0.00250 0.00269 -0.0274* -0.0721*** 0.0375
(0.0124) (0.0164) (0.00960) (0.0141) (0.0148) (0.0229) (0.0372)
Observations (A) 179,201 92,732 86,469 126,451 36,129 8,755 3,463
R-squared (A) 0.088 0.104 0.075 0.100 0.078 0.047 0.134
Sample B: FPL<138%
Exp*Post -0.00312 -0.00488 -0.00431 0.00501 -0.0212 -0.0292 -0.216
(0.0175) (0.0308) (0.0121) (0.0203) (0.0252) (0.0813) (0.136)
Republican Governor 0.00175 0.00167 0.000244 0.00959 -0.0165 -0.00596 -0.0375
(0.00545) (0.00878) (0.00587) (0.00632) (0.0134) (0.0243) (0.0235)
Republican Legislature 0.00923 -0.00417 0.0277 0.0159 -0.0132 -0.112 0.109*
(0.0145) (0.0295) (0.0167) (0.0123) (0.0269) (0.0805) (0.0599)
Mixed Legislature 0.0141 0.0119 0.0174 0.0229* -0.0154 -0.109* 0.0614
(0.0127) (0.0209) (0.0108) (0.0117) (0.0233) (0.0552) (0.0518)
Observations (B) 74,830 36,971 37,859 50,267 17,230 3,633 1,822
R-squared (B) 0.077 0.107 0.054 0.090 0.066 0.039 0.175
State FE Yes Yes Yes Yes Yes Yes Yes
Time FE Yes Yes Yes Yes Yes Yes Yes
27
Ruddy: ACA and Entrepreneurship Lock
Published by Digital Commons @ IWU, 2020

VARIABLES
White
Female
Black
Female
Asian
Female
Nav.
Amer.
Female
White
Male
Black
Male
Asian
Male
Nav.
Amer
Male
Sample A:
FPL<300%
Exp*Post -0.00557 -0.00286 -0.0217 0.0876 -0.0121 -0.0249 -0.0392 0.0382
(0.0138) (0.0235) (0.0612) (0.124) (0.0225) (0.0289) (0.0691) (0.126)
Republican Governor 0.00710 -0.0224** 0.000818 -0.00625 0.00569 -0.0142* -0.00269 -0.0348
(0.00632) (0.00884) (0.0166) (0.0239) (0.00604) (0.00748) (0.0221) (0.0406)
Republican Legislature 0.00552 -0.0145 -0.0578 0.146** -0.0131 -0.00711 -0.0517 -0.0249
(0.0154) (0.0204) (0.115) (0.0581) (0.0254) (0.0245) (0.138) (0.0713)
Mixed Legislature 0.0104 -0.0262** -0.0873** 0.0305 -0.00197 -0.0271 -0.0508 0.0269
(0.0130) (0.0110) (0.0323) (0.0508) (0.0180) (0.0206) (0.0488) (0.0492)
Observations (A) 60,063 18,199 4,468 1,596 66,388 17,930 4,287 1,867
R-squared (A) 0.084 0.072 0.059 0.115 0.117 0.091 0.051 0.185
Sample B: FPL<138%
Exp*Post 0.00779 -0.0448* -0.0617 -0.0124 0.00111 0.00464 0.0272
-
0.370**
(0.0127) (0.0260) (0.112) (0.182) (0.0356) (0.0367) (0.100) (0.142)
Republican Governor 0.0132 -0.0309** -0.00255 0.00681 0.00468 -0.000991 -0.00544 -0.0461
(0.00858) (0.0113) (0.0223) (0.0337) (0.00933) (0.0220) (0.0397) (0.0327)
Republican Legislature 0.0295 0.0190 -0.165 0.270*** 0.00703 -0.0404 -0.0229 0.0104
(0.0236) (0.0309) (0.102) (0.0918) (0.0323) (0.0360) (0.154) (0.112)
Mixed Legislature 0.0279** -0.00970 -0.124* 0.0439 0.0202 -0.0210 -0.0733 0.0574
(0.0111) (0.0238) (0.0642) (0.0585) (0.0203) (0.0315) (0.0975) (0.0796)
Observations (B) 25,129 8,946 1,936 860 25,138 8,284 1,697 962
R-squared (B) 0.062 0.059 0.045 0.202 0.124 0.085 0.068 0.263
State FE Yes Yes Yes Yes Yes Yes Yes Yes
Time FE Yes Yes Yes Yes Yes Yes Yes Yes
Robust Standard Errors clustered at state level in parentheses. *** p<0.01, ** p<0.05, *p<0.1. Sample is restricted to married childless adults between the ages of 26 and 64. Individual characters are controlled for (i.e. age, gender, race, education, marital and foreign birth status).
28
Undergraduate Economic Review, Vol. 17 [2020], Iss. 1, Art. 5
https://digitalcommons.iwu.edu/uer/vol17/iss1/5

Difference in Difference Models with Healthcare Demand
As previously discussed, when examining entrepreneurship lock arising from healthcare
it is critical that healthcare demand is considered to avoid the good job problem.14 Thus, in order
to correctly test if the Medicaid expansion relieved entrepreneurship lock, I use a model that
proxies healthcare demand. The healthcare demand model has the following specification:
Self-Employmentist = αo+β1(ExpS * Postt) + β2(ExpS * Postt*Demist) + Xist + δs + τt + εist
Where everything is the same as the baseline regression but there is the additional interaction
term ExpS * Postt*Demist where Demist is the demand proxy variable. I use two different variables
in Demist. The first is if one’s partner has employer-based health insurance and serves as a
measure for the availability of alternative healthcare. The second is if anyone in the respondent’s
household is reported to have poor health and is a measure of increased expected healthcare
costs.15 The sample used for this specification is further restricted to married childless adults.
This demand model is also based on a similar methodological framework used by Lee (2019).
Using these two different variables to proxy healthcare demand has the additional benefit
providing insight into through which mechanism the Medicaid expansion may have alleviated
entrepreneurship lock. Not having access to partner’s employer-based health insurance measures
the risk channel and poor health status measures the credit constraint channel. If the β2 on either
of these variables is positive and statistically significant, this would suggest that the Medicaid
expansion improved entrepreneurship by reducing this mechanism of entrepreneurship lock.
14 See the discussion of Holtz-Eakin, Penrod, Rosen (1994) in the Literature Review. 15 Since the Affordable Care Act forbid private insurance companies from denying coverage to an applicant because
of pre-existing condition, poor health would not affect one access to alternative healthcare plans. However, since
this person would be in the individual instead of group-based market, they would likely face higher premiums and
total healthcare coverage costs.
29
Ruddy: ACA and Entrepreneurship Lock
Published by Digital Commons @ IWU, 2020

Table C. Spousal Coverage
VARIABLES Baseline
Males
Only
Females
Only
White
Only
Black
Only
Asian
Only
Nav.
Amer.
Only
Sample A:
FPL<300%
Exp*Post -0.0112 -0.0112 -0.0123 -0.00805 -0.0160 -0.0527 -0.00600
(0.0100) (0.0164) (0.0113) (0.0124) (0.0146) (0.0369) (0.0948)
Exp*Post*Spouse 0.0504*** 0.0695*** 0.0320*** 0.0529*** 0.0236* 0.0543*** 0.0619**
(0.00646) (0.0105) (0.00501) (0.00778) (0.0119) (0.0164) (0.0264)
Observations (A) 56,642 27,383 29,259 42,932 7,886 3,723 906
R-squared (A) 0.023 0.017 0.011 0.025 0.019 0.039 0.109
Sample B: FPL<138%
Exp*Post -0.00182 0.000471 -0.00512 -0.000287 0.00822 -0.0659 0.0443
(0.0184) (0.0347) (0.0189) (0.0252) (0.0495) (0.0411) (0.0757)
Exp*Post*Spouse 0.0415*** 0.0583*** 0.0247** 0.0475*** 0.0152 0.0436*** -0.00201
(0.00922) (0.0148) (0.0102) (0.0118) (0.0211) (0.0133) (0.0865)
Observations (B) 19,147 9,205 9,942 14,127 2,724 1,505 380
R-squared (B) 0.028 0.022 0.014 0.029 0.044 0.051 0.202
State FE (A&B) Yes Yes Yes Yes Yes Yes Yes
Time FE Yes Yes Yes Yes Yes Yes Yes
VARIABLES
White
Female
Black
Female
Asian
Female
Nav.
Amer.
Female
White
Male
Black
Male
Asian
Male
Nav.
Amer
Male
Sample A:
FPL<300%
Exp*Post -0.00913 -0.0384* -0.0333 -0.125 -0.00761 0.00232 -0.0859 0.163
(0.0128) (0.0189) (0.0475) (0.0905) (0.0196) (0.0314) (0.0708) (0.158)
Exp*Post*Spouse 0.0318*** 0.0244 0.0361** 0.0464*** 0.0749*** 0.0221 0.0748*** 0.112**
(0.00603) (0.0144) (0.0133) (0.0161) (0.0124) (0.0172) (0.0248) (0.0542)
Observations (A) 22,088 4,056 2,029 457 20,844 3,830 1,694 449
R-squared (A) 0.012 0.019 0.043 0.195 0.020 0.023 0.038 0.160
Sample B: FPL<138%
Exp*Post -0.00231 -0.0153 -0.0282 -0.151** -0.000409 0.0277 -0.0676* 0.216
(0.0254) (0.0325) (0.0632) (0.0588) (0.0418) (0.0971) (0.0373) (0.134)
Exp*Post*Spouse 0.0262** 0.0174* 0.0305** 0.0994 0.0706*** 0.00694 0.0468** -0.0883
(0.0127) (0.00913) (0.0117) (0.0735) (0.0180) (0.0389) (0.0174) (0.256)
Observations (B) 7,278 1,422 825 191 6,849 1,302 680 189
R-squared (B) 0.015 0.041 0.053 0.392 0.024 0.065 0.070 0.381
State FE Yes Yes Yes Yes Yes Yes Yes Yes
Time FE Yes Yes Yes Yes Yes Yes Yes Yes
Robust Standard Errors clustered at state level in parentheses. *** p<0.01, ** p<0.05, *p<0.1. Sample is restricted to
married childless adults between the ages of 26 and 64. Individual characters are controlled for (i.e. age, gender, race,
education, marital and foreign birth status).
30
Undergraduate Economic Review, Vol. 17 [2020], Iss. 1, Art. 5
https://digitalcommons.iwu.edu/uer/vol17/iss1/5

Table D. Poor Health
VARIABLES Baseline
Males
Only
Females
Only
White
Only
Black
Only
Asian
Only
Nav.
Amer.
Only
Sample A:
FPL<300%
Exp*Post 0.0333*** 0.0514*** 0.0154 0.0397*** 0.00363 -0.0143 0.0399
(0.00949) (0.0168) (0.0103) (0.0109) (0.0109) (0.0356) (0.107)
Exp*Post*Health -0.0455*** -0.0658*** -0.0278*** -0.0524*** -0.0154 0.00596 -0.0266
(0.00361) (0.00709) (0.00516) (0.00327) (0.0158) (0.0139) (0.0178)
Observations (A) 56,642 27,383 29,259 42,932 7,886 3,723 906
R-squared (A) 0.023 0.017 0.011 0.026 0.018 0.037 0.107
Sample B: FPL<138%
Exp*Post 0.0400** 0.0600 0.0195 0.0489** 0.0223 -0.0362 0.0479
(0.0177) (0.0358) (0.0147) (0.0237) (0.0306) (0.0419) (0.0680)
Exp*Post*Health -0.0278*** -0.0410*** -0.0159* -0.0337*** -0.00451 0.00841 -0.0165
(0.00711) (0.0123) (0.00874) (0.00812) (0.0215) (0.0107) (0.0722)
Observations (B) 19,147 9,205 9,942 14,127 2,724 1,505 380
R-squared (B) 0.028 0.022 0.014 0.029 0.044 0.050 0.202
State FE Yes Yes Yes Yes Yes Yes Yes
Time FE Yes Yes Yes Yes Yes Yes Yes
VARIABLES
White
Female
Black
Female
Asian
Female
Nav.
Amer.
Female
White
Male
Black
Male
Asian
Male
Nav.
Amer
Male
Sample A:
FPL<300%
Exp*Post 0.0198* -0.0239 -0.00352 -0.116 0.0602*** 0.0290 -0.0395 0.257
(0.0109) (0.0149) (0.0414) (0.0903) (0.0184) (0.0255) (0.0675) (0.180)
Exp*Post*Health -0.0330*** 0.00113 -0.0191 0.0342 -0.0738*** -0.0341 0.0344 -0.0902
(0.00639) (0.0141) (0.0124) (0.0283) (0.00648) (0.0238) (0.0227) (0.0597)
Observations (A) 22,088 4,056 2,029 457 20,844 3,830 1,694 449
R-squared (A) 0.012 0.017 0.042 0.194 0.020 0.024 0.035 0.159
Sample B: FPL<138%
Exp*Post 0.0247 0.00527 -0.00480 -0.101 0.0731 0.0307 -0.0395 0.181
(0.0190) (0.0347) (0.0648) (0.0716) (0.0437) (0.0693) (0.0317) (0.132)
Exp*Post*Health -0.0182 -0.0195** 0.0158 0.0263 -0.0500*** 0.00648 -0.000621 -0.0219
(0.0124) (0.00784) (0.0201) (0.0668) (0.0118) (0.0384) (0.0342) (0.123)
Observations (B) 7,278 1,422 825 191 6,849 1,302 680 189
R-squared (B) 0.015 0.042 0.052 0.385 0.024 0.065 0.069 0.380
State FE Yes Yes Yes Yes Yes Yes Yes Yes
Time FE Yes Yes Yes Yes Yes Yes Yes Yes
Robust Standard Errors clustered at state level in parentheses. *** p<0.01, ** p<0.05, *p<0.1. Sample is restricted to
married childless adults between the ages of 26 and 64. Individual characters are controlled for (i.e. age, gender, race,
education, marital and foreign birth status.
31
Ruddy: ACA and Entrepreneurship Lock
Published by Digital Commons @ IWU, 2020