the 7 may 2001 induced seismic event in the ekofisk oil ... · the 7 may 2001 induced seismic event...
TRANSCRIPT

The 7 May 2001 induced seismic event in the Ekofisk
oil field, North Sea
L. Ottemoller,1 H. H. Nielsen,2 K. Atakan,3 J. Braunmiller,4 and J. Havskov3
Received 10 August 2004; revised 24 June 2005; accepted 7 July 2005; published 6 October 2005.
[1] A moderate size seismic event on 7 May 2001 was strongly felt on platforms inthe Ekofisk oil field, in the southern North Sea, but did not cause damage to platforms orwells. We combined near- and far-field observations to develop a consistent source modeland to determine whether the event was induced. Seismic data placed the epicenterinside the Ekofisk field and suggested a shallow source depth based on spectral andmoment tensor analysis. GPS data from the Ekofisk platforms displayed permanentvertical and horizontal movement due to the event. A topographic bulge in the sea bottom,revealed by differential bathymetry data, and overpressure in the overburden in thenortheastern part of the field, detected only after the event, had been caused byunintentional water injection that started in 1999. The injection pressure and rate weresufficient to raise the overburden. Pressure gauge and compaction data ruled out that theevent occurred at reservoir level, which was further supported by unaffected productionrates and absence of well failure. We therefore conclude that the event occurred in theoverburden, at less than 3 km depth. Initially, this appeared unlikely on account of verylow shear strength of the overburden clay-rich shale and mud rocks. The seismic eventwas induced owing to stress changes caused by water injection. The event possiblyinitiated on the northern flank of the field near the water injector and may have involvedflexure of the overburden into the depression bowl in the rest of the field. Moment tensoranalysis is consistent with a pure double-couple source. We suggest that slip occurredon the near-horizontal rather than along the near-vertical nodal plane. Stress drop was low,and owing to the low overburden shear strength, the event released less energy than atypical stress drop event with similar source dimensions.
Citation: Ottemoller, L., H. H. Nielsen, K. Atakan, J. Braunmiller, and J. Havskov (2005), The 7 May 2001 induced seismic event in
the Ekofisk oil field, North Sea, J. Geophys. Res., 110, B10301, doi:10.1029/2004JB003374.
1. Introduction
[2] On 7 May 2001 at 0943 UT, a seismic event ofmoderate size (Mw = 4.1–4.4) occurred in the southernNorth Sea. The event was strongly felt on platforms andassociated structures within the Ekofisk oil field as tenseconds swaying and trembling. Initial locations placedthe event in the vicinity of the Ekofisk oil field. The locationuncertainties, however, were so large that the event couldhave also occurred inside the field. This, combined with thesevere shaking on the platforms, caused the operator of theEkofisk field, ConocoPhillips Norway, to ask the Universityof Bergen as operator of the Norwegian National SeismicNetwork, to perform a detailed seismic data analysis[Atakan et al., 2001; J. Braunmiller et al., The May 7,2001 earthquake in the Ekofisk area, North Sea, Orfeus
Electronic Newsletter, 3(2), 2001, available at http://www.orfeus-eu.org/newsletter/vol3no2/ekofisk.html]. Asmore data were analyzed, the computed epicenter locationmoved into the Ekofisk field.[3] Seismic recordings were available only from the far
field. With these, we attempted to resolve epicenter location,source depth and mechanism. Macroseismic information onhow the event had been felt on the platforms was collected.Additional near-field measurements on the structures in theEkofisk field included GPS, interplatform distance, pressureand tide gauge observations. The GPS data confirmed theevent location within the outline of the Ekofisk field. Abathymetric survey carried out two months after the eventwas compared with 1999 measurements, allowing theconstruction of a differential bathymetry map. Differentialbathymetry and unusual pressure data from the northernflank of the field hinted at the possibility of the seismicevent being induced. A seismic survey was done in 2003and compared to a previous survey in 1999.[4] This paper links the seismic far-field observations
with the various nonseismic near-field measurements fromthe Ekofisk field. On the basis of these observations, wepresent a model for the processes leading to the seismicevent and discuss a plausible source scenario. Our multi-
JOURNAL OF GEOPHYSICAL RESEARCH, VOL. 110, B10301, doi:10.1029/2004JB003374, 2005
1British Geological Survey, Edinburgh, UK.2ConocoPhillips, Tananger, Norway.3Department of Earth Science, University of Bergen, Bergen, Norway.4Swiss Seismological Service, ETH-Hoenggerberg, Zurich, Switzerland.
Copyright 2005 by the American Geophysical Union.0148-0227/05/2004JB003374$09.00
B10301 1 of 15

disciplinary case study aims to establish whether the seismicevent was induced.
2. Background
2.1. Tectonic Setting and Seismicity
[5] The Ekofisk field is located within the Central Grabenin the southern North Sea (Figures 1 and 2). The CentralGraben is a NW-SE fault-bounded trough that was initiatedduring a major rifting period in the Late Triassic, withcrustal extension continuing through Jurassic times [Pekotand Gersib, 1987]. The Ekofisk reservoir, which lies about3000 m below the seafloor, is a salt-induced, roughlyelliptical anticline structure that is 11.2 km long (N-S) and5.4 km wide (E-W). The Ekofisk and Tor formations at thetop of the 800 m chalk group contain the productiveintervals (Figure 3). The overburden consists largely ofvery fine grained, mechanically weak, clay-rich shalesand mud rocks. These rocks are overpressured (above
hydrostatic) from �1100 m downward due to rapid sedi-mentation and exert a vertical stress of �9000 psi (62 MPa)on the reservoir. The overburden load on the reservoir issupported jointly by the overpressured reservoir fluidsinitially at >7000 psi (48 MPa) at the top of the reservoirand the matrix of the porous chalk.[6] During its geological development, the Ekofisk struc-
ture has been affected by numerous episodes of movementand the reservoir is naturally fractured, facilitating hydro-carbon extraction. Both the uppermost overburden (top1100 m) and the deeper overburden are faulted [Nageland Strachan, 1998]. The vertical extent of faults in thedeeper overburden can reach up to 1 km. In the upperoverburden faulting is laterally extensive, but vertical faultdimensions are less than 50 m [Nagel, 1998]. Fault orien-tation in the deeper overburden are generally NE-SW orNW-SE.[7] Seismicity rates in Norway and the nearby continental
shelf areas are low to intermediate [Bungum et al., 1991]. Insouthwestern Norway, most seismic events are located inthe Norwegian Danish Basin and the coastal areas between56�N and 63�N (Figure 1). The Viking Graben appearsseismically more active than the Central Graben withrespect to both event size and frequency. The largest eventin either graben was the 1927 Ms = 5.3 earthquake in theViking Graben [Bungum et al., 1991]. The regional stresspattern is dominated by the Mid-Atlantic Ridge push force[Bungum et al., 1991; Hicks et al., 2000]. Grollimund etal. [2001] showed that in the Central Graben maximumhorizontal stresses are in NNW-SSE direction, which is
Figure 1. Regional tectonic features and seismicity(circles, same size for all magnitudes) with M � 2.5merged from University of Bergen, British GeologicalSurvey, and International Seismological Centre cataloguesfor the period 1970–2003. The epicenter of the 7 May 2001event is indicated by a star. Four further events in thevicinity of Ekofisk are labeled.
Figure 2. Outline of the Ekofisk and neighboring fieldsand fault lines (data provided by the Norwegian PetroleumDirectorate, 2004). The epicenter of the 7 May 2001 eventis indicated by a star. The dotted line gives the 90%confidence error ellipse.
B10301 OTTEMOLLER ET AL.: INDUCED SEISMIC EVENT IN THE EKOFISK OIL FIELD
2 of 15
B10301

expected to result in strike-slip or reverse faulting. Since1970, few earthquakes have been located by the land-based seismic networks in the vicinity of the Ekofisk field(Figure 1). Epicenter uncertainties of events in this area,based on the arrival times of seismic waves, are about15 km horizontally [Bungum et al., 1991]. Prior to the2001 event, the 1988 ML = 2.5 event was the only eventfelt at the Ekofisk platforms [Macbeth, 1988].
2.2. Ekofisk Production History
[8] Ekofisk, discovered in 1969, is the largest chalk fieldin the North Sea [Pekot and Gersib, 1987; Kvendseth,1988]. Production on the giant Ekofisk oilfield started inJuly 1971. Initially, the hydrocarbon recovery was achievedby natural depletion from 4 wells. Extensive developmentbegan with the commitment to permanent structures in1972. Currently the field is developed with 71 producingwells, 38 water injection wells and 3 gas injection wellslocated on 4 producing platforms and 2 water injectionplatforms. Gas and water injection were implemented assecondary recovery methods. Production has risen continu-ously as a result of the water injection and redevelopment.The Ekofisk field production, with 17.2 � 106 m3 oil and2.7 � 109 m3 gas/yr (figures published by the NorwegianPetroleum Directorate, 2004), is presently close to the initialproduction level, more than 30 years after productionstarted. Injection of drill cuttings into the overburden startedin 1996, after extensive risk and cost evaluation [Nagel andStrachan, 1998].
2.3. Reservoir Compaction and Subsidence
[9] During the natural depletion phase (before 1988),fluid removal from the reservoir reduced the pore pressureand increased the effective stress within the chalk. As aresult of the increased effective stress, the reservoir chalkhas compacted. Before production started, the overburdenwas in pore pressure equilibrium with the reservoir. Thereservoir pressure depletion did not create any significantdepletion of the overburden.[10] The overburden consists of undercompacted weak
shale and mud rocks and thus the compaction is transferredalmost instantaneously to the seafloor as subsidence [Nagel,2001; Chin and Nagel, 2004]. Overburden bridging effects
may have taken place, resulting in a volume of seafloorsubsidence less than the reservoir compaction volumes[Hettema et al., 2002]. In 1984, subsidence of 3 m, with arate of 0.4 m/yr, was discovered in the Ekofisk field [Nagel,1998; Sylte et al., 1999]. In August 2002, the total subsi-dence at the Ekofisk crest had reached 8.26 m. At present,the subsidence rate is 0.1–0.15 m/yr and thus significantlylower than previously.[11] The current, reduced subsidence rate was achieved
through water injection starting in 1987, which led toreservoir repressurization. The Ekofisk water flood wasexpanded in 1992, injection volumes doubled and at presentare 700,000 barrels/d (112,000 m3/d). The current waterinjection rate is higher than off-take rates resulting in afield-wide repressurization.
2.4. Induced Seismicity
[12] Earthquakes are either tectonic, triggered or induced.Here, we consider triggered and induced events as thoserelated to human activity, such as construction of waterreservoirs and hydrocarbon production [Gupta and Chadha,1995; Scholz, 2002]. Triggered events would occur withouthuman activity though later in time, while induced eventsare caused solely by human activity.[13] Induced seismicity at hydrocarbon producing sites
has been attributed to injection [Raleigh et al., 1972] andsubsidence [Kovach, 1974; Yerkes and Castle, 1976].Grasso [1992] presented three mechanisms capable ofgiving rise to induced and triggered events. First, increasedpore pressure due to injection decreases normal stresses andthus fracture occurs following the Coulomb criterion[Scholz, 2002]. This mechanism causes seismic slip withinthe reservoir, typically with magnitudes ML � 3. Second,fluid withdrawal causes a change in pore pressure, whichcauses changes in the geological structure. Stress changesare transferred to the area immediately surrounding thereservoir, where seismic events, typically with ML � 5can occur. Segall [1989] investigated the stress changesinside a poroelastic medium undergoing fluid extraction andexplained how extraction may promote fault slip. Modeledstress changes predict increased horizontal compressionbelow and above the reservoir leading to reverse faulting,and decreased horizontal stresses on the flanks leading to
Figure 3. Section in N-S direction across the Ekofisk field. The Ekofisk and Tor formations (FM) arethe productive layers. The projected well path of 2/4-K-22 is also shown.
B10301 OTTEMOLLER ET AL.: INDUCED SEISMIC EVENT IN THE EKOFISK OIL FIELD
3 of 15
B10301

normal faulting. Third, earthquakes can be caused bymassive load removal during hydrocarbon extraction. Theseevents are seen as crustal adjustments to stress patternchanges.[14] There are numerous examples of induced seismicity
[e.g., Grasso, 1992; Segall, 1989]. Possibly the largesttriggered/induced events (Ms � 7) occurred 1976 and1984 in the Gazli field area, Uzbekistan. Kovach [1974]described subsidence related earthquakes at the Wilmingtonoil field, California, which took place between 1947 and1961. Between 1983 and 1987, three events in California(M = 5.9–6.5) were considered to be related to hydrocar-bon production [Segall, 1985; McGarr, 1991]. Recently,Gomberg and Wolf [1999] discussed the relationshipbetween the 1997 Mw = 4.9 southern Alabama earthquakeand hydrocarbon production.[15] Because of a lack of nearby stations, it has not been
possible to determine whether events near the Ekofisk fieldwere induced. Therefore subsidence at Ekofisk before 2001is considered aseismic, by which we mean that adjustmentsin the overburden were not detected by any seismographnetwork. However, casing deformation in the overburdensuggested that near-horizontal shearing had occurred[Nagel, 1998]. During an 18-day monitoring period in1997, microseismic activity (1800 events with M � �1)was detected from an observation well [Maxwell et al.,1998; Maxwell and Urbancic, 2001]. Most events occurredin the upper part of the reservoir and were attributed toinduced deformation. The few event locations above thereservoir were considered unreliable. This type of inducedactivity falls into the first category [Grasso, 1992]. Themicroseismic activity is a continuous process releasingstress gradually, as, for example, seen in the Renqiu oilfield, China [Genmo et al., 1995].
[16] Since the fall of 2002, a seismic seafloor-monitoringfour-component array has been operating at Ekofisk usingMicro-Electro-Mechanical (MEM) high-resolution sensors.So far, this survey has not revealed any seismic events eitherfrom the reservoir or from the overburden, probably due tohigher noise levels on the seafloor compared to monitoringfrom a well.
3. Seismological Far-Field Observations
[17] The 7 May 2001 Ekofisk event was well recordedon seismic stations with an epicentral distance of 318 to2500 km. Waveform data from more than 150 short-periodand broadband stations were collected. The seismogramswere dominated by long-period signals and P and S waveonsets were difficult to read for any station. This isunusual compared to most earthquakes offshore of theNorwegian coast, which show clear body wave arrivals.
3.1. Epicenter Location
[18] The epicenter determination was based on a total of51 seismic stations with an azimuthal gap of 83� (Figure 4).Event analysis was performed with the SEISAN earthquakeanalysis software [Havskov and Ottemoller, 2001] and thelocation was determined with the HYPOCENTER program[Lienert and Havskov, 1995]. The location program com-putes travel times based on a one-dimensional velocitymodel. Two average velocity models were used for com-parison (auxiliary material1, Table A1). The first model isvalid for southwestern Norway [Havskov and Bungum,1987], while the second model was derived from thevelocity structure determined along the Mona Lisa seismicprofile that crosses the Central Graben south of Ekofisk[Nielsen et al., 2000]. The epicenter determined with thefirst model is at 56.567�N and 3.179�E with an origin timeof 0943:33.8 UT [Atakan et al., 2001]. The formal errors(90% confidence) are 4.7 km in latitude and 7.6 km inlongitude (Figure 2). The 2 km difference between the twomodels is insignificant compared to the uncertainties. Theepicenter was on the northwestern flank of the Ekofisk field.However, the error ellipse covered about two thirds of thefield.[19] In general, source depth determination requires
arrival time data from stations within a focal depth’sdistance. In this case a hypocentral depth could not beresolved, given the shortest hypocenter-station distanceof 318 km. The first arrivals at distances >300 km arecritically refracted waves that travel along the Mohointerface. Additional phases, such as depth phases thatwould help to constrain the depth, could not be identified.
3.2. Source Mechanism
[20] Regional broadband waveforms recorded at distan-ces of 350 to 2200 km (Figure 4) were inverted for theseismic moment tensor and to constrain the hypocentraldepth. Most stations were located in the southeasternquadrant. The only station toward northwest, on Jan MayenIsland, is distant and the travel path crosses continental andoceanic crust. All other paths are entirely within continental
Figure 4. Map of seismic stations used for analyzingthe 7 May 2001 event. The epicenter is given by a star,squares show stations used for moment tensor inversion,and triangles give stations used in epicenter determination.
1Auxiliary material is available at ftp://ftp.agu.org/apend/jb/2004JB003374.
B10301 OTTEMOLLER ET AL.: INDUCED SEISMIC EVENT IN THE EKOFISK OIL FIELD
4 of 15
B10301
crust. We selected stations to cover all directions as evenlyas possible.[21] The method inverts all three-component waveforms
simultaneously by minimizing the least squares misfitbetween observed and synthetic seismograms. We usedthree-component data whenever possible and discardednoisy traces. Earthquake depth is found by grid searchover trial depths. From 2 to 7 km depth the increment is1 km, and below depths of 9 km, it is 3 km. For details,refer to Nabelek and Xia [1995]; for applications toEuropean earthquakes, refer to Braunmiller et al.
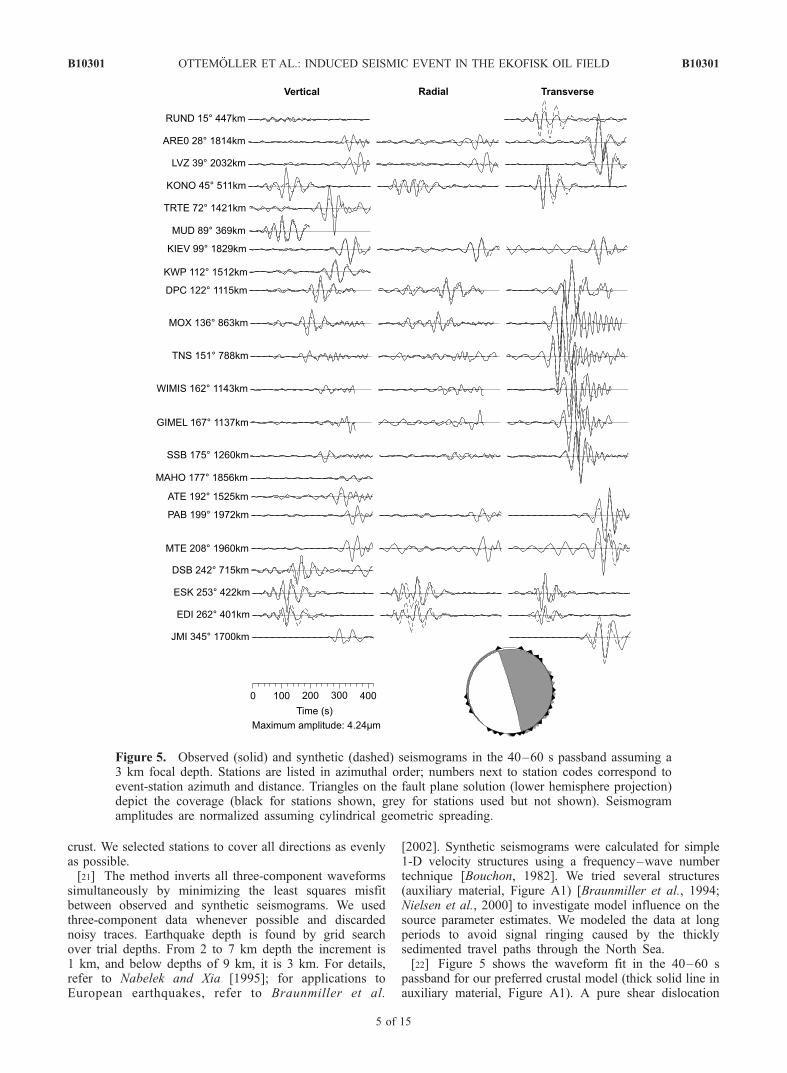
[2002]. Synthetic seismograms were calculated for simple1-D velocity structures using a frequency–wave numbertechnique [Bouchon, 1982]. We tried several structures(auxiliary material, Figure A1) [Braunmiller et al., 1994;Nielsen et al., 2000] to investigate model influence on thesource parameter estimates. We modeled the data at longperiods to avoid signal ringing caused by the thicklysedimented travel paths through the North Sea.[22] Figure 5 shows the waveform fit in the 40–60 s
passband for our preferred crustal model (thick solid line inauxiliary material, Figure A1). A pure shear dislocation
Figure 5. Observed (solid) and synthetic (dashed) seismograms in the 40–60 s passband assuming a3 km focal depth. Stations are listed in azimuthal order; numbers next to station codes correspond toevent-station azimuth and distance. Triangles on the fault plane solution (lower hemisphere projection)depict the coverage (black for stations shown, grey for stations used but not shown). Seismogramamplitudes are normalized assuming cylindrical geometric spreading.
B10301 OTTEMOLLER ET AL.: INDUCED SEISMIC EVENT IN THE EKOFISK OIL FIELD
5 of 15
B10301
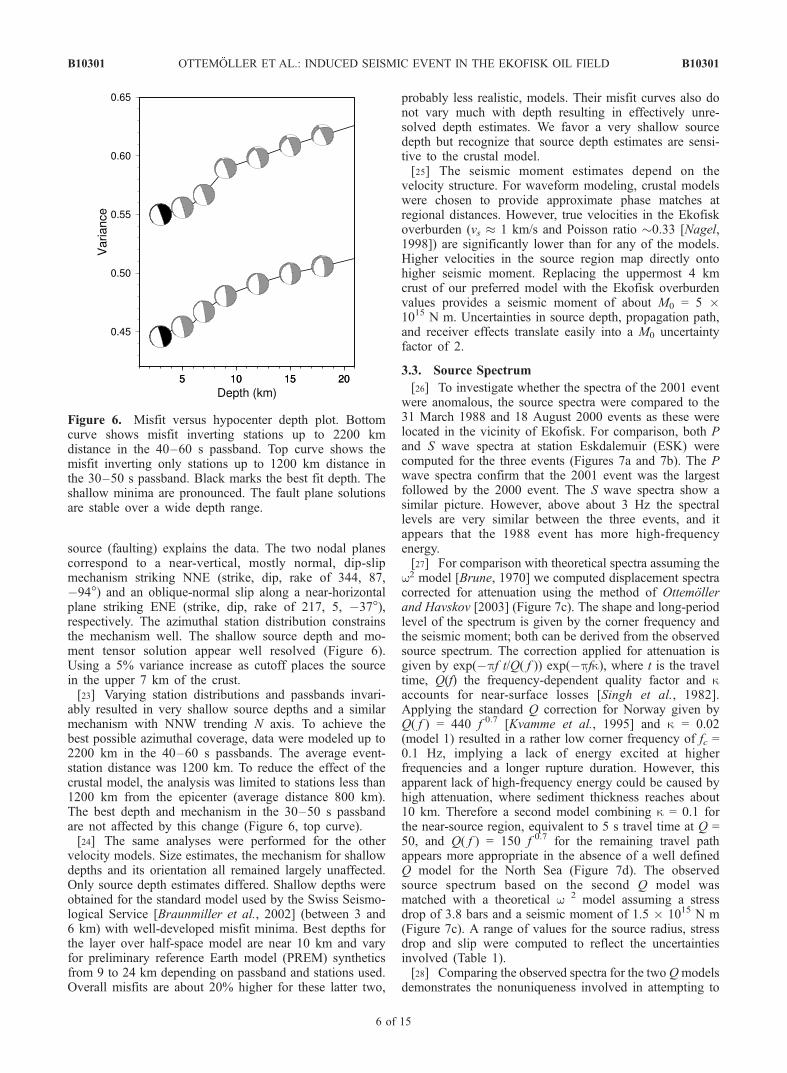
source (faulting) explains the data. The two nodal planescorrespond to a near-vertical, mostly normal, dip-slipmechanism striking NNE (strike, dip, rake of 344, 87,�94�) and an oblique-normal slip along a near-horizontalplane striking ENE (strike, dip, rake of 217, 5, �37�),respectively. The azimuthal station distribution constrainsthe mechanism well. The shallow source depth and mo-ment tensor solution appear well resolved (Figure 6).Using a 5% variance increase as cutoff places the sourcein the upper 7 km of the crust.[23] Varying station distributions and passbands invari-
ably resulted in very shallow source depths and a similarmechanism with NNW trending N axis. To achieve thebest possible azimuthal coverage, data were modeled up to2200 km in the 40–60 s passbands. The average event-station distance was 1200 km. To reduce the effect of thecrustal model, the analysis was limited to stations less than1200 km from the epicenter (average distance 800 km).The best depth and mechanism in the 30–50 s passbandare not affected by this change (Figure 6, top curve).[24] The same analyses were performed for the other
velocity models. Size estimates, the mechanism for shallowdepths and its orientation all remained largely unaffected.Only source depth estimates differed. Shallow depths wereobtained for the standard model used by the Swiss Seismo-logical Service [Braunmiller et al., 2002] (between 3 and6 km) with well-developed misfit minima. Best depths forthe layer over half-space model are near 10 km and varyfor preliminary reference Earth model (PREM) syntheticsfrom 9 to 24 km depending on passband and stations used.Overall misfits are about 20% higher for these latter two,
probably less realistic, models. Their misfit curves also donot vary much with depth resulting in effectively unre-solved depth estimates. We favor a very shallow sourcedepth but recognize that source depth estimates are sensi-tive to the crustal model.[25] The seismic moment estimates depend on the
velocity structure. For waveform modeling, crustal modelswere chosen to provide approximate phase matches atregional distances. However, true velocities in the Ekofiskoverburden (vs � 1 km/s and Poisson ratio �0.33 [Nagel,1998]) are significantly lower than for any of the models.Higher velocities in the source region map directly ontohigher seismic moment. Replacing the uppermost 4 kmcrust of our preferred model with the Ekofisk overburdenvalues provides a seismic moment of about M0 = 5 �1015 N m. Uncertainties in source depth, propagation path,and receiver effects translate easily into a M0 uncertaintyfactor of 2.
3.3. Source Spectrum
[26] To investigate whether the spectra of the 2001 eventwere anomalous, the source spectra were compared to the31 March 1988 and 18 August 2000 events as these werelocated in the vicinity of Ekofisk. For comparison, both Pand S wave spectra at station Eskdalemuir (ESK) werecomputed for the three events (Figures 7a and 7b). The Pwave spectra confirm that the 2001 event was the largestfollowed by the 2000 event. The S wave spectra show asimilar picture. However, above about 3 Hz the spectrallevels are very similar between the three events, and itappears that the 1988 event has more high-frequencyenergy.[27] For comparison with theoretical spectra assuming the
w2 model [Brune, 1970] we computed displacement spectracorrected for attenuation using the method of Ottemollerand Havskov [2003] (Figure 7c). The shape and long-periodlevel of the spectrum is given by the corner frequency andthe seismic moment; both can be derived from the observedsource spectrum. The correction applied for attenuation isgiven by exp(�pf t/Q( f )) exp(�pfk), where t is the traveltime, Q(f) the frequency-dependent quality factor and kaccounts for near-surface losses [Singh et al., 1982].Applying the standard Q correction for Norway given byQ( f ) = 440 f 0.7 [Kvamme et al., 1995] and k = 0.02(model 1) resulted in a rather low corner frequency of fc =0.1 Hz, implying a lack of energy excited at higherfrequencies and a longer rupture duration. However, thisapparent lack of high-frequency energy could be caused byhigh attenuation, where sediment thickness reaches about10 km. Therefore a second model combining k = 0.1 forthe near-source region, equivalent to 5 s travel time at Q =50, and Q( f ) = 150 f 0.7 for the remaining travel pathappears more appropriate in the absence of a well definedQ model for the North Sea (Figure 7d). The observedsource spectrum based on the second Q model wasmatched with a theoretical w 2 model assuming a stressdrop of 3.8 bars and a seismic moment of 1.5 � 1015 N m(Figure 7c). A range of values for the source radius, stressdrop and slip were computed to reflect the uncertaintiesinvolved (Table 1).[28] Comparing the observed spectra for the twoQmodels
demonstrates the nonuniqueness involved in attempting to
Figure 6. Misfit versus hypocenter depth plot. Bottomcurve shows misfit inverting stations up to 2200 kmdistance in the 40–60 s passband. Top curve shows themisfit inverting only stations up to 1200 km distance inthe 30–50 s passband. Black marks the best fit depth. Theshallow minima are pronounced. The fault plane solutionsare stable over a wide depth range.
B10301 OTTEMOLLER ET AL.: INDUCED SEISMIC EVENT IN THE EKOFISK OIL FIELD
6 of 15
B10301

determine spectral parameters. While Q model 1 indicates alow stress drop, Q model 2 explains the lack of higher-frequency energy observed at distances of more than 300 kmthrough high near-source attenuation. The nonuniquenesscould be resolved with near-field data, which do not exist forthe 2001 event. The apparent lack of high frequency energyis also seen when comparing the event size using variousmagnitude scales as described next.
3.4. Event Size
[29] The event size has important implications for eval-uating the response of the infrastructure at Ekofisk from anengineering point of view. The seismic moment determinedfrom the moment tensor inversion, assuming low near-surface shear wave velocities, was M0 = 5 � 1015 N m,whereas a value of M0 = 1.5 � 1015 N m was determined
Figure 7. (a) Displacement spectra for station ESK computed from 25 s P wave signal for the 31 March1988 (red), 18 August 2000 (green), and 7 May 2001 (blue) events. The spectra are not corrected forattenuation. (b) Same as Figure 7a but for S wave signal. (c) S wave displacement spectrum for the 7 May2001 event corrected for two attenuation models, Q1( f ) = 440f 0.7 and k1 = 0.02 (blue) and Q2( f ) =150f 0.7 and k2 = 0.1 (red). The synthetic spectra are for Ds = 3.8 bars, Mo = 1.5 � 1015 N m, Q1( f ) andk1 (red) and Ds = 0.05 bars, Mo = 4.7 � 1014 N m, Q2( f ) and k2. The synthetic spectra illustrate theuncertainties and represent a range of solutions. d) Attenuation factor for the two models Q1( f ) and k1(blue) and Q2( f ) and k2 (red).
Table 1. Range of Source Parameters for Extreme Values of
Corner Frequency fc and Seismic Moment M0a
Parameter Low Seismic Moment High Seismic Moment
M0, N m 4.7 � 1014 1.5 � 1015
fc, Hz 0.1 0.3R, km 3.5 1.2s, bars 0.05 3.8d, cm 6 47
aSource parameters were determined from observed displacementsource spectra (Figure 7). The derived parameters are the source radius(R = 0.35 vs/fc) for a circular fault, the stress drop (s = 0.44 M0/R
3) andthe seismic slip (d = M0/(mpR
2)). The following parameters representativeof the overburden at a depth of about 6000 feet (1829 m) were used[Nagel, 1998]: S wave velocity vs = 1 km/s, density r = 2.2 g/cm3, andshear modulus m = 1 GPa.
B10301 OTTEMOLLER ET AL.: INDUCED SEISMIC EVENT IN THE EKOFISK OIL FIELD
7 of 15
B10301

from the long-period part of the displacement spectrum,assuming high near-source attenuation. The correspondingmoment magnitude [Kanamori, 1977] values are Mw = 4.4and Mw = 4.1, respectively. In addition, three amplitude-based magnitudes were computed. These were the bodywave (mb) measured on P waves [Veith and Clawson,1972], the surface wave (Ms) [Karnik et al., 1962], andthe local magnitude (ML) derived for Norway [Alsaker etal., 1991] measured on Lg waves. The results computed asaverages from several stations were mb = 4.4, Ms = 4.6 andML = 3.0. While mb and Ms are similar to Mw, the ML valueis significantly lower. Compared to the other scales ML ismeasured at higher frequencies, and the low value ofML is due to low excitation at frequencies above 1 Hz.The difference between ML and mb, which is measured at
�1 Hz, could be explained by measuring amplitudes ofdifferent wave types as well as frequency.
4. Near-Field Observations
4.1. GPS, Interplatform Distance, and Tide GaugeMeasurements
[30] Global Positioning System (GPS) monitoring atEkofisk started in 1985 and is used to monitor gradualsubsidence. Since autumn 2000, continuous GPS data wereacquired on the Ekofisk 2/4-H, 2/4-A and 2/4-B platforms(as well as six other locations in the area) using AshtechFX-CORS dual-frequency receivers. The GPS antennas aremounted on a mast about 200 m above the deck of theplatforms. The GPS data normally show the gradual and
Figure 8. Long-term GPS data as recorded on platforms in the Ekofisk field. Permanent changes areseen in the GPS data from platforms 2/4-A, 2/4-B and 2/4-H, which are all located in the central part ofthe Ekofisk field (by courtesy of Statens Kartverk, Norway).
B10301 OTTEMOLLER ET AL.: INDUCED SEISMIC EVENT IN THE EKOFISK OIL FIELD
8 of 15
B10301

continuous changes due to subsidence. Comparison of GPSdata from before and after the 7 May event showed severalcentimeters of static displacement of the antenna on thethree platforms in both vertical and horizontal directions(Figures 8 and 9). The largest displacement was recordedon the centrally positioned Ekofisk 2/4-H platform, while2/4-A and 2/4-B showed less displacement. The apparenthorizontal movement may have been due to a combina-tion of horizontal displacement and localized tilt. A smallchange in tilt would explain large horizontal movementsof the antennas. No displacement was observed fromGPS data recorded on the Eldfisk and West Ekofiskplatforms.[31] Interplatform distance measurements (resolution of
5 mm) immediately after the event did not show anysignificant changes compared to previous measurements.The change in distance between platforms derived fromthe GPS data was about 15 mm and thus smaller than theactual displacement due to the direction of movement andthe geometry of the platforms. It is possible that thechange in distance was not detectable with the interplat-form distance measurements, although the estimated reso-lution suggested otherwise.[32] Water height was measured at the southern and
northern flare bridges, at a distance of about 800 m to thesouth and north from the 2/4-H platform, respectively,through laser tide gauge instruments. These tide gauge datashow large variability and are not routinely analyzed.Specific investigation of the data showed 8 cm permanentdownshift of the flare relative to the sea surface after thetime of the seismic event (the clock of the tide gauge sensorwas not accurately calibrated). The 8 cm vertical dropcompared to water height is consistent with the reported
vertical drop estimated from the GPS data at the 2/4-Hplatform.
4.2. High-Resolution Bathymetric Survey
[33] The seismic data and GPS observations indicated ashallow depth for the seismic event. To investigatewhether the event reached the surface or caused slump-ing, ConocoPhillips carried out a high-resolution (resolu-tion lateral 10 m, vertical ±20 cm) bathymetric surveyover the Ekofisk, West Ekofisk, and Eldfisk fields (Figure 2)2 months after 7 May 2001. The most recent previous surveyin the same area was acquired during the summer of 1999. Adifferential bathymetric map was computed to compare the1999 and 2001 surveys (Figure 10). The map displayssubsidence greater than 40 cm in the southern parts of theEkofisk field, mapping the expected N-S elongated subsi-dence bowl. In contrast, the northern part of the field hasrisen between 1999 and 2001 by about 25 cm. Only minorsubsidence was expected in this part of the field due to lowextraction rates. However, uplift would not be expectedunder normal conditions.[34] Detailed wavelength filtering and Landmark Sobel
edge detection was performed on the 2001 data. Theresulting image with a vertical resolution of <10 cm didnot show any features apart from the pipelines. This resultruled out any slumping or breaking of the sea bottom withdimensions greater than the vertical resolution.
4.3. Pressure Gauge Records and ReservoirCompaction Monitoring
[35] Ten wells had downhole pressure and temperaturegauges working on the Ekofisk field on 7 May 2001. Thegauge data were checked for differences during the event.All wells, except 2/4-X-09 (Figure 10), were on productionand did not show any changes related to the event. Closeinspection of the 2/4-X-09 well that is shut in (nonproduc-ing), showed a small pressure increase of �3 psi (20.7 kPa)at 0945 UT on 7 May [Nielsen, 2003]. This pressureincrease may be the result of the seismic event causingvibration of the gas-oil-water column such that gas libera-tion took place. The pressure is very sensitive to changes inthe fluid composition, and may easily account for theobserved pressure increase [Nielsen, 2003]. Alternatively,a change in the gauge depth relative to the nearest reservoirperforations may contribute to the pressure increase. Apressure increase can be simulated as a change in thehydrostatic pressure caused by a pure distance changebetween the gauge and the nearest reservoir perforation. A3 psi increase in pressure would reflect 7 feet (2.1 m)compaction in the reservoir [Nielsen, 2003]. Compaction ofthis size between the gauge and the reservoir does not matchthe well condition after 7 May, which remained intact.However, it is possible that small-scale compaction hascontributed to the increase in pressure.[36] Several wells in the Ekofisk field were completed
with radioactive markers to routinely measure the reservoircompaction rates [Nagel, 1998]. Abrupt changes in thedistance between these radioactive bullets, seen in Com-paction Monitoring Instrument (CMI) logs, would indicatea deviation from normal reservoir compaction behavior.Compaction rates at the wells 2/4-X-12 and 2/4-C-11Awere as expected and do not explain the pressure change
Figure 9. Horizontal and vertical (in direction of decreas-ing latitude) GPS data displacement vectors for 7 May2001. The horizontal vector for the 2/4-H platformcorresponds to 16 cm; scaling is the same for verticaldirection.
B10301 OTTEMOLLER ET AL.: INDUCED SEISMIC EVENT IN THE EKOFISK OIL FIELD
9 of 15
B10301

at 2/4-X-09 (auxiliary material, Figure A2). The CMI logsare also done for the overburden where they normallyshow no compaction. The expected change on 7 May wasbelow the resolution and therefore not detected.
4.4. Hydrocarbon Extraction and Water Injection
[37] It might be expected that an earthquake of significantsize would impact production performance due to wellfailures. ConocoPhillips therefore closely monitored theproduction well performance after the event to capturespecific areas in the field with abnormal production behav-ior. However, the Ekofisk production performance has notshown any unpredicted behavior.[38] During 2002, while drilling from the northern 2/4-B
platform at two locations (2/4-B17BT4 and 2/4-B17BT2,Figure 10) in the northern flank of the field, abnormallyhigh pressures were observed in the overburden (6000–7000 feet (1830–2130 m) true vertical depth subsea (TVDSS)). This led to reinvestigation of the injectors in that area
and well intervention was performed in several wells toresolve problems. It was found that some of these wells haddeveloped casing deformations. Closer investigation con-firmed that due to a previous reservoir collapse one waterinjector (2/4-K-22, Figure 10) was injecting 15,000 barrels/d (2385 m3/d) cold water into the overburden at a depth of6000–7000 feet TVD SS (1830–2130 m). Minor changesin injectivity, observed in 1999, were now considered to berelated to the start of injection into the overburden. A totalof 12 � 106 barrels (1.9 � 106 m3) of cold water may havebeen injected before the seismic event happened. Since the2001 event, several wells in the northern part of the fieldaround 2/4-K-22 have developed restrictions at a depth of�4500 feet (1372 m). This is shallower than generally seenfor well failure prior to the 2001 event.[39] The overburden injection was considered to be the
cause of the abnormal overburden pressure in its vicinity.The location of 2/4-K-22 coincides with the uplift in thenorthern part of the field seen in the differential bathymetry
Figure 10. Differential bathymetry between the 1999 and 2001 detailed bathymetry surveys. The mapscale is in centimeters. A sea bottom uplift is seen on the northern flank of the field (red). Totalsubsidence data up to 2001 are shown in decimeters by contour lines. The central parts of the field exhibitthe normal subsidence features (blue). The surface projections of wells are indicated by black lines. Theline crossing the field in NNW-SSE direction gives the location of the section shown in Figure 3.Locations of platforms in the Ekofisk complex are plotted on the inset map at a different scale.
B10301 OTTEMOLLER ET AL.: INDUCED SEISMIC EVENT IN THE EKOFISK OIL FIELD
10 of 15
B10301

data (Figure 10). The same area was also identified asshowing areal time differences in the overburden sectionbetween seismic surveys in 1999 and 2003, which werecaused by the overpressure. ConocoPhillips monitorsannulus pressures daily on both production and injectionwells to ensure that production and injectors are not incommunication with nonreservoir formations. The uninten-tional water injection into the overburden from 2/4-K-22was at first not recognized as deviation in the annuluspressures, because the well had a permanent cement blockin the lower parts of the tubing annulus and the leak mostlikely occurred below this cement plug. The cement plugwas considered low risk as it was expected that reservoircollapse and leakage into the overburden would be noticedfrom the injection rate and pressure monitoring. Waterinjection in the leaking well was closed down permanentlyin 2002.
[40] Figure 11 demonstrates that the water injectionpressure was above the minimum horizontal stress derivedfrom leak-off test (LOT) data throughout the entire over-burden, down to the top of the reservoir. The water injectionpressure was thus above fracture pressure in the entireoverburden consequently leading to fracture of the shaleand mud rocks and opening void space for water circulation.From the size of the area that was uplifted (Figure 10) itwas concluded that crack propagation was generally hor-izontal. However, the migrating injected water possiblyalso followed minor vertical faults. The injection pressurewas sufficient to overcome the overburden weight fromabout 7000 feet (2133 m) upward and had the ability to liftthe entire overburden.[41] We also concluded that drill cuttings injection did not
contribute to the uplift (auxiliary material, text 1).
4.5. Macroseismic Observations and the PlatformStructure Assessment
[42] The ground shaking caused by the 7 May event wasfelt by people working on the Ekofisk platforms. A macro-seismic survey was conducted based on the EuropeanMacroseismic Scale (EMS) [Grunthal, 1998; Atakan etal., 2001]. Questionnaires were sent to all platforms thatwere occupied by people at the time of the earthquake. Inaddition to the Ekofisk platforms, information was collectedfrom the neighboring platforms. 33 out of 36 returnedquestionnaires contained sufficient information for evalua-tion (auxiliary material, Table A2). The event was feltstrongly in the central and northern sections of the Ekofiskfield. No information was available from the southernplatforms (e.g., 2/4-A, an unmanned platform). The maxi-mum intensities may have reached as high as VII, but ingeneral intensity VI is consistent throughout the Ekofiskfield. In the Eldfisk and Embla fields in the south the eventwas felt only weakly. Maximum intensities were lower inthe Tor field about 20 km northeast of Ekofisk (Figure 2). Itseems likely that the response of the platform structuresplayed an important role in the way people felt the event.Description of ‘‘swinging’’ was dominant on the platformsthat either have a large mass or are away from the centralstructures (examples are 2/4-K and 2/4-H). Descriptionssuch as ‘‘felt like a collision of a supply boat’’ weredominant in the central parts of the field (examples are2/4-Q, 2/4-C, 2/4-X). In a few cases, the description‘‘difficult to stand up’’ was used which may indicatehigher intensities (i.e., VII) and also support ‘‘swinging’’description (examples are 2/4-C, 2/4-K).[43] On the basis of the above data and the consistency of
results showing maximum intensities of VI in the entireEkofisk field, a positive correlation between the computedepicenter and the highest intensities was established. Thefact that the event was strongly felt only at structures in thecentral part of the Ekofisk field, and more weakly withincreasing distance, suggests a shallow source depth.[44] Detailed mechanical integrity modeling was under-
taken to investigate the effect of the seismic event on theplatform structures. Because of the lack of knowledge ofacceleration levels in the near field, several worst casescenarios were modeled. The modeling revealed poten-tially overstressed parts of the platforms. These parts werethen closely inspected for failure and fatigueness. How-
Figure 11. Pressure gradients for the Ekofisk overburdenand injection pressure at K22. The Ekofisk overburdengradient is less than the 22.6� 103 Pa/m overburden pressureand closer to 20.4 � 103 Pa/m caused by overpressure/undercompaction. The Ekofisk overburden is overpres-sured from 3000 feet (914.4 m) to the top of thereservoir. The injection pressure is the combined result ofthe pressure at the wellhead and the weight of theinjection column. Injection pressure is above leak-off test(LOT) pressure at all overburden levels and from 7500 feet(2286 m) upward above 22.6 � 103 Pa/m lithostaticpressure.
B10301 OTTEMOLLER ET AL.: INDUCED SEISMIC EVENT IN THE EKOFISK OIL FIELD
11 of 15
B10301

ever, no sign of damage to the platform structures wasfound.
5. Discussion
5.1. Unintentional Water Injection
[45] The differential bathymetry map (Figure 10) showedthat the northern flank of the Ekofisk field had beensignificantly uplifted instead of the expected slight subsi-dence. Drilling into the overburden revealed unexpectedlyhigh pressures in the uplifted area. These high pressureswere also seen as time differences between seismicsurveys in 1999 and 2003. The source of the unusualhigh pressures was a water injector that unintentionallyleaked into the overburden. The depth (6000–7000 feet(1828–2134 m) TVD SS) and location (northeasternflank) of the leakage and observed overpressure coincided,suggesting that the uplift was explained by the overburdenbeing hydraulically jacked up. Fracture modeling for theoverburden showed that horizontal fracture growth wouldbe inhibited [Nagel and Strachan, 1998]. However, fromthe observations of overpressure at depth over a substan-tial area, we conclude that horizontal fracturing subse-quently followed by uplift of the overburden had indeedoccurred. Possibly, cold water injection into the veryshaley undercompacted and already overpressured over-burden with horizontal layering temporarily created localsealing capacities and stress conditions, such that thewater, which was continuously injected at a high rate,was trapped under pressures exceeding the overburdenweight.
5.2. Hypocenter Location, Source Dimension, andEvent Size
[46] The epicenter of the 7 May 2001 seismic event, waslocated within the outline of the Ekofisk field. This result,initially derived from seismic far-field data, was confirmedby macroseismic data and GPS observations from platformsin the Ekofisk field. Comparing GPS data from before andafter 7 May revealed that vertical subsidence of up to 8 cmhad taken place. Horizontal displacement of up to 15 cmobserved with GPS data was not confirmed by interplatformdistance measurements, probably because the change indistance between platforms was too small to be resolved.The vertical movement seen on the platforms may be due tocompaction either in the overburden (depth <3000 m) or thereservoir (depth >3000 m). However, pressure gauge andreservoir compaction data, production performance and thelack of well failure showed that compaction associated withthe 7 May event did not occur within the reservoir. Rather,the source was confined to the overburden. The overburdenhas very low shear strength (m < 1 GPa), which, prior to the7 May event, resulted in small-scale horizontal slip asobserved from well failure. The hypothesis of a shallowdepth for the 7 May 2001 event is supported by results fromthe moment tensor inversion. The macroseismic observa-tions also agree with a shallow depth, since a deeper eventwould have been felt on platforms at greater distances.[47] The event dimensions were estimated through spec-
tral analysis. The seismic observations at large distances(>300 km) show a lack of high frequency signal, whichwas probably attributed to a low stress drop, slow rupture
process and high near-source attenuation. The source radiusestimated from the corner frequency was in the range 1.2–3.5 km (Table 1) and gives a maximum source area of38.5 km2, which is almost the size of the Ekofisk field.The location error ellipse (Figure 9) covers more than thenorthern half of the field and considering its dimensions,the source would fit into the northern part including thearea affected by water leakage. Translating seismicmoment and source radius into fault slip gave values of6 to 47 cm (M0 = m Ad, where m = 1 GPa is shearmodulus, A is fault area and d is fault slip). The fact thatthe dense network of wells was not noticeably affected bythe seismic event indicates that movement did not exceed�10 cm. To explain the observed seismic moment thenrequires the larger estimated source radius (R � 3.5 km).[48] The upper limit for stress drop was estimated as s =
3.8 bars, while the lower limit was given by s = 0.05 bars.Uncertainties in stress drop are large, but either way, thestress drop was significantly below the interplate average of30 bars [Kanamori, 1975]. The moment magnitude scale isbased on the relation between energy and seismic momentfor a constant stress drop (30 bars), while in fact energy isproportional to the product of stress drop and seismicmoment [Kostrov, 1974] and thus dependent on stress drop.The 7 May event (Mw = 4.1–4.4) therefore did not releaseas much energy as a typical stress drop event of that size.The model of a low stress drop event is supported by theinspection of platform structures that did not reveal any signof damage, possibly due to the lack of high frequencyenergy. The interpretation as shallow low stress drop eventis similar to the Wilmington subsidence earthquakes[Kovach, 1974]. There, slip occurred on near-horizontalplanes above the reservoir. The Willmington events, similarto the Ekofisk event, while generating emergent body wave,excited surface waves strongly.
5.3. Model of the Source Processes
[49] The exact nature of what happened before and duringthe seismic event on the northern flank remained unre-solved, since bathymetry and pressure measurements areavailable only for 1999 and the period after 7 May.However, it is likely that the seismic event would not haveoccurred without unintentional water leakage, because shearstrength in the overburden is low and no previous sizableseismic event associated with overburden compaction hasbeen observed. The overburden stress pattern was altered bywater injection, but we expect that the stress changes due toreservoir compaction are of importance in understanding thesource mechanism. The expected horizontal stress pattern inthe overburden (Figure 12) due to reservoir compaction iscompression in the center of the subsidence bowl andtension on the flanks [Segall, 1989]. The high pore pressure,caused by water injection into the overburden, reduced theeffective normal stress and according to the Coulomb failurecriterion [e.g., Scholz, 2002] facilitated movement due tohorizontal shear stresses, which are concentrated over theedge of the reservoir [Nagel, 1998]. Additionally, the over-pressured zone was weakened horizontally. It thereforeseems likely that slip initiated in the overpressured areaon the northern flank above a depth of about 7000 feet(2134 m) TVD SS. Uplift and overpressure were observedafter 7 May 2001, and thus changes during the seismic
B10301 OTTEMOLLER ET AL.: INDUCED SEISMIC EVENT IN THE EKOFISK OIL FIELD
12 of 15
B10301

event were not resolved. It is also unclear if and why small-scale slippage was inhibited before the event. Permanentdisplacement seen on the platforms 2/4-A, 2/4-B and 2/4-Hfrom GPS data required that larger parts of, or even theentire, Ekofisk overburden were involved, unless they wereexplained in terms of elastic deformation. The overburdenmay have flexured coseismically into the subsidence bowl
involving both horizontal and vertical motion, leading to thedisplacement seen on the platforms. This setting of theoverburden was triggered by failure of the overpressuredarea. Future stress modeling would help to quantify theproblem. However, detailed knowledge of physical proper-ties in the overburden, beyond what is known at present,would be required.
Figure 12. Schematic overview of stress distribution and expected movement in the overburden due toreservoir compaction, not taking into account unintentional water injection (following Segall [1989])(Figure 6). In Figure 12a, arrows show expected stress pattern, compression near the center of thesubsidence bowl, and extension on the flanks. Contour lines represent subsidence; straight lines givelocation of sections given in Figures 12b and 12c, which are taken across the area affected byunintentional water leakage from 2/4-K-22 (well path shown) indicated by the ellipse at depth of about6000–7000 feet. Expected orientation of slip planes and direction of shear motion along overburdencross sections are indicated by beach balls, which is normal on the flanks and reverse in the center,respectively [Segall, 1989]. The vertical scale is exaggerated by a factor of �2.
B10301 OTTEMOLLER ET AL.: INDUCED SEISMIC EVENT IN THE EKOFISK OIL FIELD
13 of 15
B10301

[50] The seismic signal in the far field is the superpositionof movement that may have occurred on several slippageplanes; the moment tensor solution reveals the dominantslip orientation and direction. The two nodal planes fromthe moment tensor inversion are near horizontal and nearvertical. Even considering the lower estimate for sourceradius of �1 km, it seems difficult to fit the source onto asingle near-vertical plane in the overburden without reach-ing the surface or the reservoir. More likely, the sourceradius was larger, which practically rules out a singlenear-vertical fault plane. This leaves the predominantlynear-horizontal solution, which is possible as seen from near-horizontal casing failure, combined with small-scale verticalmovement. Horizontal slippage was facilitated by increasedpore pressure due to water injection into clay-rich shales.Even the larger source radius (R = 3.5 km) can easily beaccommodated within the overburden if it is oriented hori-zontally. The moment tensor solution showed normal slip ofthe northwest dipping near-horizontal plane, which agreeswith the expected sense of motion on the northwesternflank (Figure 12). The near-horizontal plane would alsomatch the setting of the overburden on the northeasternflank. However, this solution, with the hanging wallmoving W-NW, is not supported by the GPS data, indicat-ing platform movement to the east. Normal movement onthe near-vertical plane in the northwestern area wouldagree with both GPS data and the moment tensor solution.Alternatively, the GPS data may reflect flexure of theoverburden into the subsidence bowl, with displacementdown and to the center of the field. Direction of displace-ment of the platforms in the center of the field would havebeen different from the northeastern flank. Because of theapparent mismatch of the moment tensor solution and GPSmeasurements, it is not clear where in the overburden thedominant seismic energy release occurred.[51] One of the key objectives of this work was to
investigate whether the event was induced. Knowledge ofthe source location and source process of the setting withinthe overburden implies that the event was induced. Withoutunintentional water injection into the overburden at thenorthern flank, the event most likely would not haveoccurred as seen by the preceding 30 years of aseismicsubsidence. Pressures remained high and the overburdenuplifted after the 7 May event, but since the centraloverburden has been compacted and the unintentional waterinjection has stopped, it appears unlikely that a similar eventwould occur in the near future.[52] An important outcome from this study is that earth-
quakes with Mw > 4 can occur at shallow depth withinpoorly consolidated and overpressured mud and shalerocks. Generally, such rocks are considered to be weakand to deform aseismically. The results from this worksuggest that some of the strain in weak shallow rocks canbe seismogenic.
6. Conclusion
[53] The combination of near- and far-field observationsallowed us to develop a model for the processes leading tothe 7 May 2001 seismic event at Ekofisk. Far-field seismicdata suggested that the event occurred near the Ekofiskfield at shallow depth. Fully resolved hypocenter param-
eters, however, would require near-field data, which werenot available. Such near-field data will be of importance toaccurately locate any future similar seismic event else-where. Our main results are as follows:[54] 1. The event occurred within the outline of the
Ekofisk field as shown by GPS measurements and macro-seismic observations on the platforms and the hypocenterlocation.[55] 2. The source was confined to the overburden, since
sudden compaction seen as seafloor subsidence in the GPSdata did not occur within the reservoir as ruled out bycompaction log data.[56] 3. Slip, most likely on a near-horizontal plane, was
facilitated by increased pore pressure in the overburden onthe northern flank due to unintentional water injection,which led to the overburden being jacked up. However,slip may have taken place on a near-vertical plane.[57] 4. The event probably initiated on the northern flank
and spread to the rest of the field leading to flexure of theoverburden into the subsidence bowl. In the center of thefield, up to 8 cm vertical subsidence were observed fromboth GPS and tide gauge measurements.[58] 5. Because of the location in the overburden and the
event’s relation to unintentional water injection on thenorthern flank, we conclude that the event was induced.[59] 6. The source radius of the event was on the order of
1–4 km with Mw = 4.1–4.4. The event was strongly felt onthe platforms. However, it did not cause any damage tostructures in the Ekofisk field. The apparent lack of high-frequency seismic energy in the far field was caused by thecombination of low stress drop and high attenuation in thesource region. The energy released by the source at highfrequencies remains uncertain.
[60] Acknowledgments. The authors thank ConocoPhillips Norwayand their PL018 coventurers Total E&P Norge AS, Eni Norge A/S, NorskHydro Produksjon a.s, Petoro AS, and Statoil ASA, for permission topublish the results of this study. The figure showing GPS data was providedby Statens Kartverk, Norway. We thank all seismological observatories thatmade their data available for use in this study. We appreciate the reviewcomments by Joan Gomberg and two anonymous reviewers. Comments byDave Long, David Kerridge, Brian Baptie, and Russ Evans helped toimprove the manuscript. This paper is published with the permission of theExecutive Director of the British Geological Survey (NERC).
ReferencesAlsaker, A., R. Kvamme, R. A. Hansen, A. Dahle, and H. Bungum (1991),The ML scale in Norway, Bull. Seismol. Soc. Am., 81, 379–398.
Atakan, K., L. Ottemoller, S. L. Jensen, J. Braunmiller, and A. Ojeda(2001), The Ekofisk seismic event of May 7th, 2001, technical report,Inst. of Solid Earth Phys., Univ. of Bergen, Bergen, Norway.
Bouchon, M. (1982), The complete synthesis of seismic crustal phases atregional distances, J. Geophys. Res., 87, 1735–1741.
Braunmiller, J., T. Dahm, and K.-P. Bonjer (1994), Source mechanism ofthe 1992 Roermond earthquake from surface-wave inversion of regionaldata, Geophys. J. Int., 116, 663–672.
Braunmiller, J., U. Kradolfer, M. Baer, and D. Giardini (2002), Regionalmoment tensor determination in the European-Mediterranean area—Initial results, Tectonophysics, 356, 5–22.
Brune, J. N. (1970), Tectonic stress and the spectra of seismic shear wavesfrom earthquakes, J. Geophys. Res., 75, 4997–5009.
Bungum, H., A. Alsaker, L. B. Kvamme, and R. A. Hansen (1991), Seis-micity and seismotectonics of Norway and nearby continental shelf areas,J. Geophys. Res., 96, 2249–2265.
Chin, L. Y., and N. B. Nagel (2004), Modeling of subsidence and reservoircompaction under waterflood operation, Int. J. Geomech., 4, 28–34.
Genmo, Z., C. Huaran, M. Shuqin, and Z. Deyuan (1995), Research onearthquakes induced by water injection in China, Pure Appl. Geophys.,145, 59–68.
B10301 OTTEMOLLER ET AL.: INDUCED SEISMIC EVENT IN THE EKOFISK OIL FIELD
14 of 15
B10301

Gomberg, J., and L. Wolf (1999), Possible cause for an improbable earth-quake: The 1997 MW4.9 southern Alabama earthquake and hydrocarbonrecovery, Geology, 27, 367–370.
Grasso, J.-R. (1992), Mechanics of seismic instabilities induced by therecovery of hydrocarbons, Pure Appl. Geophys., 139, 507–534.
Grollimund, B., M. D. Zoback, D. J. Wiprut, and L. Arnesen (2001), Stressorientation, pore pressure and least principal stress in the Norwegiansector of the North Sea, Pet. Geosci., 7, 173–180.
Grunthal, G. (Ed.) (1998), European Macroseismic Scale (EMS98), Cah.Cent. Eur. Geodyn. Seismol., 15, Cons. de l’Eur., Luxembourg.
Gupta, H. K., and R. K. Chadha (1995), Induced seismicity, Pure Appl.Geophys., 145(1), topical volume.
Havskov, J., and H. Bungum (1987), Source parameters for earthquakes inthe northern North Sea, Nor. Geol. Tidsskr., 67, 51–58.
Havskov, J., and L. Ottemoller (2001), Seisan: The earthquake analysissoftware for Windows, Solaris and Linux, version 7.2, technical report,Inst. of Solid Earth Phys., Univ. of Bergen, Bergen, Norway.
Hettema, M., E. Papamichos, and P. Schutjens (2002), Subsidence delay:Field observations and analysis, Oil Gas Sci. Technol., 57, 443–458.
Hicks, E. C., C. D. Lindholm, and H. Bungum (2000), Stress inversionof earthquake focal mechanism solutions from onshore and offshoreNorway, Nor. Geol. Tidsskr., 80, 235–250.
Kanamori, H. (1975), Theoretical basis of some empirical relations in seis-mology, Bull. Seismol. Soc. Am., 65, 1073–1095.
Kanamori, H. (1977), The energy release in great earthquakes, J. Geophys.Res., 82, 2981–2987.
Karnik, V., N. V. Kondorskaya, Y. V. Riznichenko, Y. F. Savarensky, S. L.Soloviev, N. V. Shebalin, J. Vanek, and A. Zapotek (1962), Standardi-sation of the earthquake magnitude scales, Stud. Geophys. Geod., 6,41–48.
Kostrov, B. (1974), Seismic moment and energy of earthquakes, andseismic flow of rock, Izv. Acad. Sci. USSR Phys. Solid Earth, Engl.Transl., 1, 23–40.
Kovach, R. L. (1974), Source mechanisms for Wilmington oil field,California, subsidence earthquakes, Bull. Seismol. Soc. Am., 64,699–711.
Kvamme, L. B., R. A. Hansen, and H. Bungum (1995), Seismic-source andwave-propagation effects of Lg waves in Scandinavia, Geophys. J. Int.,120, 525–536.
Kvendseth, S. S. (1988), Giant Discovery: A History of Ekofisk Through theFirst 20 Years, Phillips Pet. Co., Norway.
Lienert, B. R., and J. Havskov (1995), Hypocenter 3.2: A computer pro-gram for locating earthquakes locally, regionally and globally, Seismol.Res. Lett., 66, 26–36.
Macbeth, C. D. (1988), Focal parameters of 31 March 1988, Ekofisk earth-quake measured using waveform matching, Tech. Rep. WL/88/22C, Br.Geol. Surv., Edinburgh, U.K.
Maxwell, S. C., and T. I. Urbancic (2001), The role of passive micro-seismic monitoring in the instrumented oil field, Leading Edge, 20,636–639.
Maxwell, S. C., R. P. Young, R. Bossu, A. Jupe, and J. Dangerfield (1998),Microseismic logging of the Ekofisk reservoir, in Eurock’98, SPE/ISRMRock Mechanics in Pretroleum Engineering, Trondheim, Norway,pp. 387–393, Soc. of Pet. Eng., Richardson, Tex.
McGarr, A. (1991), On a possible connection between three major earth-quakes in California and oil production, Bull. Seismol. Soc. Am., 81,948–970.
Nabelek, J., and G. Xia (1995), Moment-tensor analysis using regionaldata: Application to the 25 March, 1993, Scotts Mills, Oregon, earth-quake, Geophys. Res. Lett., 22, 13–16.
Nagel, N. B. (1998), Ekofisk field overburden modelling, in Eurock’98,SPE/ISRM Rock Mechanics in Pretroleum Engineering, Trondheim, Nor-way, pp. 177–186.
Nagel, N. B. (2001), Compaction and subsidence issues within the petro-leum industry: From Wilmington to Ekofisk and beyond, Phys. Chem.Earth, 26, 3–14.
Nagel, N. B., and K. J. Strachan (1998), Implementation of cuttings rein-jection at the Ekofisk field, in Eurock’98, SPE/ISRM Rock Mechanics inPretroleum Engineering, Trondheim, Norway, pp. 95–103.
Nielsen, H. H. (2003), Reservoir and geoscience analysis of the 7th may2001 seismic event in the Ekofisk area, technical report, ConocoPhillips,Tananger, Norway.
Nielsen, L., N. Balling, B. H. Jacobsen, and MONA LISAWorking Group(2000), Seismic and gravity modelling of crustal structure in the CentralGraben, North Sea: Observations along MONA LISA profile 3, Tecto-nophysics, 328, 229–244.
Ottemoller, L., and J. Havskov (2003), Moment magnitude determinationfor local and regional earthquakes based on source spectra, Bull. Seismol.Soc. Am., 93, 203–214.
Pekot, L. J., and G. A. Gersib (1987), Ekofisk, in Geology of the NorwegianOil and Gas Fields, edited by A. M. Spencer et al., pp. 73–87, Grahamand Trotman, London.
Raleigh, C. B., J. H. Healy, and J. D. Bredehoeft (1972), Faulting andcrustal stress at Rangely, Colorado, in Flow and Fracture of Rocks,Geophys. Monogr. Ser., vol. 16, edited by H. C. Heard et al., pp. 275–284, AGU, Washington, D. C.
Scholz, C. H. (2002), The Mechanics of Earthquakes and Faulting, 2 ed.,Cambridge Univ. Press, New York.
Segall, P. (1985), Stress and subsidence resulting from subsurface fluidwithdrawal in the epicentral region of the 1983 Coalinga earthquake,J. Geophys. Res., 90, 6801–6816.
Segall, P. (1989), Earthquakes triggered by fluid extraction, Geology, 17,942–946.
Singh, S. K., R. J. Apsel, J. Fried, and J. N. Brune (1982), Spectral attenua-tion of SH-waves along the Imperial fault, Bull. Seismol. Soc. Am., 72,2003–2016.
Sylte, J. E., L. K. Thomas, D. W. Rhett, D. D. Bruning, and N. B. Nagel(1999), Water induced compaction in the Ekofisk Field, paper SPE 56426presented at the 1999 SPE Annual Technical Conference and Exhibition,Soc. of Pet. Eng., Houston, Tex.
Veith, K. F., and G. E. Clawson (1972), Magnitude from short periodP-wave data, Bull. Seismol. Soc. Am., 62, 435–452.
Yerkes, R. F., and R. O. Castle (1976), Seismicity and faulting attributableto fluid extraction, Eng. Geol., 10, 151–167.
�����������������������K. Atakan and J. Havskov, Department of Earth Science, University of
Bergen, Allegaten 41, Bergen, N-5007, Norway.J. Braunmiller, Swiss Seismological Service, ETH-Hoenggerberg/HPP
P 12.1, CH-8093 Zurich, Switzerland.H. H. Nielsen, ConocoPhillips, P.O. Box 220, N-4056 Tananger, Norway.L. Ottemoller, British Geological Survey, Murchison House, West Mains
Road, Edinburgh EH9 3LA, UK. ([email protected])
B10301 OTTEMOLLER ET AL.: INDUCED SEISMIC EVENT IN THE EKOFISK OIL FIELD
15 of 15
B10301