the 2020-2023 business cycle - mheda.org · 1 the 2020-2023 business cycle brian beaulieu ceo &...
TRANSCRIPT

Economic Outlook: The 2020-2023 Business Cycle
Presented by
Brian Beaulieu
Monday, May 6
1:30 p.m. – 2:30 p.m.
Sponsored by

1
The 2020-2023 Business Cycle
BRIAN BEAULIEUCEO & CHIEF ECONOMIST
First in Forecasts Since 1948
ITR Economics provides the best economic intelligence to reducerisk and drive practical and profitable business decisions.
2018 Forecast ResultsIf you heard ITR around two years prior… 2
Duration Accuracy
US GDP 24 99.9%
US Ind. Production 34 99.4%
Europe Ind. Production 24 99.2%
Canada Ind. Production 27 97.1%
China Ind. Production 30 99.9%
Retail Sales 28 99.6%
Housing (Single Family Units) 26 99.2%
Employment (Private Sector) 30 99.4%

2
First in Forecasts Since 1948
3-Month Moving Average 3/12 Rate-of-ChangeQuarter-over-Quarter Growth Rate
• . • Phase: • Quarter-over-Quarter:
2019:
2020:
2021:
ITROutlook
US Economy Stalls in 2019 and Into 2020US Gross Domestic Product, SAAR, Chained 2012 $
US Gross Domestic Product
$18.8 trillionB
3.0%
0.9%
1.8%
1.3%
Source: BEA
12
14
16
18
20
12
14
16
18
20
2006 2008 2010 2012 2014 2016 2018 2020 2022 2024-6
-4
-2
0
2
4
6
-6
-4
-2
0
2
4
6
2006 2008 2010 2012 2014 2016 2018 2020 2022 20242019: 0.9%2020: 1.8%2021: 1.3%2022: -1.1%2023: 2.1%
First in Forecasts Since 1948
Manage the Business Cycles to Maximize ProfitsUS Industrial Production to Gross Domestic Product
-6.9%
-2.9%-5.2%
-15.5%
3.2%
-16
-12
-8
-4
0
4
8
12
-16
-12
-8
-4
0
4
8
12
'82 '84 '86 '88 '90 '92 '94 '96 '98 '00 '02 '04 '06 '08 '10 '12 '14 '16 '18 '20 '22 '24
GDPUS IP
GDP
US IP
Sources: FRB, BEAYear-over-Year, Quarter-to-Quarter (3/12)

3
First in Forecasts Since 1948
Availability is a Huge AdvantageWorld Natural Gas Production by Region
Source: IEABillion Cubic Meters
Producers bcm
% of World Total
United States 760 20.2
Russia 694 18.4
Iran 214 5.7
Canada 184 4.9
Qatar 169 4.5
China 142 3.8
Norway 128 3.4
Australia 105 2.8
Algeria 94 2.5
Saudi Arabia 94 2.5
Rest of World 1,184 31.3
World 3,768 100
First in Forecasts Since 1948
Freed Up Money Likely Not going to CapexUS Corporate Tax Rate and Gross Business Investment
0%
10%
20%
30%
40%
50%
60%
70%
0%
10%
20%
30%
40%
50%
60%
70%
'60 '64 '68 '72 '76 '80 '84 '88 '92 '96 '00 '04 '08 '12 '16 '20
Corporate Tax Rate %
Gross Business Investment (% of GDP)
Linear (Gross Business Investment (% of GDP))
Sources: Tax Policy Center, FREDPercent
6

4
First in Forecasts Since 1948
Global Issues• Business Cycle
• Tariffs
First in Forecasts Since 1948
Trade Stress Becomes Acute on the Downside of the CycleWorld Industrial Production Index to G7 Leading Indicator
-6
-4
-2
0
2
4
6
-15
-10
-5
0
5
10
15
'92 '94 '96 '98 '00 '02 '04 '06 '08 '10 '12 '14 '16 '18 '20 '22
World IP
Indicator
IndicatorWorld IP
1/1212/12
Sources: CPB Netherlands Bureau For Economic Policy Analysis, OECDRates-of-Change
Fair Trade
Competition

5
First in Forecasts Since 1948
Brands That Have or Will Be Increasing Prices Due to Tariffs
Source: Business Insider, “These popular brands say Trump's tariffs will force them to raise prices”
TOYOTAWHIRLPOOLCOCA-COLAWINNEBAGOMILLER COORSSAMUEL ADAMSCAMPBELL SOUPLG ELECTRONICSGENERAL MOTORSKLEENEX & HUGGIESPOLARIS INDUSTRIESNEWELL BRANDS (Crock-pot, Rubbermaid, Yankee Candle, & Sharpie)
“I can't just go to the shareholders and say, 'You're just going to have to accept my profit's going to be $40 million less. It doesn't work that way…”
- Gavin Hattersley, CEO MillerCoors
First in Forecasts Since 1948
Neighbors, Trade Partners, Economically LinkedUS Industrial Production Index to Canada Industrial Production
2.4%
-15
-10
-5
0
5
10
15
-15
-10
-5
0
5
10
15
'82 '84 '86 '88 '90 '92 '94 '96 '98 '00 '02 '04 '06 '08 '10 '12 '14 '16 '18 '20 '22 '24
Canada IPUS IP
US
Canada
Source: FRB, Statistics Canada
12/12 Rates-of-Change
6
First in Forecasts Since 1948
-15
-10
-5
0
5
10
15
-15
-10
-5
0
5
10
15
'99 '00 '01 '02 '03 '04 '05 '06 '07 '08 '09 '10 '11 '12 '13 '14 '15 '16 '17 '18 '19 '20 '21 '22 '23
Production C$ - 12/12
Production C$ Forecast - 12/12
Indicator - Monthly
IndicatorProduction C$
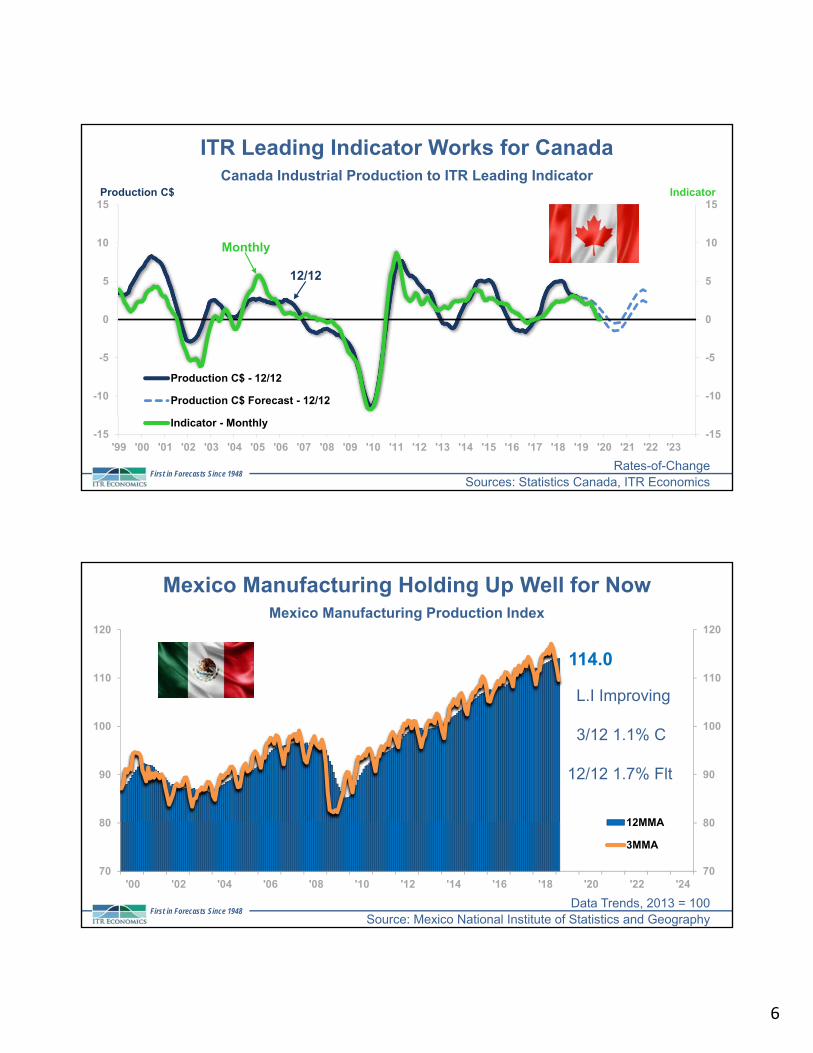
ITR Leading Indicator Works for CanadaCanada Industrial Production to ITR Leading Indicator
Sources: Statistics Canada, ITR EconomicsRates-of-Change
Monthly
12/12
First in Forecasts Since 1948
Mexico Manufacturing Holding Up Well for NowMexico Manufacturing Production Index
114.0
70
80
90
100
110
120
70
80
90
100
110
120
'00 '02 '04 '06 '08 '10 '12 '14 '16 '18 '20 '22 '24
12MMA
3MMA
Source: Mexico National Institute of Statistics and GeographyData Trends, 2013 = 100
L.I Improving
3/12 1.1% C
12/12 1.7% Flt
7
First in Forecasts Since 1948
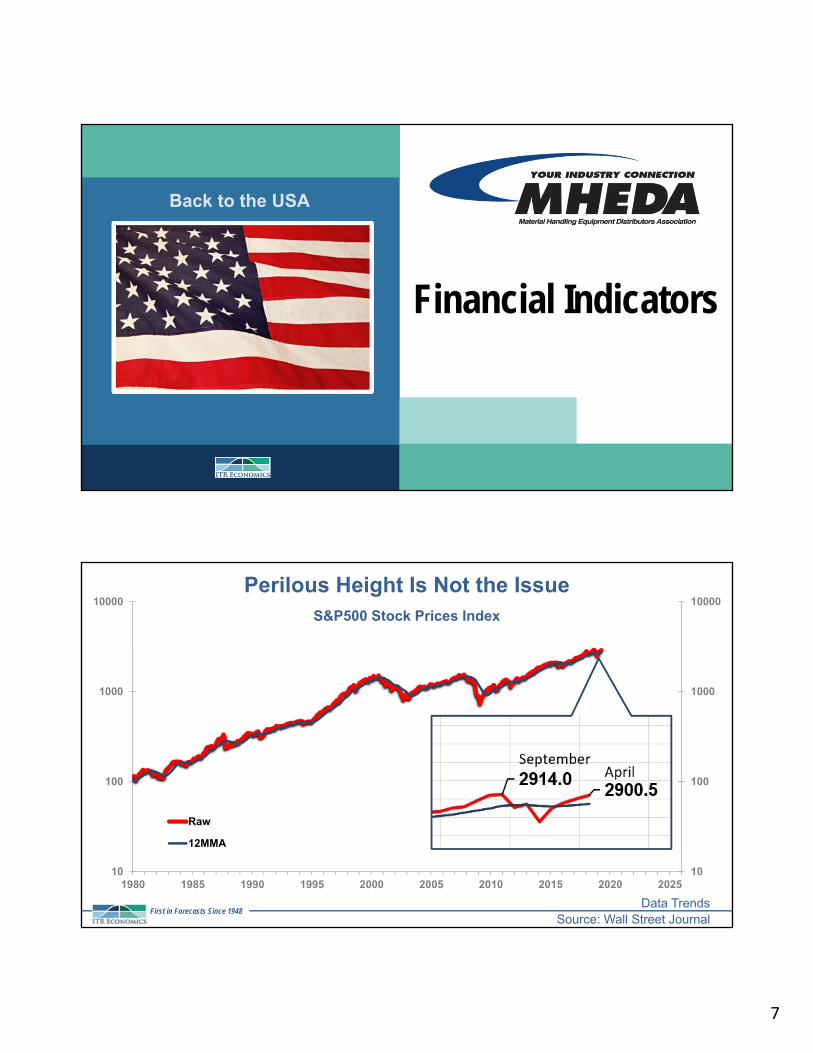
Financial Indicators
Back to the USA
First in Forecasts Since 1948
10
100
1000
10000
10
100
1000
10000
1980 1985 1990 1995 2000 2005 2010 2015 2020 2025
Raw
12MMA
Perilous Height Is Not the Issue S&P500 Stock Prices Index
Source: Wall Street JournalData Trends

8
First in Forecasts Since 1948
TSX is Leading Canada’s General EconomyCanada Industrial Production to Canada Stock Price TSX Composite Index
-60
-40
-20
0
20
40
60
-15
-10
-5
0
5
10
15
'99 '00 '01 '02 '03 '04 '05 '06 '07 '08 '09 '10 '11 '12 '13 '14 '15 '16 '17 '18 '19 '20 '21 '22 '23
Production C$ - 12/12
Production C$ Forecast - 12/12
Stock Price - 3/12
Stock PriceProduction C$
3/12
12/12
Sources: Statistics Canada, The EconomistRates-of-Change
First in Forecasts Since 1948
US Mortgage Rate Will Be Heading Higher After this CycleUS 30-Year Mortgage Rate
0
1
2
3
4
5
6
7
8
0
1
2
3
4
5
6
7
8
'07 '08 '09 '10 '11 '12 '13 '14 '15 '16 '17 '18 '19
Source: Wall Street Journal30-Year, Percent
9
First in Forecasts Since 1948
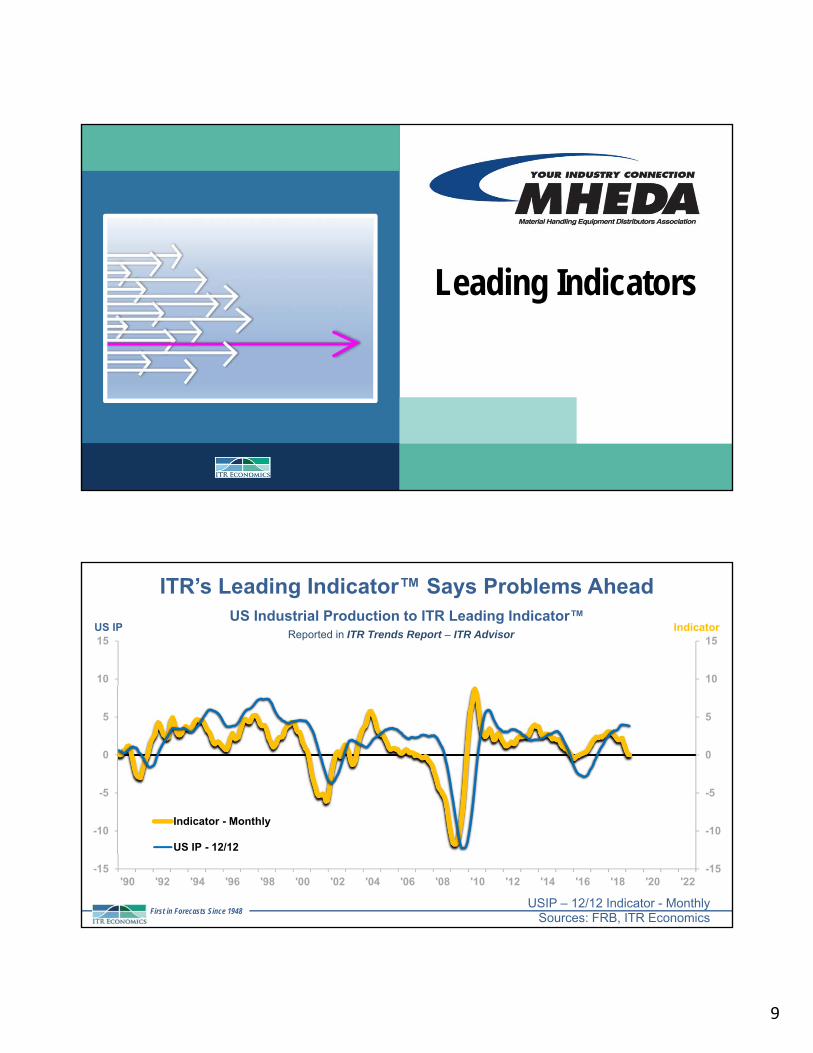
Leading Indicators
First in Forecasts Since 1948
ITR’s Leading Indicator™ Says Problems AheadUS Industrial Production to ITR Leading Indicator™
-15
-10
-5
0
5
10
15
-15
-10
-5
0
5
10
15
'90 '92 '94 '96 '98 '00 '02 '04 '06 '08 '10 '12 '14 '16 '18 '20 '22
IndicatorUS IP
Indicator - Monthly
US IP - 12/12
Sources: FRB, ITR EconomicsUSIP – 12/12 Indicator - Monthly
Reported in ITR Trends Report – ITR Advisor

10
First in Forecasts Since 1948
Leading Indicator System is a Powerful ToolUS Industrial Production Index to Leading Indicators
-60
-40
-20
0
20
40
60
-15
-10
-5
0
5
10
15
'94 '96 '98 '00 '02 '04 '06 '08 '10 '12 '14 '16 '18 '20 '22
US IP - 12/12US IP ForecastG7 Indicator - 1/12PMI - 1/12Wilshire Market Cap - 3/12JP Morgan Indicator - 3/12
PMI, Wilshire, G7US IP, JP Morgan
Sources: FRB, OECD, ISM, Yahoo Finance, IHS MarkitRates-of-Change
First in Forecasts Since 1948
Copper is Also Signaling a Slowdown in SpendingUS Copper Futures Prices to
US Nondefense Capital Goods New Orders(excluding aircraft)
-4.0%
5.3%
-30
-20
-10
0
10
20
-150
-100
-50
0
50
100
'00 '02 '04 '06 '08 '10 '12 '14 '16 '18 '20 '22 '24
Capital GoodsCopper
Copper Futures Prices
Capital Goods
Sources: WSJ, Census Bureau12/12 Rates-of-Change

11
First in Forecasts Since 1948
Searching for a RecessionITR Retail Sales Leading Indicator to US Retail Sales’ 12/12
Sources: Google, US Census BureauRates-of-Change (Search Interest has a 16 month lead time)
-24
6
36
66
96
126-12
-8
-4
0
4
8
'06 '08 '10 '12 '14 '16 '18 '20 '22 '24
Retail Sales
Retail Sales - 12/12
Search Interest - 3/12
3/12
12/12
Search Interest
First in Forecasts Since 1948
Industry Drivers
Photo by ELEVATE from Pexels

12
First in Forecasts Since 1948
Slowing Rise IndicatedUS Warehouse Buildings Construction
4.6%
11.3%
$34.1
0
10
20
30
40
50
60
-160
-120
-80
-40
0
40
80
'00 '02 '04 '06 '08 '10 '12 '14 '16 '18 '20 '22 '24
MMTR-O-C
3/12 12/12
3MMT 12MMT
Source: Census BureauBillions of Dollars
First in Forecasts Since 1948
General Weakness Through 2019North America Light Vehicle Production
-1.2%-0.4%
16.9
5
10
15
20
25
30
35
-120
-90
-60
-30
0
30
60
'00 '02 '04 '06 '08 '10 '12 '14 '16 '18 '20 '22 '24
MMTR-O-C
3/1212/12
3MMT
12MMT
Source: Wards AutoMillions of Units

13
First in Forecasts Since 1948
Slowdown But No BreakdownUS Food and Beverage Stores Retail Sales
1.4%2.6%
745.0
400
500
600
700
800
900
1000
-12
-9
-6
-3
0
3
6
'00 '02 '04 '06 '08 '10 '12 '14 '16 '18 '20 '22 '24
MMTR-O-C
3/12 12/12
3MMT12MMT
Source: Census BureauBillions of Dollars
First in Forecasts Since 1948
Good Long-Term FundamentalsUS Chemicals & Products Production Index
2.6%3.7%
101.1
70
90
110
130
150
170
-40
-30
-20
-10
0
10
'00 '02 '04 '06 '08 '10 '12 '14 '16 '18 '20 '22 '24
MMAR-O-C
3MMA12/12
12MMA
3/12
Source: FRB2012 = 100

14
First in Forecasts Since 1948
Utilization Providing a Negative SignalUS Material Handling Equipment New Orders to US Manufacturing Capacity Utilization
8.7%0.2%
-20
-10
0
10
20
-50
-25
0
25
50
'00 '02 '04 '06 '08 '10 '12 '14 '16 '18 '20 '22 '24
Capacity Util.New Orders
New Orders 12/12
Capacity Util. 1/12
1/12
12/12
Source: US Census Bureau, FRBRates-of-Change
First in Forecasts Since 1948
Dragged Down by Weakness in the Automotive MarketNorth America Value of Robotics Shipments
Source: Robotic Industries AssociationBillions of Dollars
-24.3%-11.1%
$1.7 bils
0.2
1.2
2.2
3.2
4.2
5.2
-150
-100
-50
0
50
100
'00 '02 '04 '06 '08 '10 '12 '14 '16 '18 '20 '22
MMTR-O-C
3/12 12/12
3MMT 12MMT

15
First in Forecasts Since 1948
The Long ViewProsperity in the Age of Decline
First in Forecasts Since 1948
A Model for the FutureUS Industrial Production Index
2
4
6
8
10
12
2
4
6
8
10
12
'20 '21 '22 '23 '24 '25 '26 '27 '28 '29 '30 '31 '32 '33 '34 '35 '36 '37 '38 '39 '40
12MMA3MMA
12MMA
3MMA
Great Depression
Roaring 20s (3 recessions)
Source: FRBData Trends

16
First in Forecasts Since 1948
@ITROutlook
#CEOInsights
@ITROutlook
#CEOInsights
90 Day Trial OfferReceive monthly updates on the economy
Text TR TRIAL to 444999 for a 90 day trial of our
Trends Report