thai farmed shrimp seafood watch report - seachoice
TRANSCRIPT

Seafood Watch Seafood Report
Farmed Pacific white shrimp
Litopenaeus vannamei
© Scandinavian Fishing Yearbook/www.scandfish.com
Thailand
Final Report September 1, 2010
Irene Tetreault Miranda, Ph.D. Independent Contractor
Farmed Imported Marine Shrimp: Thailand September 2010
1
About Seafood Watch® and the Seafood Reports
Monterey Bay Aquarium’s Seafood Watch® program evaluates the ecological sustainability of wild-caught and farmed seafood commonly found in the United States marketplace. Seafood Watch® defines sustainable seafood as originating from sources, whether wild-caught or farmed, which can maintain or increase production in the long-term without jeopardizing the structure or function of affected ecosystems. Seafood Watch® makes its science-based recommendations available to the public in the form of regional pocket guides that can be downloaded from www.seafoodwatch.org. The program’s goals are to raise awareness of important ocean conservation issues and empower seafood consumers and businesses to make choices for healthy oceans. Each sustainability recommendation on the regional pocket guides is supported by a Seafood Report. Each report synthesizes and analyzes the most current ecological, fisheries and ecosystem science on a species, then evaluates this information against the program’s conservation ethic to arrive at a recommendation of “Best Choices”, “Good Alternatives” or “Avoid”. The detailed evaluation methodology is available upon request. In producing the Seafood Reports, Seafood Watch® seeks out research published in academic, peer-reviewed journals whenever possible. Other sources of information include government technical publications, fishery management plans and supporting documents, and other scientific reviews of ecological sustainability. Seafood Watch® Research Analysts also communicate regularly with ecologists, fisheries and aquaculture scientists, and members of industry and conservation organizations when evaluating fisheries and aquaculture practices. Capture fisheries and aquaculture practices are highly dynamic; as the scientific information on each species changes, Seafood Watch®’s sustainability recommendations and the underlying Seafood Reports will be updated to reflect these changes. Parties interested in capture fisheries, aquaculture practices and the sustainability of ocean ecosystems are welcome to use Seafood Reports in any way they find useful. For more information about Seafood Watch® and Seafood Reports, please contact the Seafood Watch® program at Monterey Bay Aquarium by calling 1-877-229-9990. Disclaimer Seafood Watch® strives to have all Seafood Reports reviewed for accuracy and completeness by external scientists with expertise in ecology, fisheries science and aquaculture. Scientific review, however, does not constitute an endorsement of the Seafood Watch® program or its recommendations on the part of the reviewing scientists. Seafood Watch® is solely responsible for the conclusions reached in this report. Seafood Watch® and Seafood Reports are made possible through a grant from the David and Lucile Packard Foundation.

Farmed Imported Marine Shrimp: Thailand September 2010
2
Table of Contents
I. Executive Summary………………………………………………………………… 3 Common Acronyms and Terms …………………………………………………… 9
II. Introduction………………………………………………………………................ 10 III. Analysis of Seafood Watch Sustainability Criteria for Wild-caught Species.....…... 25
Criterion 1: Use of Marine Resources…………………………………………... 27 Criterion 2: Risk of Escaped Shrimp to Wild Stocks…………………………… 31 Criterion 3: Risk of Disease and Parasite Transfer to Wild Stocks…………….. 35 Criterion 4: Risk of Pollution and Habitat Effects……………………………… 43 Criterion 5: Effectiveness of the Management Regime………………………… 56
IV. Overall Recommendation and Seafood Evaluation……………………................... 61 Acknowledgements…………………………………………………………………57
V. References………………………………………………………………………….. 63
Annex 1 – Seafood Watch Methodology ………………………………….……..... 71 Annex 2 – Charoen Pokphand Food Public Company Ltd. (CP) Farms ………….. 85 Annex 3 - Thailand National Certifications from the Department of Fisheries……. 87 Annex 4 – Historical Mangrove Forest Area and Land Use……………………...... 98

Farmed Imported Marine Shrimp: Thailand September 2010
3
I. Executive Summary Shrimp is the single most valuable seafood commodity in both the United States and international markets. The US imported more than half a million metric tons of all types of shrimp (wild-caught, farmed, marine and freshwater) in 2009, worth US$3.8 billion. Almost 35% of these shrimp were from Thailand, making it the single largest supplier of shrimp to the US market. Total farmed shrimp production in Thailand was approximately 470,000 metric tons sourced from 25,000 active farms in 2008. Previously, imported farmed shrimp, including those from Thailand, received an “Avoid” recommendation from Seafood Watch®. This report updates the recommendation for Thailand only. Background Information: The Thai Shrimp Farming Industry At the turn of the century, the shrimp farming industry in Southeast Asia was plagued by disease-related production problems and a very poor environmental image. Since then, production in SE Asia has undergone considerable changes including (and perhaps particularly) in Thailand. Most notably, Thai shrimp farmers have moved from raising almost exclusively tiger shrimp, Penaeus monodon (98% of total shrimp production in 2000), to growing white shrimp (Litopenaeus vannamei) almost exclusively (over 99% in 2008). The switch from farming native tiger shrimp to non-native white shrimp increased production because white shrimp grow more efficiently, tolerate a greater range of salinities, and are more easily domesticated and spawned in captivity. More recently, continuing disease problems have required limiting water exchange during production to improve biosecurity. Typical production systems have advanced from open ponds that exchange water with the environment daily to ponds that recycle water or otherwise reduce their exchange during production. Approximately 80% of Thailand’s shrimp farms now use reduced water exchange systems, a trend that has yet to be replicated on any scale in other shrimp producing regions in SE Asia or Central America. These changes to shrimp production in Thailand relate to various aspects of the Seafood Watch Criteria, particularly for risks to wild stocks from diseases and escaped shrimp, discussed in the paragraphs below. Despite improvements in limiting water discharges to the environment, major environmental concerns remain for Thai shrimp production. Some of the greatest concerns arise from water discharges, disposal of pond-bottom sludge and impacts on mangrove habitats. Although Thailand’s Department of Fisheries considers 80% of the industry to use “closed system” methods, many of these farms still discharge water (with its attendant nutrients, chemicals and escaping shrimp) at harvest and then refill their ponds for the next production cycle. The remaining 20% of farms still use the older method of exchanging water (sometimes daily) during the production cycle. In this report, the 20% of farms using such older methods are described as “Frequent Exchange Systems” (see the Glossary below). Of the 80% of farms using reduced water exchange systems, there are two types: 1) “Harvest Exchange Systems” that discharge water to the environment only once per production cycle at harvest, and 2) “Infrequent Exchange Systems” that treat and maintain the same body of water for more than one production cycle without discharge to the environment, even during harvest. Approximately 25% of farmed shrimp in Thailand are produced using Infrequent Exchange Systems.

Farmed Imported Marine Shrimp: Thailand September 2010
4
Although it is not likely that consumers will be able to make distinctions regarding shrimp farm production systems, major seafood buyers can choose shrimp from the more environmentally sustainable Infrequent Exchange Systems. Risk of Pollution and Habitat Effects Perhaps the most controversial aspect of the global shrimp farming industry’s rapid development, particularly in Thailand, has been the destruction of mangrove forests and other sensitive wetlands during the construction, operation and expansion of shrimp farms. Today, mangrove destruction is illegal, replanting efforts continue, and there are reports that total mangrove cover has increased. The improvements in awareness and protection of mangrove forests in Thailand are noteworthy; however, concerns regarding the health of replanted mangroves, pollution, habitat alteration and abandoned shrimp farms remain. Many shrimp farms in Thailand are located in or adjacent to sensitive coastal and mangrove habitats. As white shrimp tolerate low salinity waters, Thailand’s shrimp industry has also expanded further inland to riparian habitat. Reducing water exchange with the external environment offers the potential to reduce pollution, particularly with Infrequent Exchange Systems. Settling ponds are increasing being used to partially treat effluent during production and harvest. Retention of water during the production cycle is also on the rise. However, only 25% of shrimp are farmed using Infrequent Exchange Systems, and local and regional degradation caused by shrimp farming activities continues to occur in Thailand. In addition, there is still a pollution concern from all Thai shrimp farms due to the need for appropriate disposal of sludge from both settling and production ponds. Pond development and abandonment, shrimp pond effluent, and improper sludge disposal negatively impact local and regional environments in various ways: loss of sensitive habitats (especially mangrove forests), nutrient and chemical pollution, sedimentation, soil and groundwater salinization, and changes in hydrology. Despite improvements in farming practices, the risk of pollution and habitat damage remains a “high” conservation concern for Thailand. Risk of Escaped Shrimp to Wild Stocks The potential risks from introduced non-native species include competition for resources and loss of biodiversity, among others. In Thailand (and in SE Asia in general), there is currently no evidence of negative impacts on wild shrimp stocks from escaped farmed non-native white shrimp; however, this is a poorly researched topic. The presence of L. vannamei in the Bangkapong River in eastern Thailand attests to the fact that farmed shrimp do escape and can survive in local conditions. Recent studies strongly suggest that L. vannamei may have or may soon establish self-sustaining populations. In addition, based on food competition tests, researchers have shown that white shrimp outcompete native shrimp species in the wild. Thailand’s move toward reduced water exchange also reduces the opportunity for farmed shrimp to escape, but there is always the risk of escapes from ponds, particularly during harvest but also from catastrophic losses due to dyke failures, floods, storms or tsunamis. Even Harvest Exchange Systems that discharge water to the environment only twice a year (on a semi-annual production cycle) still present significant opportunities for numerous non-native shrimp to escape, especially

Farmed Imported Marine Shrimp: Thailand September 2010
5
with very high culture densities. As a result of these problems, Frequent and Harvest Exchange Systems are considered a “high” conservation risk. Infrequent Exchange Systems still have the potential for escapes (from flood or dyke failure, etc.), but present fewer opportunities because they do not discharge water to the environment over multiple cycles; these systems are considered a “moderate” concern. Risk of Disease and Parasite Transfer to Wild Stocks In addition to the risk of competition with wild stocks from escaped animals, non-native shrimp also bring the risk of introducing not only native but also novel diseases or parasites to wild stocks. While both native and non-native diseases have spread rapidly among shrimp farms, there is currently no evidence of disease impacts on wild shrimp resulting from Thai shrimp farms. Such evidence is inherently difficult to detect, however, and much more is currently known about how diseases affect farmed shrimp than their impacts on wild crustaceans. Despite improvements in the use of pathogen-free postlarvae and in biosecurity in general, viruses are still present in Thai shrimp farms, and disease outbreaks continue to occur. Although non-native viruses have been detected in wild shrimp, it is important to note that the presence of a virus does not necessarily indicate clinical disease. Despite the lack of clear evidence for disease retransmission from farms to wild stocks, a precautionary approach is warranted because disease outbreaks have historically been devastating to the shrimp farming industry, and viruses have been know to travel between farms around the globe. These factors generally suggest a “high” conservation concern for the risk of retransmitting disease to wild crustaceans from farmed shrimp. Exceptions to this high risk include operations using Infrequent Exchange Systems, which are considered a “moderate” conservation concern as they do not discharge water to the environment over multiple cycles, thereby reducing the risk of spreading disease to wild shrimp. Use of Marine Resources Marine resource use in the form of fishmeal and fish oil in Thailand is typical of farmed shrimp globally, with a WI:FO (wild fish in to farmed shrimp out) ratio of 1.7, which is considered a “moderate” concern according to Seafood Watch criteria. This criterion is assessed on a mass basis, but due to the volume of production in Thailand and other countries, a “moderate” value of 1.7 still represents an enormous use of natural resources (both marine and terrestrial feed ingredients) across the industry, and Seafood Watch urges further progress in minimizing the use of external feed sources. Management Effectiveness Shrimp farming in Thailand is a large-scale industry producing commodity food products and yet is dominated by small-scale producers. The industry has made improvements over time, and the regulatory structure and codes of practice for aquaculture appear robust, although it is not always clear how effectively they are implemented and enforced. The movement toward reduced water exchange in shrimp ponds (with reported 80% compliance) provides benefits including increased biosecurity, decreased risk of passing disease to wild crustaceans and reduced opportunities for escapes. Increased biosecurity results from stocking ponds with disease-free or disease-resistant postlarvae as well as using sophisticated laboratory analyses to detect the presence of viruses. Movement Documents are required for all aspects of the industry, resulting in increased

Farmed Imported Marine Shrimp: Thailand September 2010
6
traceability and rapid responses to disease outbreaks. Also, some form of effluent treatment is reported for 80% of Thai shrimp farms. Along with these recent advances, new challenges have also arisen. Enforcing regulations at many small farms is difficult. The density of high-intensity shrimp farms causes local and regional habitat damage and pollution impacts. Mangrove forest restoration does not replace the ecosystem value of the original forests. Key environmental issues such as therapeutant release to the environment, non-lethal predator controls and ecosystem management are addressed in the national Thai Code of Conduct. However, this Code is voluntary and currently there is minimal compliance. Alternatively, community-based organizations are important for creating and enforcing better management practices. For these reasons, management effectiveness is considered a “Moderate” conservation concern. Summary This assessment evaluates the ecological sustainability of the shrimp farming industry in Thailand; it focuses on key environmental impacts of shrimp farming and does not investigate any social or economic issues. This report acknowledges that the Thai shrimp farming industry has changed considerably in recent years, both in terms of the species of shrimp cultivated and the dominant production methods. Thailand’s shrimp farming capacity is very large and regional concentrations of farms are often high, making shrimp farming in Thailand an industrial-scale, intensive commodity food production system. Many changes to Thailand’s shrimp farming industry are positive, but environmental concerns continue, particularly regarding habitat alteration, pollution and the risks posed to wild stocks from escapes and disease. Overall, production systems that discharge water twice a year at harvest (Harvest Exchange Systems) and those that also discharge water during the production cycle (Frequent Exchange Systems) pose a high risk of impacts from escaping non-native shrimp, native and non-native diseases, pollution and habitat damage. Production systems that maintain and reuse water without discharging to the environment over multiple production cycles (Infrequent Exchange Systems) still pose severe risks for habitat alteration and pollution, but pose only a moderate risk to wild stocks from escapes and disease. The final Seafood Watch ranking for Thai farmed shrimp is thus split into two recommendations:
For those seafood buyers able to identify and source shrimp from production systems that maintain, treat and reuse water over more than one production cycle without discharges to the external environment (Infrequent Exchange Systems, approximately 25% of farmed production), the overall ranking is “Yellow – Good Alternative.”
When it is not possible to confirm that shrimp come from Infrequent Exchange farms that maintain the same volume of water over multiple production cycles, the overall ranking remains “Red – Avoid.”
Consumers may not be able to identify the specific production practices for sources of Thai farmed shrimp. However, major buyers who are able to make this distinction will now be able to source ‘Yellow’ farmed shrimp from these more sustainable Infrequent Exchange Systems in Thailand, which will encourage better practices in the future.

Farmed Imported Marine Shrimp: Thailand September 2010
7
Evaluations of farmed shrimp from other countries can be found at www.montereybayaquarium.org. Pocket guide note: It is sometimes necessary to consolidate Seafood Watch recommendations for consumer pocket guides to best reflect the product available in the U.S. seafood market.

Farmed Imported Marine Shrimp: Thailand September 2010
8
Table of Sustainability Ranks
Conservation Concern Sustainability Criteria Low Moderate High Critical
Use of Marine Resources √ Risk of Escaped Fish to Wild Stocks
√ Infrequent Exchange Systems*
√ Frequent AND Harvest Exchange
Systems†
Risk of Disease and Parasite Transfer to Wild Stocks
√ Infrequent Exchange Systems
√ Frequent AND Harvest Exchange
Systems
Risk of Pollution and Habitat Effects √
Management Effectiveness √ * Infrequent Exchange Systems: Production systems that do not discharge any water to the environment over more than one production cycle. † Frequent Exchange Systems: Production systems that discharge water to the environment during the production cycle, as well as during harvest. Harvest Exchange Systems: Production systems that discharge water to the environment only during harvest. About the Overall Seafood Recommendation:
• A species receives a recommendation of “Best Choice” if: 1) It has three or more green criteria and the remaining criteria are not red.
• A species receives a recommendation of “Good Alternative” if:
1) Criteria “average” to yellow 2) There are four green criteria and one red criterion.
• A species receives a recommendation of “Avoid” if:
1) It has a total of two or more red criteria 2) It has one or more Critical Conservation Concerns.
Overall Seafood Recommendation:
Frequent Exchange Systems Best Choice Good Alternative Avoid Harvest Exchange Systems Infrequent Exchange Systems Best Choice Good Alternative Avoid

Farmed Imported Marine Shrimp: Thailand September 2010
9
Common Acronyms and Terms BMP Better Management Practices
BOD Biological Oxygen Demand
CoC Thai Code of Conduct for Responsible Shrimp Aquaculture
CP Charoen Pokphand Food Public Company Ltd. DOF Thailand Department of Fisheries
GAP Good Aquaculture Practices
GLOBAL G.A.P. Global Partnership for Good Agriculture Practices
FAO Food and Agriculture Organization of the United Nations
FCR or eFCR economic Feed Conversion Ratio
HDPL High Density Plastic Liner
IHHNV Infectious Hypodermal and Haematopoietic Necrosis Virus N Nitrogen
NACA Network of Aquaculture Centers in Asia-Pacific
NMFS National Marine Fisheries Service
NOAA National Oceanic and Atmospheric Administration
P Phosphorus
PCR Polymerase Chain Reaction
PL Post Larvae
RFD Thai Royal Forestry Department
SE Asia Southeast Asia
SPF Specific Pathogen Free
SPR Specific Pathogen Resistant
TSV Taura Syndrome Virus
YHV Yellow Head Virus
WI:FO Mass ratio of wild fish in to farmed fish or shrimp out
WSSV White Spot Syndrome Virus
Frequent Exchange Systems: Shrimp farm grow-out ponds in Thailand that discharge water to the environment both during the production cycle and during harvest.
Harvest Exchange Systems: Shrimp farm grow-out ponds in Thailand that discharge water to the environment only during harvest.
Infrequent Exchange Systems: Shrimp farm grow-out ponds in Thailand that do not discharge any water over more than one production cycle.

Farmed Imported Marine Shrimp: Thailand September 2010
10
II. Introduction Shrimp continues to be the largest single seafood commodity in global terms, accounting for 17% of the total value of internationally traded fishery products in 2006 (FAO 2009b). Until the 1970s, wild-catch fisheries accounted for virtually all shrimp production before commercial aquaculture began expanding in Asia and Latin America. In the early 2000s,
aquaculture was responsible for approximately 30% of world shrimp production. In 2007, for the first time, farm-raised shrimp rose to over 50% of total production (Figure 1). In 2008, global production of all marine shrimps and prawns totaled more than 6.4 million mt, of which farmed shrimp accounted for over 3.4 million mt (FAO 2010).
Figure 1: Trends in global marine shrimp and prawn production from wild-caught and farmed sources, data from FAO (2010).
The sustained global demand for shrimp, which can no longer be met by fisheries alone, continues to provide a strong economic incentive for shrimp farming. There has been widespread criticism, however, regarding adverse environmental impacts from the uncontrolled expansion of shrimp farming in many coastal regions in the tropics and sub-tropics. One particularly contentious issue has been the destruction of mangrove forests for shrimp ponds. In addition, industry-wide disease outbreaks have caused devastating losses, and there is ongoing debate over whether disease has spread from farmed shrimp to wild crustaceans, or if escaped farmed shrimp are affecting wild shrimp stocks. In Southeast Asia (SE Asia), Penaeus monodon (tiger shrimp), a native species, was initially the principal species of farmed shrimp in the 1970s. Broodstock were collected from the wild and brought to hatcheries to produce post larvae (PL) for pond stocking. In the 1990s, Thailand became the largest producer and exporter of farmed shrimp, but the industry was soon hit by large disease outbreaks that dramatically impacted the production of P. monodon with high mortalities and reduced growth rates. Meanwhile, the domestication and production of disease-free and disease-resistant post larvae of a Central American species, Litopenaeus vannamei (white shrimp), was established and ultimately led to the introduction and farming of this non-native species in Asia. Almost all production in SE Asia now consists of non-native L. vannamei due to its faster growth cycles and tolerance to a wider range of salinities. In 2001, in response to the disease problems with P. monodon, Thailand began importing L. vannamei broodstock that were Specific Pathogen Free (SPF) for common shrimp diseases (Wyban 2007). The Thai Department of Fisheries requires permits for suppliers of SPF broodstock, and suppliers must have two years of experience working with SPF broodstock. The
Global Marine Shrimp and Prawn Production
1975 1980 1985 1990 1995 2000 2005 2010
x 10
00 m
t
0
1000
2000
3000
4000
FarmedWild Caught

Farmed Imported Marine Shrimp: Thailand September 2010
11
switch to farming L. vannamei allowed more intensive culture and provided increased yields with shorter crop durations. Thailand continues to be a world leader in farmed shrimp production and has developed an integrated shrimp industry that includes hatcheries, farms, feed companies, processing plants and international marketing companies. Today Thailand is the largest single provider of farmed marine shrimp to the US. Thai shrimp farmers produce approximately 500,000 mt of marine shrimp per year (virtually all L. vannamei), most of which is exported, making Thailand the world’s leading exporter of farmed shrimp. The US imported over 552,000 mt of shrimp from all countries in 2009 (NMFS 2010). The amount of shrimp exported to the US from Thailand in 2009 was close to 193,000 mt, including both wild and farm-raised shrimp. Because wild trawl-caught shrimp from Thailand are currently banned in the US, it is likely that virtually all shrimp imported from Thailand are farmed (see Import and Export Sources and Statistics below for details). This Seafood Watch report provides background information on shrimp farming and production in Thailand, and then analyzes specific aspects of the Thai shrimp farming industry with respect to the five Seafood Watch® impact criteria. Biology: Pacific White Shrimp (Litopenaeus vannamei) The Pacific white shrimp, Litopenaeus vannamei (formerly Penaeus vannamei), is a marine crustacean belonging to the order Decapoda, a group of crustaceans that also includes lobsters and crabs. Shrimp are distinguished from other decapods by having the front-most section of the abdomen about the same size as the rest of the sections (Figure 2) and by having five pairs of abdominal appendages, or pleopods, adapted for swimming (Chase and Abbott 1980). Although there are thousands of species of shrimp, most are not suitable for commercial harvest. Those that are harvested are relatively large (ranging from 2–10 cm carapace length) and aggregate in
some fashion so that they are amenable to capture. Worldwide, about 40 species of shrimp meet these criteria and are caught commercially. About ten species have been raised in captivity; for some species, such as the Pacific white shrimp L. vannamei, selective breeding has resulted in domesticated breeds. Figure 2. Litopenaeus vannamei. Picture courtesy of Auburn University, Department of Fisheries and Allied Aquaculturists.
Most shrimps are omnivorous predators and scavengers. The intestine runs the dorsal length of the abdomen; it is the brown line sometimes called the "mud vein" on cooked shrimp. Like other arthropods, shrimps have no internal skeleton and are protected instead by a chitinous exoskeleton which must be repeatedly shed as the animal grows (Chase and Abbott 1980). The sexes are separate, and females tend to be larger than males. Some species release their eggs into the water column, while others brood the fertilized eggs on the female's abdomen until hatching. Newly hatched shrimp larvae bear little resemblance to adults, and must undergo up to 12 molts

Farmed Imported Marine Shrimp: Thailand September 2010
12
just to reach the post-larval or juvenile stage. Cold-water pandalid shrimps such as the spot prawn may live for three to seven years (Schlining 1999, Idoine 2001). In contrast, many of the warm-water penaeid shrimps complete their life cycles in one to three years (LDWF 2000). Generally, adult penaeid shrimp spawn in offshore waters, and their eggs and larvae are transported to the coast as they develop (Figure 3). Shrimp larvae drift with plankton where they are important food for many fishes and invertebrates (Chase and Abbott 1980). After a period of estuarine or coastal residence, juveniles that survive become adults and migrate offshore. Figure 3. Diagrammatic representation of the typical penaeid shrimp life history, such as for L. vannamei.
Pacific white shrimp are part of the Penaeidae family. The bodies of these animals are translucent but often have a bluish-green hue (Figure 2) due to the presence of pigmented chromatophores (molecules evolved to collect/reflect light). Litopenaeus vannamei can reach 230 mm (9 inches) in length and are native to eastern Pacific waters (Figure 4) ranging from Sonora, Mexico to Tumbes in northern Peru (Farfante and Kensley 1997). The preferred
habitat ranges from muddy bottoms near the shoreline down to depths of 72 m (235 feet) (Dore and Frimodt 1987). The life history of L. vannamei is similar to other members of the family Penaeidae. Figure 4. The native geographic range of wild Litopenaeus vannamei. Figure from FAO, adapted from Holthuis (1980).
Weight at first maturity ranges from 20 g for males to 28 g for females and is usually reached between six and seven months of age. Female L. vannamei, weighing 30 to 45 g, spawn 100,000 to 250,000 eggs of approximately 0.22 mm in diameter. Hatching occurs around 16 hours after fertilization, and larvae go through a number of distinct development stages (Zoea I to III, and Mysis I to III) separated by molts before becoming postlarvae after about 9–10 days. After another 8–15 days, postlarvae (PL8–PL15) are moved to grow-out ponds. The growth and survival of L. vannamei postlarvae are strongly dependent on temperature and salinity. When reared at temperatures of 20, 25, 30 and 35˚C and salinities of 20, 30, 35, 40 and 50 ppt, the highest survival and growth coincide at around 28–30˚C and 33–40 ppt. Survival of juveniles is usually compromised at low salinities and high temperatures (Ponce-Palafox et al. 1997).
Shrimp Farming in Thailand Thailand is the single largest producer of shrimp on the US market. The Thai DOF reported farmed shrimp production in 2008 of over 464,000 mt of white shrimp (L. vannamei) and 1,900

Farmed Imported Marine Shrimp: Thailand September 2010
13
mt of tiger shrimp (P. monodon) from approximately 25,000 active farms (DOF pers. comm., April 20, 2009). Most of this production was exported, principally to the US but also to Japan and the European Union. Located in SE Asia (Figure 5), Thailand covers 514,000 km2 (United Nations 2009). It borders Myanmar (Burma) to the west, Laos People’s Democratic Republic to the north, Cambodia to the east and Malaysia to the south. Thailand has 2,420 kilometers of coastline along the Gulf of Thailand and the Andaman Sea (Indian Ocean). Figure 5. Geographical location of Thailand, (map from University of Wisconsin, Milwaukee). Generally, the country’s 76 provinces (Figure 6) are classified into four main regions: North, Northeastern (Isaan), Central and South (Malay Peninsula). Each province has a capital city by the same name. The Central region (including the Bangkok Metropolitan Region) includes the large basin of the Chao Phraya River running north-south through Bangkok into the Bay of Bangkok, which is the northernmost body of water in the Gulf of Thailand. This fertile region is often called the “rice bowl” of Thailand. The mountainous North region used to be heavily forested but has lost considerable forest resources from overcutting. The large Northeast region (Isaan) houses one third of the population. This region includes the large Korat Plateau and the Mun and Chi rivers, which drain into the Mekong. The Northeast region includes hilly countryside from Bangkok to Cambodia. The climate for these three regions is similar, with a rainy season from June to October, a cool season from November to February, and a hot and sunny season from March to May. The climate of the Malay Peninsula is generally tropical rainforest (except at the coast) with little variation in temperature (average 28° C) and year-round rainfall, as much as 380 cm annually.

Farmed Imported Marine Shrimp: Thailand September 2010
14
Figure 6. Map of Thailand’s geopolitical regions and provinces. Pink indicates provinces in the North region, orange in the Northeast, green in the Central and yellow in the South. Shrimp farms in Thailand are found in the Central and South regions. In addition to coastal farms, there are also inland shrimp farms in riparian corridors such as the Bangpakong River watershed (Chacheangsao province), which contains close to 1000 ha of shrimp farms within 10 km of the river. The habitats of the Central and South regions are discussed in more detail in Criterion 4: Risk of Pollution and Habitat Effects.
Bay of Bangkok
Gulf of Thailand
Andaman Sea

Farmed Imported Marine Shrimp: Thailand September 2010
15
Mangrove forests are an important habitat in Thailand in terms of socio-economic resources and also because they support highly diverse ecological communities. Currently, there are mangrove forests present on approximately 50% of the country’s 2,514 km coastline (including 87 mangrove species in 41 families). Mangrove trees are important for a variety of human uses including charcoal, firewood, wood distillation, poles, fishing stakes, roofing materials and ecotourism. They also provide habitat for juvenile and adult fish species used in aquaculture and commercial fisheries (Dulyapurk et al. 2007). For more details on mangrove habitat, see Criterion 4: Risk of Pollution and Habitat Effects. The information from Thailand’s Department of Fisheries (DOF) in Table 1 highlights changes to the shrimp farming industry between 2000 and 2008. While the number of registered farms in Thailand has changed little from 2000 to 2008, there has been a trend toward less total pond area and greater yield, indicating more intensive culture methods. The most dramatic change has been the shift in species of shrimp being farmed from almost exclusively tiger shrimp (P. monodon) in 2000 (98% of total production) to almost exclusively white shrimp (L. vannamei) in 2008 (99.6% of total production). Other trends include more farms using environmentally friendly practices including production systems that recycle water (increasing from 30% of farms in 2000 to 80% in 2008) and treat effluent (increasing from 20% of farms to 80% over the same period). Also, the number of farms using hatchery-raised PL instead of wild-caught increased from 3% in 2000 to 99% in 2008. Producing PL from farmed-raised broodstock in hatcheries is much easier using non-native L. vannamei than with native P. monodon. Farm-raising broodstock allows hatcheries to domesticate L. vannamei over multiple generations and select for faster growth and greater disease resistance. Finally, Thai-based certification schemes such as Thailand’s Code of Conduct (CoC) and Good Aquaculture Practice (GAP) have also been introduced for Thailand’s shrimp farms. Table 1. Marine shrimp production in Thailand showing changing trends between 2000 and 2008 (data from Thailand’s Coastal Fisheries Research and Development Bureau of the Department of Fisheries as of April 20, 2009).
Description 2000 2008 Registered farms 34,979 30,732 Active farms -- 25,000 Pond area (ha) 81,120 52,000 Production, total (mt) 309,794 466,330 Average yield (kg/ha) 3,819 8,968 Production, L. vannamei (mt) 5,200 464,420 Production, L. monodon (mt) 304,594 1,910 Farms with “closed” systems 30% 80% Farms treating effluent* 20% 80% Farms using domestic PL 3% 99% Farms CoC* certified -- 186 (0.7%, 5,119 ha ) Farms GAP* certified -- 18,109 (72%, 34,596 ha)
*Notes: Effluent treatment includes settling ponds, CoC = Code of Conduct for Responsible Shrimp Aquaculture, GAP = Good Aquaculture Practice. “Closed” farms are not truly closed systems but practice reduced water exchange with the environment.

Farmed Imported Marine Shrimp: Thailand September 2010
16
The most recent production data from FAO are similar to the data from Thailand’s DOF. According to FAO (2009a), in 2007 Thai farms produced 490,000 mt of white shrimp and 10,600 mt of tiger shrimp. Typical Intensive Shrimp Farming Systems In general, production methods for shrimp farms vary widely. Inputs such as water, fertilizer, feed and fry typically vary from pond to pond, resulting in a continuum of resource use intensity. Generalizations can be made by categorizing systems as extensive, semi-intensive, intensive or super-intensive, based mainly on the density of shrimp stocked in the ponds along with the nature and quantity of feed, the rate of water exchange and whether aeration is used to increase oxygen levels in the water (Clay 2004). These categorizations have changed with the evolution of the industry. Classifications based on Tacon and McNeil (2004) are used here. Farmed shrimp production in Thailand is typically conducted in intensive systems. Like all major shrimp producing nations, Thai shrimp farmers use ponds almost exclusively but have made significant modifications in managing these ponds, described below under “‘Closed’ Systems in Thailand.” Intensive farms usually use earthen ponds ranging in size from <1–20 ha, exchange water using pumps at a rate of 5–40% water volume/day, shrimp stocking densities of 25–75 shrimp/m3, partial or continuous aeration (particularly during the final phase of production) and fertilization and/or supplementary complete feeding. Intensive farms produce shrimp yields of 10,000–40,000 kg shrimp/ha/year or greater (Tacon and McNeil (2004). For comparison, shrimp ponds owned by a large producer in Thailand, Charoen Pokphand Foods, produce 2.5 cycles per year, which is equivalent to 22,420 kg/ha/yr (see Table 1). A typical shrimp farming cycle is shown in Figure 7. Fertilizers are used to increase the naturally occurring shrimp feed in the ponds, though supplemental feed is also added. Daily water exchange maintains good water quality in ponds but increases the potential for pollution, pathogen transfer between ponds and the local environment, and shrimp escapes. Figure 7. A typical intensive shrimp farming system (from FAO). In Thailand there are important differences from the “typical” system described by Tacon and McNeil (2004). Disease prevention measures include maintaining static volumes of water and recycling pond

Farmed Imported Marine Shrimp: Thailand September 2010
17
water during grow-out production. Most ponds are earthen or lined with high-density polyethylene liners (HDPL), and 80% of farms limit water release to harvest-time only or not at all. Many of the ponds in Thailand are located in coastal areas, but because L. vannamei is tolerant to low salinity conditions, many are also located inland in riparian corridors such as the nearly 1000 ha of shrimp farms within 10 km of the Bangpakong River (Panutrakul et al. 2010). The majority of farmed shrimp producers in Thailand are family owned or small businesses with just a few hectares of ponds. In contrast, at the opposite extreme is the largest farmed shrimp producer in Thailand, Charoen Pokphand Food Public Company Ltd. (CP). As one of the largest agri-business conglomerates in the world, CP is listed on the Thai stock exchange and mass produces farmed shrimp in many countries in SE Asia, particularly Thailand, Indonesia and China. Charoen Pokphand is vertically integrated with feed manufacturers, broodstock farms and hatcheries, laboratory services to farmers, grow-out farms, processing plants, an export trade company, and a research and development division. Another large integrated shrimp producer is the Thai Union Group. O'Sullivan (2008) describes a site visit to a CP farm (Rayong 3) of 90 ha located in an estuarine area approximately 5 km from the Gulf of Thailand that has been operating for over 20 years. The farm ponds include: 35 ha for production, 17 ha for reservoirs, 13 ha for primary water treatment and 10 ha for waste sedimentation from effluent (where suspended solids are collected and later removed to a 5 ha sludge pond). Water is either discharged from the settling pond to the estuary or pumped back into the farm reservoir system for reuse. Water released during heavy rains first passes through sedimentation basins. There are 2.5 crops per year for each pond, with annual production slightly over 1,000 mt. A processing plant owed by CP is located next to the farm. The publicly available information about CP shrimp operations includes descriptions of typical open-pond farms, hatcheries, biosecurity measures, feed mills and an indoor pilot farm using concrete recirculating tanks, which are described in Annex 2. Seafood Watch staff visited this farm (and a number of smaller farms) during the writing of this report. “Closed” Production Systems in Thailand Worldwide, there are environmental concerns regarding the fate of discharged nutrients, chemical pollutants and pathogens from shrimp ponds, as well as impacts from escaped animals (described in more detail in later sections). The Thai shrimp industry’s move toward reduced water exchange has the potential to mitigate environmental impacts. This trend is the result of several motivating factors (Dr. Peter Vandergeest, York University, pers. comm., 4 April, 2010). First, farms using poor practices are less sustainable and tend to go out of business. Second, farms located near each other tend to enforce better practices among their neighbors. Lastly, local government and community groups press farmers toward better practices. Thai shrimp farmers can reduce water exchange during grow-out production because their systems use mechanical aeration to maintain good water quality instead of renewing pond water. The majority (80%) of Thailand’s shrimp farms are described by the DOF as “closed” systems in which farm water is partially recycled or even completely recycled over several production cycles, offering a potential solution to these problems. The term “closed” is misleading as this term usually refers to completely enclosed concrete or plastic recirculating tanks and not to open ponds. It is more informative to describe Thailand’s “closed” systems as ponds with reduced

Farmed Imported Marine Shrimp: Thailand September 2010
18
water exchange, resulting in limited or no water discharge to the environment. Seafood Watch recognizes the environmental advances made by these systems that reduce water exchange. Systems that do not discharge water to the environment during the production cycle but do so twice a year at harvest are described here as “Harvest Exchange Systems.” Farms that do not discharge water to the environment over more than one harvest cycle offer even greater environmental protection and are here described as “Infrequent Exchange Systems.” In contrast, systems that discharge water to the environment during the production cycle as well as during harvest are not as environmentally sustainable and are described here as “Frequent Exchange Systems” (Table 2). Table 2. Definitions of Thai shrimp farm production systems used in this report. Infrequent Exchange Systems are the least likely to adversely affect the environment but are still not truly closed systems. Open ponds that do not purposely discharge water may inadvertently release water, effluent, chemicals, pathogens and shrimp during storms or other unforeseen events. According to Thailand’s DOF, reduced water exchange systems (which DOF describes as “closed”) are defined differently for large farms (>8 ha) compared to small farms (<8 ha). Large “closed” farms have treatment pond(s) in which the water is aerated and water quality is adjusted before being reused again in the culture pond (Figure 8). These farms may completely recycle water without releasing it to the environment, even during harvest. Small “closed” farms (<8 ha), which do not have much space, can discharge water to the environment only during harvest (Thai DOF, Malinee Smithrithee, Senior Fishery Biologist, Coastal Fisheries Research and Development Bureau, pers. comm., 1 July, 2009). In 2006, the Thai DOF classified approximately 85% of shrimp farms as small (DOF 2008). Thus, 15% of shrimp farms in Thailand are larger than 8 ha. These descriptions are similar to the definitions used in this report for Infrequent Exchange Systems and Harvest Exchange Systems. However, it is important to note that the descriptions from DOF are broad generalizations, and any size farm may use a Frequent Exchange, Harvest Exchange or Infrequent Exchange System. Dr. Dominique Gautier, the Head of Environmental and Social Programs at Aqua Star Europe, and a specialist in shrimp farming, elaborated on how reduced water exchange systems operate. According to Dr. Gautier, harvest water is typically recycled in two ways:
1) For larger farms, pond water is released to a sealed drainage canal (i.e., not discharged to any public water body) and is then pumped from the canal back to a reservoir and used to fill ponds prior to stocking PL (some farms have run for several years without discharging any water). New water is pumped in to compensate for evaporation and other losses only when needed in order to avoid bringing pathogens into the farm from external water.
Frequent Exchange Systems:
Systems that discharge water to the environment during the production cycle as well as during harvest.
Harvest Exchange Systems:
Systems that discharge water to the environment only during harvest (usually twice a year).
Infrequent Exchange Systems:
Systems that do not discharge any water to the environment over multiple (more than one) production cycles.

Farmed Imported Marine Shrimp: Thailand September 2010
19
2) For small farms that do not have enough reservoir space to holding water, pond water is pumped to an empty pond during harvest and reused for another crop once the sediments have settled.
Dr. Gautier also stated that the key tool facilitating these recycling methods is the mobile pump, which moves across the farm as needed, allowing the farmer to move water anywhere. This is feasible because of the small size of ponds, one of the advantages of intensive farming (compared to low density farming). Many farms do release water to public water bodies, either after recycling it or directly after each harvest. Receiving water bodies include estuarine rivers and the open sea. In this scenario, effluent treatment consists of holding water in the drainage canal for several days before releasing it. Teichert-Coddington et al. (1999) have shown that holding water for only six hours allows most suspended solids and related BOD (biological oxygen demand) materials and nutrients to settle. This method allows for compliance with Thailand’s water discharge regulations. Finally, some farmers use the sludge material for bank or pond maintenance, and it is now common in Thailand to use this dry sediment as fertilizer for palm tree plantations, which are commonly situated near the coast and close to shrimp farms (Aqua Star Europe, pers. comm., D. Gautier, 23 Nov, 2009). Thus, a key environmental issue for Frequent and Harvest Exchange Systems is how the farm treats water drained from the pond at harvest because this generates the peak discharge of contaminants, especially the portion of water containing some sludge from the pond bottom (Teichert-Coddington et al. 1999). Unfortunately, for all types of systems, concerns remain regarding the proper disposal of pond bottom sludge (Aqua Star Europe, pers. comm., D. Gautier, 23 Nov, 2009). There is uncertainty regarding the exact number, area and production volume of Thai shrimp farms using the more sustainable Infrequent Exchange Systems because the DOF does not distinguish these from Harvest Exchange Systems. Nevertheless, after polling industry experts, Mr. Robins McIntosh (Charoen Pokphand, pers. comm., 20 August, 2010) estimated that of the 600,000 total mt of shrimp currently farmed in Thailand, approximately 155,000 mt are produced using Infrequent Harvest Systems. Thus, a rough estimate is that 25% of all Thai shrimp farms use the more environmentally sustainable Infrequent Exchange Systems (i.e., recycle water and do not discharge it to the environment over multiple harvest cycles).
Farmed Imported Marine Shrimp: Thailand September 2010
20
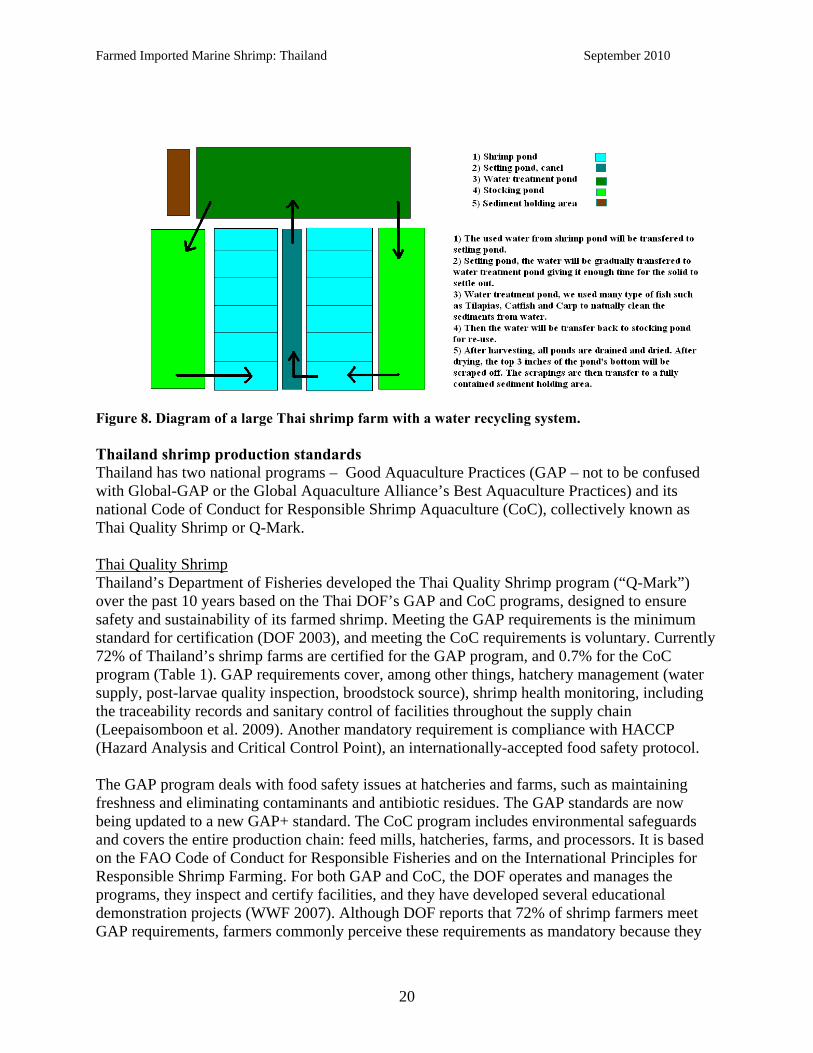
Figure 8. Diagram of a large Thai shrimp farm with a water recycling system. Thailand shrimp production standards Thailand has two national programs – Good Aquaculture Practices (GAP – not to be confused with Global-GAP or the Global Aquaculture Alliance’s Best Aquaculture Practices) and its national Code of Conduct for Responsible Shrimp Aquaculture (CoC), collectively known as Thai Quality Shrimp or Q-Mark. Thai Quality Shrimp Thailand’s Department of Fisheries developed the Thai Quality Shrimp program (“Q-Mark”) over the past 10 years based on the Thai DOF’s GAP and CoC programs, designed to ensure safety and sustainability of its farmed shrimp. Meeting the GAP requirements is the minimum standard for certification (DOF 2003), and meeting the CoC requirements is voluntary. Currently 72% of Thailand’s shrimp farms are certified for the GAP program, and 0.7% for the CoC program (Table 1). GAP requirements cover, among other things, hatchery management (water supply, post-larvae quality inspection, broodstock source), shrimp health monitoring, including the traceability records and sanitary control of facilities throughout the supply chain (Leepaisomboon et al. 2009). Another mandatory requirement is compliance with HACCP (Hazard Analysis and Critical Control Point), an internationally-accepted food safety protocol. The GAP program deals with food safety issues at hatcheries and farms, such as maintaining freshness and eliminating contaminants and antibiotic residues. The GAP standards are now being updated to a new GAP+ standard. The CoC program includes environmental safeguards and covers the entire production chain: feed mills, hatcheries, farms, and processors. It is based on the FAO Code of Conduct for Responsible Fisheries and on the International Principles for Responsible Shrimp Farming. For both GAP and CoC, the DOF operates and manages the programs, they inspect and certify facilities, and they have developed several educational demonstration projects (WWF 2007). Although DOF reports that 72% of shrimp farmers meet GAP requirements, farmers commonly perceive these requirements as mandatory because they

Farmed Imported Marine Shrimp: Thailand September 2010
21
cannot sell product without GAP certification (Dr. Peter Vandergeest, York University, pers. comm., 4 April, 2010). A particular concern for farmed shrimp has been antibiotic residues detected during testing of exported shrimp products from Thailand and other Southeast Asian countries, including oxytetracycline, oxoloinic acid, nitrofurans and chloramphenicol. The presence of antibiotics in the environment can cause resistant strains of bacteria that do not respond to treatment, and residues in shrimp are considered human health hazards. The government’s efforts to control these hazards include legislation, education, and analytical services. According to the Department of Fisheries, there are Raw Material Inspection and Quality Control Units located at 22 Coastal Aquaculture Research and Development Centers. These regional labs verify that shrimp in GAP-certified farms do not have residues of chloramphenicol, oxytetracycline and oxolinic acid. A unique traceability system is also in place for all GAP farms, designed to quickly identify and control any residues or diseases found. The Department of Fisheries traces all postlarvae and market shrimp transactions through mandatory Fry Movement Documents and Movement Documents (see www.thaitraceshrimp.com). According to Dr. Vandergeest, it is noteworthy that GAP certification has effectively created traceability (York University, pers. comm., 4 April 2010). The CoC program includes 11 guidelines for shrimp hatcheries and farms (DOF 2009), including safeguards for preventing viral outbreaks via screening for the main viruses by DOF labs of all postlarvae produced by CoC-certified hatcheries. Also, permitting and quarantine procedures are designed to help ensure that CoC hatcheries import only clean broodstock into Thailand. See Annex 3 for a more detailed description of the GAP standards and Code of Conduct. Market Availability Overall, shrimp continues to be the world’s most valuable seafood, representing 17% of the total value of internationally traded fishery products in 2006 (FAO 2009b). Historically, wild-caught product provided the majority of shrimp on the market, but farms now contribute 48% of the world’s shrimp (FAO 2008). Shrimp are now the preferred seafood choice in the U.S., over tuna. Common and Market Names: There is confusion regarding the common names of shrimp and prawn. In U.S. markets, "shrimp" is the default name for all shrimp and prawns. "Prawn" often refers to freshwater shrimp or large saltwater shrimp. The term "scampi" refers not to a species but to a cooking method: any large shrimp cooked in butter and garlic. Perhaps more than any other seafood commodity, the market names of shrimp are seldom standardized. Several different species are commonly called "white shrimp", and the situation is the same for "pink shrimp", "rock shrimp", and "tiger shrimp" (NOAA 2001). Moreover, widely-distributed species have many common names. As one example, the circumpolar species Pandalus borealis may be marketed as pink shrimp, northern shrimp, Alaska pink shrimp, northern pink shrimp, Pacific pink shrimp, or salad shrimp.

Farmed Imported Marine Shrimp: Thailand September 2010
22
Commercially-harvested shrimp may be divided into three categories, based upon their habitat: coldwater or northern species; warmwater, tropical, or southern species; and freshwater species. For farmed shrimp, Litopenaeus vannamei (Pacific white shrimp or whiteleg shrimp) and Penaeus monodon (black tiger shrimp/prawn) dominate worldwide production and are most likely to represent farmed shrimp in the U.S. Virtually all shrimp imported from Thailand are the Pacific white shrimp, L. vannamei. Seasonal Availability: Shrimp imports to the US are usually lower in the spring and then peak in the fall (NMFS 2009), but there are multiple farming cycles per year and shrimp are available year round. Product Forms: There is a great diversity in product forms (Figure 9) for shrimp on the market (Seafood Handbook 1999). Product can be raw or cooked, fresh and frozen. The forms of primary product for frozen shrimp are:
• Green Headless: The standard market form. Includes the six tail segments, with vein, shell and tail fin. "Green" does not refer to shell color but to the uncooked, raw state of the shrimp. Also called "shell-on" or "headless".
• Peeled: Green headless shrimp without the shell. • PUD: Peeled, un-deveined, tail fin on or off; raw or cooked. The vein, running the length
of the tail, is the intestine, also called the mud vein or sand vein. • Tail-on Round: Un-deveined shrimp with tail fin on. • P&D: Peeled, deveined, tail fin on or off; raw or cooked. Another name for IQF P&D
shrimp is PDI (peeled, deveined, and individually frozen). • Cleaned: Shrimp that is peeled and washed, a process that removes some or all of the
vein but is not thorough enough to warrant the P&D label. • Shell-on Cooked: Cooked tail, with vein, shell and tail fin. • Split, Butterfly, Fantail: Tail-on shrimp that are cut deeply when being deveined. • Pieces: Shrimp with fewer than four or five whole segments.
Figure 9. Product forms for shrimp (Seafood Handbook 1999).
• Frozen Products: Frozen shrimp generally comes in two forms: blocks (shrimp frozen en masse) and individually quick-frozen (IQF) packs. Both shrimp blocks and IQF shrimp are glazed with a protective ice coating to prevent dehydration.
• Breaded Shrimp: Shrimp, whether tail-on or tail-off, is the most-common breaded seafood on the market.

Farmed Imported Marine Shrimp: Thailand September 2010
23
In the U.S., the various species of shrimp (whether wild-caught or farmed) are generally sold interchangeably, traded not by species, but by size. Shrimp are sold by number per pound rather than by individual weight (Seafood Handbook 1999). For example, a 16/20 count means it takes 16 to 20 shrimp of that size to make up a pound, and the smaller the count, the larger the shrimp (Table 3). Table 3. U.S. shrimp marketing definitions, count per pound (Seafood Handbook 1999). The US imported over 564,000 mt of wild and farmed marine shrimp in 2008 (NMFS 2009). The dominant form of these imports (95%) was frozen green headless (shell on) in sizes ranging from “tiny” to “colossal.” Other product forms included frozen peeled, frozen breaded, peeled fresh/dried/salted/brine, and other unspecified preparations. Of the 182,371 mt of imported shrimp product from Thailand in 2008, over 60% were in the form of either frozen prepared or frozen peeled. Shelled products included all sizes, but were predominantly Small to Extra Large.
Import and Export Sources and Statistics: The National Marine Fisheries Service (NMFS) reports on fisheries product imported to the US. For shrimp NMFS does not distinguish between imports of marine or freshwater species or whether shrimp were farmed or wild caught. The Food and Agricultural Organization of the United Nations (FAO 2010) does distinguish between production of both farmed and wild-caught shrimp and the species. Those values are summarized in Table 4 for 2007 and 2008 (the latest years for which production data are available). Calculations show that almost 90% of shrimp production in Thailand was farmed in 2007 and 2008. However, because imports of wild trawl-caught shrimp from Thailand are currently banned in the US, it is likely that virtually all of the shrimp products imported to the US from Thailand in recent years were farmed.
Name Green Headless Peeled Cooked Extra Colossal Under 10 Under 15 16/20
Colossal Under 15 16/20 21/25 Extra jumbo 16/20 21/25 26/30
Jumbo 21/25 26/30 31/35 Extra large 26/30 31/35 36/40
Large 31/40 36/45 41/50 Medium large 36/40 41/45 46/50
Medium 41/50 46/55 51/60 Small 51/60 56/65 61/70
Extra small 61/70 66/75 71/80 Tiny Over 70

Farmed Imported Marine Shrimp: Thailand September 2010
24
Table 4: Shrimp import and production statistics for Thailand 2007 to 2009. Statistics from NMFS do not distinguish between freshwater, marine, wild-caught, or farmed shrimp products, “n/a” means not available.
Year
Shrimp Imported from Thailand to US
Reported to NMFS* (mt)
Farmed Shrimp Production
in Thailand Reported to FAO
(mt)
Wild-Caught Shrimp Production
in Thailand Reported to FAO
(mt)
Calculated Proportion of Shrimp Production
from Farms
2007 188,867 504,856 60,177 88%
2008 183,406 507,500 63,789 87%
2009 192,766 n/a n/a
The reported production of 507,500 mt of Thai farmed marine shrimp in 2008 by FAO is higher but comparable to the estimate by the Thai DOF in Table 1 (466,330 mt). Most of Thailand’s farmed shrimp are exported, and the US is its main export market. In 2006 approximately 85% of its cultured shrimp was exported to the US, Japan, European Union, and other nations (DOF 2008). The data from Table 4 shows that over 192,000 mt of shrimp on the US market in 2009 originated in Thailand. All shrimp products imported to the US in 2009 (including marine and freshwater, wild-caught and farmed) totaled 552,206 mt, worth $3.8 billion. Accordingly, Thailand’s farmed shrimp imports in 2009 made up almost 35% of the US market share of all imported shrimp, making Thailand the single largest producer of shrimp on the US market for the most preferred seafood choice in the US.

Farmed Imported Marine Shrimp: Thailand September 2010
25
III. Analysis of Seafood Watch® Sustainability Criteria for Farm-Raised Species According to Boyd (2003) the most serious environmental concerns for aquaculture are the following: (a) Destruction of mangrove, wetlands, and other sensitive aquatic habitat by aquaculture projects; (b) Conversion of agricultural land to ponds; (c) Water pollution resulting from pond effluents; (d) Excessive use of drugs, antibiotics, and other chemicals for aquatic animal disease control; (e) Inefficient utilization of fish meal and other natural resources for fish and shrimp production; (f) Salinization of land and water by effluents, seepage, and sediment from brackish water ponds; (g) Excessive use of ground water and other freshwater supplies for filling ponds; (h) Spread of aquatic animal diseases from culture of organisms to native populations; (i) Negative effects on biodiversity caused by escape of non-native species introduced for aquaculture, destruction of birds and other predators, and entrainment of aquatic organisms in pumps; and (j) Conflicts with other resource users and disruption of nearby communities The Seafood Watch sustainability criteria address a similar range of impacts within five areas: 1 – Use of marine resources 2 – Risk of escaped fish or shrimp to wild fish stocks 3 – Risk of disease transfer to wild stocks 4 – Risk of pollution and habitat effects 5 – Effectiveness of the management regime The Seafood Watch criteria do not investigate social or economic issues. Availability of Science Providing shrimp for human consumption from both wild capture fisheries and aquaculture has been the focus of intense scientific and general literature. While much of the science regarding aquaculture relates to developing production techniques in terms of nutrition, genetic development, disease and general biology and physiology, a significant amount of literature relates to the various environmental impacts associated with shrimp farming. A notable exception is the difficulty discerning the impact of disease transfer and escapes from shrimp farms to wild crustaceans, which is still an emerging science. The shrimp farming industry has developed rapidly on a global scale. During this time the literature has evolved as the understanding of the many complex issues relating to shrimp aquaculture has developed. Rapid changes in various aspects of production continue to occur,

Farmed Imported Marine Shrimp: Thailand September 2010
26
such as the response to changes in feed prices or major disease outbreaks. Therefore literature of more than a few years old must be used with caution unless it reports historical developments. The shrimp farming industry has also been the focus of much non-peer-reviewed publications. Again these must be used with caution and checked against other peer-reviewed references. Scope of the Analysis, Methods This report focuses on farming of white shrimp Litopenaeus vannamei, the dominant shrimp species cultured in Thailand. Additionally, the criteria ratings focus on 80% of farms using reduced water exchange systems, and the 80% that treat effluent. Nonetheless, this report also includes information regarding the environmental impacts from farms that are more open to the environment and/or do not treat effluent, particularly in Criteria 2 through 4 describing escapes, diseases, and pollution. This report does not investigate social issues, but focuses on important ecological aspects of the farmed shrimp industry in Thailand and ranks its ecological sustainability. All the Seafood Watch criteria are elaborated in more detail below, and the specific results of the analyses are available in Annex 3. Evaluations of farmed shrimp from other countries can be found at www.montereybayaquarium.org. The goal of this report is to present accurate, complete, and authoritative information and to apply that information to the Seafood Watch criteria in a balanced manner in order to develop a ranking for Thai farmed shrimp. Methodology consisted of critical analysis and synthesis of various types of information, as well as an on-site visit to shrimp ponds in Thailand, beginning in early 2009. Data and information in this report came from numerous peer-reviewed articles and books, gray literature, and from government and industry websites. Data and information was also gathered via numerous telephone and email communications with government personnel and other experts who have direct experience in the Thai farmed shrimp industry (see Acknowledgements). The experts consulted for this report represented a wide range of experience and perspective. Finally, this report highlights the more sustainable practices of the shrimp aquaculture industry in order to promote further advances toward ecological sustainability.

Farmed Imported Marine Shrimp: Thailand September 2010
27
Criteria 1: Use of Marine Resources Guiding Principle: To conserve ocean resources and provide net protein gains for society, aquaculture operations should use less wild-caught fish (in the form of fish meal and fish oil) than they produce in the form of edible marine fish protein. Primary Factors
• Estimated wild fish used to produce farmed shrimp. Calculated as the ratio of Wild Fish in to Farmed Fish [shrimp] out (WI:FO)
Secondary Factors • Stock status of the reduction fishery • Source of stock for the farmed species
Fish meal and fish oil are important ingredients in aquaculture feeds (as well as for agriculture, particularly pigs and poultry), which supply essential amino acids and fatty acids needed for growth in many species, including shrimp. Aquaculture currently uses the largest portion of the world’s supply of fish meal (68%) and fish oil (88%), with predictions of even greater dependence in the future as the aquaculture sector expands (Tacon and Metian 2008). A critical issue for sustainable aquaculture is the question of basic efficiency. In other words, does aquaculture use more wild marine resources than the farmed food it produces? Or does aquaculture aid ocean resources by producing more food than the wild resources it takes out of the ocean? Although the question of overall efficiency of nutrient transfer in aquaculture is becoming complicated by the increasing use of terrestrial plant and animal feed ingredients, this degree of efficiency is commonly expressed as Wild Inputs to Farmed Outputs (WI:FO, aka FI:FO as Fish In:Fish Out). A good portion of those answers lie in the species farmed; in general, species lower on the food chain such as omnivores or herbivores require fewer resources than those higher on the food chain such as piscivores. The marine resources supplying fish meal and fish oil usually come from small bony forage fish (forage fisheries or reduction fisheries). According to FAO (2009a), each year one-fourth to one-third of the world’s total fish catch is converted to fish meal and fish oil. The wild fisheries supplying these products are considered fully exploited and are facing increasing pressure. To achieve true sustainability, the aquaculture industry must reduce its dependence on wild fish and other marine resources. Using by-products or alternatives to marine-derived proteins and oils in feeds are possible solutions. In Thailand especially, a common practice is including fishmeal and oil made from by-products of the canning industry in fish feeds (The Food School, pers. comm., Sally Ananya Surangpimol, Director, 9 February 2010). Alternative protein sources (including plant-based proteins and those derived from processing wastes) must continue to be developed if aquaculture production requiring protein- and oil-rich diets is going to reduce its dependence on wild-caught fish and other marine resources. Using plant proteins and rendered animal products in fish feeds is now widespread throughout the world. For example, most diets for salmon have 15-30% vegetable products and some contain 10-40% rendered animal products. It is not currently possible, however, to completely eliminate the use of fish meal and fish oil without negatively impacting fish welfare or their nutritional
Farmed Imported Marine Shrimp: Thailand September 2010
28
profile (e.g., reducing the concentration of beneficial omega-3 fatty acids) (Tacon 2005). Formulating alternative feeds to a specific nutrient profile is possible in the case of fish meal, but doing so has been more problematic for fish oil, as there are no commercial alternatives available that produce sufficient quantity for the aquaculture industry. Although shrimp specifically require relatively low levels of fish oil, research continues into alternative feeds, and using wild fish inputs remains a major limitation for future growth of a sustainable aquaculture industry. The fully-exploited status of forage fisheries, increasing demand, high cost of fish meal and fish oil, and sustainability concerns are spurring research into alternative feed options, particularly for the aquaculture sector. Potential alternatives to fish meal and fish oil include soybeans, barley, rice and peas, as well as canola, lupine, wheat or corn gluten, algae, and by-products of seafood and agricultural processing. The recent article by Naylor et al. (2009) highlights the promise and need for alternatives, such as single-cell oils extracted from microorganisms (rich in omega-3 oils) which also appear promising as an alternative to fish oils. Specific information about the use of fish meal and fish oil in the aquaculture industry is available from Tacon and Metian (2008) who used a 2006/7 global survey of aquaculture feed manufacturers. This study remains the most comprehensive source of information on aquaculture feed production and use to date, which is used in the calculations described below. Primary Factor – WI:FO To estimate the use of marine resources, Seafood Watch calculates the ratio of wild fish inputs used to produce the farmed fish [shrimp] output (WI:FO). The WI:FO ratio is calculated by multiplying three separate measures: 1) Yield: the amount of fish meal or oil extracted from whole wild fish 2) Inclusion rate: the percentage of fish meal and fish oil included in formulated feeds
(calculated separately for fish meal and fish oil); and 3) Economic feed conversion ratio (FCR or eFCR): the ratio of feed inputs to farmed fish
[shrimp] output, most simply calculated as the dry weight of feed used, divided by the wet weight of fish [shrimp] harvested.
WI:FO = Yield rate x Inclusion rate (%) x FCR Yield Rate Yield rates vary, depending on the species of fish, season, condition of fish, and efficiency of the reduction plants (Tyedmers 2000), and the exact sources of fish meal and fish oil can be difficult to determine. Although it is difficult to determine representative averages for yield rates, one scientific study, Tyedmers (2000), reports the yield rates of aquaculture feeds. Seafood Watch therefore uses these fish meal and fish oil yield rates of 22% and 12%, respectively (from Gulf of Mexico menhaden) suggested by Tyedmers (2000), as representative averages. These values mean that 4.5 units of wild fish from reduction fisheries are needed to produce 1 unit of fish meal, and 8.3 units of wild fish are needed to produce 1 unit of fish oil. Until more comprehensive literature is available, Seafood Watch considers these to be the most accurate general estimates for yield rates for fish meal and fish oil in aquaculture.

Farmed Imported Marine Shrimp: Thailand September 2010
29
Inclusion rate Shrimp feeds typically contain moderate amounts of fish meal (compared to other farmed aquatic species), and contain low levels of fish oil. Tacon and Metian (2008) reported inclusion rates used in shrimp feeds in Thailand as 5% to 35% (mean 25%) for fish meal and 0.5% to 3% (mean 2%) for fish oil. Economic Feed Conversion Ratio The economic feed conversion rate (eFCR) is generally defined as the ratio of total feed weight used to the net production output (total weight gained by the stock) over one or more farming cycles. This calculation is expressed as:
Feed Weight/(Final Stock Wet Weight – Starting Wet Weight) = eFCR Globally, compound shrimp feeds were estimated to have an eFCR of 1.7 in 2007 and this is predicted to fall to 1.4 by 2020 (Tacon and Metian 2008). However, estimating eFCRs is challenging because numbers vary depending on several factors, such as size of shrimp farmed, farming conditions (e.g. use of feed trays, Jory et al. 2001), stocking densities, escapes, and individual survivorship and growth rates. Despite the variability in eFCR, this report will use the mean value reported in the survey by Tacon and Metian (2008) as a good approximation. The range of eFCR values at Thai shrimp farms vary from 1.2 to 2.0 (mean 1.5), but Charoen Pokphand states that eFCR for their farms was 1.3 in 2009. This report considers the mean eFCR value from Tacon and Metian (2008) as the most appropriate value because 1.5 is a conservative estimate. WI:FO Calculations To calculate the WI:FO for fish meal, the yield rate of 4.5 is multiplied by the mean inclusion rate of 25% (0.25), multiplied by the mean eFCR of 1.5, resulting in a mean WI:FO value for fish meal of 1.7. For fish oil, the yield rate of 8.3 is multiplied by the mean inclusion rate of 2% (0.02), multiplied by the mean eFCR of 1.5, resulting in a mean WI:FO value for fish oil of 0.2. The Seafood Watch methodology considers WI:FO values of 0.1 to 1.1 to be low, 1.1 to 2.0 to be moderate, and greater than 2.0 to be high. Therefore, the mean WI:FO value calculated here for fish meal (1.7) falls within the moderate range and indicates moderate use of marine resources. The WI:FO value for fish oil (0.2) falls in the category of a low conservation concern. In calculating WI:FO values for farmed shrimp in Thailand, fish meal is the more important value because it is larger and thus provides a more conservative WI:FO estimate. Summary of WI:FO calculations The mean WI:FO value for fishmeal (1.7) is higher than the mean value for fish oil (0.2). Based on a precautionary approach, the higher fish meal value therefore dictates the WI:FO estimate used in this analysis for Thailand. Overall, the primary factor WI:FO for Thai farmed shrimp (1.7) is a ranked a moderate conservation concern.

Farmed Imported Marine Shrimp: Thailand September 2010
30
Secondary Factor – Status of the reduction fishery Reduction fisheries (or industrial or forage fisheries) refer to those fisheries in which the harvest is “reduced” to fish meal and fish oil, primarily for feeds in agriculture and aquaculture. The exact sources of fish meal and fish oil used in Thai shrimp feeds can be difficult to determine due to proprietary reasons, thus the global situation is discussed here. Most of the reduction fisheries are for small pelagic species that mature quickly and reproduce prolifically, are low in the food chain, and are preyed on by higher trophic level animals such as piscivorous fish, seabirds, and marine mammals. Most of the species are from the families Engraulidae (anchovies) and Clupeidae (herrings, pilchards, sprats, sardines, menhaden). Landings over the past 30 years have remained relatively stable, ranging between 20 and 30 million mt, with a noticeable dip to under 20 million mt during the 1998 El Niño (Schipp 2008). Stocks of forage fish are generally considered to be resilient to fishing pressure and environmental fluctuations but not immune to them. Many wild reduction fisheries throughout the world are considered fully exploited based on the single species models used to manage them (FAO 2007). It is generally believed that populations of fish used in most reduction fisheries are stable (Hardy and Tacon 2002, Huntington et al. 2004), although concerns have been raised about the potential for increased demand from expanding industries for farmed carnivorous fish (Weber 2003) and in most cases the populations are classified as fully exploited. However, some reduction fisheries are considered overexploited (Tacon 2005), and the multi-species and ecosystem effects from harvesting large quantities of forage fish are rarely considered. Forage species play a foundational role in marine ecosystems as they transfer energy from plankton to larger fishes, seabirds, and marine mammals (Naylor et al. 2000, Alder and Pauly 2006, MATF 2007). The ecosystem effects of harvesting large amounts of small pelagic species are likely to include increases in competitor populations, and declines in predator populations (Dayton et al. 2002). For example, Uphoff (2003) found that declines in the body condition of predatory striped bass (Morone saxatilis) were correlated with declines in heavily exploited stocks of southeastern U.S. menhaden (Brevoortia tyrannus). There is currently a call for caution from the fishery conservation community, with requests to specifically address ecosystem effects in management of forage fisheries (MATF 2007, NCMC 2008). Alder et al. (2008) argue that forage fisheries would be better utilized for direct human consumption rather than as agriculture and aquaculture feeds. Based on their current status as stable but generally fully exploited with some overexploitation, the health of the reduction fisheries is deemed a moderate conservation concern in the Seafood Watch ranking. Caution is warranted because forage fisheries are foundational to ecosystem health, and the growing aquaculture industry must reduce its dependence on marine resources if it is to remain sustainable. Secondary factor – Source of stock Historically, shrimp farms used to depend on the capture of postlarvae (PL) from the wild. By the mid-1970s hatcheries were supplying large quantities of post-larvae shrimp from wild caught broodstock (Briggs et al. 2005). The use of wild caught PL is now mostly obsolete and an increasing number of countries (including Thailand) have regulations which prohibit the practice. Shrimp farms cultivating P. monodon still rely almost exclusively on wild caught broodstock.

Farmed Imported Marine Shrimp: Thailand September 2010
31
However, with the change to the relatively easily domesticated L. vannamei species, Thailand shrimp farms use hatchery-raised postlarvae from farm-raised domesticated broodstocks. Therefore this factor is rated a low conservation concern. Synthesis The mean WI:FO value of 1.7 for Thai farmed shrimp was calculated using mean values of fish meal and fish oil yield rates, mean inclusion rates, and mean eFCR. The WI:FO value of 1.7 falls into the moderate ranking for use of marine resources. As the secondary factors are ranked moderate and low respectively, the overall ranking for use of marine resources is moderate. For the full analysis, see Annex 1. Use of Marine Resources Rank:
Low Moderate High
Criterion 2: Risk of Escaped Shrimp to Wild Stocks Guiding Principle: Sustainable aquaculture operations pose no substantial risk of deleterious effects to wild shrimp stocks through the escape of farmed shrimp. Primary Factors
• Evidence that farmed shrimp regularly escape to the surrounding environment • Status of escaping farmed shrimp to the surrounding environment
Secondary Factors • Where escaping shrimp are non-native – Evidence of the establishment of self-sustaining
feral stocks • Where escaping shrimp are native – Evidence of genetic introgression through successful
crossbreeding • Evidence of spawning disruption of wild shrimp • Evidence of competition with wild shrimp for limiting resources or habitats • Stock status of affected wild shrimp
Farmed shrimp production in Thailand is now dominated by the introduced (i.e. non-native or exotic) white shrimp species L. vannamei. The introduction of new species is considered an alarming global environmental problem (Leung and Dudgeon 2008), and can have ecological consequences such as introduction of non-native pathogens, negative genetic impacts, and increased predation and competition, and can lead to altered ecosystems, reduced biodiversity, and local extinctions of native species. Aquaculture activities are considered one of the major pathways for introducing non-native aquatic species that may become invasive (Weigle et al. 2005, Casal 2006). According to (Sala et al. 2000), the main drivers of extinctions are the introduction of new species and habitat alteration, and the current global rate of extinction is equivalent to a global mass-extinction event (Rockström et al. 2009).

Farmed Imported Marine Shrimp: Thailand September 2010
32
Primary Factor - Evidence that farmed shrimp regularly escape to the surrounding environment The chances of escape of non-native animals from farms and their potential impacts depend in large part on the location and nature of the production method. Shrimp can escape in various ways (for example at harvest, during water exchanges, during flooding events or natural catastrophes) from ponds, hatcheries, and during transport. In Thailand, hatcheries are typically fully closed and biosecure; however, open-pond grow-out production inevitably leads to escapes. The number of escapees and the frequency of escape episodes from open ponds can be lessened by routine best management measures such as adequate and appropriately sized screens and meshes on outflows, by situating farms away from coastal areas, by limiting water exchange with the external environment, or by constructing ponds to withstand flooding. Little is known about the overall impact of escapes of farmed shrimp on wild shrimp populations and biodiversity. Briggs et al. (2005) found that the current structure of wild shrimp populations appears to reflect large-scale historical events rather than patterns of present-day dispersal, and their literature review found no evidence of L. vannamei becoming established outside of its range. Despite the general lack of evidence of established non-native shrimp populations in the wild, the presence of introduced species has been documented in many regions. For example, P. monodon, L. vannamei, P. stylirostris and P. japonicus are all known to have escaped from U.S. culture operations (Briggs et al. 2005). There are records of L. vannamei escaping from shrimp ponds in the US, but a total of only 11 events have been recorded in government invasive species databases since 1990 (Perry 2009). Penaeus monodon has been officially recorded 27 times in the US and is believed to have come from animals that escaped from farms in the Caribbean (Fuller 2009). In Thailand, studies are just now taking place to establish base line information and assess the risk factors associated with farming the introduced L. vannamei. Its presence was documented as far inland as 69 km from the Bangpakong River mouth (DMCR 2005, Senanan et al. 2007). In 2006 the watershed for the Bangpakong River (Chacheangsao province) contained 119.5 ha of active and 828.3 inactive ha of shrimp ponds within 10 km of the river (Senanan et al. 2010). The number or frequency of escapes is not known. However, Senanan et al. (2010) states that the high intensity culture in Thai shrimp farms along with lack of formal escape-prevention regulations means that “a small percentage of pond escapes per cycle could translate to significant numbers of individuals entering the ecosystem.” While sampling the Bangpakong River, Senanan et al. (2010) states that white shrimp were present in all samples, and the percentage caught in sampling nets (compared to other penaeid shrimp) varied from 0.5% to 16% in 2005 and 2006. The potential for farmed shrimp escapes is somewhat mitigated by Thailand shrimp farmers’ widespread practice of reducing water exchange, as well as stringent biosecurity protocols to prevent crop failure from disease and parasites. Even though Harvest Exchange Systems discharge water to the environment only twice a year at harvest, this still provides opportunities for shrimp to escape because escapes are inevitable from open ponds, particularly during harvest. Thus, this first Primary Factor is ranked a “High” conservation concern. The exception is for

Farmed Imported Marine Shrimp: Thailand September 2010
33
farms using Infrequent Exchange Systems (a “Moderate” concern) because they discharge water to the environment infrequently, but are still subject to flooding events that allow escapes. Primary Factor - Status of escaping farmed shrimp to the surrounding environment L. vannamei is native to the Pacific coasts of Mexico, Central America and the northern portion of South America and has been introduced to SE Asia specifically for aquaculture. Because L. vannamei is a non-native introduced species in Thailand, this Primary Factor - Status of escaping farmed shrimp to the surrounding environment - is considered a high conservation concern. Secondary Factors Studies in a major shrimp farming area, the Bangkapong River in eastern Thailand, have found that L. vannamei is present and persistent in the wild (DMCR 2005, Panutrakul et al. 2010, Senanan et al. 2010). The increasing frequency of captured white shrimp and increasing size over time indicates that a self-sustaining population is theoretically possible (Panutrakul et al. 2010). Studies are now being undertaken to determine the occurrence and abundance of native shrimp species in Thailand (Tangkrock-Olan et al. 2007), and to assess ecological risk from escaped non-native white shrimp (Senanan et al. 2010). Most recently, Senanan et al. (2010) reported that they found animals exhibiting early reproductive status, as well large animals in advanced reproductive status (unpublished data, W. Senanan, pers. comm., 30 August 2010). These data indicate that escaped white shrimp can survive and reach maturation in Thai waters. Although these individual studies are not conclusive, a precautionary approach acknowledges that this body of evidence suggests that self-sustaining populations are likely to become established in the wild. This factor is therefore ranked as a “high” conservation concern. Secondary factors considered in this report include spawning disruption and increased competition with native species. Because there are no studies to date regarding spawning disruption from escaped farmed shrimp in Thailand, this factor is unknown and therefore considered a “moderate” conservation concern. Competition between wild and farmed shrimp is possible based on the proximity of many shrimp farms to important nursery areas for fish and shrimp. In addition, experimental results from Panutrakul et al. (2010) showed overlap in prey items consumed by L. vannamei and wild shrimp species, and that L. vannamei out competed these wild species for food in aquaria. To date, no studies clearly demonstrate evidence of competition (or lack thereof) in the wild but there is a theoretical possibility which is therefore considered a “moderate” conservation concern. The status of wild shrimp stocks is considered within the Seafood Watch criteria (see Annex 1 for the detailed ranking of these secondary factors). Generally speaking, shrimp are short-lived, prolific species, making wild shrimp populations inherently resilient. Thailand is one of the top ten countries for shrimp capture. Landings of the banana prawn, Fenneropenaeus merguiensis, currently remain at a little more than 10,000 mt per year, and landings for tiger prawn, P. monodon, are also stable, at approximately 2,000 mt per year (FAO 2008). Overall, considering the stable landings; the status of wild shrimp stocks in Thailand is considered a moderate conservation concern.

Farmed Imported Marine Shrimp: Thailand September 2010
34
Synthesis Virtually all of Thailand’s farmed shrimp are the non-native L. vannamei, which presents a “high” conservation risk. While 20% of the Thai shrimp farming industry discharges water to the environment during production and during harvest (Frequent Exchange Systems), 80% of the industry either discharges water to the environment only during harvest (Harvest Exchange Systems) or do not discharge water, even during harvest, over multiple production cycles (Infrequent Exchange Systems). Limiting water exchange reduces the opportunity for farmed shrimp to escape, but the risk remains significant, along with the potential for catastrophic losses during floods or from dyke failures. Even Harvest Exchange Systems that discharge water to the environment only twice a year at harvest still represent numerous opportunities for shrimp to escape. Thus, Frequent Exchange and Harvest Exchange Systems are considered a “high” conservation risk. Infrequent Exchange Systems that do not discharge water to the environment over multiple cycles present fewer escape opportunities. Infrequent Exchange Systems are a “moderate” concern because infrequent escapes may still occur due to flood, dyke failure or other events such as the recent tsunami. Although the frequency of escapes is unknown, the persistent presence of L. vannamei in the Bangkapong River attests to the fact that farmed shrimp do escape and can survive local conditions. Studies in the Bangpakong River found large L. vannamei individuals approaching mature reproductive status. Given evidence that white shrimp can survive in the wild, their increasing frequency of occurrence, and the presence of maturing animals, it is clear that white shrimp can survive and mature in local waters. A precautionary approach acknowledges the likelihood that self-sustaining populations may already have or will soon establish themselves in the wild. Thus, the establishment of self-sustaining stocks is considered a “high” risk for all production systems. Because researchers concluded that competition between L. vannamei and native shrimp species is theoretically possible based on food competition tests, this is considered a “moderate” conservation concern. The stock status of wild shrimp in Thailand is also considered a moderate concern, as the wild stocks of P. monodon (tiger shrimp) and Fenneropenaeus merguiensis (banana shrimp) are considered somewhat vulnerable to additional disturbance from escaped non-native farm shrimp. Overall, the risk of escaping farmed shrimp to wild stocks is generally considered “High” except for Infrequent Exchange Systems that do not discharge water to the environment even at harvest over multiple cycles, which is a “Moderate” risk. Risk of Escaped Shrimp to Wild Stocks Rank Frequent Exchange Systems, Low Moderate High Critical Harvest Exchange Systems
Infrequent Exchange Systems Low Moderate High Critical

Farmed Imported Marine Shrimp: Thailand September 2010
35
Criterion 3: Risk of Disease and Parasite Transfer to Wild Stocks Guiding Principle: Sustainable aquaculture operations pose little risk of deleterious effects to wild fish stocks through the amplification, retransmission or introduction of diseases or parasites. Primary Factors
• Risk of amplification and retransmission of disease or parasites to wild stocks • Risk of species introductions or translocations of novel disease/parasites to wild stocks
Secondary Factors • Bio-safety risks inherent in operations • Stock status of affected wild shrimp
In all forms of agriculture and aquaculture, various bacterial, viral, fungal and parasitic pathogens have caused major production losses. Disease can affect production systems of varying intensities, in different climates and between different species. Disease outbreaks in shrimp farms worldwide during the 1980s and 1990s have been devastating to the industry, with losses estimated in billions of dollars (Tanticharoen et al. 2008). A survey of shrimp farms around the world in 2001 showed that 58% of losses were due to viral infection, 22% to bacterial infection, 7% to fungal infection, 5% to parasitic infection and the remaining 9% had unknown causes (Flegel 2006a). The major viral diseases in shrimp are caused by white spot syndrome virus (WSSV), infectious hypodermal and haematopoietic necrosis virus (IHHNV), Taura syndrome virus (TSV) and yellowhead virus (YHV). Intensive farms often present an environment more conducive to disease because shrimp are crowded and under more stress. The intensive farm systems in Thailand require careful management of pond water quality in order to protect animal health, and the use of mechanical aeration helps reduce animal stress. Perhaps a larger concern for overall shrimp health management is animal movements that spread pathogens between shrimp farms around the world. Importantly, the devastating losses from viral diseases have caused the Thai industry to adopt increasing biosecurity measures including stocking only Specific Pathogen Free (SPF) and Specific Pathogen Resistant (SPR) PL in ponds. These populations are certified free of and/or resistant to the major shrimp diseases. Other biosecurity measures include recycling pond water and purifying environmental water inputs in order to reduce disease exposure from wild crustaceans to farmed shrimp. In addition, traceability through mandatory Movement Documents for postlarvae and market shrimp allows for quick response to disease outbreaks. Another health advance throughout the shrimp farming industry is the use of probiotics instead of the prophylactic use of antibiotics to control bacterial infection. Prophylactic antibiotic use increases the risk of drug-resistant bacteria and can also leave residues in the shrimp. Probiotics such as Bacillus spp. can inhibit Vibrio strains and digest waste products during shrimp culture (Balcázar et al. 2007, Decamp et al. 2008). Overall, there are many factors that contribute to disease outbreaks on shrimp farms. Many of those factors are depicted in Figure 10 for WSSV. Particularly troublesome are the introduction of pathogens from infected wild or newly stocked shrimp and poor husbandry. The mechanisms for transfer of pathogens include direct interaction between infected and non-infected shrimp and

Farmed Imported Marine Shrimp: Thailand September 2010
36
may include movement of predators between ponds (e.g., birds and crabs), exchange of infected water and passive movement of water between pond walls. Another mechanism for farmed shrimp disease dispersal may be from frozen product released to the environment during processing, but this mechanism is still under debate (Flegel 2009). Figure 10. Diagram depicting possible mechanisms causing white spot syndrome disease outbreak in shrimp farms, from Kenneth and Dudgeon (2008). Research into virus transmission between shrimp is in its infancy, even for the most threatening of farmed shrimp diseases such as WSSV, TSV and YHV. For example, it is not clear whether shrimp viruses can survive in water outside of a host. Recent research has shown zooplankton may be a vector for the transmission of WSSV (Mang et al. 2007, Zhang et al. 2008). If true, this mechanism would indicate that exchange of farm water to the environment creates a high risk for retransmission of pathogens from the farm to wild animals. Economic losses to the shrimp farming industry as a result of disease are easily demonstrated, but the potential impacts on wild stocks are much less obvious and are more difficult to discern. Nevertheless, disease impacts to wild stocks are an important environmental concern. A high value is placed on the abundance and diversity of wild marine species, making increases in disease a concern for society. Pathogen pollution, or the introduction of new disease-causing agents, is unequivocally increasing disease in the oceans and elsewhere (Lafferty et al. 2004). A similar type of pathogen pollution occurs when the concentration of domestic animals becomes an abundant source of hosts for disease. Such disease reservoirs can cause rare species to decline (Lafferty and Gerber 2002, Lafferty et al. 2004). Theoretically this can occur in marine systems when aquaculture operations maintain a continual source of potential disease transmission to related native species. Because shrimp have a non-specific immune system, viral pathogens affect them differently than they do fish, and healthy shrimp can carry cryptic viruses and act as carriers (Flegel 2006b). Although this does not pose any human health risk, for this reason viruses are troublesome in the shrimp farming industry, especially when farming non-native species. As previously mentioned,

Farmed Imported Marine Shrimp: Thailand September 2010
37
viruses that have been particularly harmful to the industry include WSSV, IHHNV, TSV, YHV and the emerging disease infectious myonecrosis (IMN). The world’s major farmed species L. vannamei, P. monodon, and P. stylirostris are carriers of these viruses even when they show no outward signs of disease. This poses an increased risk of transmitting viruses to both farmed and native wild penaeid shrimp populations and other crustacean species (Flegal 2009). Viral infections in farmed marine shrimp are described as pandemics because they have traveled between farms across the globe. For example, TSV was first described in L. vannamei in Ecuador in 1992 and has since spread across Asia, including Thailand. Perhaps the most economically significant disease is white spot syndrome caused by WSSV (Flegel 2006b). The evidence suggests that WSSV may have spread from Asia to the Americas as a novel disease, but its original source is difficult to determine. It was first noted in P. japonicus in Japan in 1993 and has since caused massive mortalities in shrimp farms in both Asia and the Americas. Additionally, IHHNV was first seen in cultured shrimp (L. stylirostris and L. vannamei) in the early 1980s in Hawaii and is now known to be widely distributed across Asia and the Americas in both farmed and wild crustacean species. Unfortunately, once pathogens have spread to new natural waters (or aquaculture facilities), they are almost impossible to eradicate (Briggs et al. 2005). Viral disease outbreaks have clearly caused great damage to the farmed shrimp industry; however, whether or not viral infections in farmed shrimp have caused ecological or commercial damage to wild stocks is not straightforward and continues to be a subject of contention. To date, the best example of an association between disease outbreak in farmed and wild shrimp involves the collapse of the commercial blue shrimp (P. stylirostris) fishery in the northern Gulf of Mexico during the late 1980s and early 1990s. At that time, IHHNV was found both in farmed and wild shrimp; however, such an association provides no information regarding cause and cannot show whether or not retransmission of IHHNV from shrimp farms caused the fishery failure. Nevertheless, the debate continues: according to Lightner (2003),
“The introduction of IHHNV into shrimp farms in northwestern Mexico and wild shrimp stocks in Mexico’s Gulf of California during the late 1980s and early 1990s resulted not only in significant losses in farmed L. stylirostris, but also in a collapse in 1990 of the wild fishery for L. stylirostris in the northern Gulf of California (Lightner et al. 1992; Martinez-Cordova 1992; Lightner 1996b; Pantoja et al. 1999; Morales-Covarrubias and Chavez-Sanchez 1999; Morales-Covarrubias et al. 1999). A decade later, the L. stylirostris fishery had recovered sufficiently to support commercial fishing, but the prevalence of IHHNV infection in adult L. stylirostris collected from the northern Gulf of California fishery remained high (80% to 100% females and 60% in males) (Morales-Covarrubias et al. 1999; Morales-Covarrubias and Chavez-Sanchez 1999).”
On the other hand, according to Flegel (2009),
“Although IHHNV has been reported from captured shrimp in the Americas (Lightner, 1993; Nunan et al. 2001), this does not appear to be correlated with declines in the Pacific or Atlantic shrimp fisheries there. In addition, it is not possible to blame IHHNV for the decline in catch of P. stylirostris in the Upper Gulf of California when the decline in both the shrimp and finfish fisheries in that limited area have been highly correlated
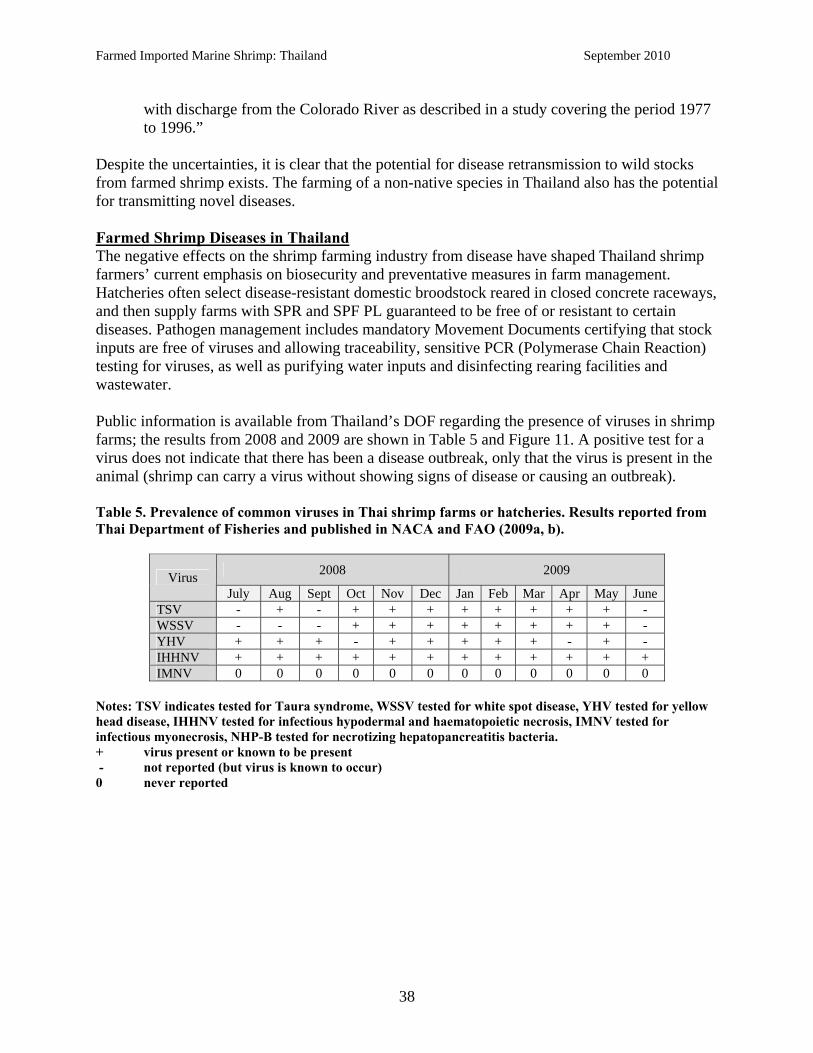
Farmed Imported Marine Shrimp: Thailand September 2010
38
with discharge from the Colorado River as described in a study covering the period 1977 to 1996.”
Despite the uncertainties, it is clear that the potential for disease retransmission to wild stocks from farmed shrimp exists. The farming of a non-native species in Thailand also has the potential for transmitting novel diseases. Farmed Shrimp Diseases in Thailand The negative effects on the shrimp farming industry from disease have shaped Thailand shrimp farmers’ current emphasis on biosecurity and preventative measures in farm management. Hatcheries often select disease-resistant domestic broodstock reared in closed concrete raceways, and then supply farms with SPR and SPF PL guaranteed to be free of or resistant to certain diseases. Pathogen management includes mandatory Movement Documents certifying that stock inputs are free of viruses and allowing traceability, sensitive PCR (Polymerase Chain Reaction) testing for viruses, as well as purifying water inputs and disinfecting rearing facilities and wastewater. Public information is available from Thailand’s DOF regarding the presence of viruses in shrimp farms; the results from 2008 and 2009 are shown in Table 5 and Figure 11. A positive test for a virus does not indicate that there has been a disease outbreak, only that the virus is present in the animal (shrimp can carry a virus without showing signs of disease or causing an outbreak). Table 5. Prevalence of common viruses in Thai shrimp farms or hatcheries. Results reported from Thai Department of Fisheries and published in NACA and FAO (2009a, b).
2008 2009 Virus July Aug Sept Oct Nov Dec Jan Feb Mar Apr May June
TSV - + - + + + + + + + + - WSSV - - - + + + + + + + + - YHV + + + - + + + + + - + - IHHNV + + + + + + + + + + + + IMNV 0 0 0 0 0 0 0 0 0 0 0 0
Notes: TSV indicates tested for Taura syndrome, WSSV tested for white spot disease, YHV tested for yellow head disease, IHHNV tested for infectious hypodermal and haematopoietic necrosis, IMNV tested for infectious myonecrosis, NHP-B tested for necrotizing hepatopancreatitis bacteria. + virus present or known to be present - not reported (but virus is known to occur) 0 never reported

Farmed Imported Marine Shrimp: Thailand September 2010
39
Figure 11. Positive tests for viruses from samples tested by Thailand’s Department of Fisheries, data from NACA and FAO (2008b, a, 2009a, b) Data on the prevalence of viruses in Thai shrimp farms (Table 5, Figure 11) were reported to NACA by Thailand’s DOF (NACA and FAO 2009a, b) and were obtained from farm samples of shrimp using sensitive PCR tests. Each value represents the percentage of animals that tested positive for the virus. Sample sizes varied
between 272 and 938 individuals for each quarterly reporting period. All samples were taken from shrimp grow-out farms under active surveillance by the DOF, except for the period July through September 2008, when samples of PL were taken before stocking. Information regarding the number of farms sampled or their locations was not available. The Department of Fisheries also reported that “shrimp farms with positive testing results [are] subject to health improvement, movement control, eradication and/or farm disinfection” (NACA and FAO 2008b, 2009a, b). In addition, the Department of Fisheries advised that all positive PL samples be destroyed (NACA and FAO 2008a). Overall, these data do not show any particular trends except that the prevalence of each virus was less than 12% for each quarterly sample, and that overall, during a recent one-year period, the occurrence of positive tests for viruses varied from 0% to 11.45% (mean 2.7%) in sampled shrimp. If the samples taken were representative of the country’s industry, then this information could be extrapolated to mean that, in general, less than 12% of farmed shrimp in ponds test positive for each of these common shrimp viruses. Unfortunately however, it is not clear how representative these data are for Thailand’s industry. Primary Factors - Risk of amplification and retransmission of disease or parasites to wild stocks AND Risk of species introductions or translocations of novel disease/parasites to wild stocks For shrimp farming the distinction between native and novel diseases is now blurred, and common shrimp diseases in Thailand are found throughout the industry. For example, researchers consider IHHNV and WSSV native to Asia, and TSV native to the Americas and novel to Asia, but all of these viruses are now established worldwide (Flegel 2006b). For this reason, the risk of native and novel diseases are discussed together here. Overall, there is a general lack of evidence regarding amplification and retransmission of disease (whether native or novel) to wild stocks from Thai farmed shrimp. The consequences of novel diseases in wild stocks are unknown, including for native crustaceans (Nielsen et al. 2005, Flegel 2006b). Kiatpathomchai et al. (2008) found that five wild crustacean species in Thailand that were experimentally exposed to TSV reacted to the virus but did not die, indicating that they can theoretically act as TSV carriers. In addition, Senanan et al. (2010) found TSV in seven local shrimp species. However, it is important to distinguish the difference between the presence of a

Farmed Imported Marine Shrimp: Thailand September 2010
40
virus and a disease outbreak. Particularly for shrimp, the presence of a virus does not necessarily indicate that there is disease. Dr. Flegel recently commented on whether there is any empirical evidence of novel disease outbreaks in wild shrimp in Thailand resulting from exposure via farmed shrimp. He stated that there is ample evidence for transmission in the other direction, shrimp diseases being transferred to stocked shrimp.
“TSV was brought to Taiwan/China and Thailand by imported stocks for aquaculture, but we do not have any published evidence to indicate that the virus is present in wild Asian shrimp (or other crustaceans) since the original disease outbreaks occurred even though some local crustacean species have been shown to be susceptible to TSV infection (but not disease) in laboratory tests…. I am not aware of any epidemiological study indicating the source of TSV for those cases when farmed P. vannamei test positive for TSV.” (T. Flegel, Head of the Center of Excellence for Shrimp Molecular Biology and Biotechnology and Professor, Department of Biotechnology, Faculty of Science at Mahidol University in Bangkok, pers. comm., 1 November 2009).
Further, Dr. Flegel stated there have been no problems reported with disease outbreaks of TSV either from farms or from the wild since TSV was introduced ten years ago (T. Flegel, pers. comm., 30 December 2009). The Thai shrimp farming industry has taken considerable steps to help prevent, monitor and control disease outbreaks on farms, including careful control of water, shrimp inputs and animal movements along with the establishment of dedicated laboratories with sensitive PCR testing and increased traceability. Even so, high stocking densities encourage pathogen amplification, and common viruses (TSV, WSSV, YHV and IHHNV) are present in ponds (Figure 11). The presence of a virus does not necessarily indicate disease but presents the theoretical risk of amplification and retransmission of that virus to wild stocks that may cause native or novel disease. There is preliminary evidence of virus retransmission to wild crustaceans, but little is known about disease retransmission from farmed shrimp to wild crustaceans. Although the consequences of disease outbreaks in wild crustaceans are not known, disease outbreaks have been severe in farmed shrimp and caution is warranted. On a precautionary principle, therefore, because amplification and transmission of native and novel diseases to wild stocks is theoretically possible, both of these primary factors are considered “moderate” conservation concerns. Secondary Factor - Bio-safety risks inherent in operations Biosecurity has been defined as "...sets of practices that will reduce the probability of a pathogen introduction and its subsequent spread from one place to another..." (Lotz 1997). According to FAO (2003):
“The basic elements of a biosecurity program include the physical, chemical and biological methods necessary to protect the hatchery from the consequences of all diseases that represent a high risk. Effective biosecurity requires attention to a range of factors, some disease specific, some not, ranging from purely technical factors to aspects of management and economics. Various levels and strategies for biosecurity may be
Farmed Imported Marine Shrimp: Thailand September 2010
41
employed depending on the hatchery facility, the diseases of concern and the level of perceived risk. The appropriate level of biosecurity to be applied will generally be a function of ease of implementation and cost, relative to the impact of the disease on the production operations. Responsible hatchery [farm] operation must also consider the potential risk of disease introduction into the natural environment, and its effects on neighboring aquaculture operations and the natural fauna.”
The risk of disease retransmission to wild crustaceans, like the issue of escapes, appears to be largely dependent on the type of aquaculture method used, with open systems carrying the highest risk. Any system in which water enters the environment from the farm carries some risk. Closed aquaculture systems have the lowest potential for releasing pathogens into the environment (Blazer and LaPatra 2002). Wastewater from these closed systems can be treated, and intermediate hosts and carriers (for example birds, snails and crabs) can be excluded from the culture facility. Ponds and flow-through systems, on the other hand, pose some risk in terms of pathogen transfer to wild populations of shrimp, as both systems can spread diseases through discharges of wastewater, escapes of farmed shrimp and intermediate hosts. In addition, limiting water exchange is generally acknowledged as a key factor for increasing economic and ecological sustainability of shrimp farms. The International Principles for Responsible Shrimp Farming (FAO/NACA/UNEP/WB/WWF 2006) make the following statements regarding pollution management (note that pollution includes pathogens, nutrients and chemical contaminants):
“The major producing countries such as Thailand, Indonesia, and Vietnam have realized the pollution impacts associated with shrimp farming and have made efforts to reduce water exchange. In 2006 the Food and Agriculture Organization on the United Nations, along with the UN Environmental Programme, the Network of Aquaculture Centers of Asia-Pacific (NACA), the World Bank, and World Wildlife Fund came together to produce the International Principles for Responsible Shrimp Farming. This set of guidelines identified water use as one of the top three principles following site location and farm design (FAO et al. 2006).”
Given the fact that virtually all Thai shrimp farms use open ponds, the degree of water exchange therefore becomes a major determining factor for biosecurity. As previously defined, Frequent Exchange Systems have the greatest degree of water exchange with the environment, Harvest Exchange Systems discharge water only twice a year at harvest and Infrequent Exchange Systems do not discharge water over multiple production cycles (see “‘Closed’ Production Systems of Thailand” in the Introduction for details). Among these three types of systems, the protocols for Infrequent Exchange Systems provide the greatest biosecurity by limiting water discharges (and escaped animals) to the environment. Generally, high-intensity production in Thailand promotes pathogen amplification, and open ponds may allow virus retransmission via water discharges, escapes and predator movement between ponds and the environment. In addition, regulations for wastewater treatment do not include disinfection. These practices generally create a “high” biosecurity risk. However, Infrequent Exchange Systems are a “moderate” biosecurity risk because wastewater discharges to the environment occur much less often than those from Harvest Exchange or Frequent Exchange Systems.

Farmed Imported Marine Shrimp: Thailand September 2010
42
Secondary Factor - Stock status of affected wild shrimp As discussed in “Criterion 2 Risk of Escaped Shrimp to Wild Stocks” above, the stock status of wild shrimp in Thailand is considered a moderate conservation concern based on the stability of landings in Thailand. Synthesis Historically, there have been widespread disease outbreaks at shrimp farms and major epidemics across the industry in every production region, but evidence of disease retransmission to wild crustaceans is scant. Disease-causing viruses have been transported between farms across the globe, and although movement restrictions of live animals have tightened throughout the industry, the transfer of novel viruses and novel strains of existing viruses continues to be a concern in modern agriculture and aquaculture industries. Due to the severe disease problems suffered by the shrimp farming industry, Thai shrimp farmers have increased their biosecurity practices to reduce the likelihood of outbreaks and economic losses. Such measures include disinfecting water inputs, monitoring shrimp movements, using hatchery-raised SPF and SPR PL and limiting water exchanges. For shrimp, it is important to distinguish between the presence of a virus and a disease outbreak. The presence of a virus does not necessarily indicate that disease is present, and there may be no adverse effects. With regard to disease (whether native or novel), there is a general lack of evidence showing amplification and retransmission to wild stocks from Thai farmed shrimp. There is, however, the continuing presence of native and novel viruses on farms as well as evidence of the novel virus TSV in wild populations, creating a theoretical risk of retransmission of both native and novel disease to wild stocks, which are “moderate” conservation concerns. The bio-safety risks inherent in Thai shrimp farm operations are considered “high” for most farms because ponds are open to the environment, high stocking densities promote pathogen amplification, common viruses are found on farms, and regulations do not include wastewater disinfection. Reducing water exchange can decrease the risk, but discharging water just twice yearly at harvest (i.e., Harvest Exchange Systems) still results in releasing large quantities of water (which may contain pathogens and escaped animals) to the environment. However, Infrequent Exchange Systems that do not discharge water over multiple (more than one) cycles are considered a “moderate” bio-safety risk because water exchange is much more limited compared to Harvest and Frequent Exchange Systems. Overall, the risk of farmed shrimp affecting wild stocks through the introduction, amplification or retransmission of disease is generally considered “High” except for farms that do not exchange water even at harvest over multiple cycles (Infrequent Exchange Systems), which are a “Moderate” concern. Risk of Disease Transfer to Wild Stocks Rank Frequent Exchange Systems, Low Moderate High Critical Harvest Exchange Systems Infrequent Exchange Systems Low Moderate High Critical

Farmed Imported Marine Shrimp: Thailand September 2010
43
Criterion 4: Risk of Pollution and Habitat Effects Guiding Principle: Sustainable aquaculture operations employ methods to treat and reduce the discharge of organic effluents and other potential contaminants so that the resulting discharges and other habitat impacts do not adversely affect the integrity and function of the surrounding ecosystem. Factors: A – Effluent Effects
• Effluent water treatment • Evidence of substantial local effluent effects • Evidence of regional effluent effects • Extent of local or regional effluent effects
B – Habitat Effects
• Potential to impact habitats – location • Potential to impact habitats – extent of operations
A - Effluent Effects Human activities are increasingly influencing regions, ecosystems and global processes. The effects of adding nutrients to terrestrial and aquatic habitats (i.e., nitrogen and phosphorus) have been seen worldwide. Excess nutrients, particularly runoff from agriculture, enter marine and freshwater environments and either break down by a variety of chemical and biological processes or lead to deterioration in water quality. Distortion of the nitrogen cycle and phosphorus flows have resulted in eutrophication of entire ecosystems, which has shifted freshwater lakes from clear to turbid and produced anoxic marine waters or “dead zones.” Although agriculture is the major contributor to these shifts, effluent from the expanding aquaculture industry can also substantially impact aquatic ecosystems. The quality and quantity of effluent discharged from shrimp farms is dynamic and depends on several aspects of the farm production system and its management. Effluent loads discharged to the environment depend on pond water quality and the water exchange rate. The potential for the greatest impacts results from frequent release of poor quality pond water. There is less potential impact from closed or semi-closed systems—where natural processes help mitigate pollution—or from water recycling systems in which discharges are infrequent and wastes can be properly treated and disposed (Boyd et al. 2008). According to Boyd et al. (2008), earthen ponds have the ability to assimilate nitrogen and phosphorus through physical, chemical and biological processes. However, ponds often have higher concentrations of nutrients, plankton, suspended solids, and carry a higher biological oxygen demand (BOD) than the water bodies into which they discharge. Discharging nutrients and suspended solids can have adverse effects on the receiving waters, including stimulating algal blooms and creating hypoxic or anoxic conditions (Burford et al. 2003). According to Vaiphasa et al. (2007 and references therein), waste materials discharged from shrimp farms

Farmed Imported Marine Shrimp: Thailand September 2010
44
contain liquid biochemical substances and both non-soluble and soluble solid biochemical substances including fertilizers, pesticides, disinfectants, antibiotics, immunostimulants, vitamins and feed additives. Testing recently began with concrete-lined recirculating systems, but typical Thai shrimp farms are earthen ponds or ponds lined with HDPL plastic. Earthen ponds can assimilate nitrogen (N) and phosphorus (P), but HDPL-lined ponds have substantially less capability to do so. Accordingly, the nutrients in effluent from earthen ponds are more dilute compared to the sludge removed from HDPL ponds after harvest (C. Boyd, pers. comm., 26 Oct 2009). The diagrams in Figures 12 and 13 show typical nutrient dynamics and nitrogen budgets in earthen shrimp ponds.
Figure 12. Earthen shrimp pond nutrient dynamics, graphic from Sonnenholzer (2008).
Figure 13. Nitrogen budget and fate of pollutants in intensive shrimp ponds (earthen). Adapted from Funge-Smith and Briggs (2003) in Sonnenholzer (2008). Although Figure 13 was originally published in 1998, it is still considered a good approximation of the nutrient dynamics in earthen shrimp ponds. This model shows that 30% of the nitrogen inputs and by-products are broken down within the ponds while 18% of the inputs leave the pond as harvested shrimp, 10% are discharged during harvest, and 40% (15% erosion + 24% sediment) may be discharged via sludge removal. This model suggests that shrimp and natural

Farmed Imported Marine Shrimp: Thailand September 2010
45
processes assimilate about half of the nutrient inputs in earthen ponds. In addition, effluent treatment via settling ponds can be effective at removing excess nutrients from wastewater. For example, Trott et al. (2004) confirmed the natural ability of settling ponds to process nutrients; they found that high sedimentation rates combined with rapid accumulation prevented the release of most carbon and nitrogen from Muddy Creek in Australia. The authors concluded that the lack of obvious eutrophication was probably due to a combination of biological and physical processes in the creek such as:
• rapid settling of nutrient rich particulates in the forest and creeks; • effective flushing and scouring of sediments during spring tides and/or wet season run-
off; • rapid grazing by zooplankton; • rapid consumption of particulates and zooplankton by mobile fish populations; and • intermittent seasonal farm discharges that allow ‘‘fallowing’’ of the estuary.
The first process listed above is likely to be important for Thai shrimp farming because of the widespread use of earthen ponds. Despite variations and uncertainties, natural pond processes clearly do not eliminate all excess nutrients. The exact fate of nutrients released from shrimp farms is often unclear. Boyd and Gautier (2000) emphasize the high degree of variability in nutrient outputs (nitrogen varied from 0.02 to 2,600 mg/L, median 2.4; phosphorous varied from 0.01 to110 mg/L, median 2.6; and total suspended solids varied from 10 to 3671 mg/L, median 10 mg/L). Recent case studies describing nutrient budgets in shrimp ponds are helpful. For example, a Vietnamese case study by Long and Toan (2008) found that shrimp ponds retained 16% and 9%, respectively, of nitrogen and phosphorus inputs and released 118±120 kg N and 30±33 kg P per ton of shrimp. These data are specific to Vietnam but are useful as estimates. For Thailand, the work of Briggs and Funge-Smith (1995), although not recent, estimates that the 40,000 ha of intensive shrimp ponds in Thailand at that time produced nitrogen and phosphorus waste equivalent to 3.1–3.5 and 4.6–7.3 million people, respectively. In 2008, there were 52,000 ha of shrimp ponds in Thailand. Shrimp farms in Thailand are located both inland and in coastal areas. Because L. vannamei are euryhaline (tolerant to a wide range of salinities), low-salinity shrimp farming is possible along inland estuaries and rivers. The first low-salinity shrimp farms in Thailand appeared in the central basin before 1990 along the estuaries and rivers flowing to the Gulf of Thailand: the Bangpakong, Chao Phraya, Thachin and Maekhlong (Flaherty et al. 2000). These areas are well suited to low-salinity shrimp farming because saltwater intrusion during the dry season (November to April) allows one shrimp crop per year in brackish water as far as 120 km from the coast. Low-salinity shrimp farming developed rapidly once farmers began importing hyper-saline water during the rainy season and increased production to two or three crops per year. Researchers studying nutrient dynamics in Thailand have stated that low-salinity shrimp farms and coastal farms using reduced water exchange systems experience similar problems as a result of nutrient and sediment accumulation such as heavy phytoplankton blooms in ponds (Funge-Smith and Briggs 1998). It is difficult to estimate the percentage of shrimp farms that are “coastal” vs. “inland” as there are numerous small inland farms smaller than one hectare (Szuster and Flaherty 2002a). Based on environmental concerns, the Thai government banned P. monodon shrimp farming

Farmed Imported Marine Shrimp: Thailand September 2010
46
nationwide in non-coastal provinces in 1998. The practice persists, however, due to weak enforcement (Szuster 2003) and because the ban did not address L. vannamei, which now represents virtually the entire industry. According to the Aquaculture Research Group, inland shrimp farming does not extend as far inland as it once did because the cost of trucking saline water inland is now prohibitive (B. Szuster, pers. comm., 17 February 2010). Thailand’s Pollution Control Department sets maximum allowable water quality parameters for Thai aquaculture that focus on BOD, suspended solids, and N and P (see Criterion 5, Management below), but it is not clear how effectively these regulations are enforced. The Pollution Control Department also offers publicly available information about water quality standards and its monitoring efforts (http://www.pcd.go.th/indexEng.cfm). Effluent Water (and Sediment) Treatment Information from the Thai DOF indicates that 80% of Thai shrimp farmers have systems that reduce water exchange during production cycles and restrict water discharges. Truly closed farming systems (such as concrete recirculating tanks) are rare in Thailand (Bluffstone 2007) where nearly all shrimp aquaculture production uses earthen ponds. To maintain water quality, Thai shrimp farmers recondition and then recycle water for the next production cycle. Additionally, 80% of Thai shrimp farmers treat effluent before discharge (DOF), commonly through the use of settling ponds. For details on settling pond use, see Introduction: ‘Closed’ Production Systems in Thailand. Closely related to environmental concerns about the fate of waterborne effluents is the issue of pond bottom sediment disposal. Earthen ponds cannot assimilate all nutrients and those that remain are left in pond bottom sediments, also known as sludge. According to Szuster and Flaherty (2002), sludge consists of uneaten food pellets, feces and eroded pond soil; it tends to accumulate in the center of ponds and is rich in nitrogen, phosphorus and carbon relative to the surrounding sediments. A model developed by Sonnenholzer (2008) suggests that, in general, 27% of the N inputs leave earthen ponds during water discharges and 40% during sediment removal. Similarly, Szuster (2001) found that a large percentage of the total organic waste load produced by shrimp farms remains in pond sludge. Settling ponds capture some of the nutrient load and are preferred over releasing effluent directly to environmental waters. In any case, sediment eventually must be removed from grow-out and settlement ponds, and needs proper treatment and disposal. Sediment disposal is controversial in Thailand. Poor practices include flushing sediments into common water bodies with high pressure hoses, dumping wet sediment on public lands or in water canals, or allowing tides to flush sludge into the environment (Szuster and Flaherty 2002b). The nutrients in these sediments can cause eutrophication and phytoplankton blooms, resulting in low oxygen levels that can kill fish and other aquatic life. Better practices include allowing the pond to dry between production cycles, then removing the sediment and using it for bank and pond maintenance, construction or fertilizer. Dried sludge may also be deposited at a disposal site on the farm. According to P. Vandergeest, certification by GAP involves inspection of sediment disposal facilities and practices because this issue generates so much conflict in Thailand (York University, pers. comm., 4 April, 2010). Szuster and Flaherty (2002) state that sludge disposal is problematic in all shrimp farming areas but particularly in inland regions

Farmed Imported Marine Shrimp: Thailand September 2010
47
because the small streams and irrigation canals that support inland shrimp farms generally have little assimilative capacity, and water quality can be significantly degraded by sludge dumping. Dumping pond sludge into any water body is illegal in Thailand but continues due to a lack of farmer awareness and weak enforcement. A precautionary approach suggests characterizing typical practices to include discharging partially treated effluent, which is a “moderate” conservation concern. Evidence and Extent of Local and Regional Effects Szuster (2006) reports that water quality in many parts of central Thailand is severely degraded and cannot support fisheries or activities such as swimming. This situation intensifies during the dry season (November to April) when nutrient loads from agriculture, industry and municipal sources result in algal blooms and very low dissolved oxygen. Effluents from shrimp farms are a major concern because wastes can be highly enriched with organic pollutants (Szuster and Flaherty 2002b). Regional inland water quality for the four main rivers of Thailand’s central basin was described by Simachaya (2003) from Thailand’s Pollution Control Department. The report covers the period 1993–2002 for the Chao Phraya, Thachin, Maeklong and Bangpakong Rivers, which all discharge into the Gulf of Thailand. The report states:
“The results indicated that the lower parts of the Chao Phraya and Thachin Rivers were degraded and that several major parameters exceeded the National Surface Water Quality Standards and Classification1. The major water quality problems were low dissolved oxygen (DO), high ammonia-nitrogen, high fecal coliform bacteria, high turbidity, and high organic matter (biochemical oxygen demand, BOD), respectively. The major sources of water pollution were communities, industry, and agriculture. However, the proportion each source contributed varied from river to river. For example, communities were the major sources of pollutants discharged into the lower part of the Chao Phraya River, whereas industry was the significant contributor of pollutants into the lower part of the Thachin River. The degradation of water quality in the major rivers has affected the water quality and natural resources in the Gulf of Thailand…. [In conclusion] the water quality in the four major rivers was generally poor with the potential for severe degradation.”
According to Simachaya (2003), the overall major sources of pollution were domestic, industrial and agricultural, but shrimp farm discharges were an issue for the Bangpakong River. The Bangpakong River is 122 kilometers long and serves as a water supply for domestic, agricultural, aquacultural and industrial uses. The majority of the waste discharged into the river is organic and is generated by communities, industry, pig farms and aquaculture. In general, the Bangpakong River is categorized as Class 3 water quality (medium clean: suitable for agriculture 1 The National Environmental Board was notified of the National Standard of Surface Water Quality and Classification for Thailand’s surface water in 1994. There are five classes considered for surface water quality that are used to support the receiving water based on major beneficial uses. These are as follows: Class 1: Extra clean for conservation purposes; Class 2: Very clean, used for (1) consumption after ordinary water treatment processes, (2) aquatic organism conservation, (3) fisheries, and (4) recreation (for example, DO > 6 mg/l, BOD < 1.5 mg/l, and TCB < 5,000 MPN/100 ml); Class 3: Medium clean, used for (1) consumption after ordinary treatment process and (2) agriculture (for example, DO > 4 mg/l, BOD < 2 mg/l, and TCB < 20,000 MPN/100 ml); Class 4: Fairly clean, used for (1) consumption after special treatment process and (2) industry (for example, DO > 2 mg/l, BOD < 4 mg/l); Class 5: Water not classified in Class 1–4, used for navigation.

Farmed Imported Marine Shrimp: Thailand September 2010
48
but not consumption without treatment, see Footnote 1). Similar findings were reported in the review by Szuster and Flaherty (2002) of low-salinity shrimp farming in the Bangpakong River basin. Szuster and Flaherty (2002) state that the organic content of typical untreated effluent during the early to mid grow-out period were only slightly higher than many receiving waters in Thailand and generally within effluent standards. However, untreated effluent during the late grow-out period and at harvest can be highly enriched with organic pollutants such as nutrients, solid organic matter and salt. They reported that 59% of effluent flows in the lower Bangpakong River were from low-salinity shrimp farms. The supporting data are not recent, however, and should be considered cautiously. The study by Szuster and Flaherty (2002a) evaluated the Bangpakong drainage basin for cumulative regional impacts from inland shrimp ponds. They found that low salinity shrimp farming was a significant new source of organic pollution in an area already degraded by agriculture and industry. They also found evidence that low salinity shrimp farming degraded soil productivity directly (shrimp pond soils) and may indirectly create negative regional impacts via widespread seepage. Other researchers measured increased salinities in canals receiving pond discharge at levels that impact irrigated rice and fruit orchard crops (Braaten and Flaherty 2001). They also found elevated soil and water salinity in adjacent rice fields, likely due to seepage from shrimp ponds as 45% of the initial salt content in shrimp ponds was lost through seepage. In addition to operating shrimp ponds, abandoned ponds are also an environmental concern. Effects are generally localized but can be widespread because the estimated total area of abandoned shrimp ponds in Thailand ranges from 24,000 to 32,000 ha (Sanit et al. 2004). Salinization of soils can occur because salts accumulate over time as ponds are repeatedly filled and dried. Towatana et al. (2002) found that the soil salinity in some abandoned ponds was too high to support even halophytes (salt-tolerant plants), and that ponds required active soil reclamation because the accumulated salts remained even several years after abandonment. Mr. R. Lewis, a consultant who has successfully restored mangrove forests, states that after pond abandonment, passive mangrove restoration via natural processes can occur over periods of 15 to 30 years if 1) normal tidal hydrology has not been disrupted, and 2) there are waterborne mangrove propagules available from adjacent stands (Lewis 2005). Other issues after pond abandonment include chemical contaminants and salinization of freshwater and soils. Accordingly to Gräslund et al. (2003), the most commonly used products by Thai shrimp farmers (in order of frequency of use) are pesticides, disinfectants, microorganisms, feed additives, vitamins, antibiotics, fertilizers and immunostimulants. The assessment by Visuthismajarn et al. (2005) found that the greatest environmental risk from abandoned ponds came from the metals manganese, cadmium and copper. Mangrove forests provide many important ecological services. Mangrove forest services, as well as forest losses due to shrimp farm development, are discussed in detail below in “B – Habitats.” Although many mangrove forests are not cut down to develop shrimp ponds, there are negative local effects on their health as a result of effluent release because many shrimp farms are located in or adjacent to mangrove forests. The study by Vaiphasa et al. (2007) showed reduced growth and increased mortality of mangroves in areas that received sediments from shrimp farms in Pak Phanang. Siting shrimp ponds behind mangroves itself blocks or reduces fresh water inputs and nutrients into the mangrove zone, thus weakening or killing once healthy mangroves.

Farmed Imported Marine Shrimp: Thailand September 2010
49
The local and regional effects of shrimp farm effluent and sediments include significant contributions to the severely degraded water quality in central Thailand, loss of soil productivity due to salinization from operational and abandoned shrimp ponds, and reduced health of mangrove forests affected by farm effluents. Thus, factors concerning local and regional effects from pollution are both considered “high” conservation concerns for shrimp farms in Thailand. The extent to which local or regional effluents exceed set standards is largely unknown and thus considered a “moderate” concern. B - Habitats Seafood Watch criteria consider both the location and the extent of operations (shrimp stocking and/or farm density) in ranking the potential for shrimp farms to negatively impact habitats. The Gulf of Thailand is a large shallow bay (800 km long and up to 560 km wide) bordering a large area of intertidal mudflats. The Gulf is formed by the estuary of four major rivers: the Mae Klong, the Tachin, the Chao Phraya and the Bangpakong. According to Giesen et al. (2007), the extensive intertidal areas formerly supported extensive mangrove forests, but today they are usually found only as a narrow (10–100 m) fringe. Areas of low scrub in brackish marshes are located further inland. Shrimp ponds and salt pans extend inland two to three kilometers in some places. These, along with offshore mudflats, are important habitat for thousands of shorebirds. This area has an extremely dense human population, with increasing concentrations of heavy industry, especially near Bangkok along the lower reaches of the Chao Phraya River. Southern Thailand (Malay Peninsula) is bounded by the Gulf of Thailand to the east and the Andaman Sea to the west. Unlike northern Thailand, the Malay Peninsula is generally tropical rainforest, except at the coast where shrimp farms are located. The western side of the peninsula has steeper coasts, and the east side is dominated by river plains. Historically, many of Thailand’s coastal areas supported mangrove forests. In the past three decades, many forested areas have undergone habitat alteration for various purposes including the development of shrimp farms. The destruction of mangrove forests (and other sensitive wetlands) during the construction, operation and expansion of shrimp farms has been perhaps the most controversial aspect of the shrimp farming industry’s rapid development. Mangrove forests are tropical and subtropical wetlands characterized by coastal tidal areas with salt-tolerant mangroves and other species. In recognition of their importance, the Convention on Wetlands of International Importance especially as Waterfowl Habitat was signed in 1971 in Ramsar, Iran, commonly known as Ramsar or the Ramsar Convention. Its mission is “the conservation and wise use of all wetlands through local, regional and national actions and international cooperation, as a contribution towards achieving sustainable development throughout the world” (Ramsar Convention Secretariat 2006). As of July 2010, there are 160 signatories and 1891 sites totaling more than 185 million hectares designated as wetlands of international importance. Thailand signed the convention in September 1998 and now has 10 sites totaling 370,600 hectares.

Farmed Imported Marine Shrimp: Thailand September 2010
50
Mangrove forests (and wetlands in general) are considered to be ecologically important for the following reasons, described by the Ramsar Convention Manual (www.ramsar.org):
• water storage; • storm protection and flood mitigation; • shoreline stabilization and erosion control; • groundwater recharge (the movement of water from the wetland down into the underground
aquifer); • groundwater discharge (the movement of water upward to become surface water in a wetland); • water purification; • retention of nutrients; • retention of sediments; • retention of pollutants; • stabilization of local climate conditions, particularly rainfall and temperature.
Various estimates of mangrove forest cover and loss throughout the world require careful interpretation, including for Thailand. One study found that 56% of Thailand’s original mangrove forest area has been lost (Charuppat and Charuppat 1997) while Kongsanchai (1994) estimated a loss of 50% and Wilkie and Fortuna (2003) placed their estimate at 22%. There are also differing estimates of the proportion of losses due to shrimp farm construction, from 33% (Charuppat and Charuppat 1997) to 65% (Giesen et al. 2006). Valiela et al. (2001) pointed out that many estimates are not directly comparable because there are different techniques for measuring area, different definitions of mangrove forest and differences in data interpretation among surveys. Nevertheless, there is meaningful information to be gleaned from many of the estimates. A thorough review of various estimates by Valiela et al. (2001) found the surveys by Charappat and Charappat (1997) to be robust and especially useful because they cover a 36-year period, but the review by Dulyapurk et al. (2007) described Charappat and Charappat’s (1997) most recent estimate of forest cover (in 1996) as the “least optimistic.” This is likely due to the change in methodology recently used by the Royal Forest Department (RFD) in assessing area: since the mid-1990s the scale of remote-sensing imagery has changed from 1:250,000 to 1:50,000, which has increased accuracy and allowed the inclusion of smaller areas in the total calculation (Mangrove Guide FAO 2007). Thus, comparisons made by Charappat and Charappat (1997) in their 36-year survey are highly useful, but there are discrepancies when comparing their estimates to more recent surveys such as those by Dulyapurk et al. (2007). The detailed data on mangrove forest cover in Thailand from Charuppat and Charuppat (1997) is in Thai, but Aksornkaoe & Tokrisna (2004) reported the same information in English. From Table 6, Charuppat and Charuppat (1997) compared mangrove forest area in Thailand before 1961 to area in 1996, showing a loss of approximately 56%. This estimate is likely to have underestimated total mangrove area (Dulyapurk et al. 2007) but is nevertheless considered robust for making comparisons over time (Valiela et al. 2001). To be precautionary, 56% is used here as a conservative estimate of mangrove forest loss over time.
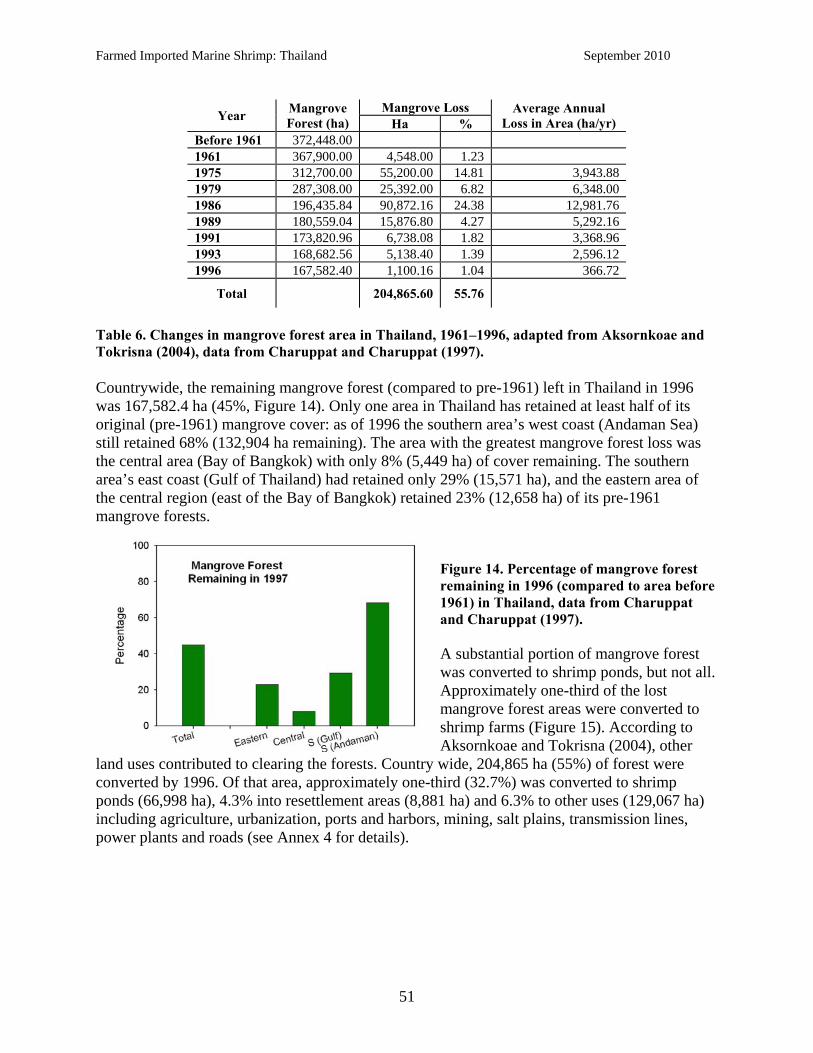
Farmed Imported Marine Shrimp: Thailand September 2010
51
Mangrove Loss Year Mangrove Forest (ha) Ha %
Average Annual Loss in Area (ha/yr)
Before 1961 372,448.00 1961 367,900.00 4,548.00 1.23 1975 312,700.00 55,200.00 14.81 3,943.88 1979 287,308.00 25,392.00 6.82 6,348.00 1986 196,435.84 90,872.16 24.38 12,981.76 1989 180,559.04 15,876.80 4.27 5,292.16 1991 173,820.96 6,738.08 1.82 3,368.96 1993 168,682.56 5,138.40 1.39 2,596.12 1996 167,582.40 1,100.16 1.04 366.72
Total 204,865.60 55.76
Table 6. Changes in mangrove forest area in Thailand, 1961–1996, adapted from Aksornkoae and Tokrisna (2004), data from Charuppat and Charuppat (1997). Countrywide, the remaining mangrove forest (compared to pre-1961) left in Thailand in 1996 was 167,582.4 ha (45%, Figure 14). Only one area in Thailand has retained at least half of its original (pre-1961) mangrove cover: as of 1996 the southern area’s west coast (Andaman Sea) still retained 68% (132,904 ha remaining). The area with the greatest mangrove forest loss was the central area (Bay of Bangkok) with only 8% (5,449 ha) of cover remaining. The southern area’s east coast (Gulf of Thailand) had retained only 29% (15,571 ha), and the eastern area of the central region (east of the Bay of Bangkok) retained 23% (12,658 ha) of its pre-1961 mangrove forests.
Figure 14. Percentage of mangrove forest remaining in 1996 (compared to area before 1961) in Thailand, data from Charuppat and Charuppat (1997). A substantial portion of mangrove forest was converted to shrimp ponds, but not all. Approximately one-third of the lost mangrove forest areas were converted to shrimp farms (Figure 15). According to Aksornkoae and Tokrisna (2004), other
land uses contributed to clearing the forests. Country wide, 204,865 ha (55%) of forest were converted by 1996. Of that area, approximately one-third (32.7%) was converted to shrimp ponds (66,998 ha), 4.3% into resettlement areas (8,881 ha) and 6.3% to other uses (129,067 ha) including agriculture, urbanization, ports and harbors, mining, salt plains, transmission lines, power plants and roads (see Annex 4 for details).

Farmed Imported Marine Shrimp: Thailand September 2010
52
Figure 15. Land use in converted mangrove forest in Thailand, data from Charuppat and Charuppat (1997). The estimated area converted to shrimp ponds includes abandoned ponds. Overall trends from Charuppat and Charuppat (1997) for the period 1961–1996 show that 1) 56% of Thai mangrove forests were lost (in order from greatest to least) from the central farming area (Bay of Bangkok), the eastern portion of the central region (east of the Bay of Bangkok), the eastern coast of south Thailand and the western coast of south Thailand; and 2) of the forest that was converted, 33% was developed into shrimp farms, with the greatest loss to shrimp farms in the eastern area, the eastern coast of south Thailand, the central area and the western coast of south Thailand. The land use maps developed by Prabnoarong and Thongkao (2006) compare mangrove forest cover in 1974 and 2003 in Pak Panang Bay in the southern farming region’s east coast (Figure 16), showing increasing encroachment of shrimp farms into the mangrove forest from inland areas adjacent to rice paddies. A) B) Figure 16. Land use changes in Pak Panang Bay, Nakhon Si Thammarat Province in the southern area of Thailand. A) 1974, B) 2003. Color key: Red, mangroves; yellow, shrimp farms; green, paddy fields; dark gray, village/orchards. Figures from Prabnoarong and Thongkao (2006). Thailand’s government began responding in the early 1990s to the loss of its mangrove forest areas by restricting forest use and replanting mangroves. Today, most of Thailand’s remaining mangrove forests are found in the southern area on the west coast (Figure 17). A recent estimate

Farmed Imported Marine Shrimp: Thailand September 2010
53
of mangrove forest cover in Thailand was conducted via survey in 2004 by Thailand’s Department of Marine and Coastal Resources (DMCR) and reported by Dulyapurk et al. (2007). The survey reported that mangrove forest areas are distributed along the 23 coastal provinces, consisting of 17 provinces on the Gulf of Thailand Coast and 6 provinces on the Andaman Sea Coast (see Annex 4 for details). The total mangrove area was 233,699 ha, which consists of 174,335 ha (74.60%) on the western side of southern Thailand (Andaman Sea), 28,638 ha (12.25%) on the eastern side of southern Thailand (Gulf of Thailand), 24,370 ha (10.43%) in the eastern area (Gulf of Thailand) and 6,357 ha (2.72%) in the central area (Gulf of Thailand).
The Dulyapurk et al. (2007) estimate of mangrove forest cover in 2004 totaled 233,700 ha for the entire country of Thailand. This estimate is not directly comparable to the Charappat and Charappat (1997) study but nevertheless makes it clear that by 2004 there was still considerably less mangrove forest area in Thailand than was reported before 1961 (372,448 ha). Figure 17. Distribution of mangrove forest in Thailand in 2004, map from Dulyapurk et al. (2007), data from Thailand Department of Marine and Coastal Resources. The Thai government’s replanting efforts continue. For example, the DMCR Mangrove Management Plan for 2004–2008 calls for planting, enriching and conserving 115,200 ha by the end of this decade (World Bank 2007). Based on data from Thailand’s Department of Fisheries and Royal Forest Department, there have been substantial increases in mangrove forest cover since the mid 1990s. Recent gains in mangrove forest cover have been attributed to increased resolution imagery that captures more small-scale forests as well as to Thailand’s replanting efforts

Farmed Imported Marine Shrimp: Thailand September 2010
54
(Giesen et al. 2007). Giesen (2007) reported that by 2000, according to the Royal Forestry Department, the total mangrove area in Thailand was 244,161 ha, which means that Thailand is the only SE Asian country reported to have increased its mangrove area during the past decade. Admittedly, recent gains in mangrove forest cover from replanting efforts have not completely mitigated the losses; the total area is still far less than the 372,448 ha reported prior to 1961 (Charuppat and Charuppat 1997), and the biodiversity value of the replanted areas is unknown. Whether or not mangrove forest restoration efforts are successful in Thailand (and other countries) is not well documented. Lewis (2005) states that such restoration attempts often fail completely, and there are few baseline and outcome studies to judge the success of restoration efforts. According to Pinsak Surasavadi, director of the Thai Department of Marine and Coastal Resources, which currently oversees some 242,811 ha of coastal mangrove area in the country, while the level of mangrove cover is stable and "even increasing, 40 percent is still not in good condition," including those mangroves that remain in shrimp farming areas. There are other inconsistencies in area estimates of Thailand’s mangrove forests. According to the Ramsar Convention website (www.ramsar.org), there are currently ten sites designated as Wetlands of International Importance in Thailand with a combined surface area of 370,600 ha (see Annex 4 for details). However, the surface area of just these ten Ramsar sites is very close to the reported area of total mangrove cover in Thailand before 1961 (372,488 ha) by Charuppat and Charuppat (1997), and well above the area estimated in 2000 (Gieson 2007, 244,161 ha) and in 2004 (Dulyapurk et al. 2007, 233,700 ha). Despite the inherent difficulties in making comparisons in total mangrove forest cover over time, it is clear that forest damage in Thailand is no longer occurring at the same high rate that it once was (compare 12,982 ha lost in 1986 to 367 ha in 1996, Table 6). There are reports of significant recovery in total mangrove forest area (Figure 18), but the ecological value of these gains in area is questionable.
Figure 18. Losses and gains in mangrove forest cover in Thailand from 1961 to 2004, from World Bank (2007), data from Thailand DOF. Mangrove forests can be impacted in ways other than by direct clearance. Eutrophication from farm discharges may not directly affect the mangroves, but can affect the periphyton and prop root communities at the base of the food chain. The excess nutrients, including added chemicals and exotic pathogens, are discharged into the open environment (Glenn et al. 2006 and references therein). Recent
peer-reviewed information on these impacts is limited. Vaiphasa et al. (2007) reported that although mangroves can tolerate the chemical contents of shrimp farm wastes, mangroves have limited capacity to cope with the excessive amount of solid sediments discharged from ponds, as mangroves in general are not able to tolerate extreme sedimentation. On the other hand, Gautier (2002) points out that mangrove forests can effectively assimilate and filter shrimp pond effluents before discharge to adjacent water bodies. Experimental results in India and Thailand indicate that shrimp pond effluent and sludge had a negative effect on some species of mangrove

Farmed Imported Marine Shrimp: Thailand September 2010
55
shoots but a positive effect on mangrove seedling growth when diluted (Rajendran and Kathiresan 2008). Factors considered in this report to determine the potential for habitat impacts include the location and extent of farming operations. With regard to location, siting shrimp farms in highly sensitive mangrove forest habitats is considered a high conservation concern. While some farms are also located in coastal and riparian areas, the widespread extensive losses and other impacts to Thai mangrove forests from shrimp farms dictate a “high” conservation concern for farm siting. In addition, the high-intensity production of shrimp farms and the high density of farms in many areas of Thailand indicate that the extent of operations in Thailand creates a “high” potential to impact habitats. Synthesis The Thai DOF reports that 80% of farms use production systems that reduce water exchange, but 20% frequently discharge water to the environment. Separately, DOF also reports that 80% of farms partially treat effluent before release to the environment via settling ponds. Due to associated environmental problems, there is controversy regarding the disposal of pond-bottom sludge, which is sometimes illegally flushed into public aquatic environments. These production methods are considered partial treatment of effluent, a “moderate” conservation concern. Coastal and inland shrimp ponds have negatively impacted local and regional environments. One study showed that the levels of nutrients from all shrimp farms in Thailand were estimated as comparable to the nitrogen and phosphorus waste of 3.1–3.5 and 4.6–7.3 million people, respectively. Abandoned shrimp farms may be a concern due to contamination from salts and heavy metals. There are an estimated 24,000 to 32,000 ha of abandoned shrimp farms in Thailand. Local and regional effects of shrimp farm effluent and sediments include significant contributions to the severely degraded water quality in central Thailand, loss of soil productivity due to salinization from both operational and abandoned shrimp ponds, and reduced health in mangrove forests receiving farm effluents. Accordingly, local and regional effluent effects are “high” concerns. The extent to which local or regional effluent effects exceed set standards is unknown and thus considered a “moderate” concern. Many of Thailand’s shrimp farms are located in or adjacent to highly sensitive mangrove habitats. Mangrove forests have been cleared for shrimp farm development and continue to be impacted by effluent from adjacent farms. During the period 1961 to 1997 mangrove conversion to shrimp farms accounted for an estimated 33% of Thailand’s mangrove forest losses (67,000 ha of ponds out of a total loss of 204,866 ha). Mangrove destruction is now illegal and replanting efforts continue. Various estimates of current mangrove forest cover show increases after 1996, but the health and ecological value of replanted areas is often low. In addition, effluents from shrimp farms can have a negative impact on remaining mangrove forests. The siting of shrimp farms is a “high” conservation concern due to their high potential to impact sensitive mangrove habitats. In addition, the extent of operations is a high conservation concern due to the high density of farms and high intensity of production on these farms. Thailand has made improvements to its shrimp farming industry that help minimize pollution and protect sensitive habitats. However, the high density of intensive production systems cause

Farmed Imported Marine Shrimp: Thailand September 2010
56
negative impacts to sensitive habitats (loss or degradation of mangrove forest, nutrient enrichment, sedimentation, salinization and chemical pollution), particularly during and after harvest. Based on evidence of substantial local and regional effluent effects, siting of farm ponds in highly sensitive habitats, and the high density of intensively stocked farms, the pollution and habitat impacts for Thai shrimp farms are a “high” conservation concern. Risk of Pollution and Habitat Effects Rank
Low Moderate High
Criterion 5: Effectiveness of the Management Regime Guiding Principle: The management regime of sustainable aquaculture operations respects all local, national and international laws and utilizes a precautionary approach, which favors the conservation of the environment, for daily operations and industry expansion. Factors:
• Demonstrated application of existing laws • Use of licensing to control the location, number, size and stocking density of farms • Effectiveness of “better management practices,” especially to reduce escaped shrimp • Effectiveness of measures to prevent and treat disease outbreaks • Existence and effectiveness of regulations for therapeutants • Use and effectiveness of predator controls • Existence of a precautionary approach to guide industry expansion
Demonstrated Application of Existing Laws Key laws relating to coastal and marine resources management in Thailand, as well as control of related human activities, are listed below (World Bank 2007).
National Environmental Quality Act (1992). Enhances and conserves natural resources and environmental quality through environmental policies and planning. The Act regulates and calls for the creation of Provincial Environmental Management Plans (PEMP), Environmental Impact Assessments (EIA), Environmental Protected Areas (EPAs) and Pollution Control Zones (PCZs), as well as standard setting and monitoring, public participation and environmental education, in addition to an environmental fund for investment. The implementing agencies are: ONEP, PCD, DEQP of MONRE, provincial and local governments of the Ministry of Interior (MOI) and other agencies.
National Park Act (1961). Protects flora and fauna by prohibiting the trade or transport of species and prohibiting human disturbances within park boundaries. The Act applies to all Marine National Parks. The implementing agencies are: MONRE Department of National Park, Wildlife and Plant Protection (DNP).
Wildlife Conservation and Protection Act (1992). Regulates the possession, trading, hunting and propagation of wildlife species, including carcasses and carcass products. The implementing agencies are: MONRE DNP and the Department of Fisheries (DOF) of MOAC.

Farmed Imported Marine Shrimp: Thailand September 2010
57
Forest Act (1941). Controls logging concessions and the collection of non-timber forest products. Concessions for mangroves were stopped in the 1990s and all concession activities were ceased in 2003. The implementing agencies are: DOF of the Ministry of Agriculture and Cooperatives (MOAC).
National Reserved Forest Act (1964). Controls the use and protection of forest areas and resources including mangroves. The implementing agencies are: MONRE and RFD.
Groundwater Act (1977, 1992, 2003). Controls the use of groundwater. The implementing agencies are: MONRE and the Department of Ground Water Resources (DGR).
Fisheries Act (1947, 1994). Governs fishing and aquaculture development through the protection of fishing habitats and nursery grounds, control of fishing gears and fishing methods, registration of fishing boats, protection of marine species, and research and development. The implementing agencies are: the DOF of the Ministry of Agriculture and Cooperatives (MOAC).
Navigation Act (1913, 1992). Regulates navigation and water transportation, including the prohibition of waste disposal into waterways and the construction, registration and operation of vessels. The implementing agencies are: Marine Department (MD) of the Ministry of Transportation (MOT).
Factory Act (1992). Controls factory operations by setting standards and regulating waste disposal. The implementing agencies are: Department of Industry (DIW) of the Ministry of Industry (MOInd).
Public Health Act (1992). Controls activities that may cause health impacts. The implementing agency is: Ministry of Public Health (MOPH).
Building Code (1979) and City and Town Planning (1975). Control the construction and operation of buildings and land use in cities and towns. The implementing agencies are: the Department of Public Works and Town and Country Planning (DPT) of MOI.
MONRE: Ministry of Natural Resources and Environment. ONEP: Office of Natural Resources and Environmental Policy and Planning. PCD: Pollution Control Department. DEQP: Department of Environmental Quality Promotion.
According to World Bank (2007), these laws were developed at different times and for different purposes, and involve multiple agencies and stakeholders, resulting in overlapping responsibilities in the management of coastal and marine resources. In addition to a lack of enforcement and cooperation, this overlap hinders the implementation of environmental plans and regulations. Limited budgets and personnel also hinder monitoring and enforcement of regulations. Similar criticism comes from the oversight used for Thailand shrimp farmers’ voluntary adherence to the internationally recognized food-safety standard, Hazard Analysis and Critical Control Point (HACCP), which is enforced by the Department of Fisheries, Food and Drug Administration of the Ministry of Public Health, National Food Institute private laboratories. There are two government agencies, one semi-public institute and a number of accredited private laboratories that have the authority to enforce the HACCP process. As a result, administrative authorities can overlap and cause administrative conflicts among implementing agencies (Dey et al. 2005). Other entities that directly regulate or manage aquaculture in Thailand include the Pollution Control Department (www.pcd.go.th/indexEng.cfm) as well as numerous local government

Farmed Imported Marine Shrimp: Thailand September 2010
58
authorities. The local authorities are unique community-based efforts, which are important both for implementing national regulations as well as creating policy (Vandergeest 2007). Thailand has specific regulations for aquaculture effluent that sets maximum allowable concentrations of certain water quality parameters (Table 7), which is unique among shrimp producing countries (Aqua Star Europe, pers. comm., D. Gautier, 12 February 2010). Table 7. Maximum allowable water quality parameters for Thai aquaculture, from Thailand Pollution Control Department (http://www.pcd.go.th/info_serv/en_reg_std_water04.html#s11).
Effluent Standards for Coastal Aquaculture
Parameter Units
Range or Maximum Permitted
Values
Method for Examination
1. pH - 6.5–9.0 pH Meter by Electrometric 2.BOD (Biochemical Oxygen Demand)
mg/l 20 Azide Modification by Synthetic Seawater
3.SS (Suspended Soilds) mg/l 70 Glass Fiber Filter Disc 4.NH3-N (Ammonia Nitrogen) mg-N/l 1.1 Modified Idophenol Blue 5.Total Phosphorus mg-P/l 0.4 Ascorbic Acid 6.H2S (Hydrogen Sulfide) Mg/l 0.01 Methylene Blue 7.Total Nitrogen -Total Dissolved Nitrogen and Total Particulate Nitrogen
mg-N/l 4.0 (1) Persulfate Digestion (2) Nitrogen Analyzer
It is unclear how rigorously these regulations are enforced, especially whether they are applied to the proper disposal of sludge during and after harvest. Findings from Huitric et al. (2002) indicate that legislation in Thailand has not kept pace with development of the industry and suffers from poor implementation. The authors state that a major challenge for Thailand’s shrimp farming industry and the associated government agencies “is to develop production systems that place the shrimp farming industry in a broader context of watershed and seascape management, which includes the accounting of societal benefits of mangrove ecosystems.” The demonstrated application of existing laws is considered a “moderate” concern based on criticism of current implementation and enforcement, particularly regarding pollution impacts. Use of Licensing to Control the Location, Number, Size and Stocking Density of Farms In 1987, the Thai government designated conservation and development zones related to mangrove lands with conservation zones prohibiting any change to mangrove forests. In development zones, any utilization of mangrove land for fisheries, tin mining, cultivation or housing must be based on good conservation practice (Aksornkoae 2004). Accordingly, Thailand

Farmed Imported Marine Shrimp: Thailand September 2010
59
has moved away from clear cutting mangroves for shrimp ponds to building ponds adjacent to them and using the mangroves to act as a filter for water effluent. While this change in development practices reduces the mass physical destruction of mangroves, there are still impacts from the chemicals, nutrient wastes and excess salinity discharged from the ponds (Vaiphasa et al. 2007). Thailand has added substantial area to its total mangrove forests in recent years and replanting efforts continue, albeit replanted areas do not have the same ecological value as the original forest. This treatment of mangrove lands is a “moderate” concern based particularly on the pollution and habitat issues stemming from the high density of high-intensity farms located in very sensitive habitats. Effectiveness of “Better Management Practices,” Especially to Reduce Escaped Shrimp Thailand’s Good Aquaculture Practices (GAP) and Code of Conduct (CoC) certification programs are designed to increase food safety and environmental sustainability, respectively. Most shrimp farms adhere to the GAP standards (72%). The traceability system in place for all GAP farms is designed to quickly identify and control any discovered residues or diseases. All postlarvae and market shrimp transactions must have Fry Movement Documents or Movement Documents (see www.thaitraceshrimp.com). According to P. Vandergeest, GAP certification has been effective in creating traceability, a noteworthy achievement (York University, pers. comm., 4 April 2010). Few farms follow the CoC standards (0.7%), because farmers do not expect any economic gains from adherence (Pongthanapanich and Roth 2006). Despite the lack of compliance with environmental standards, the Thai government is moving toward improving the sustainability of aquaculture activities. For example, in accordance with the International Principles for Responsible Shrimp Farming (FAO/NACA/UNEP/WB/WWF 2006), 80% of Thailand’s shrimp farms recycle water during production, with limited or no discharges except at harvest. This is a key factor in increasing economic and ecological sustainability, and it helps control pollution, escapes and the retransmission of pathogens. Traceability has also been improved. In 2008, the Thai government created economic incentives for the use of best management practices and developed partnerships between the research and development sectors and commercial fishermen (Tanticharoen et al. 2008). Overall, the Thai shrimp farming industry has recognized the value of BMPs, and the widespread use of systems that reduce water exchange is noteworthy. However, there are no formal regulations to prevent escapes, and non-native white shrimp may soon establish self-sustaining wild populations, if they haven’t already. For these reasons, the effectiveness of Better Management Practices is ranked a “moderate” concern. Effectiveness of Measures to Prevent and Treat Disease Outbreaks Prevention of disease is a major thrust of the shrimp industry’s biosecurity safeguards and the move to reduced water exchanges. Thailand’s Animal Epidemic Act of 2005 handed DOF the responsibility for monitoring and regulating diseases in imported and exported seafood. Since then, DOF has focused on biosecurity and the propagation of disease-free fry and fingerlings (Koesling 2009). In addition, traceability is an important aspect of the DOF’s monitoring program. Movement Documents are required from hatcheries, farms, middlemen and processing plants, and Thailand has a rapid alert system to announce food and feed regulatory problems. If

Farmed Imported Marine Shrimp: Thailand September 2010
60
any food product is deemed unfit, DOF investigates and requires remedial action from the processing plant followed by an audit and a report to the importing country. Once a disease outbreak is detected, the traceability system allows for a rapid response in which farms with positive test results are subject to health improvement plans, movement control, eradication and/or farm disinfection. This factor is considered a “low” conservation concern based on the extensive use of SPF/SPR PL and the high level of traceability within the Thai shrimp farming industry. Existence and Effectiveness of Regulations for Therapeutants AND Use and Effect of Predator Controls AND Existence of a Precautionary Approach to Guide Industry Expansion In the Thai shrimp industry, there is widespread adherence to the GAP requirements that regulate therapeutic residues in farmed shrimp but minimal adherence (< 1%) to the CoC regulations that govern outputs of antibiotics and other therapeutants from shrimp farms to the environment. Similarly, non-lethal predator controls are covered in the CoC, but this voluntary Code is seldom followed. to the CoC uses a precautionary approach by considering ecosystem impacts and mangrove forest protections, but the effectiveness of these measures is in debate. Thus, these three factors are considered “moderate” concerns based on the existence of regulations that are not yet well enforced. Synthesis Shrimp farming in Thailand is a large-scale industry producing commodity food products, yet is dominated by small-scale producers. The industry has made improvements over time, and the regulatory structure and codes of practice for aquaculture appear robust, although it is not always clear how effectively they are implemented and enforced. The movement toward reduced water exchange in shrimp ponds (with reported 80% compliance) provides benefits that include increased biosecurity, decreased risk of retransmitting disease to wild crustaceans and reduced opportunities for escapes. Also, some form of effluent treatment is reported for 80% of Thai shrimp farms. Increased biosecurity results from stocking disease-free or disease-resistant post larvae in ponds, as well as using sophisticated laboratory analyses to detect the presence of viruses. In addition, Movement Documents are required for all aspects of the industry, resulting in increased traceability and rapid responses to disease outbreaks. Along with recent advances, there are also ongoing challenges. Enforcing regulations at many small farms is difficult. The high density of high-intensity shrimp farms causes pollution impacts. Mangrove forest restoration does not replace the ecosystem value of the original forests lost to shrimp farm development. Key environmental issues such as therapeutant release into the environment, non-lethal predator controls and ecosystem management are addressed in the national Thai Code of Conduct, but this Code is voluntary and currently there is minimal compliance. Alternatively, community-based organizations are important for creating and enforcing better management factors. For these reasons, management effectiveness is considered a “Moderate” conservation concern. Effectiveness of Management Rank:
Low Moderate High

Farmed Imported Marine Shrimp: Thailand September 2010
61
IV. Overall Evaluation and Seafood Ranking Table of Sustainability Ranks
Conservation Concern Sustainability Criteria Low Moderate High Critical
Use of Marine Resources √ Risk of Escaped Fish to Wild Stocks √ Infrequent
Exchange Systems*
√ Frequent AND Harvest Exchange
Systems†
Risk of Disease and Parasite Transfer to Wild Stocks √ Infrequent
Exchange Systems
√ Frequent AND Harvest Exchange
Systems
Risk of Pollution and Habitat Effects √
Management Effectiveness √ * Infrequent Exchange Systems: Production systems that do not discharge any water to the environment over more than one production cycle. † Frequent Exchange Systems: Production systems that discharge water to the environment both during the production cycle and during harvest. Harvest Exchange Systems: Production systems that discharge water to the environment only during harvest. About the Overall Seafood Recommendation:
• A species receives a recommendation of “Best Choice” if: 1) It has three or more green criteria and the remaining criteria are not red.
• A species receives a recommendation of “Good Alternative” if: 1) Criteria “average” to yellow 2) There are four green criteria and one red criterion.
• A species receives a recommendation of “Avoid” if: 1) It has a total of two or more red criteria 2) It has one or more Critical Conservation Concerns.
Overall Seafood Recommendation:
Frequent Exchange Systems Best Choice Good Alternative Avoid Harvest Exchange Systems Infrequent Exchange Systems Best Choice Good Alternative Avoid

Farmed Imported Marine Shrimp: Thailand September 2010
62
Acknowledgements Scientific review does not constitute an endorsement of the Seafood Watch® program, or its seafood recommendations, on the part of the reviewing scientists. Seafood Watch® is solely responsible for the conclusions reached in this report. Seafood Watch is grateful for the expert reviewers who made many contributions to this report. Reviewers included those listed below and an additional anonymous reviewer.
Dr. Timothy Flegel, Head of the Center of Excellence for Shrimp Molecular Biology and Biotechnology; Professor of Biotechnology, Faculty of Science at Mahidol University in Bangkok.
Dr. Dominique Gautier, Head of Environmental and Social Programs at Aqua Star Europe.
Robins McIntosh, Senior Vice President of Charoen Pokphand Foods Public Company, Bangkok, Thailand.
Sally Ananya Surangpimol, Director of The Food School, Bangkok, Thailand.
Mr. Alfredo Quarto, Executive Director of Mangrove Action Project.

Farmed Imported Marine Shrimp: Thailand September 2010
63
V. References Aksornkoae, S. 2004. Sustainable use and conservation of mangrove forest resources with
emphasis on policy and management practices in Thailand. Pages 149-160 in M. Vannucci, editor. Mangrove management and conservation: present and future. United Nations University Press, New York, New York, USA.
Aksornkoae, S. and R. Tokrisna. 2004. Overview of shrimp farming and mangrove loss in Thailand,. Pages 37-51 in E. B. Barbier and S. Sathirathai, editors. Shrimp Farming and Mangrove loss in Thailand. Edward Elgar Publishing Limited, Glos UK and Massachusetts USA.
Alder, J., B. Campbell, V. Karpouzi, K. Kristen, and D. Pauly. 2008. Forage fish: from ecosystems to markets. Annual Review of Environmental Resources A33:153-166.
Alder, J. and D. Pauly. 2006. On the Multiple Uses of Forage Fish: From Ecosystems to Markets. Fisheries Centre Research Reports 14(3). The Fisheries Centre, University of British Columbia.
Balcázar, J. L., T. Rojas-Luna, and D. P. Cunningham. 2007. Effect of the addition of four potential probiotic strains on the survival of pacific white shrimp (Litopenaeus vannamei) following immersion challenge with Vibrio parahaemolyticus. Journal of Invertebrate Pathology 96:147-150.
Blazer, V. S. and S. E. LaPatra. 2002. Pathogens of cultured fishes: potential risks to wild fish populations.in J. Tomasso, editor. Aquaculture and the Environment in the United States. U.S. Aquaculture Society, A Chapter of the World Aquaculture Society, Baton Rouge, Louisiana.
Boyd, C. E. 2003. Guidelines for aquaculture effluent management at the farm-level. Aquaculture 226 101-112.
Boyd, C. E. and D. Gautier. 2000. Effluent composition and water quality standards. Pages 61-66 Global Aquaculture Advocate
Boyd, C. E., C. Tucker, A. McNevin, K. Bostick, and J. Clay. 2008. Indicators of resource use efficiency and environmental performance in fish and crustacean aquaculture. Reviews in Fisheries Science 4:327-360.
Braaten, R. O. and M. Flaherty. 2001. Salt balances of inland shrimp ponds in Thailand: implications for land and water salinization. Environmental Conservation 28:357-367.
Briggs, M. and S. Funge-Smith. 1995. A nutrient budget of some intensive marine shrimp ponds in Thailand. Aquaculture and Fishery Management 25:790-811.
Briggs, M., S. Funge-Smith, R. Subasinghe, and M. Phillips. 2005. Introductions and movement of two penaeid shrimp species in Asia and the Pacific. FAO Fisheries Technical Paper 476. Food and Agriculture Organization of the United Nations, Rome.
Burford, M. A., S. D. Costanzo, W. C. Dennison, C. J. Jackson, A. B. Jones, A. D. McKinnon, N. P. Preston, and L. A. Trott. 2003. A synthesis of dominant ecological processes in intensive shrimp ponds and adjacent coastal environments in NE Australia. Marine Pollution Bulletin 46:1456-1469.
Casal, C. M. V. 2006. Global documentation of fish introductions: the growing crisis and recommendations for action. Biological Invasions 8:3-11.
Charuppat, T. and J. Charuppat. 1997. The use of Landsat-5 (TM) satelite images for tracing the changes of mangrove forest areas of Thailand. Royal Forestry Department, Bangkok (in Thai).

Farmed Imported Marine Shrimp: Thailand September 2010
64
Chase, F. A., Jr. and D. P. Abbott. 1980. Chapter 23--Caridea: The Shrimps.in R. H. Morris, D. P. Abbott, and E. C. Haderlie, editors. Intertidal Invertebrates of California. Stanford University Press, Stanford, California.
Clay, J. 2004. World agriculture and the environment: A commodity by commodity guide to impacts and practices. Island Press, Washington, D.C.
Dayton, P., S. Thrush, and F. Coleman. 2002. Ecological Effects of Fishing in Marine Ecosystems of the United States. Pew Oceans Commission, Arlington, VA.
Decamp, O., D. J. W. Moriarty, and P. Lavens. 2008. Probiotics for shrimp larviculture: review of field data from Asia and Latin America. Aquaculture Research 39:334-338.
Dey, M. M., M. A. Rab, K. M. Jahan, A. Nisapa, A. Kumar, and A. M. 2005. Food safety standards and regulatory measures: implications for selected fish exporting Asican countries. Aquaculture Economics & Management 9:217-236.
DMCR. 2005. Bangpakong estuary ecosystem. Department of Marine and Coastal Resources, Eastern Marine and Coastal Research Center, University Printing House, Bangkok: Chulalongkom.
DOF. 2003. GAP (Good Aquaculture Practices). Department of Fisheries, Thailand (in Thai). DOF. 2008. Thailand: Status of shrimp industries and strategies for supporting small-scale
farmer and their market access.in Annual Project Meeting for ACIAR 19-21 November 2008 NACA, editor., Bangkok, http://library.enaca.org/bmp/aciar2008/08_thailand_dof.pdf.
DOF. 2009. Code of Conduct guideline for marine shrimp hatchery and farm. Accessed in October 2009, available at http://www.thaiqualityshrimp.com/eng/standard/link1_detail.asp?nID=21. Department of Fisheries, Thailand
Dore, I. and C. Frimodt. 1987. An Illustrated Guide to Shrimp of the World. Huntington. Dulyapurk, V., W. Taparhudee, R. Yoonpundh, and S. Jumnongsong. 2007. Mangrove
ecosystems, communities and conflict: developing knowledge-based approaches to reconcile multiple demands. Final Report of Work Package 1: Multidisciplinary Situation Appraisal of Mangrove Ecosystems in Thailand. Contract Number FP6-003697. Kasetsart University, Bangkok, Thailand.
FAO. 2003. Health management and biosecurity maintenance in white shrimp (Penaeus vannamei) hatcheries in Latin America. Fisheries Technical Paper No 450. Food and Agriculture Organization of the United Nations, Rome.
FAO. 2007. State of the World Fisheries and Aquaculture. Food and Agriculture Organization of the United Nations, Rome.
FAO. 2008. Fishery Information, Data and Statistics Unit (FIDI). Fishery Statistical Collections. FIGIS Data Collection. Food and Agriculture Organization of the United Nations, Rome.
FAO. 2009a. Fishery Statistical Collections.Fishery Information, Data and Statistics Unit (FIDI), FIGIS Data Collection. Food and Agriculture Organization of the United Nations, Rome. http://www.fao.org/fishery/statistics/global-aquaculture-production/en.
FAO. 2009b. State of the World Fisheries and Aquaculture 2008. Food and Agriculture Organization of the United Nations, Rome.
FAO. 2010. Fishery Statistical Collections.Fishery Information, Data and Statistics Unit (FIDI), FIGIS Data Collection. Food and Agriculture Organization of the United Nations, Rome. http://www.fao.org/fishery/statistics/global-aquaculture-production/en.

Farmed Imported Marine Shrimp: Thailand September 2010
65
FAO/NACA/UNEP/WB/WWF. 2006. International Principles for Responsible Shrimp Farming. Food and Agriculture Organization of the United Nations (FAO), the Network of Aquaculture Centres in Asia-Pacific (NACA), United Nations Environment Programme (UNEP), the World Bank Group (WB), and the World Wildlife Fund (WWF), Bangkok, Thailand.
Farfante, P. I. and B. Kensley. 1997. Penaeoid and Sergestoid Shrimps and Prawns of the World. Keys and Diagnoses for the Families and Genera, Paris.
Flegal, T. W. 2009. Review of disease tranmission risks from prawn products exported for human consumption. Aquaculture 290:179-189.
Flegel, T. W. 2006a. Disease testing and treatment. Pages 98-103 in C. E. Boyd, D. Jory, and G. W. Chamberlain, editors. Operating Procedures for Shrimp Farming. Global Shrimp OP Survey Results and Recommendations. Global Aqaculture Assliance, St. Louis.
Flegel, T. W. 2006b. The special danger of viral pathogens in shrimp translocated for aquaculture. Science Asia:215-221.
Fuller, P. 2009. Penaeus monodon. USGS Nonindigenous Aquatic Species Database, Gainesville, FL.
Funge-Smith, S. and M. Briggs. 2003. The introduction of Penaeus vannamei and P. stylirostris into the Asia-Pacific Region. Pages 26-29 International Mechanisms for the Control and Responsible Use of Alien Species in Aquatic Ecosystems, Jinghong, Xishuangbanna, People’s Republic of China.
Funge-Smith, S. J. and M. R. P. Briggs. 1998. Nutrient budgets in intensive shrimp ponds: implications for sustainability. Aquaculture 164:117-133.
Giesen, W., S. Wulffraat, M. Zieren, and L. Scholten. 2006. Mangrove Guidebook for Southeast Asia. FAO and Wetlands International.
Giesen, W., S. Wulffraat, M. Zieren, and L. Scholten. 2007. Mangrove Guidebook for Southeast Asia. FAO, RAP Publication 2006/07, Food and Agriculture Organization of the United Nations, Rome.
Glenn, E. P., P. L. Nagler, R. C. Brusca, and O. Hinojosa-Huerta. 2006. Coastal wetlands of the northern Gulf of California: inventory and conservation status. Aquatic Conservation 16:5-28.
Gräslund, S., K. Holmström, and A. Wahlström. 2003. A field survey of chemicals and biological products used in shrimp farming. Marine Pollution Bulletin 46:81-90.
Hardy, R. W. and A. Tacon. 2002. Fish meal: historical uses, production trends and future outlook for supplies. Pages 311-325 in R. Stickney and J. McVey, editors. Responsible Marine Aquaculture. CABI Publishing, New York.
Holthuis, L. B. 1980. FAO Fisheries Synopsis No. 125 Vol. 1: Shrimps and prawns of the world. An annotated catalogue of species of interest to fisheries. Food and Agriculture Organization of the United Nations, Rome.
Huitric, M., C. Folke, and N. Kautsky. 2002. Development and government policies of the shrimp farming industry in Thailand in relation to mangrove ecosystems. Ecological Economics 40:441-455.
Huntington, T., C. , C. Frid, R. Banks, C. Scott, and O. Paramor. 2004. Assessment of the Sustainability of Industrial Fisheries Producing Fish Meal and Fish Oil
Idoine, J. 2001. Northern Shrimp.in S. H. Clask, editor. Status of fishery resources off the northeastern United States. NOAA.

Farmed Imported Marine Shrimp: Thailand September 2010
66
Jory, D., T. Cabrera, D. Dugger, D. Fegan, C. Berger, J. Orrantia, A. Wainberg, H. Perez, J. Castaoeda, R. McIntosh, M. Moya, C. Jackson, W. Vargas, and E. L. 2001. A global review of shrimp feed management: Status and perspectives. . Aquaculture:318.
Kenneth, M. Y. and D. Dudgeon. 2008. Ecological risk assessment and management of exotic organisms associated with aquaculture activities. Pages 67-100 in M. G. Bondad-Reantaso, J. R. Arthur, and R. P. Subasinghe, editors. Understanding an applying risk analysis in aquaculture. FAO Fisheries and Aquaculture Technical paper 519. Food and Agriculture Organization of the United Nations, Rome.
Kiatpathomchai, W., W. Jaroenram, N. Arunrut, W. Gangnonnigiw, V. Boonyawiwat, and P. Sithigorngul. 2008. Experimental infections reveal that common Thai crustaceans are potential carriers for spread of exotic Taura syndrome virus. Diseases of Aquatic Organisms 79:183-190.
Koesling, J. 2009. Sustainable Aquaculture/Innovations for sustainability of seafood supply: Thailand's lead. Page 29 AQUA Culture AsiaPacific.
Kongsanchai, J. 1994. Conservation of mangroves into other uses in Thailand. Pages 30-38 in Proceedings of the workshop on International Tropical Timber Organization project, Yokohama, Japan.
Lafferty, K. D. and L. R. Gerber. 2002. Good medicine for conservation biology: the intersection of epidemiology and conservation theory. Conservation Biology 16:593-604.
Lafferty, K. D., J. W. Porter, and S. E. Ford. 2004. Are diseases increasing in the ocean? Annual Review of Ecology and Evolutionary Systems 35:31-54.
LDWF. 2000. Early Life Cycle of the White Shrimp: A Review of the Literature. Louisiana Department of Wildlife and Fisheries, Baton Rouge, LA.
Leepaisomboon, T., N. Chuchird, C. Limsuwan, E. R. Steenbruggen, and R. Mungkung. 2009. GLOBALGAP Standard in Thai Shrimp Farms: Mission (Im)possible? Aquaculture Asia Magazine.
Leung, K. M. Y. and D. Dudgeon. 2008. Ecological risk assessment and management of exotic organisms associated with aquaculture activities. Pages 67-100 in M. G. Bondad-Reantaso, J. R. Arthur, and R. P. Subasinghe, editors. Understanding and applying risk analysis in aquaculture. FAO Fisheries and Aquaculture Technical Paper. No. 519. FAO, Rome.
Lewis III, R. R. 2005. Ecological engineering for successful management and restoration of mangrove forests. Ecological Engineering 24:403–418.
Lewis, R. R. 2005. Ecological engineering for successful management and restoration of mangrove forests. Ecological Engineering 24:403–418.
Lightner, D. V. 2003. The penaeid shrimp viral pandemics due to IHHNV, WSSV, TSV and YHV: history in the Americas and current status. Pages 1-20 Aquaculture and Pathobiology of Crustacean and Other Species: Proceedings of the 32nd U.S.-Japan Cooperative Program in Natural Resources, Aquaculture Panel Symposium, Davis and Santa Barabara, CA.
Long, N. T. and V. T. Toan. 2008. Study on the accumulation of nitrogen and phosphorus in intensive shrimp (Penaeus monodon) ponds (full paper in Vietnamese). Scientific Journal of Can Tho University Specific Issue on Aquaculture and Fisheries 2008 (1):44-52.
Lotz, L. M. 1997. Disease control and pathogen status assurance in an SPF-based shrimp aquaculture industry, with particular reference to the United States.in T. W. Flegel and I.

Farmed Imported Marine Shrimp: Thailand September 2010
67
H. MacRae, editors. Diseases in Asian Aquaculture III. Fish Health Section. Asian Fisheries Society, Manila.
Mang, J. S., S. L. Dong, X. L. Tian, Y. W. Dong, X. Y. Liu, and D. C. Yan. 2007. Virus-phytoplankton adhesion: a new WSSV transmission route to zooplankton. Acta Oceanologica Sinica 26:109-115.
MATF. 2007. Sustainable Marine Aquaculture: Fulfilling the Promise; Managing the Risks. Marine Aquaculture Task Force, Takoma Park, MD.
McIntosh, R. 2008a. Advancing shrimp farm technologies support greater efficiencies, sustainability. Pages 88-90 Global Aquaculture Advocate.
McIntosh, R. 2008b. Selective Breeding, High-Efficiency Seedstock Production Boost Integrated Shrimp Farm Performance. Pages 73-74 Global Aquaculture Advocate.
NACA and FAO. 2008a. Quarterly Aquatic Animal Disease Report (Asia-Pacific Region) 2008/3: July-September 2008. Network of Aquaculture Centers in Asia-Pacific, Food and Agriculture Organization of the United Nations, Bangkok, Rome.
NACA and FAO. 2008b. Quarterly Aquatic Animal Disease Report (Asia-Pacific Region) 2008/4: October-December 2008. Network of Aquaculture Centers in Asia-Pacific, Food and Agriculture Organization of the United Nations, Bangkok, Rome.
NACA and FAO. 2009a. Quarterly Aquatic Animal Disease Report (Asia-Pacific Region) 2009/1: January-March 2009. Network of Aquaculture Centers in Asia-Pacific, Food and Agriculture Organization of the United Nations, Bangkok, Rome.
NACA and FAO. 2009b. Quarterly Aquatic Animal Disease Report (Asia-Pacific Region) 2009/2: April-June2009. Network of Aquaculture Centers in Asia-Pacific, Food and Agriculture Organization of the United Nations, Bangkok, Rome.
Naylor, R. L., R. J. Goldburg, H. Primavera, N. Kautsky, M. C. M. Beveridge, J. Clay, C. Folke, J. Lubchenco, H. A. Mooney, and M. Troell. 2000. Effect of aquaculture on world fish supplies. Nature 406:981-1082.
Naylor, R. L., R. W. Hardy, D. P. Bureau, A. Chiu, M. Elliott, A. P. Farrell, I. Forster, D. M. Gatlin, R. J. Goldburg, K. Hua, and P. D. Nichols. 2009. Feeding aquaculture in an era of finite resources. Proceedings of the National Academy of Sciences of the United States of America 106:15103–15110.
NCMC. 2008. Conservation News: Gulf of California Sardine Fishery Considered for Sustainability Label. National Coalition for Marine Conservation. Accessed September 2008, http://www.savethefish.org/conservation_news_Pacific_forage.htm.
Nielsen, L., W. Sang-oum, S. Cheevadhanarak, and T. W. Flegel. 2005. Taura syndrome virus (TSV) in Thailand and its relationship tp TSV in China and the Americas. Diseases of Aquatic Organisms 63:101-106.
NMFS. 2009. Fisheries Statistics Division. National Marine Fisheries Service. http://www.st.nmfs.gov/st1/.
NMFS. 2010. Fisheries Statistics Division, Foreign Trade Information. National Marine Fisheries Service. http://www.st.nmfs.gov/st1/.
NOAA. 2001. Gulf of Mexico Shrimp Statistics. National Marine Fisheries Service. O'Sullivan, D. 2008. CPF integration provides model for Aussi prawn industry. Page 30.
Austasia Aquaculture. Panutrakul, S., W. Senanan, S. Chavanich, N. Tangkrock-Olan, and V. Viyakarn. 2010. Ability
of Litopenaeus vannamei to survive and compete with local marine shrimp species in the Bangpakong River, Thailand in C. T. Hoanh, B. W. Szuster, K. Suan-Pheng, A. M.

Farmed Imported Marine Shrimp: Thailand September 2010
68
Ismail, and A. D. Noble, editors. Tropical deltas and coastal zones: food production, communities and environment at the land-water interface. COBI, Oxfordshire, UK.
Perry, H. 2009. Litopenaeus vannamei. USGS Nonindigenous Aquatic Species Database. United States Geological Survey, Gainsville, Florida.
Ponce-Palafox, J., C. A. Martinez-Palacios, and L. G. Ross. 1997. The effects of salinity and temperature on the growth and survival rates of juvenile white shrimp, Penaeus vannamei, Boone, 1931. Aquaculture 157:107-115.
Pongthanapanich, T. and E. Roth. 2006. Voluntary management in Thai shrimp farming. Aquaculture Economics & Management 10:265-287.
Prabnoarong, P. and S. Thongkao. 2006. Land use changes in Pak Panang Bay. Walailak Journal of Science and Technology 3:93-104.
Rajendran, N. and K. Kathiresan. 2008. Effect of effluent from a shrimp pond on shoot biomass of mangrove seedlings. Aquaculture Research 27:745-747.
Ramsar Convention Secretariat. 2006. The Ramsar Convention Manual: a guide to the Convention on Wetlands (Ramsar, Iran, 1971), 4th ed., Gland, Switzerland.
Rockström, J., W. Steffen, K. Noone, Å. Persson, S. Chapin, E. F. Lambin, T. M. Lenton, M. Scheffer, C. Folke, H. J. Schellnhuber, B. Nykvist, C. A. de Wit, T. Hughes, S. van der Leeuw, H. Rodhe, S. Sörlin, P. K. Snyder, R. Costanza, U. Svedin, M. Falkenmark, L. Karlberg, R. W. Corell, V. J. Fabry, J. Hansen, B. Walker, D. Liverman, K. Richardson, P. Crutzen, and J. A. Foley. 2009. A safe operating space for humanity. Nature 461:472-475.
Sala, O. E., F. S. Chapin, III, J. J. Armesto, E. Berlow, J. Bloomfield, R. Dirzo, E. Huber-Sanwald, L. F. Huenneke, R. B. Jackson, A. Kinzig, R. Leemans, D. M. Lodge, H. A. Mooney, M. Oesterheld, iacute, N. L. Poff, M. T. Sykes, B. H. Walker, M. Walker, and D. H. Wall. 2000. Global Biodiversity Scenarios for the Year 2100. Science 287:1770-1774.
Sanit, A., T. Ruangrai, S. Wattan, and S. Suthawan. 2004. The importance of mangroves: ecological perspectives and socio-economic values. Pages 27-51 in E. B. Barbier and S. Sathirathai, editors. Shrimp Farming and Mangrove Loss in Thailand. Edward Elgar Publisheer, Cheltenham, UK.
Schipp, G. 2008. Is the Use of Fishmeal and Fish Oil in Aquaculture Diets Sustainable? Technote No: 124. Northern Territory Government of Australia, Department of Primary Industry, Fisheries and Mines, Darwin.
Schlining, K. 1999. The Spot Prawn Resource in Carmel Submarine Canyon, California: Aspects of Fisheries and Habitat Associations. University of California Stanislaus, Moss Landing, CA.
Seafood Handbook. 1999. Shellfish Species section; Shrimp Product Forms section. Seafood Business, Inc.
Senanan, W., S. Panutrakul, P. Barnette, and V. Manthachitra. 2010. Ecological risk assessment of an alien aquatic species: a case study of Litopenaeus vannamei (Pacific whiteleg shrimp) aquaculture in the Bangpakong River, Thailand in C. T. Hoanh, B. W. Szuster, K. Suan-Pheng, A. M. Ismail, and A. D. Noble, editors. Tropical deltas and coastal zones: food production, communities and environment at the land-water interface. COBI, Oxfordshire, UK.
Senanan, W., N. Tangkrock-Olan, S. Panutrakul, P. Barnette, C. Wongwiwatanawute, N. Niphonkit, and D. J. Anderson. 2007. The presence of the Pacific whiteleg shrimp

Farmed Imported Marine Shrimp: Thailand September 2010
69
(Litopenaeus vannamei, Boone, 1931) in the wild in Thailand. Journal of Shellfish Research 26:1187-1192.
Simachaya, W. 2003. A Decade of Water Quality Monitoring Thailand’s four Major Rivers: The results and the Implication for management. Paper for the 6th International Conference on the Environmental Management of Enclosed Coastal Seas. November 2003, Bangkok.
Sonnenholzer, S. 2008. Effluent impact assessment: water quality monitoring vs nutrient budget. WWF Shrimp Aquaculture Dialogue, Guayaquil, Ecuador.
Szuster, B. W. 2001. Cumulative environmental effects of low salninity shrimp farming in Thailand. Ph.D. Dissertation. University of Victoria, Victoria, Canada.
Szuster, B. W. 2006. A review of shrimp farming in central Thailand and its environmental implications in P. Leung and C. Engle, editors. Shrimp culture: economics, market, and trade. Blackwell Publishing, Ames, Iowa, USA.
Szuster, B. W. and M. Flaherty. 2002. A regional approach to assessing organic waste production by low salinity shrimp farms. Aquaculture Asia 7:48-52.
Tacon, A. 2005. State of information on salmon aquaculture feed and the environment. Report to the WWF Salmon Aquaculture Dialogue. www.worldwildlife.org/cci/dialogues/salmon.cfm.
Tacon, A. and M. Metian. 2008. Global overview on the use of fish meal and fish oil in industrially compounded aquafeeds: trends and future prospects. Aquaculture 285:146–158.
Tacon, A. G. J. and R. J. McNeil. 2004. Dietary feeding strategies for marine shrimp: a review in L. E. Cruz Suárez, D. Ricque Marie, M. G. Nieto López, D. Villarreal, U. Scholz, and M. González, editors. Avances en Nutrición Acuícola VII. Memorias del VII Simposium Internacional de Nutrición Acuícola. 16-10 Noviembre, 2004, Hermosillo, Sonora, Mexico.
Tangkrock-Olan, N., W. Senanan, S. Panutrakul, and P. Barnette. 2007. Species and distribution of Penaeoid shrimps in Thailand. Journal of Shellfish Research 26:1239-1246.
Tanticharoen, M., T. W. Flegel, W. Meerod, and U. Grudloyma. 2008. Aquacultural biotechnology in Thailand: the case of the shrimp industry. International Journal of Biotechnology 10:588-603.
Teichert-Coddington, D. R., D. B. Rouse, A. Potts, and C. E. Boyd. 1999. Treatment of harvest discharge from intensive shrimp ponds by settling. Aquacultural Engineering 19:147-161.
Towatana, P., C. Voradaj, and N. Panapitukkul. 2002. Changes in soil properties of abandoned shrimp ponds in southern Thailand. Environmental Monitoring and Assessment 74:45-65.
Trott, L. A., A. D. McKinnon, D. M. Alongi, A. Davidson, and M. A. Burford. 2004. Carbon and nitrogen processes in a mangrove creek receiving shrimp farm effluent. Estuarine, Coastal and Shelf Science 59:197-207.
Tyedmers, P. H. 2000. Salmon and Sustainability: The biophysical cost of producing salmon through the commercial salmon fishery and the intensive salmon culture industry. Ph.D. Dissertation. The University of Britsh Columbia, Vancouver.
United Nations. 2009. Thailand. Accessed September 2009, http://www.un.or.th/thailand/geography.html.
Uphoff, J. H., Jr. 2003. Predator-prey analysis of striped bass and Atlantic menhaden in Upper Chesapeake Bay. Fisheries Management and Ecology 10:313-322.

Farmed Imported Marine Shrimp: Thailand September 2010
70
Vaiphasa, C., W. F. de Boer, A. K. Skidmore, S. Panitchart, T. Vaiphasa, N. Bamrongrugs, and P. Santitamnont. 2007. Impact of solid shrimp pond waste materials on mangrove growth and mortality: a case study from Pak Phanang, Thailand. Hydrobiologia 591:47-57.
Valiela, I., J. L. Bowen, and J. K. York. 2001. Mangrove Forests: One of the World’s Threatened Major Tropical Environments. Bioscience 51:807-815.
Vandergeest, P. 2007. Certification and Communities: Alternatives for Regulating the Environmental and Social Impacts of Shrimp Farming. World Development 35:1152-1171.
Visuthismajarn, P., B. Vitayavirasuk, N. Leeraphante, and M. Kietpawpan. 2005. Ecological risk assessment of abandoned shrimp ponds in southern Thailand. Environmental Monitoring and Assessment 104:409-418.
Weber, M. L. 2003. What price farmed fish: a review of the environmental and social costs of farming carnivorous fish., SeaWeb Aquaculture Clearinghouse, Providence R.I.
Weigle, S. M., L. D. Smith, J. T. Carlton, and J. Pederson. 2005. Assessing the risk of introducing exotic species via the live marine species trade. Conservation Biology 19:213-223.
Wilkie, M. L. and S. Fortuna. 2003. Status and trends in mangrove area worldwide. Food and Agriculture Organization of the United Nations, Rome.
World Bank. 2007. Thailand Environment Monitor 2006. Ministry of Natural Resources and Environment, Department of Marine and Coastal Resources, World Bank, Bangkok.
WWF. 2007. Benchmarking Study on International Aquaculture Certification Programmes. World Wildlife Fund, Switzerland, Norway.
Wyban, J. 2007. Thailand’s shrimp revolution Pages 16-18 AQUA Culture AsiaPacific Magazine.
Zhang, J. S., S. L. Dong, Y. W. Dong, X. L. Tian, and C. Q. Hou. 2008. Bioassay evidence for the transmission of WSSV by the harpacticoid copepod Nitocra sp. Journal of Invertebrate Pathology 97:33-39.

Farmed Imported Marine Shrimp: Thailand September 2010
71
ANNEX 1 – Seafood Watch Methodology Seafood Watch™ defines sustainable seafood as from sources, whether fished or farmed, that can maintain or increase production into the long-term without jeopardizing the structure or function of affected ecosystems. The following guiding principles illustrate the qualities that aquaculture operations must possess to be considered sustainable by the Seafood Watch program. Sustainable aquaculture:
• uses less wild caught fish (in the form of fish meal and fish oil) than it produces in the form of edible marine fish protein, and thus provides net protein gains for society;
• does not pose a substantial risk of deleterious effects on wild shrimp stocks through the escape of farmed shrimp2;
• does not pose a substantial risk of deleterious effects on wild shrimp stocks through the amplification, retransmission or introduction of disease or parasites;
• employs methods to treat and reduce the discharge of organic waste and other potential contaminants so that the resulting discharge does not adversely affect the surrounding ecosystem; and
• implements and enforces all local, national and international laws and customs and utilizes a precautionary approach (which favors conservation of the environment in the face of irreversible environmental risks) for daily operations and industry expansion.
Seafood Watch has developed a set of five sustainability criteria, corresponding to these guiding principles, to evaluate aquaculture operations for the purpose of developing a seafood recommendation for consumers and businesses. These criteria are:
1. Use of marine resources 2. Risk of escapes to wild stocks 3. Risk of disease and parasite transfer to wild stocks 4. Risk of pollution and habitat effects 5. Effectiveness of the management regime
Each criterion includes:
• Primary factors to evaluate and rank • Secondary factors to evaluate and rank • Evaluation guidelines3 to synthesize these factors • A resulting rank for that criterion
2 “Fish” is used throughout this document to refer to finfish, shellfish and other farmed invertebrates. 3 Evaluation Guidelines throughout this document reflect common combinations of primary and secondary factors that result in a given level of conservation concern. Not all possible combinations are shown – other combinations should be matched as closely as possible to the existing guidelines.
Aquaculture Evaluation
Species: Litopenaeus vannamei Region: THAILAND Analyst: Irene T Miranda Date: 16 Aug 2010

Farmed Imported Marine Shrimp: Thailand September 2010
72
Once a rank has been assigned to each criterion, an overall seafood recommendation for the type of aquaculture in question is developed based on additional evaluation guidelines. The ranks for each criterion, and the resulting overall seafood recommendation, are summarized in a table. Criteria ranks and the overall recommendation are color-coded to correspond to the categories on the Seafood Watch pocket guide: Best Choices/Green: Consumers are strongly encouraged to purchase seafood in this category. The aquaculture source is sustainable as defined by Seafood Watch. Good Alternatives/Yellow: Consumers are encouraged to purchase seafood in this category, as they are better choices than seafood from the Avoid category. However, there are some concerns with how this species is farmed and thus it does not demonstrate all of the qualities of sustainable aquaculture as defined by Seafood Watch. Avoid/Red: Consumers are encouraged to avoid seafood from this category, at least for now. Species in this category do not demonstrate enough qualities to be defined as sustainable by Seafood Watch.

Farmed Imported Marine Shrimp: Thailand September 2010
73
CRITERION 1: USE OF MARINE RESOURCES Guiding Principle: To conserve ocean resources and provide net protein gains for society, aquaculture operations should use less wild-caught fish (in the form of fish meal and fish oil) than they produce in the form of edible marine fish protein. Feed Use Components to Evaluate
A) Yield Rate: Amount of wild-caught fish (excluding fishery by-products) used to create fish meal and
fish oil (ton/ton):
Wild Fish: Fish Meal; Enter ratio = 4.5 [i.e. value = 4.5:1 from Tyedmers (2000)4]
Wild Fish: Fish Oil; Enter ratio: 8.3 [i.e. value = 8.3:1 from Tyedmers (2000)]
B) Inclusion rate of fish meal, fish oil, and other marine resources in feed (%):
Fish Meal; Enter % = mean 25% (Tacon & Metian 2008)
Fish Oil; Enter % = mean 2%
C) Efficiency of Feed Use: Known or estimated average economic Feed Conversion Ratio (FCR = dry
feed:wet shrimp) in grow-out operations:
Enter FCR here = mean 1.5 (Tacon & Metian 2008)
Wild Input:Farmed Output Ratio (WI:FO)
Calculate and enter the larger of two resultant values:
Meal: [Yield Rate]meal x [Inclusion rate]meal x [FCR] = 4.5 x .25 x 1.5= 1.7
Oil: [Yield Rate]oil x [Inclusion rate]oil x [FCR] = 8.3 x 0.2 x 1.5= 0.2
WI:FO = 1.7
Primary Factor (WI:FO)
Estimated wild fish used to produce farmed shrimp (ton/ton, from above):
Low Use of Marine Resources (WI:FO = 0 - 1.1) OR supplemental
feed not used
Moderate Use of Marine Resources (WI:FO = 1.1 - 2.0)
Extensive Use of Marine Resources (WI:FO > 2.0)
4 Tyedmers (2000): Salmon and sustainability: The biophysical cost of producing salmon through the commercial salmon fishery and the intensive salmon culture industry. PhD Thesis. The University of British Columbia. 272 pages.

Farmed Imported Marine Shrimp: Thailand September 2010
74
Secondary Factors Stock status of the reduction fishery used for feed for the farmed species:
At or above BMSY (> 100%)
Moderately below BMSY (50 - 100%) OR Unknown
Substantially below BMSY (e.g. < 50%) OR Overfished OR
Overfishing is occurring OR fishery is unregulated
Not applicable because supplemental feed not used
Source of stock for the farmed species:
Stock from closed life cycle hatchery OR wild caught and intensity of
collection clearly does not result in depletion of brood stock, wild
juveniles or associated non-target organisms
Wild caught and collection has the potential to impact brood stock, wild
juveniles or associated non-target organisms
Wild caught and intensity of collection clearly results in depletion of
brood stock, wild juveniles, or associated non-target organisms
Evaluation Guidelines Use of marine resources is “Low” when WI:FO is between 0.0 and 1.1.
Use of marine resources is “Moderate” when WI:FO is between 1.1 and 2.0. Use of marine resources is “Extensive” when:
1. WI:FO is greater than 2.0 2. Source of stock for the farmed species is ranked red 3. Stock status of the reduction fishery is ranked red
Use of marine resources is deemed to be a Critical Conservation Concern and a species is ranked Avoid, regardless of other criteria, if:
1. WI:FO is greater than 2.0 AND the source of seed stock is ranked red. 2. WI:FO is greater than 2.0 AND the stock status of the reduction fishery is ranked red
Conservation Concern: Use of Marine Resources Low (Low Use of Marine Resources)
Moderate (Moderate Use of Marine Resources)
High (Extensive Use of Marine Resources)
Critical Use of Marine Resources

Farmed Imported Marine Shrimp: Thailand September 2010
75
CRITERION 2: RISK OF ESCAPED SHRIMP TO WILD STOCKS Guiding Principle: Sustainable aquaculture operations pose no substantial risk of deleterious effects to wild shrimp stocks through the escape of farmed shrimp. Primary Factors to evaluate Evidence that farmed shrimp regularly escape to the surrounding environment
Rarely if system is open OR never because system is closed
Infrequently if system is open OR Unknown Infrequent Exchange Systems
Regularly and often in open systems Harvest Exchange Systems; Frequent Exchange Systems
Status of escaping farmed shrimp to the surrounding environment
Native and genetically and ecologically similar to wild stocks OR survival and/or reproductive
capability of escaping farmed species is known to be naturally
zero or is zero because of sterility, polyploidy or similar technologies
Non-native but historically widely established OR Unknown
Non-native (including genetically modified organisms) and not yet fully
established OR native and genetically or ecologically distinct from wild stocks
Secondary Factors to evaluate Where escaping shrimp is non-native – Evidence of the establishment of self-sustaining feral stocks
Studies show no evidence of establishment to date
Establishment is probable on theoretical grounds OR Unknown
Empirical evidence of establishment Preliminary evidence
Where escaping shrimp is native – Evidence of genetic introgression through successful crossbreeding
Studies show no evidence of introgression to date
Introgression is likely on theoretical grounds OR Unknown n/a
Empirical evidence of introgression
Evidence of spawning disruption of wild shrimp
Studies show no evidence of spawning disruption to date
Spawning disruption is likely on theoretical grounds OR Unknown

Farmed Imported Marine Shrimp: Thailand September 2010
76
Empirical evidence of spawning disruption
Evidence of competition with wild shrimp for limiting resources or habitats Studies show no evidence of competition to date
Competition is likely on theoretical grounds OR Unknown
Empirical evidence of competition
Stock status of affected wild shrimp
At or above (> 100%) BMSY OR no affected wild shrimp
Moderately below (50 – 100%) BMSY OR Unknown
Substantially below BMSY (< 50%) OR Overfished OR
“endangered”, “threatened” or “protected” under state, federal or
international law
Evaluation Guidelines
A “Minor Risk” occurs when a species: 1) Never escapes because system is closed 2) Rarely escapes AND is native and genetically/ecologically similar. 3) Infrequently escapes AND survival is known to be nil.
A “Moderate Risk” occurs when the species:
1) Infrequently escapes AND is non-native and not yet fully established AND there is no evidence to date of negative interactions.
2) Regularly escapes AND native and genetically and ecologically similar to wild stocks or survival is known to be nil.
3) Is non-native but historically widely established.
A “Severe Risk” occurs when: 1) The two primary factors rank red AND one or more additional factor ranks red.
Risk of escapes is deemed to be a Critical Conservation Concern and a species is ranked Avoid, regardless of other criteria, when:
1) Escapes rank a “severe risk” AND the status of the affected wild shrimp also ranks red. Conservation Concern: Risk of Escaped Shrimp to Wild Stocks
Low (Minor Risk)
Moderate (Moderate Risk) Infrequent Exchange Systems
High (Severe Risk) Harvest Exchange Systems; Frequent Exchange Systems
Critical Risk
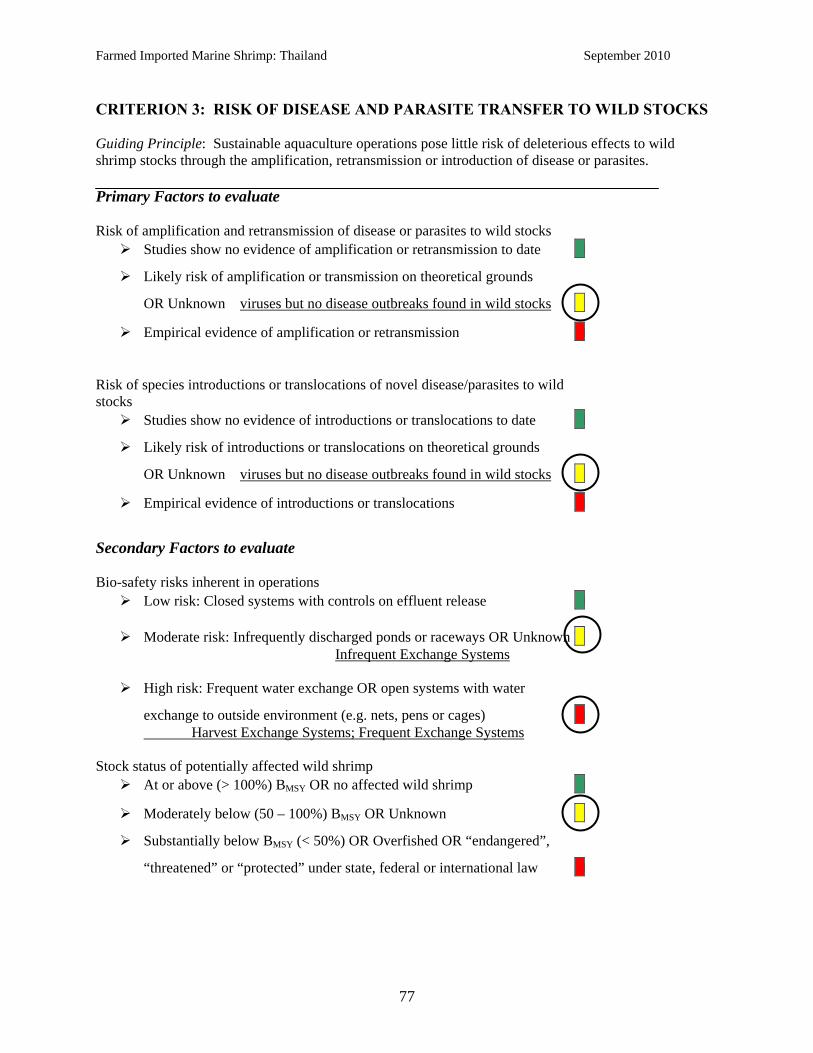
Farmed Imported Marine Shrimp: Thailand September 2010
77
CRITERION 3: RISK OF DISEASE AND PARASITE TRANSFER TO WILD STOCKS Guiding Principle: Sustainable aquaculture operations pose little risk of deleterious effects to wild shrimp stocks through the amplification, retransmission or introduction of disease or parasites. Primary Factors to evaluate Risk of amplification and retransmission of disease or parasites to wild stocks
Studies show no evidence of amplification or retransmission to date
Likely risk of amplification or transmission on theoretical grounds
OR Unknown viruses but no disease outbreaks found in wild stocks
Empirical evidence of amplification or retransmission
Risk of species introductions or translocations of novel disease/parasites to wild stocks
Studies show no evidence of introductions or translocations to date
Likely risk of introductions or translocations on theoretical grounds
OR Unknown viruses but no disease outbreaks found in wild stocks
Empirical evidence of introductions or translocations
Secondary Factors to evaluate Bio-safety risks inherent in operations
Low risk: Closed systems with controls on effluent release
Moderate risk: Infrequently discharged ponds or raceways OR Unknown Infrequent Exchange Systems
High risk: Frequent water exchange OR open systems with water
exchange to outside environment (e.g. nets, pens or cages) Harvest Exchange Systems; Frequent Exchange Systems
Stock status of potentially affected wild shrimp
At or above (> 100%) BMSY OR no affected wild shrimp
Moderately below (50 – 100%) BMSY OR Unknown
Substantially below BMSY (< 50%) OR Overfished OR “endangered”,
“threatened” or “protected” under state, federal or international law

Farmed Imported Marine Shrimp: Thailand September 2010
78
Evaluation Guidelines
Risk of disease transfer is deemed “Minor” if: 1) Neither primary factor ranks red AND both secondary factors rank green. 2) Both primary factors rank green AND neither secondary factor ranks red
Risk of disease transfer is deemed to be “Moderate” if the ranks of the primary and secondary factors “average” to yellow.
Risk of disease transfer is deemed to be “Severe” if:
1) Either primary factor ranks red AND bio-safety risks are low or moderate. 2) Both primary factors rank yellow AND bio-safety risks are high AND stock status of the wild
fish does not rank green.
Risk of disease transfer is deemed to be a Critical Conservation Concern and a species is ranked Avoid regardless of other criteria, if either primary factor ranks red AND stock status of the wild shrimp also ranks red.
Conservation Concern: Risk of Disease Transfer to Wild Stocks
Low (Minor Risk)
Moderate (Moderate Risk) Infrequent Exchange Systems High (Severe Risk) Harvest Exchange Systems; Frequent Exchange Systems
Critical Risk

Farmed Imported Marine Shrimp: Thailand September 2010
79
CRITERION 4: RISK OF POLLUTION AND HABITAT EFFECTS Guiding Principle: Sustainable aquaculture operations employ methods to treat and reduce the discharge of organic effluent and other potential contaminants so that the resulting discharge and other habitat impacts do not adversely affect the integrity and function of the surrounding ecosystem. Primary Factors to evaluate PART A: Effluent Effects Effluent water treatment
Effluent water substantially treated before discharge (e.g. recirculating system,
settling ponds, or reconstructed wetlands) OR polyculture and integrated
aquaculture used to recycle nutrients in open systems OR treatment not
necessary because supplemental feed is not used
Effluent water partially treated before discharge
(e.g. infrequently flushed ponds)
Effluent water not treated before discharge (e.g. open nets, pens or cages)
Evidence of substantial local (within 2 x the diameter of the site) effluent effects (including altered benthic communities, presence of signature species, modified redox potential, etc)
Studies show no evidence of negative effects to date
Likely risk of negative effects on theoretical grounds OR Unknown
Empirical evidence of local effluent effects
Evidence of regional effluent effects (including harmful algal blooms, altered nutrient budgets, etc)
Studies show no evidence of negative effects to date
Likely risk of negative effects on theoretical grounds OR Unknown
Empirical evidence of regional effluent effects
Extent of local or regional effluent effects
Effects are in compliance with set standards
Effects infrequently exceed set standards
Effects regularly exceed set standards

Farmed Imported Marine Shrimp: Thailand September 2010
80
Part B: Habitat Effects Potential to impact habitats: Location
Operations in areas of low ecological sensitivity (e.g. land that is less
susceptible to degradation, such as formerly used agriculture land or
land previously developed)
Operations in areas of moderate sensitivity (e.g. coastal and near-shore waters,
rocky intertidal or subtidal zones, river or stream shorelines, offshore waters)
Operations in areas of high ecological sensitivity (e.g. coastal wetlands,
mangroves)
Potential to impact habitats: Extent of Operations
Low density of shrimp/site or sites/area relative to flushing rate and
carrying capacity in open systems OR closed systems
Moderate densities of shrimp/site or sites/area relative to flushing rate and
carrying capacity for open systems
High density of shrimp/site or sites/area relative to flushing rate and
carrying capacity for open systems
Evaluation Guidelines
Risk of pollution/habitat effects is “Low” if three or more factors rank green and none of the other factors are red.
Risk of pollution/habitat effects is “Moderate” if factors “average” to yellow.
Risk of pollution/habitat effects is “High” if three or more factors rank red.
No combination of ranks can result in a Critical Conservation Concern for Pollution and Habitat Effects.
Conservation Concern: Risk of Pollution and Habitat Effects
Low (Low Risk)
Moderate (Moderate Risk)
High (High Risk)

Farmed Imported Marine Shrimp: Thailand September 2010
81
CRITERION 5: EFFECTIVENESS OF THE MANAGEMENT REGIME Guiding Principle: The management regime of sustainable aquaculture operations respects all local, national and international laws and utilizes a precautionary approach, which favors the conservation of the environment, for daily operations and industry expansion. Primary Factors to evaluate Demonstrated application of existing federal, state and local laws to current aquaculture operations
Yes, federal, state and local laws are applied
Yes but concerns exist about effectiveness of laws or their application
Laws not applied OR laws applied but clearly not effective
Use of licensing to control the location (siting), number, size and stocking density of farms
Yes and deemed effective
Yes but concerns exist about effectiveness
No licensing OR licensing used but clearly not effective
Existence and effectiveness of “better management practices” for aquaculture operations, especially to reduce escaped shrimp
Exist and deemed effective
Exist but effectiveness is under debate OR Unknown
Do not exist OR exist but clearly not effective
Existence and effectiveness of measures to prevent disease and to treat those outbreaks that do occur (e.g. vaccine program, pest management practices, fallowing of pens, retaining diseased water, etc.)
Exist and deemed effective
Exist but effectiveness is under debate OR Unknown
Do not exist OR exist but clearly not effective
Existence of regulations for therapeutants, including their release into the environment, such as antibiotics, biocides, and herbicides
Exist and deemed effective OR no therapeutants used
Exist but effectiveness is under debate, or unknown
Not regulated OR poorly regulated and/or enforced

Farmed Imported Marine Shrimp: Thailand September 2010
82
Use and effect of predator controls (e.g. for birds and marine mammals) in farming operations
Predator controls are not used OR predator deterrents are used but are
benign
Predator controls used with limited mortality or displacement effects Unknown
Predator controls used with high mortality or displacement effects Existence and effectiveness of policies and incentives, utilizing a precautionary approach (including ecosystem studies of potential cumulative impacts) against irreversible risks, to guide expansion of the aquaculture industry
Exist and are deemed effective
Exist but effectiveness is under debate
Do not exist OR exist but are clearly ineffective
Evaluation Guidelines
Management is “Highly Effective” if four or more factors rank green and none of the other factors rank red.
Management is “Moderately Effective” if the factors “average” to yellow.
Management is deemed to be “Ineffective” if three or more factors rank red.
No combination of factors can result in a Critical Conservation Concern for Effectiveness of Management.
Conservation Concern: Effectiveness of the Management Regime Low (Highly Effective)
Moderate (Moderately Effective)
High (Ineffective)

Farmed Imported Marine Shrimp: Thailand September 2010
83
Overall Seafood Recommendation
Overall Guiding Principle: Sustainable farm-raised seafood is grown and harvested in ways can maintain or increase production in the long-term without jeopardizing the structure or function of affected ecosystems. Evaluation Guidelines
A species receives a recommendation of “Best Choice” if:
1) It has three or more green criteria and the remaining criteria are not red. A species receives a recommendation of “Good Alternative” if:
1) Criteria “average” to yellow 2) There are four green criteria and one red criteria
A species receives a recommendation of “Avoid” if:
1) It has a total of two or more red criteria 2) It has one or more Critical Conservation Concerns.
Summary of Criteria Ranks
Infrequent Exchange Systems
(systems that do not discharge water to the environment even at harvest over multiple [more than one] cycles)
Sustainability Criteria Low Moderate High Critical
Use of Marine Resources Risk of Escapes to Wild Stocks Risk of Disease/Parasite Transfer to Wild Stocks Risk of Pollution and Habitat Effects Effectiveness of Management
Harvest Exchange Systems
(systems that discharge water to the environment only twice a year during harvest)
Sustainability Criteria Low Moderate High Critical
Use of Marine Resources Risk of Escapes to Wild Stocks

Farmed Imported Marine Shrimp: Thailand September 2010
84
Risk of Disease/Parasite Transfer to Wild Stocks Risk of Pollution and Habitat Effects Effectiveness of Management
Frequent Exchange Systems (systems that discharge water to the environment during the production cycle and during harvest)
Conservation Concern
Sustainability Criteria Low Moderate High Critical
Use of Marine Resources Risk of Escapes to Wild Stocks Risk of Disease/Parasite Transfer to Wild Stocks Risk of Pollution and Habitat Effects Effectiveness of Management
Overall Seafood Recommendation Best Choice Good Alternative Infrequent Exchange Systems Avoid Harvest Exchange Systems; Frequent Exchange Systems
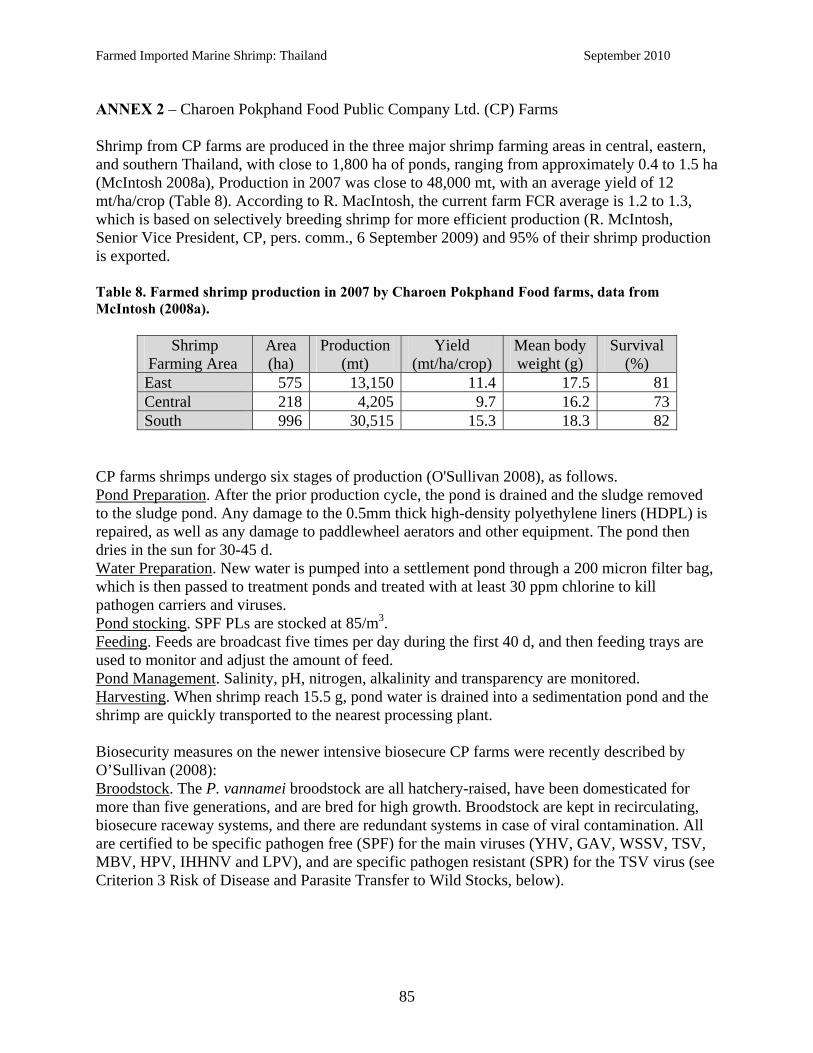
Farmed Imported Marine Shrimp: Thailand September 2010
85
ANNEX 2 – Charoen Pokphand Food Public Company Ltd. (CP) Farms Shrimp from CP farms are produced in the three major shrimp farming areas in central, eastern, and southern Thailand, with close to 1,800 ha of ponds, ranging from approximately 0.4 to 1.5 ha (McIntosh 2008a), Production in 2007 was close to 48,000 mt, with an average yield of 12 mt/ha/crop (Table 8). According to R. MacIntosh, the current farm FCR average is 1.2 to 1.3, which is based on selectively breeding shrimp for more efficient production (R. McIntosh, Senior Vice President, CP, pers. comm., 6 September 2009) and 95% of their shrimp production is exported. Table 8. Farmed shrimp production in 2007 by Charoen Pokphand Food farms, data from McIntosh (2008a).
Shrimp Farming Area
Area (ha)
Production (mt)
Yield (mt/ha/crop)
Mean body weight (g)
Survival (%)
East 575 13,150 11.4 17.5 81Central 218 4,205 9.7 16.2 73South 996 30,515 15.3 18.3 82
CP farms shrimps undergo six stages of production (O'Sullivan 2008), as follows. Pond Preparation. After the prior production cycle, the pond is drained and the sludge removed to the sludge pond. Any damage to the 0.5mm thick high-density polyethylene liners (HDPL) is repaired, as well as any damage to paddlewheel aerators and other equipment. The pond then dries in the sun for 30-45 d. Water Preparation. New water is pumped into a settlement pond through a 200 micron filter bag, which is then passed to treatment ponds and treated with at least 30 ppm chlorine to kill pathogen carriers and viruses. Pond stocking. SPF PLs are stocked at 85/m3. Feeding. Feeds are broadcast five times per day during the first 40 d, and then feeding trays are used to monitor and adjust the amount of feed. Pond Management. Salinity, pH, nitrogen, alkalinity and transparency are monitored. Harvesting. When shrimp reach 15.5 g, pond water is drained into a sedimentation pond and the shrimp are quickly transported to the nearest processing plant. Biosecurity measures on the newer intensive biosecure CP farms were recently described by O’Sullivan (2008): Broodstock. The P. vannamei broodstock are all hatchery-raised, have been domesticated for more than five generations, and are bred for high growth. Broodstock are kept in recirculating, biosecure raceway systems, and there are redundant systems in case of viral contamination. All are certified to be specific pathogen free (SPF) for the main viruses (YHV, GAV, WSSV, TSV, MBV, HPV, IHHNV and LPV), and are specific pathogen resistant (SPR) for the TSV virus (see Criterion 3 Risk of Disease and Parasite Transfer to Wild Stocks, below).

Farmed Imported Marine Shrimp: Thailand September 2010
86
Hatcheries. At a typical hatchery, water is pumped from the Gulf of Thailand, then filtered into a settling pond, then purified in a second reservoir, and then pumped into a final reservoir. Antibiotic use is not permitted. Postlarvae. Before postlarvae are shipped for stocking in grow out ponds, they undergo a stress test and are again checked for viruses and for Vibrio. According to McIntosh (2008b) in 2006 the average mortality from TSV in CP’s white shrimp was 7%, and TSV is now minor problem for most shrimp farmers in Thailand. CP also has other operations, such as feed mills and processing plants certified for HAACP, ISSO 14001. The shrimp in each package is traceable to rearing ponds, hatcheries, and broodstock based on radio frequency identification. Laboratories test for pesticides, microbial toxins, heavy metals and other contaminants in feeds, viruses and bacterial and fungal infections at hatcheries, and antibiotic residues and microbial contaminants in the processing plants. The CP indoor pilot farm (Roiphet Indoor Shrimp Project) is located east of Bangkok in Trat Province, 27 km from the coastline. Instead of ponds, the pilot farm uses completely closed recirculating concrete tanks. Farm effluent flows into a concrete-lined settling pond, then into earthen settlement ponds, and then it is released back into the river one km downstream from the intake. After harvest the pond is drained, sludge is removed from the bottom, and the pond is cleaned and dried out before restocking.

Farmed Imported Marine Shrimp: Thailand September 2010
87
ANNEX 3 – Thailand National Certifications from the Department of Fisheries Good Aquaculture Practices, from thaiqualityshrimp.com
GAP Guideline for shrimp hatchery and farm. 1. Farm location : the farm must be located close to non-polluted water sources, in area of parent soil and pH>5, always kept clean, and have no flooding records. 2. Buildings on the farm must be managed properly. Storage building and area must be clean, have good ventilation and be maintained properly. 3. Water for culture must come from water sources that are far away from pollution sources, be treated and conditioned before and after use. The water must be good quality and low. 4. Water supply must be sufficient and clean, Effluent discharge from household must be drained separately from the culture system so low disease, bacteria or fecal coliform contamination is possible. 5. Necessary hygiene : toilet must be located separately, kept clean, far away from culture ponds. Garbage collection and wastes disposal must be carried out properly to keep farm area clean and to prevent disease carriers from becoming established. 6. Farm equipment must be kept properly, maintained and cleaned regularly before and after use. 7. Farm management: farm must be kept clean and no use of any prohibited therapeutic agents for aquaculture. If therapeutic agent use is necessary, it must be used in accordance to DOF suggestion and recorded. No therapeutic agents are to be used at least 21days prior to harvest. Records of feeding and water quality must be maintained.

Farmed Imported Marine Shrimp: Thailand September 2010
88
Guidelines for Code of Conduct Responsible Shrimp Farming, from Thaiqualityshrimp.com
1. Site selection : - Farming area must meet the requirements of the laws. - Located outside mangrove areas. - Suit at far away from pollution sources. 2. General farm management : - Farmers have good farming practices for management. 3. Shrimp stock density : - The density, quality and age of shrimp fry released in ponds must be considered to achieve production capacity of each pond. 4. Feed : - Feed must be high quality. - Feed was newly produced. - Feed stored in a good hygienic condition and produced from appropriate natural ingredients. - Feeding must be efficiently managed. 5. Shrimp health management : - Shrimp health management must be carried out together with pond water quality determination. 6. Therapeutic agent & chemicals : - Application must follow the DOF guidelines and 16 prohibited therapeutic agents and chemicals must never be used. - Prepare culture management is required to prevent occurrence of disease. 7. Effluent and sediment : - Effluent must be treated properly without causing environmental deterioration. 8. Harvest and transportation : - Shrimp fry delivery, shrimp harvest and transportation must be planned and carried out quickly to keep the product fresh and ensure minimal residues. - Harvest and transportation verified through monitoring, prior to harvest. 9. Social responsibilities : - Economical use of local resources. - Mangrove reforestation should be carried out to create a good relationship with local communities. - Improve degraded mangrove and minimize further environmental impacts. 10. Farm grouping and training : - Develop support groups and provide training to improve the exchange of shrimp culture information. 11. Data collection : - Farm management records must be maintained and update.

Farmed Imported Marine Shrimp: Thailand September 2010
89

Farmed Imported Marine Shrimp: Thailand September 2010
90

Farmed Imported Marine Shrimp: Thailand September 2010
91

Farmed Imported Marine Shrimp: Thailand September 2010
92

Farmed Imported Marine Shrimp: Thailand September 2010
93

Farmed Imported Marine Shrimp: Thailand September 2010
94

Farmed Imported Marine Shrimp: Thailand September 2010
95

Farmed Imported Marine Shrimp: Thailand September 2010
96

Farmed Imported Marine Shrimp: Thailand September 2010
97

Farmed Imported Marine Shrimp: Thailand September 2010
98
ANNEX 4 – Historical Mangrove Forest Area and Land Use According to Charuppat and Charuppat (1997), most remaining mangrove forest in Thailand in 1996 was located in the South region, particularly the western (Gulf of Thailand) coast (Figure 19, Table 9). Forest cover in 1996 in the South region on the western peninsula (Andaman Sea) was estimated at 132,904 ha, which is eight times the area on the eastern peninsula (16,571 ha). In the western peninsula shrimp-pond conversion was responsible for approximately 8% of mangrove forest loss (5,153.8 ha), but in the eastern peninsula shrimp pond development accounted for 55% (21,919.6 ha).
Figure 19. Distribution of existing mangrove forests in Thailand in 1996. Map adapted from Aksornkoae and Tokrisna (2004), data from Charappat and Charappat (1997).
Mangrove Areas
Gulf of Thailand
Andaman Sea
N
CA
MB
OD
IA
MYANMAR (BURMA)
MALAYSIA
BANGKOK
Trat
Prachuab Kirikhan
Rayon
Chantha Buri
Chon Buri Samut Prakan Samut Sakhon
Phet Buri
Pattani
Chumphon
Ranong
Samut Songkhram
Surat Thani
Krabi
Phang-nga
Trang Pattalung
Saturi
Songkhla
Nakhon Sri Thammarat
Phuket

Farmed Imported Marine Shrimp: Thailand September 2010
99
Table 9. Extent of existing mangrove forests and other land uses within Regions of Thailand, 1961-1996, adapted from Aksornkoae and Tokrisna (2004), data from Charuppat and Charuppat (1997).
Total Area in 1996 (ha) Location
Total Original Mangroves
Pre-1961 (ha) Mangrove
Forest Shrimp Pond*
Resettle-ment Area
Other Uses
Eastern Area of South Region
54,845.0 12,658.0 24,295.3(58%)
3,957.1 (9%)
13,934.6 (33%)
Central Area (Bay of Bangkok) of South Region
66,981.8 5,449.0 15,629.2(25%)
3,099.9 (5%)
42,803.7 (70%)
Southern Area, Eastern Peninsula (Gulf of Thailand)
56,449.2 16,571.3 21,919.6(55%)
1,001.1 (3%)
16,957.0 (43%)
Southern Area, Western Peninsula (Andaman Sea)
194,172.0 132,904.0 5,153.8(33%)
742.3 (4%)
55,371.9 (63%)
Total 372,448.0 167,582.4 66,997.9 8,880.4 129.067.2
* Values in parentheses are percentages of the total converted area for the specific land use, e.g., shrimp ponds comprised 58% of the converted mangrove forests. In 1969 Southern Thailand contained 89% of the country’s mangrove forests, within 12 provinces (Table 10, Figure 20), and, 40% of the area converted from mangrove forest to shrimp ponds was in Southern Thailand (primarily the eastern peninsula).

Farmed Imported Marine Shrimp: Thailand September 2010
100
Table 10. Different land use patterns in mangrove areas of Southern Thailand in 1996. The sum of all uses in the “Total Eastern Peninsula” and “Total Western Peninsula” rows correspond to the “Total Original Mangroves Pre-1961” listed in Table 9 above. Accordingly, the “Mangrove Forest” column in this table indicates the area of forest still remaining in 1996.
Land Use in Mangrove Areas of Southern Thailand in 1996 (ha) Province Mangrove
Forest Shrimp Pond
Resettle-ment area
Other uses
Total Eastern Peninsula 16,571.3 21,919.6 1,001.1 16,957.0 Chumphon 3,151.8 3,121.1 128.0 4,231.1 Surat Thani 3,133.8 6,337.6 35.4 2,296.2 Nakhon Si Thammarat 8,416.2 10,476.7 71.2 2,652.9 Pattalung 141.0 388.0 15.0 1,996.0 Songkhla 623.4 1,264.8 587.4 3,603.3 Pattani 1,105.1 340.4 164 2,177.5 Total Western Peninsula 132,904.0 5,153.8 742.3 55,371.9 Ranong 19,236.6 334.2 512.4 6,950.8 Phang-nga 30,442.4 953.3 12.0 12,571.2 Phuket 1,511.7 211.5 11.3 1,035.5 Krabi 28,273.5 1,265.7 14.0 110,364.8 Trang 24,095.5 905.1 0 14,892.4 Satun 29,344.3 1,484.0 192.6 9,557.1 Total in Southern Thailand 149,475.2 27,073.4 1,743.4 72,328.9 Total in Thailand 167,582.4 66,997.9 8,800.4 129,067.3
Figure 20. Trends in conversion of mangrove forest to shrimp ponds for Thai provinces on the east coast of southern Thailand (left) and the west coast (right), data from Charappat and Charappat (1997), “NST” is Nakhon Si Thammarat province. The recent survey by Dulyapurk et al. (2007) details the remaining mangrove forest areas in Thailand in 2004 (Table 11).

Farmed Imported Marine Shrimp: Thailand September 2010
101
Table 11. Distribution of mangrove forest area in 2004, from (Dulyapurk et al. 2007), using DMCR 2005 unpublished data
According to the Ramsar Convention website (www.ramsar.org), Thailand became a signatory in 1998, and there are currently 10 sites designated as Wetlands of International Importance in Thailand with a combined surface area of 370,600 ha (Figure 21 and Table 12).

Farmed Imported Marine Shrimp: Thailand September 2010
102
Figure 21. Ramsar Convention sites in Thailand. Map from www.ramsar.org, 2009. Table 12. List of the ten designated Ramsar Convention sites in Thailand (www.ramsar.org). Ramsar Site Name and Date of Registry Province Area 1. Bung Khong Long Non-Hunting Area 05/07/01 Nong Khai Province 2,214 ha 2. Don Hoi Lot 05/07/01 Samut Songkhram Province 87,500 ha 3. Had Chao Mai Marine National Park – Ta Libong Island Non-Hunting Area – Trang River Estuaries 14/08/02 Trang Province 66,313 ha 4. Kaper Estuary – Laemson Marine National Park – Kraburi Estuary 14/08/02 Ranong Province 122,046 ha 5. Krabi Estuary 05/07/01 Krabi Province 21,299 ha 6. Kuan Ki Sian of the Thale Noi Non-Hunting Area 13/05/98 Songkhla Province 494 ha 7. Mu Koh Ang Thong Marine National Park 14/08/02 Surathani Province 10,200 ha 8. Nong Bong Kai Non-Hunting Area 05/07/01 Chiang Rai Province 434 ha 9. Pang Nga Bay Marine National Park 14/08/02 Pang Nga Province 40,000 ha 10. Princess Sirindhorn Wildlife Sanctuary (Pru To Daeng Wildlife Sanctuary) 05/07/01 Narathiwas Province 20,100 ha Total Area 370,600 ha
Thailand
Cambodia
Myanmar
Laos
Malaysia