tgs earnings release reports... · 2016 with good progress. these surveys are being acquired in...
TRANSCRIPT

TGS | EARNINGS RELEASE 2 FEBRUARY 2017
TGS EARNINGS RELEASE 4th QUARTER RESULTS
4th QUARTER AND FULL YEAR 2016 FINANCIAL HIGHLIGHTS
1) Includes USD 42 million and USD 51 million of investments related to risk sharing arrangements in Q4 2016 and YTD 2016, respectively 2) The 2016 amortization reflects the new amortization policy for seismic surveys effective from 1 January 2016 3) Trailing 12 months
• Strong late sales performance in Q4 2016 • Although some improvement seen over the past year, market conditions are expected to remain challenging in 2017 • Quarterly dividend maintained at USD 0.15 per share • 2017 Guidance:
o New multi-client investments* at approximately the same level as in 2016 o Pre-funding of new multi-client investments* expected to be approximately 40-45%
*New multi-client investments excluding investments related to surveys with risk sharing arrangements
(All amounts in USD 1,000s unless noted otherwise) Q4 2016 Q4 2015 YTD 2016 YTD 2015
Net operating revenues 164,687 131,735 455,991 612,347 - Net prefunding revenues 17,103 36,659 105,198 256,658 - Net late sales revenues 144,537 90,223 333,353 333,936 - Net proprietary revenues 3,045 4,853 17,437 21,752 EBIT 41,970 (139,858) 53,035 (21,230) - EBIT margin 25% -106% 12% -3%Pre-tax profit 38,650 (141,549) 52,675 (24,505) Net income 23,882 (121,547) 22,240 (28,347) EPS (fully diluted) 0.23 (1.19) 0.22 (0.28)
Operational investments in new projects (1) 88,307 87,964 271,181 501,653 - Pre-funding % on operational investments 37% 47% 48% 52% - Pre-funding % on operational investments incl. risk sharing arrangements 19% 42% 39% 51%Amortization (2) (92,230) (230,192) (297,693) (507,276) MC library ending net book value 812,399 838,916 812,399 838,916
Return on average capital employed (3) 5% -2% 5% -2%Equity ratio 79% 82% 79% 82%
Cash flow from operations 78,605 99,100 324,366 566,513 Free cash flow (after MC investments) 33,387 (19,842) 91,069 62,901 Cash balance 190,739 162,733 190,739 162,733

REVENUE BREAKDOWN
Net late sales for the quarter amounted to USD 144.5 million compared to USD 90.2 million in Q4 2015. Net pre-funding revenues in
the quarter totaled USD 17.1 million, a decrease of 53% from Q4 2015. The pre-funding revenues recognized in the fourth quarter
funded 37% of the operational investments of USD 46.0 million in the multi-client library (19% prefunding rate when investments
related to risk sharing arrangements of USD 42.3 million are included).
Proprietary contract revenues during the quarter totaled USD 3.0 million compared to USD 4.9 million in Q4 2015.
In Q4 2016, 13% of net multi-client seismic revenues came from fully amortized projects.
Revenue distribution
Source: TGS
OPERATIONAL COSTS
As from 1 January 2016, the amortization method for seismic multi-client libraries has changed. After a project is completed, TGS
applies a straight-line amortization over a remaining useful life. For most offshore projects, the useful life after completion is considered
to be four years, while a seven-year amortization period is applied for most onshore projects. The straight-line amortization is
distributed evenly through the financial year independently of sales during the quarter. During the work in progress phase, amortization
continues to be based on total estimated cost versus forecasted total revenues of the project.
The amortization of the multi-client library for Q4 2016 amounted to USD 92.2 million, which includes impairment of certain multi-
client projects totaling USD 9.2 million. Amortization of the multi-client library in Q4 2015 amounted to USD 230.2 million which
included impairments of USD 160.9 million.
Cost of goods sold (COGS) was USD 0.1 million for the quarter, down from USD 0.4 million in Q4 2015. Personnel costs in the quarter
were USD 15.9 million compared to USD 15.2 million in Q4 2015. The increase is due to higher costs related to employee incentive
schemes although the Q4 2015 comparison is influenced by restructuring costs booked one year ago due to the reductions of the global
workforce in 2015. Other operating expenses were USD 11.4 million in Q4 2016 compared to USD 22.4 million in Q4 2015. TGS has
recognized USD 3.8 million of non-recurring costs in Q4 2016, whereof USD 3.0 million are provisions related to bad debt. In Q4 2015,
other operating costs were highly impacted by the global cost reduction and efficiency plan implemented in November 2015.
Multi-client
Seismic91%
Propr.Seismic
2%GPS7%
NSA 108.0(66%)
Europe34.5
(21%)
AMEAP8.0
(5%)
Other 14.2(9%) 2D
(25%)
3D(68%)
GPS(7%)
EBITDA AND EBIT
Reported EBITDA (Earnings Before Interest, Tax, Depreciation and Amortization) for the quarter ended 31 December 2016 was USD
137.1 million, which corresponds to 83% of net revenues, up 47% from USD 93.5 million in Q4 2015. Operating profit (EBIT) for the
quarter amounted to USD 42.0 million, which is up from USD -139.9 million in Q4 2015.
FINANCIAL ITEMS
The Company recorded a net currency exchange loss of USD 0.7 million in Q4 2016. TGS holds NOK bank accounts primarily to pay
taxes and dividends in NOK.
TAX
TGS reports tax charges in accordance with the Accounting Standard IAS 12. Taxes are computed based on the USD value of the
appropriate tax provisions according to local tax regulations and currencies in each jurisdiction. The tax charges are influenced not
only from local profits, but also from fluctuations in exchange rates between the local currencies and USD. This method makes it
difficult to predict tax charges on a quarterly or annual basis. Currency effects within the current year are classified as tax expenses.
Management assesses that the normalized operating consolidated tax rate is approximately 28%. The tax rate reported for the quarter
is at 38% compared to 14% last year. The high tax rate is due to currency effects. The Norwegian taxes are settled in NOK on an
annual basis and the USD/NOK exchange variation will impact the quarterly calculations of taxes. Also, the exchange effects of
translating intercompany balances into NOK are taxable in Norway. Accordingly the tax expense is impacted by items which are not
recognized in the consolidated income statement.
NET INCOME AND EARNINGS PER SHARE (EPS)
Net income for Q4 2016 was USD 23.9 million (15% of net revenues), up from USD -121.5 million in Q4 2015. Quarterly earnings per
share (EPS) were USD 0.23 fully diluted (USD 0.24 undiluted), which is up from USD -1.19 fully diluted (USD -1.20 undiluted) in Q4
2015.
BALANCE SHEET AND CASH FLOW
The net book value of the multi-client library was USD 812.4 million at 31 December 2016 compared to USD 838.9 million at 31
December 2015. Operational multi-client investments amounted to USD 88.3 million in Q4 2016 (USD 88.0 million in Q4 2015), while
amortization was USD 92.2 million (USD 230.2 million) (see note 5 to the interim financial statements).
The net cash flow from operations for the quarter, after taxes and before investments, totaled USD 78.6 million compared to USD 99.1
million in Q4 2015. As of 31 December 2016, the Company’s total cash holdings amounted to USD 190.7 million compared to USD
162.7 million at 31 December 2015.
Total equity as of 31 December 2016 was USD 1,163.7 million, representing 79% of total assets. As of 31 December 2016, TGS held
533,500 treasury shares.

BACKLOG
TGS’ backlog amounted to USD 51.2 million at the end of Q4 2016, a decrease of 65% from Q4 2015 and 28% lower than last quarter.
The decrease is mainly due to high production on the Gigante projects in the offshore sector of Mexico.
On 19 January 2017 TGS announced the Atlantic Margin project in Norway. This will have a significant positive impact on the order
backlog in Q1 2017.
DIVIDEND
It is the ambition of TGS to pay a cash dividend that is in line with its long-term underlying cash flow. When deciding the dividend
amount, the TGS Board of Directors will consider expected cash flow, investment plans, financing requirements and a level of financial
flexibility that is appropriate for the TGS business model.
As from 2016, TGS started paying quarterly dividends in accordance with the resolution made by the Annual General Meeting. The aim
will be to keep a stable quarterly dividend in US dollars through the year, but the actual level paid will be subject to continuous
evaluation of the underlying development of the company and the market.
The Board of Directors has resolved to pay a dividend of USD 0.15 per share to be paid in Q1 2017. The dividend will be paid in the
form of NOK 1.23 per share on 23 February 2017. The share will trade ex-dividend on 9 February 2017.
OPERATIONAL HIGHLIGHTS
Vessels operating for TGS during all or parts of Q4 2016 included four 2D vessels, one multibeam vessel and two core sampling
vessels. In addition, TGS had one multi-vessel full-azimuth acquisition crew operating in Q4. Three of the 2D vessels and the full-
azimuth crew were operating under joint venture agreements.
Acquisition of the 7,150 km2 (306 OCS blocks) Revolution XII and XIII surveys in the U.S. Gulf of Mexico continued throughout Q4
2016 with good progress. These surveys are being acquired in partnership with Schlumberger using the WesternGeco Q-Marine*
point-receiver marine seismic system combined with the proprietary multivessel, Dual Coil Shooting* acquisition technique, which
will provide broadband, long-offset, full-azimuth data. Acquisition is on track to complete in Q1 2017 with final processed data
available in early 2018.
During Q4 2016 TGS completed acquisition of the 186,000 km Gigante 2D regional seismic survey covering the vast offshore sector
of Mexico. Fast track data was made available for the December 2016 licensing round and TGS will continue processing data
throughout 2017.
In conjunction with the Gigante 2D seismic survey, TGS completed acquisition of the 600,000 km² Gigante multibeam survey. The
multibeam bathymetry has been used to map the seafloor and identify targets for coring. Geochemical analysis of the acquired cores
will continue during 2017 with the resulting data and interpretations being integrated with the 2D seismic survey to enhance the
value proposition to clients.
* Mark of Schlumberger
In early November 2016 TGS completed its sixth consecutive season of data acquisition in Eastern Canada in collaboration with PGS.
The companies successfully acquired 41,800 km of 2D seismic and added 2,300 km2 of 3D data in Newfoundland and Labrador during
2016.
In late Q4 2016, TGS commenced acquisition of the North-West African Atlantic Margin (NWAAM 2017) 2D seismic survey, also in
collaboration with PGS. The partners plan to acquire more than 11,500 km of long offset, broadband 2D seismic data in the MSGBC
Basin. The survey has been designed to infill, extend and complement the NWAAM 2012 2D survey which helped with recent
commercial discoveries in the MSGBC basin. ** Mauritania-Senegal-Gambia-Bissau-Conakry
The Geologic Products and Services Division (GPS) continued to add to its inventory of multi-client products in the quarter. The well
data library grew with the addition of approximately 26,000 new digital well logs, 1,900 new enhanced digital well logs and 173,000
new Validated Well Headers. In the quarter the division commercialized its new R360 software platform and held successful
Geoforum events with clients in a number of cities. GPS also had ongoing multi-client interpretive projects geared towards
supplying customers with information on stratigraphy, structure and basin maturity in Norway, the UK, Mexico, Canada, and the US.
OTHER MATTERS
On 14 September 2016, TGS announced that it had, together with Petroleum Geo-Services ASA (PGS), reached agreement on principle
terms and conditions for jointly acquiring the majority of the multi-client library of Dolphin UK Ltd. The transaction was closed on 17
January 2017.
OUTLOOK
With oil companies’ E&P spending expected to remain around 2016 levels, 2017 is likely to be another challenging year for the
seismic industry, with low visibility and high volatility from quarter to quarter.
Meanwhile, the outlook for a recovery of exploration activity and seismic spending in the longer-term is gradually improving. As this
prolonged period of reduced exploration spend continues, it is expected that the situation with respect to shrinking reserve life will
become a critical issue for E&P companies. Simultaneously, both the E&P sector and the service industry are continuing to cut costs,
leading to substantial reduction of marginal costs of bringing new resources on stream.
With an efficient cost base, strong balance sheet and flexible business model, TGS is uniquely positioned to enhance its status as the
world’s leading multi-client geophysical company through the down cycle. The company has consistently demonstrated the capacity
to undertake selected counter-cyclical investments through the down turn. With the recent announcement of the large Atlantic
Margin 3D project in Norway a substantial part of the 2017 investment plans has already been committed.
With the expectation of further investments being committed during the year, TGS provides the following guidance for 2017:
• New multi-client investments*** at approximately the same level as in 2016
• Additional multi-client investments expected from sales of existing surveys with risk sharing arrangements
• Pre-funding of new multi-client investments* expected to be approximately 40-45%
***New multi-client investments excluding investments related to surveys with risk sharing arrangements
Asker, 1 February 2017
The Board of Directors of TGS-NOPEC Geophysical Company ASA

ABOUT TGS
TGS provides multi-client geoscience data to oil and gas Exploration and Production companies worldwide. In addition to extensive
global geophysical and geological data libraries that include multi-client seismic data, magnetic and gravity data, digital well logs,
production data and directional surveys, TGS also offers advanced processing and imaging services, interpretation products and data
integration solutions.
TGS-NOPEC Geophysical Company ASA is listed on the Oslo Stock Exchange (OSLO:TGS).
TGS sponsored American Depositary Shares trade on the U.S. over-the-counter market under the symbol "TGSGY”.
Website: www.tgs.com
CONTACT FOR ADDITIONAL INFORMATION
Sven Børre Larsen, CFO tel +47 90 94 36 73
Will Ashby, Vice President HR & Communication tel +1-713-860-2184 *************************************************************************************************************************
All statements in this earnings release other than statements of historical fact are forward-looking statements, which are subject to a number of risks,
uncertainties and assumptions that are difficult to predict, and are based upon assumptions as to future events that may not prove accurate. These factors
include TGS’ reliance on a cyclical industry and principal customers, TGS’ ability to continue to expand markets for licensing of data, and TGS’ ability to
acquire and process data products at costs commensurate with profitability. Actual results may differ materially from those expected or projected in the
forward-looking statements. TGS undertakes no responsibility or obligation to update or alter forward-looking statements.
*************************************************************************************************************************

TGS | EARNINGS RELEASE 2 FEBRUARY 2017
Interim Consolidated Statement of Comprehensive Income
Note 2016 2015 2016 2015
(All amounts in USD 1,000s unless noted otherwise) Q4 Q4 YTD YTD
Unaudited Unaudited Unaudited Audited
Net revenues 4 164,687 131,735 455,991 612,347
Operating expenses
Cost of goods sold - proprietary and other 88 387 5,759 1,012
Amortization and impairment of multi-client library 2,5 92,230 230,192 297,693 507,276
Personnel costs 15,932 15,166 51,670 63,246
Cost of stock options 134 244 751 1,782
Other operating expenses 11,424 22,425 35,039 47,421
Depreciation, amortization and impairment 2,909 3,178 12,046 12,840
Total operating expenses 122,717 271,593 402,956 633,577
Operating profit 4 41,970 -139,858 53,035 -21,230
Financial income and expenses
Financial income 105 564 3,053 6,265
Financial expenses -2,698 -93 -3,967 -516
Other financial items -727 -2,162 553 -9,024
Net financial items -3,319 -1,691 -360 -3,275
Profit before taxes 38,650 -141,549 52,675 -24,505
Taxes 14,768 -20,002 30,435 3,842
Net income 23,882 -121,547 22,240 -28,347
EPS USD 0.24 -1.20 0.22 -0.28
EPS USD, fully diluted 0.23 -1.19 0.22 -0.28
Other comprehensive income:
Exchange differences on translation of foreign operations -308 -51 114 -924
Other comprehensive income for the period, net of tax -308 -51 114 -924
Total comprehensive income for the period 23,574 -121,598 22,353 -29,272
October 29th, 2009February 11, 2010
TGS EARNINGS RELEASE7 February 2013

TGS | EARNINGS RELEASE 2 FEBRUARY 2017
Interim Consolidated Balance Sheet
Note 2016 2015
(All amounts in USD 1,000s) 31-Dec 31-Dec
Unaudited Audited
ASSETS
Non-current assets
Goodwill 67,925 67,647
Multi-client library 2,5 812,399 838,916
Other intangible non-current assets 9,009 9,260
Deferred tax asset 5,740 12,941
Buildings 6,759 8,427
Machinery and equipment 16,263 21,756
Other non-current assets 10,500 25,102
Total non-current assets 928,595 984,049
Current assets
Accounts receivable 201,231 135,384
Accrued revenues 119,112 142,263
Other receivables 33,073 30,818
Cash and cash equivalents 190,739 162,733
Total current assets 544,155 471,198
TOTAL ASSETS 1,472,750 1,455,247
EQUITY AND LIABILITIES
Equity
Share capital 3,638 3,632
Other equity 1,160,073 1,194,455
Total equity 3 1,163,711 1,198,088
Non-current liabilities
Other non-current liabilities 6,057 6,182
Deferred tax 40,872 32,797
Total non-current liabilities 46,929 38,979
Current liabilities
Accounts payable and debt to partners 116,534 97,798
Taxes payable, withheld payroll tax, social security 18,066 2,767
Other current liabilities 127,510 117,615
Total current liabilities 262,110 218,180
TOTAL EQUITY AND LIABILITIES 1,472,750 1,455,247
October 29th, 2009February 11, 2010
TGS EARNINGS RELEASE7 February 2013
TGS | EARNINGS RELEASE 2 FEBRUARY 2017
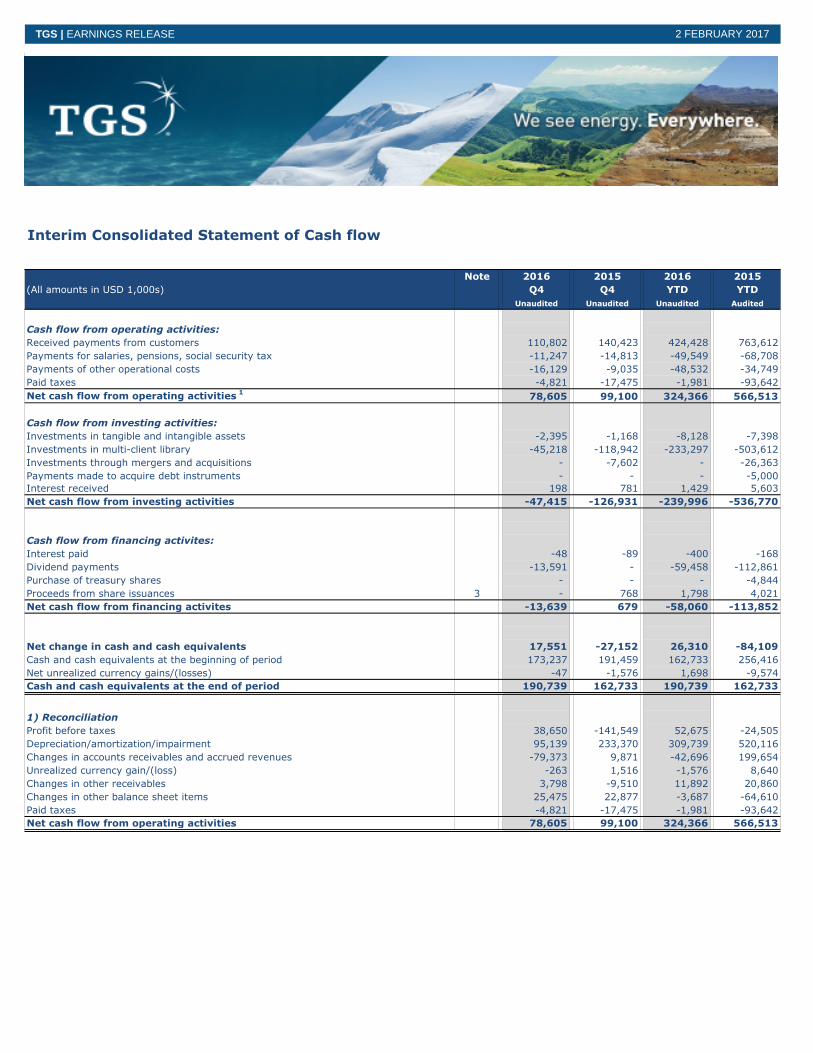
Interim Consolidated Statement of Cash flow
Note 2016 2015 2016 2015
(All amounts in USD 1,000s) Q4 Q4 YTD YTD
Unaudited Unaudited Unaudited Audited
Cash flow from operating activities:
Received payments from customers 110,802 140,423 424,428 763,612
Payments for salaries, pensions, social security tax -11,247 -14,813 -49,549 -68,708
Payments of other operational costs -16,129 -9,035 -48,532 -34,749
Paid taxes -4,821 -17,475 -1,981 -93,642
Net cash flow from operating activities1
78,605 99,100 324,366 566,513
Cash flow from investing activities:
Investments in tangible and intangible assets -2,395 -1,168 -8,128 -7,398
Investments in multi-client library -45,218 -118,942 -233,297 -503,612
Investments through mergers and acquisitions - -7,602 - -26,363
Payments made to acquire debt instruments - - - -5,000
Interest received 198 781 1,429 5,603
Net cash flow from investing activities -47,415 -126,931 -239,996 -536,770
Cash flow from financing activites:
Interest paid -48 -89 -400 -168
Dividend payments -13,591 - -59,458 -112,861
Purchase of treasury shares - - - -4,844
Proceeds from share issuances 3 - 768 1,798 4,021
Net cash flow from financing activites -13,639 679 -58,060 -113,852
Net change in cash and cash equivalents 17,551 -27,152 26,310 -84,109
Cash and cash equivalents at the beginning of period 173,237 191,459 162,733 256,416
Net unrealized currency gains/(losses) -47 -1,576 1,698 -9,574
Cash and cash equivalents at the end of period 190,739 162,733 190,739 162,733
1) Reconciliation
Profit before taxes 38,650 -141,549 52,675 -24,505
Depreciation/amortization/impairment 95,139 233,370 309,739 520,116
Changes in accounts receivables and accrued revenues -79,373 9,871 -42,696 199,654
Unrealized currency gain/(loss) -263 1,516 -1,576 8,640
Changes in other receivables 3,798 -9,510 11,892 20,860
Changes in other balance sheet items 25,475 22,877 -3,687 -64,610
Paid taxes -4,821 -17,475 -1,981 -93,642
Net cash flow from operating activities 78,605 99,100 324,366 566,513
October 29th, 2009February 11, 2010
TGS EARNINGS RELEASE7 February 2013

TGS |TGS | EARNINGS RELEASE 2 FEBRUARY 2017
Interim Consolidated Statement of Changes in Equity
Foreign Currency
Share Treasury Share Other Paid-In Translation Retained Total
(All amounts in USD 1,000s) Capital Shares Premium Capital Reserve Earnings Equity
Opening balance 1 January 2016 3,657 -26 58,107 34,728 -22,047 1,123,670 1,198,088
Net income - - - - - 22,240 22,240
Other comprehensive income - - - - 114 - 114
Total comprehensive income - - - - 114 22,240 22,353
Paid-in-equity through exercise of stock options - 5 - - - 1,793 1,798
Distribution of treasury shares - 0.4 - - - 156 156
Cost of equity-settled long-term incentive plans - - - 2,236 - - 2,236
Dividends - - - - - -60,940 -60,940
Deferred tax asset related to stock options - - - - - 20 20
Closing balance per 31 December 2016 3,657 -21 58,107 36,964 -21,933 1,086,918 1,163,711
Foreign Currency
Share Treasury Share Other Paid-In Translation Retained Total
(All amounts in USD 1,000s) Capital Shares Premium Capital Reserve Earnings Equity
Opening balance 1 January 2015 3,702 -76 58,107 32,915 -21,123 1,265,675 1,339,201
Net income - - - - - -28,347 -28,347
Other comprehensive income - - - - -924 - -924
Total comprehensive income - - - - -924 -28,347 -29,272
Distribution of treasury shares - 10 - - - 4,435 4,446
Purchase of treasury shares - -6 - - - -4,839 -4,844
Cancellation of treasury shares held -45 45 - - - - -
Cost of equity-settled long-term incentive plans - - - 1,813 - - 1,813
Dividends - - - - - -113,254 -113,254
Closing balance per 31 December 2015 3,657 -26 58,107 34,728 -22,047 1,123,670 1,198,088
Largest Shareholders per 27 January 2017 Shares %
1 FOLKETRYGDFONDET NORWAY 8,966,212 8.8%
2 THE BANK OF NEW YORK MELLON N.V. BELGIUM NOM 7,726,937 7.6%
3 STATE STREET BANK AND TRUST COMP U.S.A. NOM 3,971,879 3.9%
4 STATE STREET BANK AND TRUST COMP U.S.A. NOM 3,824,202 3.8%
5 THE NORTHERN TRUST COMP, LONDON BR GREAT BRITAIN NOM 3,636,007 3.6%
6 RBC INVESTOR SERVICES TRUST GREAT BRITAIN NOM 2,642,547 2.6%
7 STATE STREET BANK AND TRUST COMP U.S.A. NOM 2,323,220 2.3%
8 SWEDBANK ROBUR SMABOLAGSFOND GREAT BRITAIN 2,036,378 2.0%
9 THE BANK OF NEW YORK MELLON U.S.A. NOM 2,020,381 2.0%
10 SANTANDER SECURITIES SERVICES, S.A SPAIN NOM 1,905,183 1.9%
10 Largest 39,052,946 38%
Total Shares Outstanding * 101,602,490 100%
* Total shares outstanding are net of shares held in treasury per 27 January 2017
Average number of shares outstanding for Current Quarter *Average number of shares outstanding during the quarter
Average number of shares fully diluted during the quarter
* Shares outstanding net of shares held in treasury per 31 December 2016 (533,500 TGS shares), composed of average
outstanding TGS shares during the full quarter
Share price informationShare price 31 December 2016 (NOK) 191.70
USD/NOK exchange rate end of period 8.62
Market capitalization 31 December 2016 (NOK million) 19,579
102,221,770
101,602,490
October 29th, 2009February 11, 2010
TGS EARNINGS RELEASE7 February 2013

TGS | EARNINGS RELEASE 2 FEBRUARY 2017
NOTES TO THE CONSOLIDATED INTERIM FINANCIAL STATEMENTS
Note 1 General information
TGS-NOPEC Geophysical Company ASA (TGS or the Company) is a public limited company listed on the Oslo Stock Exchange. The
address of its registered office is Lensmannslia 4, 1386 Asker, Norway.
Note 2 Basis for Preparation
The condensed consolidated interim financial statements of TGS have been prepared in accordance with International Financial
Reporting Standards (IFRS) IAS 34 Interim Financial Reporting as approved by EU and additional requirements in the Norwegian
Securities Trading Act. The interim condensed consolidated financial statements do not include all the information and disclosures
required in the annual financial statements and should be read in conjunction with TGS’ annual report for 2015 which is available on
www.tgs.com.
As from 1 January 2016, the following amendments to the accounting standards have become effective:
IAS 16 Property, Plant and Equipment and IAS 38 Intangible AssetsThe amendments to these standards clarifiy that the use of revenue-based methods to calculate the depreciation of an assetis not appropriate because revenue generated by an activity that includes the use of an asset generally reflects factors otherthan the consumption of the economic benefits embodied in the asset. The amendments also clarifies that revenue isgenerally presumed to be an inappropriate basis for measuring the consumption of the economic benefits embodied in anintangible asset. This presumption, however, can be rebutted in certain limited circumstances.
TGS has implemented the following changes to amortization of the multi-client library from 1 January 2016:o During the work in progress (WIP) phase, amortization will continue to be based on total cost versus forecasted total
revenues of the project.o After a project is completed, a straight-line amortization is applied. The straight-line amortization will be assigned
over a remaining useful life, which for most marine projects is expected to be 4 years. For onshore projects, theremaining useful life after completion of a project is considered to be 7 years for most projects.
The straight-line amortization will be distributed evenly through the financial year independently of sales during thequarters.
The amendments have prospective effects, and the comparative financial figures have not been changed.
Except for the amendments described above, the same accounting policies and methods of computation are followed in the interim
financial statements as compared with the annual financial statements for 2015. None of the other new accounting standards or
amendments that came into effect from 1 January 2016 has a significant impact on the presentation of the financial statements
during 2016.

Note 3 Share capital and equity
The Annual General Meeting held 10 May 2016 renewed the Board of Directors’ authorization to distribute quarterly dividends on thebasis of the 2015 financial statements. The authorization shall be valid until the Company’s Annual General Meeting in 2017, but nolater than 30 June 2017.
On 27 October 2016, the Board of Directors resolved to pay a quarterly dividend of the NOK equivalent of USD 0.15 per share (NOK1.23) to the shareholders. The dividends were paid on 18 November 2016.
On 1 February 2017, the Board of Directors resolved to pay a quarterly dividend of the NOK equivalent of USD 0.15 per share (NOK1.23) to the shareholders. The dividends will be paid to the shareholders later in February 2017.
Note 4 Segment information
Ordinary shares Number of shares
1 January 2016 102,135,990
31 December 2016 102,135,990
Treasury shares Number of shares
1 January 2016 673,600
18 February 2016, treasury shares transferred to cover exercise of stock options (10,000)
6 May 2016, treasury shares transferred to cover exercise of stock options (120,200)
11 May 2016, treasury shares distributed to Board members (9,900)
31 December 2016 533,500
2016 Q4
North &
South America
Europe &
Russia
Africa,Middle East &
Asia/Pacific
Othersegments/Corporate
costs Consolidated
Net external revenues 107,962 34,458 8,036 14,230 164,687
Operating profit 46,452 18,692 -9,195 -13,978 41,970
2016 YTD
North &South America
Europe &Russia
Africa,
Middle East &Asia/Pacific
Othersegments/
Corporatecosts Consolidated
Net external revenues 267,007 109,168 25,939 53,878 455,991
Operating profit 82,090 39,170 -20,133 -48,092 53,035
2015 Q4
North &South America
Europe &Russia
Africa,Middle East &Asia/Pacific
Other
segments/Corporate
costs Consolidated
Net external revenues 79,300 28,799 5,355 18,282 131,735
Operating profit -50,606 -6,795 -67,347 -15,109 -139,858
2015 YTD
North &
South America
Europe &
Russia
Africa,Middle East &
Asia/Pacific
Othersegments/Corporate
costs Consolidated
Net external revenues 295,388 125,179 112,866 78,914 612,347
Operating profit 37,995 50,487 -68,616 -41,098 -21,230
There are no intersegment revenues between the reportable operating segments.
The Company does not allocate all cost items to its reportable operating segments during the year. Unallocated cost items are
reported as “Other segments/Corporate costs”.
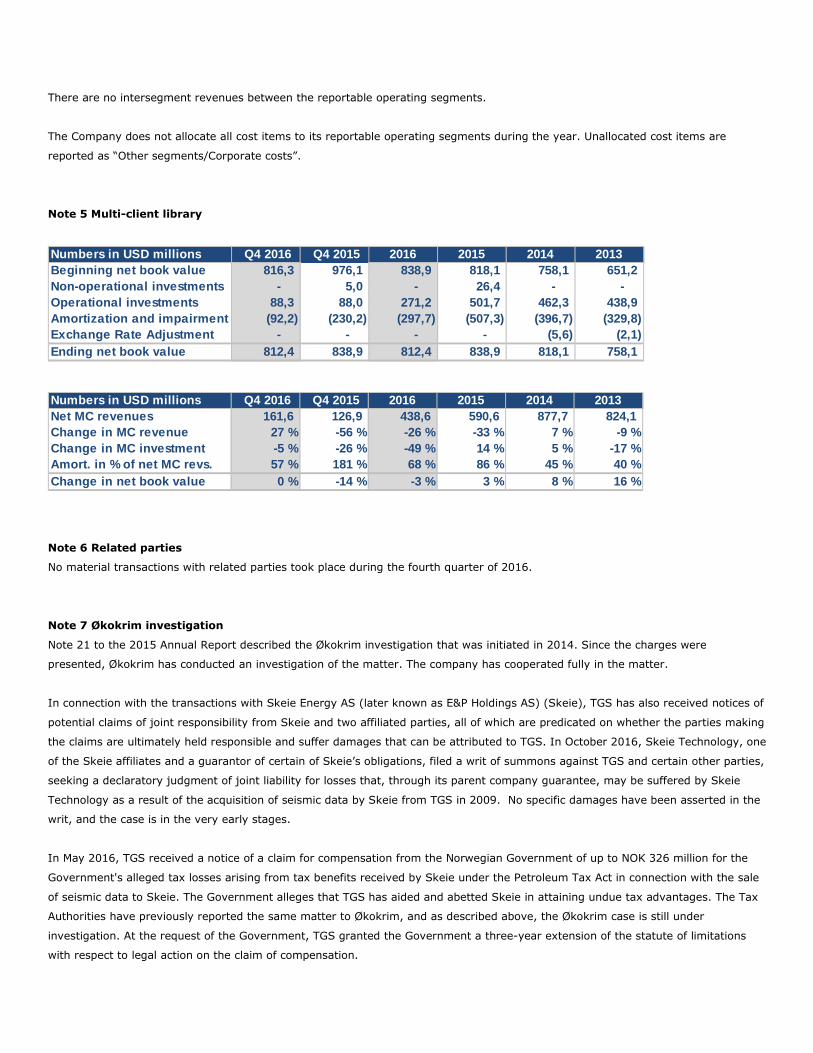
Note 5 Multi-client library
Note 6 Related parties
No material transactions with related parties took place during the fourth quarter of 2016.
Note 7 Økokrim investigation
Note 21 to the 2015 Annual Report described the Økokrim investigation that was initiated in 2014. Since the charges were
presented, Økokrim has conducted an investigation of the matter. The company has cooperated fully in the matter.
In connection with the transactions with Skeie Energy AS (later known as E&P Holdings AS) (Skeie), TGS has also received notices of
potential claims of joint responsibility from Skeie and two affiliated parties, all of which are predicated on whether the parties making
the claims are ultimately held responsible and suffer damages that can be attributed to TGS. In October 2016, Skeie Technology, one
of the Skeie affiliates and a guarantor of certain of Skeie’s obligations, filed a writ of summons against TGS and certain other parties,
seeking a declaratory judgment of joint liability for losses that, through its parent company guarantee, may be suffered by Skeie
Technology as a result of the acquisition of seismic data by Skeie from TGS in 2009. No specific damages have been asserted in the
writ, and the case is in the very early stages.
In May 2016, TGS received a notice of a claim for compensation from the Norwegian Government of up to NOK 326 million for the
Government's alleged tax losses arising from tax benefits received by Skeie under the Petroleum Tax Act in connection with the sale
of seismic data to Skeie. The Government alleges that TGS has aided and abetted Skeie in attaining undue tax advantages. The Tax
Authorities have previously reported the same matter to Økokrim, and as described above, the Økokrim case is still under
investigation. At the request of the Government, TGS granted the Government a three-year extension of the statute of limitations
with respect to legal action on the claim of compensation.
Numbers in USD millions
Beginning net book value
Non-operational investments
Operational investments
Amortization and impairment
Exchange Rate Adjustment
Ending net book value 812,4 838,9
2013
651,2
-
438,9
2014
758,1
-
462,3
(396,7)
838,9
(92,2)
- (5,6) (2,1)
501,7
(507,3)
758,1818,1812,4
88,0
(230,2)
88,3
(329,8)
838,9
- - -
Q4 2015 2016
271,2
-
816,3 976,1
5,0 -
(297,7)
Q4 2016 2015
818,1
26,4
Numbers in USD millions
Net MC revenues
Change in MC revenue
Change in MC investment
Amort. in % of net MC revs.
Change in net book value
Q4 2016
161,6
27 %
2016
-26 %
877,7
40 %
2013
16 %
2015
590,6
-33 %
14 %
86 %
3 %
5 %
2014
-56 %
57 % 181 %
-5 %
45 %
8 %-3 %
-26 %
68 %
0 % -14 %
-49 %
7 %
-17 %
824,1126,9 438,6
Q4 2015
-9 %

At this stage of the investigation by Økokrim and the related civil matters, it is impracticable to render an assessment of the
outcome, however TGS believes the charges against it by Økokrim and the related claims of liability from other parties are not well-
founded, and it is proactively and vigorously developing its defense against the charges and claims. As a result, no provisions have
been made.
Note 8 Acquisition of multi-client library from Dolphin UK Ltd
On 17 January 2017, subsidiaries of the Company, together with subsidiaries of Petroleum Geo-Services ASA (PGS), concluded the
joint acquisition of a majority of the multi-client library of Dolphin UK Ltd. The total acquisition price paid by the TGS entities for the
50% interest acquired amounted to USD 6.2 million, USD 3.7 million of which was paid in cash at closing, with the balance payable
in January 2021 under a promissory note guaranteed by the Company. In addition, the TGS and PGS entities agreed to pay a share
of revenues received from licenses of the library in excess of a specified threshold, if any, during a four-year period after the closing.
TGS has allocated the purchase price among the acquired multi-client projects. The acquired projects are amortized on a straight-line
basis over the remaining useful life.
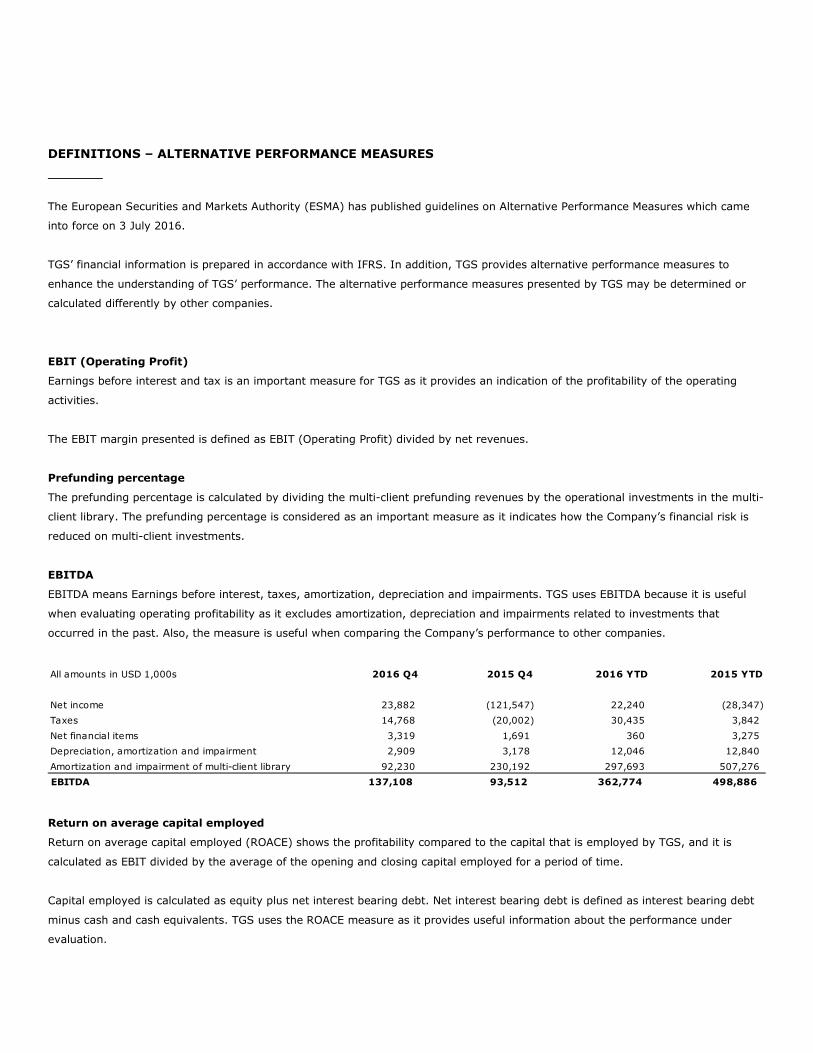
DEFINITIONS – ALTERNATIVE PERFORMANCE MEASURES
The European Securities and Markets Authority (ESMA) has published guidelines on Alternative Performance Measures which came
into force on 3 July 2016.
TGS’ financial information is prepared in accordance with IFRS. In addition, TGS provides alternative performance measures to
enhance the understanding of TGS’ performance. The alternative performance measures presented by TGS may be determined or
calculated differently by other companies.
EBIT (Operating Profit)
Earnings before interest and tax is an important measure for TGS as it provides an indication of the profitability of the operating
activities.
The EBIT margin presented is defined as EBIT (Operating Profit) divided by net revenues.
Prefunding percentage
The prefunding percentage is calculated by dividing the multi-client prefunding revenues by the operational investments in the multi-
client library. The prefunding percentage is considered as an important measure as it indicates how the Company’s financial risk is
reduced on multi-client investments.
EBITDA
EBITDA means Earnings before interest, taxes, amortization, depreciation and impairments. TGS uses EBITDA because it is useful
when evaluating operating profitability as it excludes amortization, depreciation and impairments related to investments that
occurred in the past. Also, the measure is useful when comparing the Company’s performance to other companies.
Return on average capital employed
Return on average capital employed (ROACE) shows the profitability compared to the capital that is employed by TGS, and it is
calculated as EBIT divided by the average of the opening and closing capital employed for a period of time.
Capital employed is calculated as equity plus net interest bearing debt. Net interest bearing debt is defined as interest bearing debt
minus cash and cash equivalents. TGS uses the ROACE measure as it provides useful information about the performance under
evaluation.
All amounts in USD 1,000s 2016 Q4 2015 Q4 2016 YTD 2015 YTD
Net income 23,882 (121,547) 22,240 (28,347)
Taxes 14,768 (20,002) 30,435 3,842
Net financial items 3,319 1,691 360 3,275
Depreciation, amortization and impairment 2,909 3,178 12,046 12,840
Amortization and impairment of multi-client library 92,230 230,192 297,693 507,276
EBITDA 137,108 93,512 362,774 498,886
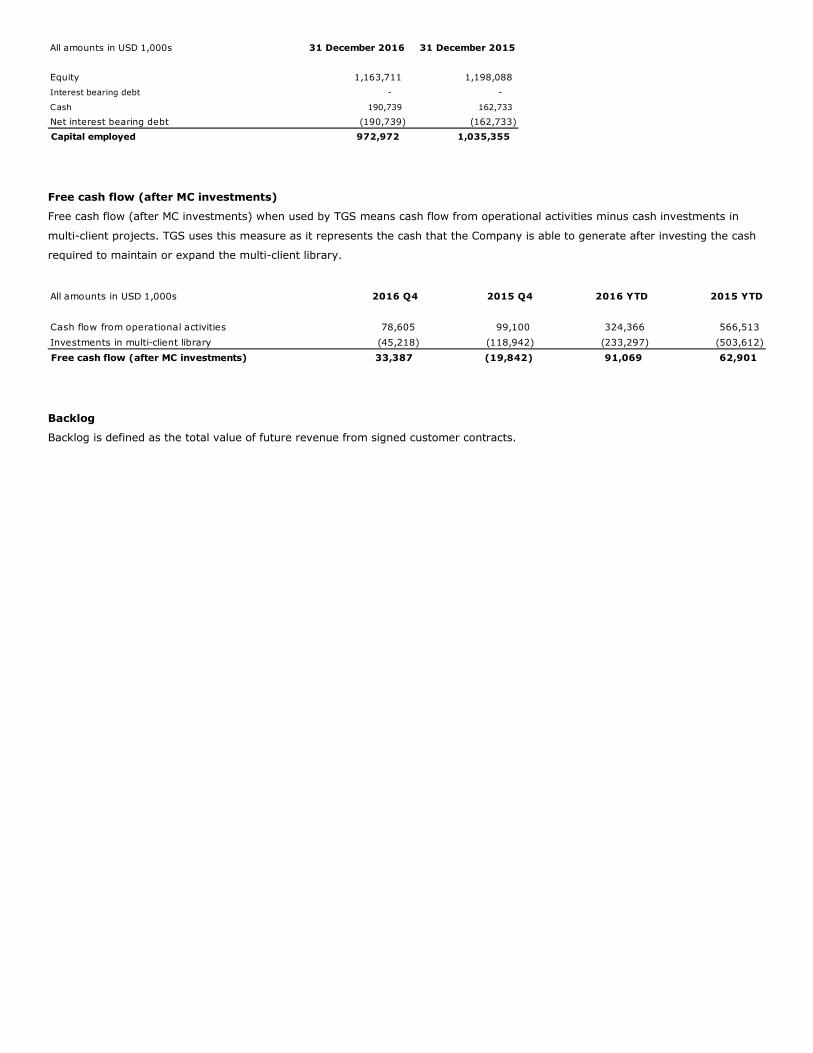
Free cash flow (after MC investments)
Free cash flow (after MC investments) when used by TGS means cash flow from operational activities minus cash investments in
multi-client projects. TGS uses this measure as it represents the cash that the Company is able to generate after investing the cash
required to maintain or expand the multi-client library.
Backlog
Backlog is defined as the total value of future revenue from signed customer contracts.
All amounts in USD 1,000s 31 December 2016 31 December 2015
Equity 1,163,711 1,198,088
Interest bearing debt - -
Cash 190,739 162,733
Net interest bearing debt (190,739) (162,733)
Capital employed 972,972 1,035,355
All amounts in USD 1,000s 2016 Q4 2015 Q4 2016 YTD 2015 YTD
Cash flow from operational activities 78,605 99,100 324,366 566,513
Investments in multi-client library (45,218) (118,942) (233,297) (503,612)
Free cash flow (after MC investments) 33,387 (19,842) 91,069 62,901