textbook economics and the cma’s analysis of the retail ... · cma reported in june 2016. 2. the...
TRANSCRIPT

www.eprg.group.cam.ac.uk
The CMA’s analysis of the retail energy market:
an examination using textbook economics
EPRG Working Paper 1703
Cambridge Working Paper in Economics 1707
Stephen Littlechild1
Abstract This paper is an attempt to understand better the CMA’s analysis of
the domestic retail energy market in Great Britain. It uses elementary economics textbook
diagrams to examine the CMA’s calculations of the alleged customer detriments caused by
market power. The paper finds that the CMA’s calculations do not really relate to, or
measure, the extent to which prices are above “the competitive level”. Rather, they concern
something different, viz. the detriment to customers because of suppliers being less efficient
than the CMA considers they should be. The CMA’s calculations do not, therefore, indicate
that the retail energy market is characterised by market power, price discrimination or
excessive prices in the conventional sense. Nor is the CMA report convincing about the link
between weak customer response and inefficiency. The CMA report has pointed
policymakers and the media in an unhelpful direction.
Keywords retail energy markets, market power, price discrimination, efficient
costs
JEL Classification L94, L95, L51
1 Emeritus Professor, University of Birmingham, and Fellow, Judge Business School, University of Cambridge. I am grateful to Eileen Marshall for many helpful comments, and to Monica Giuletti and an anonymous referee for further suggestions.
Contact [email protected] Publication March 2017 Financial Support

1
The CMA’s analysis of the retail energy market: an examination using textbook economics
Stephen Littlechild1
5 March 2017
Abstract
This paper is an attempt to understand better the CMA’s analysis of the domestic retail energy market in Great Britain. It uses elementary economics textbook diagrams to examine the CMA’s calculations of the alleged customer detriments caused by market power. The paper finds that the CMA’s calculations do not really relate to, or measure, the extent to which prices are above “the competitive level”. Rather, they concern something different, viz. the detriment to customers because of suppliers being less efficient than the CMA considers they should be. The CMA’s calculations do not, therefore, indicate that the retail energy market is characterised by market power, price discrimination or excessive prices in the conventional sense. Nor is the CMA report convincing about the link between weak customer response and inefficiency. The CMA report has pointed policymakers and the media in an unhelpful direction.
Background
1. Over the two decades from the early 1980s to the early 2000s, domestic retail gas and electricity prices generally decreased. But from 2004 to about 2010 they roughly doubled. There were widespread concerns that the Six Large Energy Suppliers (SLEFs or the Big 6) were exerting market power to make excessive profits. In 2008 Ofgem found that there were “unfair price differentials” and a lack of engagement by some customers. It initiated the first of a series of regulatory interventions. But concerns remained, and in 2014 Ofgem referred the energy market to the Competition and Markets Authority (CMA). The CMA reported in June 2016.
2. The CMA concluded that there was “weak customer response”, which constituted an Adverse Effect on Competition. It said:
“Overall, our view is that the overarching feature of weak customer response gives suppliers a position of unilateral market power concerning their inactive customer base and that suppliers have the ability to exploit such a position through their pricing policies: through price discrimination by pricing their standard variable tariffs materially above a level that can be justified by cost differences from their non-standard tariffs; and/or by pricing above a level that is justified by the costs incurred in operating an efficient domestic retail supply business.” 2
3. The CMA explained that the “most significant” detriment that this caused was that “domestic energy customers are, on average, paying higher prices than they would do in well-functioning markets”.3 The CMA described how it quantified this detriment.
1 Emeritus Professor, University of Birmingham, and Fellow, Judge Business School, University of Cambridge. I am grateful to Eileen Marshall for many helpful comments, and to Monica Giuletti and an anonymous referee for further suggestions. 2 CMA (2016a), para 160. 3 CMA (2016a), para 10.3
2
10.5 We have adopted two approaches to assessing the extent to which prices are excessive (ie have exceeded those we would expect in a well-functioning market): (a) A ‘direct’ approach, which involves comparing the average prices charged by the Six Large Energy Firms with a competitive benchmark price which is based on the prices charged by the most competitive suppliers, adjusted to allow for a normal return on capital and where appropriate for differences in suppliers’ size, rate of growth and the cost elements that are outside of their control. (b) An indirect approach, which involves assessing both: (i) the Six Large Energy Firms’ levels of profitability (and in particular whether the return on capital employed by such suppliers exceeds their cost of capital); and (ii) the extent to which the Six Large Energy Firms have incurred overhead costs inefficiently (ie whether costs are higher than we estimate an efficient supplier would incur).
4. The CMA’s “direct” approach yielded an average detriment of about £1.4bn per year over the period 2012 – 2015, reaching almost £2bn in 2015.4 These figures have hit the headlines, and have led to calls for more substantial remedies than the CMA proposed, including more extensive price controls. The calculations are somewhat unclear and controversial, and have been criticised, not only by the suppliers themselves but also by others including myself.5
5. The CMA’s “indirect” approach yielded an average detriment of £720m per year over the period 2007 – 2014 and reached about £1.1bn over 2012-2014, or £1.5 bn with a more stringent efficiency benchmark6. This approach, too, has been questioned. Although at first sight it might appear conventional insofar as it involves a calculation of excess profit, the definition of this turns out to be ambiguous and the indirect approach also involves an unconventional calculation of “inefficient cost”.
6. The concern in this paper is not with the details of the calculations but with their nature.7 It first notes the significance of an excess profit calculation in ascertaining whether there are detriments in the form of price discrimination and/or excessive prices. Then it seeks to understand the logic of the indirect approach by examining it from the perspective of an elementary economics textbook diagram. This in turn provides insight into the direct approach, and the nature of the CMA’s approach overall.
Price discrimination
7. As noted, the CMA found that there was weak customer response, which gave the six large suppliers market power so that they could engage in price discrimination: “pricing their standard variable tariffs materially above a level that can be justified by cost differences from their non-standard tariff”. Suppliers raised various objections to this analysis. Some argued that they did not engage in price discrimination, others accepted
4 CMA (2016a), para 194 5 “Significant elements of the CMA’s detriment calculations are not in the public domain … this seems a highly unsatisfactory basis for politicians and regulators to make judgments about whether the prices charged by the Big 6 reveal evidence of an ‘overcharge.’” Friend (2016), pp 42-4. “In sum, the CMA’s direct approach to calculating customer detriment was not transparent, was inconsistent with the CMA’s own Guidelines, was based on a series of guesses rather than reality, and ended up with an implausible answer.” Littlechild et al (2017), para 19. 6 CMA (2016a), paras 200, 201. 7 The paper also does not discuss the special economic, social and technical considerations associated with prepayment meters and their tariffs and various remedies.
3
that it occurred.8 RWE argued that this pricing model was adopted across the industry, did not raise any competition concern, and indeed was often considered to be pro-competitive.9
8. In response, the CMA acknowledged that competition via discounted introductory offers was commonplace in other markets.10 However, the CMA argued that this would not fully compete away the profits involved, and some customers would always be paying higher prices.11 It concluded:
However, our findings demonstrate that in the domestic retail energy markets the price discrimination we have observed is not a result of a well-functioning market. In particular, on average, customers have been paying prices that are above the competitive level.12
9. The argument that price discrimination is not necessarily a reflection of market power, and indeed is characteristic of many competitive markets, is well-established in the economics and regulatory literature. For example, if there are economies of scale because of fixed costs, then firms cannot survive at price equal to marginal cost: that would not be “the competitive level”. Instead, there would be price mark-ups over marginal cost and these would reflect elasticities of demand. Textbooks on regulation explain why this so-called Ramsey pricing is more efficient than uniform mark-ups.13 This implies, in particular, that lower mark-ups for more engaged customers than for less
8 “RWE said that it did not dispute that there was an element of price discrimination in the market, in particular that the differences between its SVT and non-standard tariffs were fully explained by differences in unit costs. RWE said that its non-standard tariffs were normally priced at a discount to its SVT and that this was a pricing model adopted across the industry. RWE said that its non-standard tariffs were priced based on (and the financial viability of its cheapest non-standard products depends upon) a certain proportion of customers reverting to its non-discounted SVT at the end of their fixed term, for a certain period.” CMA (2016a), para 9.325 9 “RWE also said that the CMA had failed to demonstrate why this raised any competition concern. Price variation and price discrimination were features of many competitive markets and from an economic point of view were often considered to be efficient/pro-competitive.” CMA (2016a), para 9.326, summarising RWE (2015), paras 279 and 291, 257, 291 and 279. 10 “9.327 We recognise that suppliers compete to acquire and retain customers through products priced at a discount to their SVTs (see Section 8). 9.328 We agree that the incentives suppliers have to offer discounted tariffs will be driven by the profits they expect to earn from the customers acquired or retained by such tariffs. Indeed, several of Six Large Energy Firms told us that they calculate the net present value of customers acquired by discounted products over a period of between three and five years and, in making these calculations, they will expect some of those acquired to revert to the SVT and others to switch to another discounted product or supplier. 9.329 We also agree that competition for customers with discounted introductory offers is commonplace in other markets.” CMA (2016a), paras 9.327-329 11 “9.330 According to RWE the viability of its cheapest non-standard products depends upon some customers reverting to the SVT prices. However, suppliers cannot be certain what proportion of the customers acquired will revert to the SVT or how long they will remain on the SVT and we would expect this uncertainty to limit their incentives to discount tariffs. This means that the competition to acquire customers through introductory offers is unlikely to have the effect of ‘fully competing away’ the profits generated by those customers who later revert to the SVT. More importantly, the incentives to discount will be limited to the profits earned on those customers acquired through discounted tariffs, and those customers who do not engage in the market and stay on SVTs will always be paying the higher SVT prices.” CMA (2016a), para 9.330 12 CMA (2016a), para 9.330 13 E.g. “Services where demand is relatively responsive to price should generally have a lower than average proportionate mark-up, while services where demand is relatively unresponsive to price should have a higher than average mark-up over their marginal costs. This enables common costs to be recovered in a way that reduces to a minimum the harmful effects of distortion in output caused by a mark-up over marginal cost.” Baldwin and Cave (1999) p 209

4
engaged customers is a more efficient way of recovering the fixed costs of energy suppliers than charging everyone the same price.
10. RWE cited several references in the economic literature as to how price discrimination could intensify competition.14 We may add Baumol’s argument that price discrimination, not uniform pricing, is the norm in competitive markets.15 Finally, a former Director General of the Office of Fair Trading has explained that “price discrimination can often be good, indeed optimal”.16 In a subsequent submission to Ofgem he was explicit about the dangers of banning this practice in the energy market.17
11. It follows that the CMA cannot claim that the large suppliers “pricing their standard variable tariffs materially above a level that can be justified by cost differences from their non-standard tariffs” is, per se, an exercise of market power or a customer detriment. Ultimately, the CMA’s defence of its finding that such price differentiation is an exercise of market power and a customer detriment is its claim just cited - that “on average, customers have been paying prices that are above the competitive level”. What, then, is “the competitive level”, and have prices in fact been above it?
Competition, profits and market power
12. Consider the Supply and Demand diagram shown in Figure 1. This is perhaps the most famous and familiar diagram in the whole of economics. It is of course a static model of a market, which does not encompass all the considerations that are relevant in a competition analysis. But it suffices to understand the CMA’s approach, which made little reference to dynamic factors or to competition as a rivalrous discovery process over time.
13. In the textbook competitive market, price Pc and quantity Qc are given by the intersection of the Supply and Demand curves. The supply curve is the cost curve for the industry. These are actual costs, not hypothetically efficient costs. They, and the supply curve, are assumed to include a “normal” profit or return on capital employed, equal to the cost of capital. Competition means that suppliers take market price as given. There is no restriction of output to increase price and profit. Pc is the price that represents “the competitive level”.
14 RWE (2015), para 279, fns 208, 209; RWE (2016), para 23, fn 20. The two most recent and applicable references cited there were Corts (1998) and Shaffer and Zhang (2000). 15 “…uniform pricing is not to be taken as the normal characteristic of equilibrium of the competitive firm. Rather, … discriminatory pricing is the normal attribute of equilibrium wherever the demand curves are not horizontal and wherever it is possible for the firm effectively to prevent consumers in separable groups with different demand elasticities from reselling products to one another. …wherever such pricing is feasible, effective competition makes it [discriminatory pricing] mandatory…” (Baumol 2006), p 6 16 Vickers (1998), p 175. He adds “Firms with economies of scale would make losses from marginal cost pricing so price-cost mark-ups are needed. … will they optimally involve discriminatory pricing – that is, different price-cost mark-ups? Almost certainly yes.” (p 179) 17 “Banning price discrimination stops important kinds of price competition − for example, regional incumbents challenging one another − and so perversely can blunt competition and help firms sustain higher prices to consumers in general.” Vickers (2009)

5
14. The competitive market price Pc is equal to cost – that is, equal to actual cost including a
normal profit - for the last unit produced. In simple terms, we may associate the last unit with the highest cost producer in the market. Note then that competitive markets do not imply zero profit for all units produced or for all suppliers in the market. Lower cost suppliers earn positive or above-normal profits as a result of their relative efficiency (relative to the least efficient supplier in the market).18 This is not “excess profit” in the conventional sense. It is variously called (infra-marginal) rent or producer surplus. It is designated by area A in Figure 1.
15. In contrast, consider a market characterised by market power, in which suppliers can restrict output and keep price above the competitive level. Figure 2 shows such a price labelled Pm. Producer surplus (area A) may be lower than before insofar as output Qm is lower than Qc and therefore the cost at the margin is lower. But there is now an area of excess profit shown as area B. This excess profit is enjoyed by all suppliers, even the highest cost ones, because price is above cost even at the margin. Let us call this “true” excess profit, or excess profit in the conventional sense.
16. In practice, a major task of a regulator or competition authority is to decide whether a market is basically competitive as in Fig 1 or exhibits market power as in Fig 2. A common approach is to calculate the profits and profit rates, or return on capital employed, of the main suppliers in the market. These rates are then compared with normal profit rates (or estimated cost of capital) to assess whether or where there is true excess profit, and if so at what level.
17. These calculated profits could potentially include both producer surplus from relative efficiency and true excess profit. One would therefore expect a competition regulator to seek to assess how much of the “total” above-normal profit in a market (areas A+B) is attributable to relative efficiency (area A) as opposed to true excess profit reflecting market power (area B).
18. It is important to distinguish between profit reflecting superior efficiency (producer surplus, area A) and profit reflecting market power (true excess profit, area B), not least because this influences understanding of market phenomena and could influence policy. For example, as already noted, a judgement whether price discrimination is competitive or reflects market power may be influenced by whether price is above the competitive
18 RWE cited a publication coauthored by the CMA’s (now) Chief Economist that made precisely this point. “The [basic competitive] theory predicts that the marginal firm in long-run equilibrium earns zero economic profits, but firms with lower costs will earn positive economic profits.” Lind and Walker (2003), p 4, cited in RWE (2015), fns 236, 237.

6
level – that is, whether there is true excess profit. In the short term, at least, excess profit achieved by restricting output will be economically inefficient, in the sense that some customers would be prepared to pay the cost of expanding output from Qm to Qc but will not be supplied. The higher than competitive price also means that customers are having to pay more than necessary to bring forth that amount of output.19
The CMA’s analysis of retail energy market profits
19. As noted above, the CMA’s analysis of excess profit was part of its indirect approach. The CMA calculated an average customer detriment of £720m per year over the 8 year period 2007 – 2014. This was the sum of two components, the first of which was associated with what the CMA called excess profit, which amounted to an average of £303m per year. To calculate this excess profit, the CMA took the Six Large Suppliers’ total net revenues less a normal profit, which it assumed to be a 10 per cent return on capital. As with the CMA’s direct approach noted above, the CMA made numerous assumptions and modifications in order to calculate capital employed and normal profit. These assumptions and modifications were both significant and controversial, but they are not our concern here.
20. In terms of our diagram, the CMA’s calculation of excess profit is the sum of areas A + B. So for present purposes, the key question is: how much of the CMA’s £303m total excess profit per year did the CMA associate with producer surplus (ie superior efficiency of the lower cost firms, area A) and how much with true excess profit (in the sense of profit reflecting the exercise of market power, area B)?
21. Unfortunately, the CMA report neither asked nor answered this question. It made no reference to producer surplus or rent. Given the significance of the distinction, this seems unfortunate. We can, however, draw on other evidence to form a view on the likely division of the CMA’s total excess profit between producer surplus and true excess profit. And we can, in retrospect, find some statements in the CMA report that bear on this question.
Evidence on differences between suppliers
22. The CMA applied its direct approach for the eight-year period (2007-2014). Unfortunately, it redacted almost all its figures. However, other sources provide data for most of those years.
23. In assessing cost efficiency of the suppliers, the CMA did not seek to compare network costs or social and environmental costs. It also concluded that “it would be misleading to seek to identify an ‘efficient’ level of wholesale energy costs on an ex post basis”. The CMA focused on a comparison of operational costs: the indirect cost per customer account for their domestic supply businesses.
19 In a longer-term more dynamic model, matters are not quite so simple. Producer surplus may be a reward for greater efficiency and therefore an incentive to suppliers to be more efficient in future. This will tend to lower the supply curve and thereby bring lower prices to customers. But similarly, true excess profit could be the result of innovation and could be expected to incentivise more suppliers to enter the market offering lower prices. This would tend to eliminate the excess profit and also bring new ideas and products and possibly lower costs. So the (temporary) existence of “true excess profit” is not necessarily a cause for concern. Here, however, we stick to the simple static analysis, as the CMA did.

7
Table 1 Supplier Average
indirect cost per domestic customer20
Average domestic supply profit (EBIT)21
Average domestic supply profit margin (EBIT as % of revenue)22
2009-2012 2009-2014 2009-2014 SSE £77 £230.6m 4.94% Centrica £96 £586.1m 6.93% SP £107 £82.1m 1.38% E.On £115 £80.3m 1.79% RWE £134 -£17.5m -0.18% EdF £150 -£100.0m -3.61% Total £861.5m
24. The first column of Table 1 shows the average indirect cost per domestic customer over the period 2009-2012, for each of the Six Large Suppliers. Ofgem et al comment:
“On a per domestic customer basis, and adjusting for inflation, SSE has consistently had the lowest costs and EDF and RWE the highest costs. The supplier with the highest costs had total indirect costs that were 76 per cent higher than the supplier with the lowest costs in 2012 and 32 per cent higher than the average for the six largest suppliers. The variation in indirect costs among the major suppliers has remained significant over time, with little convergence in costs, as one might expect if competition were driving down costs to the efficient level over time.” 23
25. As explained below, I challenge the last two propositions, but the point here is to establish a significant and continuing difference in cost between the suppliers. This – and the fact that the CMA based its indirect approach on such cost differentials - indicates that the industry supply curve is rising rather than flat. So producer surplus is likely to be significant rather than negligible.
26. The figures also indicate the existence of economies of scale. Average cost per customer is inversely related to the number of customer accounts, although the two Scottish companies (SSE and SP) have lower average costs per customer than their sizes might otherwise indicate.24
27. The second column shows evidence of significant differences in average profitability (EBIT: Earnings Before Interest and Tax) between the six large suppliers. Over the period 2009-2014, the largest supplier Centrica accounted for no less than two thirds
20 Ofgem et al (2014), my calculation based on Fig 50 and para 6.37. 21 My calculation based on Segmental Statements of Six Large Suppliers, per Ofgem website. 22 My calculation based on Segmental Statements of Six Large Suppliers, per Ofgem website. 23 Ofgem et al (2014), para 6.37. 24 These are the only two suppliers that still retain network businesses, so there may be some impact of cost allocation between the two sets of businesses, or this may be another manifestation of economies of scale. Note also that all six large energy firms are involved in wholesale as well as retail activities, so cost allocation issues may arise there too. It is beyond the scope of this paper to analyse the precise determinants of supplier costs.

8
(£586.1m/£861.5m = 68%) of total profits. The two largest suppliers (Centrica and SSE) accounted for 95% of total profits.
28. In the third column, the average profit margins, defined as the average ratio of EBIT to revenue, indicate that two of these suppliers made profit margins in the range 5-7% of revenue, two made low profit margins (about 1.5% of revenue) and two of them were loss-making. These data confirm that producer surplus – differences in profits between suppliers - must be a very significant part of the CMA’s “excess profit”.
29. The absolute levels of these EBIT margins also establish another very important point about the competitiveness of the market. On average, two of the companies made a loss rather than a profit over 2009-2014. And suppliers’ losses were heavier in the earlier period 2007-2008.25 So the above figures overstate rather than understate suppliers’ profits over the whole period 2007-2014 to which the CMA’s indirect approach calculations apply. Moreover, these EBIT margins are measures of profit before deduction of any return on capital. So two companies made even more severe losses relative to normal profit than these figures indicate, and whether the two companies with positive but low margins actually covered their cost of capital is unclear.
30. These losses suggest that, for the least efficient producer(s) in the market, average price over 2007 – 2014 was not above cost, or even equal to it. It was below cost. This suggests, in turn, that not merely some but probably most or even all of the CMA’s calculated “excess profit” was producer surplus (area A) rather than true excess profit (area B). The producer surplus reflected the lower costs of (primarily) Centrica and SSE relative to (primarily) RWE and EdF. And if two of the large suppliers were regularly making losses in this market, and two others were barely breaking even, it throws doubt on any suggestion that the profits of the two remaining large suppliers in the market reflect market power. The more plausible conclusion is that average price in the market during the period 2007—2014 was not above “the competitive level”, and was more likely below it.
Did different companies have different prices?
31. The textbook diagram assumes a uniform product at a uniform price. However, there are various different types of tariff (notably Standard Variable and fixed price fixed term) and different payment methods (direct debit, standard credit and prepayment). Prices vary from one tariff type to another, and from one supplier to another, although the CMA did observe that “the SVTs of each of the Six Large Energy Firms track each other quite closely”.26 If some companies’ tariffs were generally higher or lower than others, the profit data might reflect differences in prices rather than differences in cost.
32. The CMA did indeed find some differences in prices between suppliers. “EDF Energy offered consistently the lowest average prices paid by customers of the Six Large Energy Firms, with the customers of SSE, Centrica and RWE generally paying the highest average prices over the period Q12012 to Q2 2015.”27
25 “We note that the level of profits in excess of the cost of capital earned on domestic customers was significantly higher from 2009/10 onwards, than in 2007 and 2008, when the industry made economic losses overall (ie profits which were less than the firms’ cost of capital).” CMA (2016a), para 10.95 26 CMA (2016a) para 8.183 27 CMA (2016a) para 8.207

9
33. Table 1 shows that Centrica had the highest profit margin but did not have the lowest cost. As noted, its prices were higher than those of some other suppliers, but they were not systematically the highest.28 Another important factor was that it had a larger number of gas customers over whom it could spread its overhead costs.29
34. Note, however, that since market opening around 1998 both Centrica and the previously incumbent electricity companies had each lost over 40 per cent of their local customers to competitors by 2006, and each lost a further 20 per cent over the next decade.30 So even if part of the total £303m excess profit in the sector were true excess profit reflecting incumbent advantage, rather than producer surplus, it seems to be a declining part.
35. In contrast, EdF had the lowest EBIT margins and ratios and the highest cost per customer over this period. As noted, its prices were lower than those of its competitors.31 These characteristics, and its tolerance of a loss in retail averaging £100m per year for a 6 year period, presumably reflected its ownership and its strategic objectives.32
36. However, even if EdF’s prices were lower than those of the other large suppliers over this period, this does not mean that other suppliers were earning £303m true excess profit per year. RWE, the second-highest cost producer, also made a loss on average over this period.
37. All this suggests that, over the period 2007- 2014, most total profit over and above the cost of capital was attributable to producer surplus. True excess profits do not seem to have been a characteristic of the market as a whole over this period, and hence not indicative of market power. In general, prices do not seem to have been “above the competitive level” as conventionally interpreted.
The CMA’s calculation of inefficient cost
38. As explained above, the CMA sought to assess whether average prices were above the levels that it would expect in a well-functioning competitive market. Its indirect approach involved assessing both excess profits and “the extent to which suppliers have incurred
28 With respect to standard variable tariffs, “British Gas [Centrica] had sometimes been the most expensive or among the most expensive, sometimes the cheapest, and other times ‘mid-pack’.” “British Gas’s fixed-term tariff[s] have often been among the most expensive offered by the Six Large Energy Firms, but for 2014 to March 2015 its Sainsbury’s Energy tariffs were the cheapest of those offered by the Six Large Energy Firms.” CMA (2016b), paras 54(b), 55(a) 29 When the gas market opened to competition British Gas/Centrica had all the gas customers, whereas when the electricity market opened each of the successors to the incumbents had on average about one fifth of the electricity customers. In addition, British Gas developed a leading position in the ancillary gas boiler market, which might have made its customers less inclined to switch to other suppliers. So British Gas/Centrica has benefited from a relatively large number of inherited customers – indeed, all its profits come from gas rather than electricity. Ofgem (2016) Fig 2.2 30 Ofgem (2016), Fig 2.1 p 10. 31 Further, “EDF Energy had consistently priced its standard variable tariff to be the cheapest of the Six Large Energy Firms;” … “EDF Energy expected its fixed-rate tariffs … launched in 2013 to achieve between 4th and 8th positions (with 1st position being the cheapest tariff) among all tariffs offered by the Six Large Energy Firms (including white label brands) … Since November 2013, EDF Energy’s tariffs were better ranked with its tariffs expected to be in the top three among the major suppliers.” CMA (2016b), paras 54(c), 55(b) 32 EdF is majority (84.5%) owned by the French Government. It was a participant in the proposed Hinkley Point nuclear contract on which a UK Government decision was being made over the period since 2008.

10
costs inefficiently (ie whether costs are higher than we estimate an efficient supplier would incur)”.33
39. There seems no doubt that, any point in time or even over a period, some suppliers are less efficient than others. However, the CMA’s concept of “inefficient cost” is problematic. It seems to reflect a hybrid dynamic-static concept of competition in which costs converge over time to “the efficient level” that inexplicably itself remains constant.
40. Ofgem (2008) originated the concept. 34 It was picked up by Ofgem et al (2014) who claimed, as cited above, that there was “little convergence in [suppliers’ indirect] costs, as one might expect if competition were driving down costs to the efficient level over time.” A CMA working paper claimed that, in a well-functioning market, “over time the gap between the highest and lowest cost suppliers should converge”.35 In evidence to the CMA, I challenged both the empirical accuracy and the theoretical basis for these propositions about convergence. 36 Nonetheless, the concept of “the efficient level” of cost survives as an intrinsic element of the CMA’s indirect cost approach.37
41. As its base case benchmark for the cost of an efficient supplier the CMA used the lower quartile indirect cost per customer account of the Six Large Suppliers. The CMA regarded this lower quartile cost as a conservative estimate38 and explored other possible benchmarks such as the costs of the lowest cost large supplier and of two medium size suppliers.
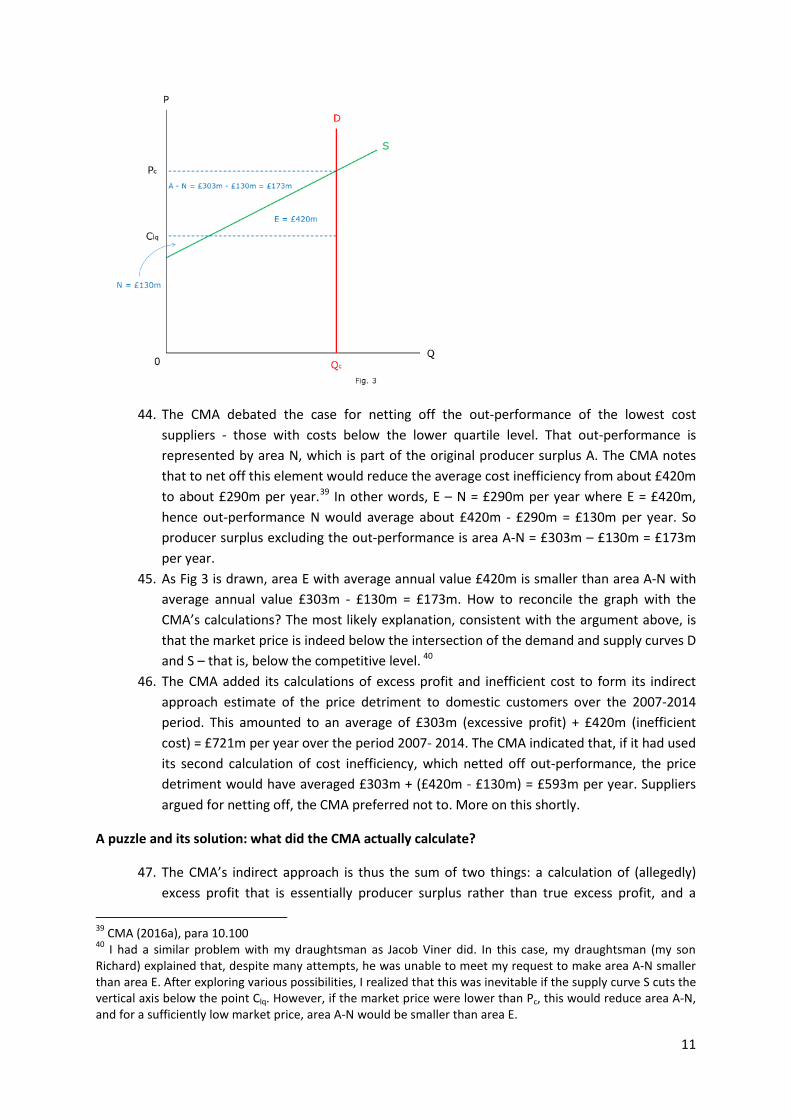
42. Figure 3 shows the same market as before, though for simplicity the Demand curve is drawn vertically. This is not unreasonable since the demand for energy is inelastic with respect to price, and quantity demanded or supplied is not of the essence either here or in the CMA’s analysis. The diagram also assumes that the average price in the market is at, rather than below, the competitive level. This again is for simplicity of exposition, but note the point made in para 44 below.
43. The lower quartile cost is denoted Clq in Fig 3. In effect, the CMA assumes that the industry cost or supply curve becomes a horizontal line at level Clq. The CMA’s inefficient cost is represented by area E in Fig 3. The CMA estimated this cost inefficiency to average about £420m per year.
33 CMA (2016a) para 2.164 34 Littlechild (2015b) at section 10. Ofgem there noted “a wide range of operating costs per account, with the cost per account of the highest cost supplier around 90 per cent higher than those of the lowest”. It said “this evidence is not consistent with an effectively competitive market, where we would have expected such material cost differences to have been competed away”. Ofgem (2008) para 7.86. The Institute for Public Policy and Research (IPPR, 2012 section 2.3.1) made a similar claim, citing Ofgem (2008). 35 CMA (2015a) para 77. 36 “More importantly, it [CMA (2015a)] reflects an analysis in the State of the Market Assessment [Ofgem et al (2014)] that is at best incomplete, and at worst misleading, in three respects: economic theory does not imply, as claimed, that operating costs of suppliers in a competitive market will converge over time; as it happens, however, the evidence presented in the Assessment suggests that operating costs of the major suppliers did converge over the period 2009 – 2012, arguably by more than the “little convergence” referred to in the Assessment; and the extent of cost differences between major suppliers, and the extent of convergence, reflect the impact of state ownership of one major supplier as well as the extent of competition; after removing that comparator the extent of cost difference is markedly less than indicated in the Assessment and the convergence over time is markedly greater than indicated there.” Littlechild (2015a) 37 CMA (2015b) included references to efficient levels and also “the efficient level” of cost (e.g. paras 2.148, 2.163), and similarly in CMA (2016a) (e.g. paras 2.150, 10.100). 38 E.g. CMA (2016a) paras 10.98, 10.103
11
44. The CMA debated the case for netting off the out-performance of the lowest cost suppliers - those with costs below the lower quartile level. That out-performance is represented by area N, which is part of the original producer surplus A. The CMA notes that to net off this element would reduce the average cost inefficiency from about £420m to about £290m per year.39 In other words, E – N = £290m per year where E = £420m, hence out-performance N would average about £420m - £290m = £130m per year. So producer surplus excluding the out-performance is area A-N = £303m – £130m = £173m per year.
45. As Fig 3 is drawn, area E with average annual value £420m is smaller than area A-N with average annual value £303m - £130m = £173m. How to reconcile the graph with the CMA’s calculations? The most likely explanation, consistent with the argument above, is that the market price is indeed below the intersection of the demand and supply curves D and S – that is, below the competitive level. 40
46. The CMA added its calculations of excess profit and inefficient cost to form its indirect approach estimate of the price detriment to domestic customers over the 2007-2014 period. This amounted to an average of £303m (excessive profit) + £420m (inefficient cost) = £721m per year over the period 2007- 2014. The CMA indicated that, if it had used its second calculation of cost inefficiency, which netted off out-performance, the price detriment would have averaged £303m + (£420m - £130m) = £593m per year. Suppliers argued for netting off, the CMA preferred not to. More on this shortly.
A puzzle and its solution: what did the CMA actually calculate?
47. The CMA’s indirect approach is thus the sum of two things: a calculation of (allegedly) excess profit that is essentially producer surplus rather than true excess profit, and a
39 CMA (2016a), para 10.100 40 I had a similar problem with my draughtsman as Jacob Viner did. In this case, my draughtsman (my son Richard) explained that, despite many attempts, he was unable to meet my request to make area A-N smaller than area E. After exploring various possibilities, I realized that this was inevitable if the supply curve S cuts the vertical axis below the point Clq. However, if the market price were lower than Pc, this would reduce area A-N, and for a sufficiently low market price, area A-N would be smaller than area E.

12
calculation of economic inefficiency. This is said to give a measure of customer detriment as a result of market power. As far as I know, neither the CMA nor its predecessors nor any other competition authority has ever used a calculation of this kind. So this is a puzzle: Can the CMA’s approach be related to conventional economic analysis? What is the CMA doing?
48. I now suggest that, by adding one additional line to the diagram, the CMA’s unfamiliar approach suddenly becomes familiar.
49. Consider Figure 4, which is Fig 3 with the addition of a postulated new industry cost/supply curve S’. This corresponds to the original cost/supply curve S shifted down and to the right. It is shifted by the difference between the original cost at the margin and the lower quartile cost, so that it cuts the (vertical) demand curve D at level Clq.
50. Now all becomes familiar. The calculation that the CMA carried out, using its second (net) definition of inefficient cost, is analogous to calculating the savings to customers from a downward shift in the supply curve, from S to S’, in a competitive market.41 The competitive market price falls from Pc to Clq. The saving to customers is (Pc – Clq) x Qc. This is given by (A-N)+E = £173m + £420m = £593m. The first part of this saving (area A-N = £173m) comes from the previous producer surplus, and the rest (area E = £420m) comes from that part of the reduction in cost that is passed on to customers in a competitive market.
51. The new diagram enables us to clarify the disputed question whether the CMA should have netted off the out-performance in costs. The answer is that, if the CMA is seeking to estimate the benefits to customers from the more efficient and lower supply curve in a competitive market, then customers would have received the producer surplus above the level Clq (area A-N) plus the assumed cost reduction E, total (A-N)+E = (303-130)+420 = £593m. This happens to be the same as the CMA’s second (net) calculation A + (E-N). In this sense, out-performance N should indeed have been subtracted from cost reduction E, and the average saving (or detriment) to customers should have been the lower value of £593m per year rather than £721m per year.
41 The only difference between the CMA’s approach and the one suggested here is that the CMA in effect assumes that the new supply curve S’ becomes horizontal at level Clq rather than shifts downwards roughly in parallel to S.

13
The CMA’s direct approach
52. Recall that the CMA’s direct approach involved “comparing the average prices charged by the Six Large Energy Firms with a competitive benchmark price which is based on the prices charged by the most competitive suppliers.”42 Thus, the direct approach, too, like the indirect approach, can be interpreted as a calculation of what the savings to customers would be if the six large suppliers were more efficient, in a competitive market. In this case the benchmark was a cost as low as that of two mid-size suppliers, or of the lowest cost supplier.
53. This is illustrated in Fig 5. Let Cms denote the cost represented by these mid-size suppliers, where Cms is less than Clq. Consistent with the CMA’s assumptions, Cms is taken as the lowest point of the industry supply curve.43 Then we may think of the direct approach as corresponding to another hypothetical supply curve S’’, lying below the hypothetical curve S’, and intersecting the demand curve at level Cms. This gives a higher value of savings to customers, namely area (Pc- Cms) x Qc.44
The CMA’s approaches were about efficiency, not about market power
54. What this all means is that the CMA’s direct and indirect approaches are not really estimates of the customer detriment from market power, in the conventional sense of excess profits from prices set above the competitive level given costs then obtaining in the industry. Instead, they are estimates of the customer detriment from (alleged) supplier inefficiency which is claimed to be the way in which market power is excercised. The direct approach used the costs of two mid-size suppliers as the benchmark, while the indirect approach used the lower quartile cost of the six large suppliers. In reality, the calculations are not evidence of the existence of market power, nor a quantification of its extent. On the contrary, they estimate how a hypothetical industry cost reduction would feed through to customers in a competitive market. They measure the effect of a downward shift in the industry supply curve, not the extent to which price is above the existing supply curve.
55. With the above insight, we can look again at the CMA report and find some confirmation of the interpretation set out here. For example, the CMA says “there is a material degree of inefficiency in current prices … ie, if prices were to decline to the competitive level, the Six Large Energy Firms would need to reduce their cost bases substantially in order to make profits in line with their cost of capital.”45 In other words, the CMA does not define “the competitive level” of prices in the conventional way, in relation to the actual costs of suppliers in the market. Instead, it defines it in relation to the reduced costs that would obtain in a hypothetically more efficient world with a lower supply curve.
42 CMA (2016a) para 10.5 43 As with most of the CMA’s assumptions, this was heavily disputed. Oxera (2016) presented calculations showing that, with appropriate adjustments to take account of non-comparable conditions, the costs of the mid-tier suppliers were actually higher than those of the larger suppliers. 44 The CMA calculated this area to be £1.7bn per year on average, but note that this only covers the period 2012 – 2015 so is not directly comparable with the period 2007-2014 in the indirect approach calculation. 45 CMA (2016a), para 10.114 and fn 27

14
56. Similarly, the CMA says, “A large part of the detriment we have observed in the form of high prices is likely due to inefficiency rather than excess profits, such that if we were to eliminate the entirety of the detriment we have observed through a price cap it would create substantial losses for the sector as a whole.”46 In other words, the CMA is not claiming that the six large suppliers are overcharging in relation to their present costs. The CMA’s argument is that their costs should be lower.
Understanding or misunderstanding?
57. In simple terms, Ofgem asked the CMA: are domestic energy prices excessive? The CMA replied, unambiguously, Yes. It explained that this was because weak customer response gives suppliers unilateral market power which they exploit via price discrimination and higher prices. And the CMA quantified this detriment: “domestic energy customers are, on average, paying higher prices than they would do in well-functioning markets”, by amounts that were of the order of £1bn per year in recent years, and were up to £2bn in 2015.
58. What the CMA is generally taken to mean is that domestic energy prices have been £1bn to £2bn per year higher than if suppliers did not have market power – because they are making excess profits based on prices above “the competitive level”.
59. On closer reading, the CMA’s argument was quite different. It calculated that domestic energy prices have been £1bn to £2bn per year higher than if the larger suppliers were more efficient (and the CMA blamed their inefficiency on their market power).
60. The nature and detail of these calculations were heavily challenged, but their accuracy or reasonableness are not the issue here. The point is that the CMA’s findings do not mean what they are generally taken to mean – nor, indeed, what the CMA itself took them to mean. As noted, the CMA indeed conceded that “a large part of the detriment we have observed in the form of high prices is likely due to inefficiency rather than excess profits”. In fact, the CMA did not establish that any of the detriment was due to excess profits in the conventional sense.
Do the CMA’s conclusions still hold?
61. We examine shortly the CMA’s argument about efficiency. But the above finding means that some of the CMA’s key conclusions seem to fall to the ground. Even if some of the large suppliers are less efficient than they should or could be, the CMA has not shown that large suppliers have unilateral market power, nor that they have exercised this market power by setting prices above the competitive level, given what their costs actually are.
62. On the contrary, evidence on profitability suggests that the domestic retail energy market has been rather competitive. Over the last eight years the least efficient of the six large suppliers have not made profits to cover their cost of capital. There has been significant new entry, but for the most part the new entrants are not yet making profits. Domestic energy prices have if anything been below, rather than above, “the competitive level”, again given the actual costs obtaining in the market.
46 CMA (2016a), para 11.90
15
63. The CMA also held that suppliers exploited their market power via price discrimination. Some suppliers argued that price discrimination was a means of competing rather than an exploitation of market power. The CMA rejected this argument on the basis that “the price discrimination we have observed is not the result of a well-functioning market. In particular, on average, customers have been paying prices that are above the competitive level.”47
64. This response no longer carries weight. The CMA has not shown that customers have been paying prices above the competitive level, as normally understood (i.e. given the cost curves actually obtaining). Price discrimination has been a means of trying to compete given the existence of overhead costs, rather than a means of exploiting disengaged customers. Indeed, insofar as prices have not been above the competitive level, less engaged customers as well as more engaged customers have thereby been protected by competition.
65. This in turn calls into question the CMA’s finding that there has been “weak customer response” and that this has had an adverse effect on competition. If price discrimination has been a means of competing and there have not been true excess profits, and prices have if anything been below the competitive level, in what sense has customer response been weak and in what sense has it had an adverse effect on competition?
What about efficiency?
66. What about the CMA’s argument that weak customer response had an adverse effect on competition because there was less pressure on suppliers to be efficient than if customer response was stronger? This argument faces several difficulties.
67. First, how is it that customer response was so weak that suppliers were not under pressure to be efficient, yet sufficiently strong that suppliers could not set prices above the competitive level?
68. Second, why is weak customer response singled out as the sole determinant of supplier efficiency when a multitude of other factors – organisational, institutional, regulatory, historical, personal etc - would all seem potentially relevant? For example, Ofgem’s initial regulatory interventions (the non-discrimination condition and restrictions on direct marketing) reduced the customer switching rate by half, and the CMA found that Ofgem’s later regulatory interventions (simple tariffs) constitute an Adverse Effect on Competition. And EdF’s ownership seems to have impacted significantly on its costs and pricing. Should customer response bear the responsibility for all these factors?
69. Third, does it not seem rather arbitrary to define customer detriment as the difference between the costs of the highest and lower quartile or lowest cost supplier, at a particular point in time? Surely, in a real competitive market, there will always be differences in costs between suppliers: why should this be regarded as a customer detriment?
70. Fourth, why has the capital market not functioned to discipline efficiency, regardless of the strength of customer response?
71. To explain this latter point, with the exception of EdF the major suppliers are fully privatised companies. They are not generally regarded as uninterested in making a profit.
47 CMA (2016a), para 9.330

16
The Industrial and Commercial (I&C) sector in which they operate was regarded as so competitive as not to need CMA investigation, and the CMA found their wholesale activities to be competitive. Yet in the domestic retail market, one of these companies incurred consistent losses of tens of millions of pounds per year, over a period of eight years (even apart from EdF making a loss averaging £100m per year), and two other companies ran at a minimal profit that may or may not have covered their cost of capital.
72. Why do companies accept losses or minimal profits if efficiency savings of £1bn to £2bn per year are available? Why is it that managements have not simply reduced costs? Why have shareholders not replaced these apparently incompetent managements? How is it that the CMA has been able to identify these obvious inefficiencies when the managements and shareholders that must be under the greatest financial pressure have evidently failed to do so?
73. The answer is surely that, in practice, it is more difficult to identify and implement efficiency improvements than it may seem. The presently lower costs of some larger suppliers are not necessarily readily identifiable and transferable to the other suppliers. We do not yet know whether the apparently lower costs of some mid-size suppliers - if indeed they are lower, given that most are new and do not yet make a profit – will survive the arrival of different patterns of wholesale costs and the growth of these suppliers to a larger company size. If efficiency savings of £1bn to £2bn are available and would be seized, if only customers were more engaged, surely suppliers making losses would have seized them already, rather than waited for more engaged customers to prompt them?
Improving efficiency
74. After observing that “a large part of the detriment we have observed in the form of high prices is likely due to inefficiency rather than excess profits”, the CMA continued, “we believe the best, most sustainable approach to reducing this detriment in the long term is through fully competitive markets, in which more efficient suppliers gradually replace less efficient suppliers.”48
75. The proposition that in competitive markets more efficient suppliers gradually replace less efficient suppliers is precisely right: this is what has been happening in the domestic retail energy market ever since it opened. But note the CMA’s word “gradually”: this is not something that happens overnight. Moreover, competition as a rivalrous discovery process never ends: in all competitive markets, there is always scope at any time for more efficient suppliers to replace less efficient suppliers. It is therefore difficult to claim that, at some point in time, the existence of such differences in efficiency should be construed as a detriment to customers, rather than as a fact of competitive life. The CMA adduces no evidence that efficiency differences were any greater in the domestic energy sector than elsewhere.
76. Would or could this process whereby more efficient suppliers replace less efficient suppliers happen faster if customers were more engaged and more willing to change suppliers? Perhaps. But customers are already sufficiently engaged that prices are at or below “the competitive level” based on present costs. Moreover, as the CMA discovered,
48 CMA (2016a), para 252

17
many customers regard more engagement as costly or tedious, so there is a balance to be struck between reducing one kind of cost and increasing another. Furthermore, an increase in the proportion of engaged consumers may have adverse consequences for the less engaged consumers, insofar as suppliers may need to spread overhead costs over fewer such customers.
77. Could a more tenable claim have been advanced that more active customer engagement would put more pressure on larger suppliers to be more efficient, which in turn would reduce prices? It would have been a more nuanced and qualified argument than the CMA provided. It would have affirmed that the present market actually is competitive, given present costs. It would have been more circumspect about the possible scope for efficiency improvements and the possible impact of greater customer engagement. And it would not have been associated with claims about excess prices and profits and price discrimination, and purported detriments to customers of the order of £1bn to £2bn per year.
Some present issues concerning prices and price discrimination
78. What does the CMA report mean for present policy issues? There must be a concern that its emphasis on excessive prices and profits, price discrimination, and customer detriments in the billions of pounds will adversely affect public understanding and public policy. Consider two examples.
79. The Secretary of State has referred to the CMA’s calculated “£1.4bn annually of detriment to customers, which is clearly a huge amount of money, and therefore requires a response as to how that can be brought down”.49 In contrast, most of the large suppliers have since announced price increases, citing cost increases. Price increases are problematic at any time. But the CMA’s conclusion that these suppliers are pricing £1bn to £2bn above the competitive level has encouraged the media, the public and government to challenge the suppliers more explicitly.
80. Ofgem has said that it doesn’t see any case for significant price increases where suppliers have bought energy well in advance. BIES initially said that the first price increase was a concern, and has now said that such increases are “completely unacceptable”.50 In his minority opinion to the CMA Report, Professor Cave had argued that the detriment found by the CMA was so great that there needed to be a price cap on all Standard Variable Tariffs (SVTs). Another proposal is for a 6% limit on the difference between the prices of fixed and variable tariffs.51 The Labour shadow chancellor has proposed to impose a price cap and there is now a report that the Government, too, is contemplating this.52
49 House of Lords Economic Affairs Committee, Investigation into the Economics of UK Energy Policy, oral hearing, 10 January 2017. 50 “The British Gas price freeze [until August] is good news for 5 million households but it is completely unacceptable for other suppliers to increase their prices significantly when Ofgem has said there is no case for doing so”. (Energy firms face ministers’ wrath over sharp price rises, The Times, February 11 2017, p 4) 51 Energy bills cap to protect loyal customers, The Times, 14 February 2017. “The Government source said that all options were on the table, including a relative price cap …” 52 “Furious ministers are ready to take the ‘nuclear option’ of introducing a regulated standard energy price to end the Big Six rip-off. … A Whitehall source told the Sun last night: ‘Ministers are poised to do something quite radical. They have given the industry a chance to change their behavior – and they haven’t taken it.’”

18
81. The argument in this paper is that the CMA’s conclusion on excessive prices was not warranted by the evidence. Over the last eight years or so retail energy prices have not exceeded “the competitive level”. So there is no justification for asking large suppliers to “change their behaviour” with respect to the general level of prices, or for that matter with respect to the structure of charges or type of tariff.
82. The CMA explained clearly the disadvantages of a price cap.53 But by claiming that large customer detriments related to “prices in excess of the competitive level”, the CMA bears a significant responsibility for any such introduction of price caps.
83. A second example of ongoing policy debate followed the CMA’s finding that Ofgem’s simple tariffs policy had limited competition and should be abandoned. Five large suppliers then offered lower priced tariffs to new customers that were not available to their existing customers. The Secretary of State commented that “In response to widespread public outrage at that practice, correctly in my view, all of them have now been withdrawn”.54
84. But why “correctly”? How was the withdrawal of these new tariffs in the interests of customers or a more competitive market? All but one of the new offers were available to all customers in the country (and for customers of the smaller suppliers, all of the new offers were available). The offers made all customers actually or potentially better off. By the same token, the withdrawal of these offers made all customers actually or potentially worse off, and no customers better off.
85. The new tariffs were yet another example of innovative differential pricing, freed from regulatory restraints, increasing the effectiveness of competition. The parties to gain by discouraging it were the suppliers themselves, especially the smaller ones, who now faced less competition. Again, the CMA bears a responsibility for claiming that price discrimination was a means by which the large suppliers had exploited their market power, rather than explaining how it was a means of competing.
What of a future CMA investigation?
86. Suppose, hypothetically, that there is no new price cap; that customer engagement and switching begin to increase; that suppliers become more efficient; and that competition ensures that these benefits are passed to customers. But suppose also that other energy costs continue to increase; that there is continuing public concern about rising energy prices; and there are continuing allegations that the major suppliers are making excess profits at the expense of customers. If the CMA were again asked to investigate the domestic retail energy market, what would it find and how would it analyse the market?
87. Although customer engagement and switching may increase, there is no reason to suppose that all customers will engage to the same extent. Some customers will still be
Ministers tell Big Six energy companies to sort out charges or face price cap in bid to fix UK’s broken energy market, The Sun, 10 February 2017 53 “11.86 The majority of us concluded that the disadvantages of attempting to address the detriment of all SVT customers through a price cap would exceed the benefits, believing that attempting to control outcomes for the substantial majority of customers would – even during a transitional period – undermine the competitive process, potentially resulting in worse outcomes for customers in the long run. This risk might occur through a combination of reducing the incentives of customers to engage, reducing the incentives of suppliers to compete, and an increase in regulatory risk.” CMA (2016) 54 Oral hearing, House of Lords Economic Affairs Committee, Investigation into the Economics of UK Energy Policy, 10 January 2017.

19
willing to search out lower cost offers and others willing to accept higher priced SVTs (or equivalent), so there will still be price differentials in the market. Although suppliers’ total fixed costs may be lower, the price differentials might be greater than now insofar as they are spread over fewer SVT customers.55 Suppliers’ market shares will have changed, and some of the names may have changed, but it seems implausible that all suppliers will be equally efficient. If EdF, for example, can and does significantly reduce its supply business costs, surely all larger suppliers will manage to reduce their own costs, and smaller suppliers and other new entrants will be doing the same. So there will still be significant cost differentials in the market.
88. In other words, the specific numbers in the calculations will have changed but the same qualitative features will obtain. If the CMA adopts the same analytic approach as it did before, it cannot but conclude that, despite the previous remedies and despite the reductions in costs and in prices to customers, the domestic retail energy sector is still characterised by weak customer response, unilateral market power, price discrimination and pricing above efficient cost. Will the CMA or others not be tempted to deduce from this second same conclusion that retail competition has all been a mistake, and to agree with those who argue that regulated prices or even renationalisation would be better? After all, such policies could eliminate uncomfortable price and cost differentials and thereby eliminate the CMA’s perceived customer detriments … even though they could reduce incentives to efficiency so that customers would be paying more.
Conclusion
89. Problems are now arising because the CMA report on the retail energy market failed to distinguish sufficiently clearly, both in the presentation of its findings and in its own mind, between two elementary economic concepts: the level of price in relation to an existing cost curve, and the possibility of a shift in that cost curve.
90. In conventional economic analysis, and in ordinary speech, the CMA’s findings of unilateral market power, excessive prices and price discrimination depend critically upon price being above “the competitive level”, defined with respect to actual costs. When people hear references to customer detriments of £1bn to £2bn per year, they naturally assume this is what is meant. Hence the demands for policy to Do Something about this exploitation of customers, to reduce the level of prices and/or prevent “unfair” price differentials.
91. But evidence suggests that average price has not been above “the competitive level” over the last eight years, and may indeed have been below it. Criticisms of market power, excessive prices and price discrimination are not warranted, nor are policies intended to correct them.
92. The CMA’s calculations of customer detriment are instead based on a quite different concept: that the large suppliers have market power and have chosen to exercise it by being inefficient. The CMA claims in effect that, in a well-functioning market, the industry supply curve would have shifted downwards to the right, and the resulting prices to customers would be lower by an average of £1bn to £2bn per year.
55 Cf. CCP (2016) and Littlechild et al (2017), para 46.

20
93. The CMA’s acknowledgement of its analysis is worth repeating: “A large part of the detriment we have observed in the form of high prices is likely due to inefficiency rather than excess profits, such that if we were to eliminate the entirety of the detriment we have observed through a price cap it would create substantial losses for the sector as a whole.”56 Hence the CMA’s preference for remedies to increase competition, rather than extensive price caps which the majority considered would be counter-productive.
94. The CMA’s inefficiency argument does, however, pose some difficult questions. Since there will be a range of costs and efficiencies in all competitive industries, why has the retail energy sector been singled out for blame, with no attempt to show that the range of costs and efficiencies is greater in the retail energy sector than in other sectors? Why has responsibility for alleged inefficiency been attributed to weak customer response, with no attempt to assess whether customer response is significantly different in this sector compared to others? Why is responsibility attributed to weak customer response alone, with no reference to (e.g.) regulatory interventions that the CMA itself found had had an adverse effect on competition, or to public ownership of the least efficient large supplier in the sector? Why is there no discussion of the apparent failure of the capital market to realise that such alleged inefficiencies could be translated into profits?
95. These and other questions will be for the CMA as an organisation to ponder if it is going to continue to compare actual companies against hypothetical companies operating at “the efficient level” – and, more generally, against a benchmark well-functioning market that can be moreorless anything that a CMA panel would like it to be. Of more immediate concern is that the ambiguity in the CMA’s energy market report has stimulated proposals for further government and regulatory interventions that are not justified by the report, and would be inconsistent with the CMA’s wish to increase competition as a means of increasing efficiency.
References
Baldwin, Robert and Cave, Martin (1999), Understanding Regulation: Theory, Strategy and Practice, Oxford: Oxford University Press.
Baumol, W J (2006), Regulation misled by misread theory, Perfect competition and competition-imposed price discrimination, 2005 Distinguished Lecture, AEI-Brookings Joint Center for Regulatory Studies, Washington DC, 17 March.
Centre for Competition Policy (CCP) (2016), Consultation response to House of Lords Economic Affairs Committee, Investigation into the economics of UK energy policy, 10 September.
Competition and Markets Authority (CMA) (2015a), Energy Market Investigation, Profitability of retail energy supply, profit margin analysis, 16 March.
CMA (2015b), Energy Market Investigation, Provisional Findings 10 July.
CMA (2016a), Energy Market Investigation, Final Report, 24 June.
56 CMA (2016a), para 11.90

21
CMA (2016b), Energy Market Investigation, Final Report, Appendix 8.3, The pricing strategies of the Six Large Energy Firms, 24 June.
CMA (2016c) Energy Market Investigation, Final Report, Appendix 9.11 Assessment of Indirect Costs, 24 June.
Corts, K (1998), “Third Degree Price Discrimination in Oligopoly: All-Out Competition and Strategic Commitment”, Rand Journal of Economics, 29 (2), Summer: 306-323.
Friend, M (2016), “The unexplained mysteries of the energy market investigation”, Competition Policy International, December.
Institute for Public Policy and Research (IPPR) (2012), The true cost of energy, April.
Lind, R and Walker, M (2003), “The (mis)use of profitability analysis in competition law cases”, CRA [Charles Rivers Associates] Competition Policy Discussion Papers 9, December.
Littlechild, S (2015a), Operating Cost Variations in a Competitive Market, 20 March [misdated February], published on CMA website 24 March 2015 under Initial Submissions.
Littlechild, S (2015b), “The CMA energy market investigation, the well-functioning market, Ofgem, Government and behavioural economics”, European Competition Journal, 11(2-3): 574-636
Littlechild, S, McCarthy, Sir C, Marshall, M, Smith, S, and Spottiswoode, C (2017), Submission to the House of Lords Economic Affairs Committee, Investigation into the Economics of UK Energy Policy, 20 January.
Ofgem (2008), Energy Supply Probe, Initial Findings Report, ref 140/08, 6 October.
Ofgem (2016), Retail Energy Markets in 2016, 3 August.
Ofgem, OFT and CMA (2014), State of the Market Assessment, 27 March.
Oxera (2016), Critique of CMA direct benchmarking analysis, A note for Scottish Power based on a non-confidential submission to the CMA, 12 April, attached to Scottish Power response to CMA provisional decision on remedies, 22 April.
RWE (2015), RWE response to CMA provisional findings, 7 September.
RWE (2016), RWE response to CMA provisional decision on remedies, 21 April.
Shaffer, G. and Zhang, Z J (2000), “Pay to Switch or Pay to Stay: Preference-Based Price Discrimination in Markets with Switching Costs”, Journal of Economics and Management Strategy, 9 (3), Fall: 397-424.
Vickers, J (1998), “When is discrimination undue?” in M E Beesley (ed), Regulating Utilities: Understanding the Issues, IEA Readings 48.
Vickers, Sir J (2009), Assessing undue discrimination, Response to Ofgem Consultation, 1 May.