5. cma’s selection process & identification of new...
TRANSCRIPT

Final Report STUDY ON COUNTER MAGNET AREAS TO DELHI & NCR
URBAN & REGIONAL PLANNING 1 of 30 C:\Documents and Settings\singh\Desktop\Final report_CMA\Chapter 5.doc
5. CMA’s Selection Process & identification of new CMA’s
5.1 Identification of possible contenders for Counter Magnet Areas
The consultants have analyzed in-migration to the National Capital Territory of Delhi (NCTD) from all the 593 districts in India as per Census of India, 2001. The total in-migration during the last decade i.e. 1991-2001 to the NCTD is 2172760, highest migration i.e. 64373 from district Bulandshahr in Uttar Pradesh and lowest migration i.e. 2 migrants from district Kolasib in Mizoram, the average migration per district being 3664 persons. There are two districts of India not sending any migrant to Delhi namely South Garo hills of Meghalya and Diu of Daman & Diu UT. The top 100 districts account for 1616562 (74.40%) of total in-migration to NCTD. The selection of counter magnet areas is majorly an exercise related to checking and diverting in-migration, which is coming to Delhi; thus the headquarters of the top 100 districts which are the areas of major out-migration to the extent of about 74 percent, are considered as the appropriate contenders for establishment of counter magnet Areas. The 100 districts are located in fifteen different states. Refer Table 5.1
Table 5.1: State wise list of top 100 districts sending maximum migrants to NCTD (74% of total migrants)
Sl. No. State Districts Total migration to Delhi (1991-2001) 1 Aligarh 50068 2 Azamgarh 33381 3 Agra 28970 4 Allahabad 18015 5 Bareilly 17180 6 Bijnor 19217 7 Budaun 25412 8 Bulandshahr 64373 9 Baghpat 18846 10 Ballia 13175 11 Basti 16241 12 Deoria 9805 13 Etah 36477 14 Etawah 22177 15 Faizabad 18135 16 Farrukhabad 15046 17 Firozabad 8699 18 Gautam Buddha Nagar 8020 19 Ghazipur 8690 20 Ghaziabad 37418 21 Gonda 15187 22 Gorakhpur 30961 23 Hardoi 10803 24 Jaunpur 15031 25 Jhansi 6631 26 Kanpur Nagar 24314 27 Lucknow 14545 28 Mahoba 5880 29
Uttar Pradesh (41 districts)
Mainpuri 13836

Final Report STUDY ON COUNTER MAGNET AREAS TO DELHI & NCR
URBAN & REGIONAL PLANNING 2 of 30 C:\Documents and Settings\singh\Desktop\Final report_CMA\Chapter 5.doc
Sl. No. State Districts Total migration to Delhi (1991-2001) 30 Mathura 18131 31 Meerut 44274 32 Moradabad 21362 33 Muzaffarnagar 25180 34 Pratapgarh 15858 35 Rae Bareli 12800 36 Rampur 5840 37 Saharanpur 8993 38 Shahjahanpur 6763 39 Sultanpur 21290 40 Unnao 8207 41
Varanasi 9820 42 Alwar 16907 43 Bharatpur 7402 44 Dausa 6176 45
Rajasthan (4 districts)
Jaipur 13885 46 Bhiwani 8016 47 Faridabad 16577 48 Gurgaon 16708 49 Hisar 6894 50 Jhajjar 18859 51 Jind 7573 52 Karnal 5725 53 Mahendragarh 5752 54 Panipat 7085 55 Rewari 7448 56 Rohtak 25797 57
Haryana (12 districts)
Sonipat 28053 58 Almora 23956 59 Dehradun 9764 60 Garhwal 31506 61 Nainital 9795 62
Uttrakhand (5 districts)
Tehri Garhwal 7066 63 Amritsar 9524 64 Gurdaspur 5916 65 Jalandhar 6056 66
Punjab (4 districts)
Ludhiana 7179 67 Begusarai 14972 68 Bhagalpur 17734 69 Bhojpur 11626 70 Darbhanga 38842 71 Gaya 13028 72 Gopalganj 7150 73 Katihar 7479 74 Khagaria 7419 75 Madhubani 42299 76 Munger 9340 77 Muzaffarpur 25930 78 Nalanda 12798 79 Patna 31903 80
Bihar (20 districts)
Purba Champaran 15139

Final Report STUDY ON COUNTER MAGNET AREAS TO DELHI & NCR
URBAN & REGIONAL PLANNING 3 of 30 C:\Documents and Settings\singh\Desktop\Final report_CMA\Chapter 5.doc
Sl. No. State Districts Total migration to Delhi (1991-2001) 81 Purnia 7090 82 Saharsa 9206 83 Samastipur 28533 84 Sitamarhi 19744 85 Siwan 21743 86
Vaishali 11101 87 Chandigarh UT Chandigarh 6700 Other States (13 districts scattered in 8 states) 88 Himachal Pradesh Kangra 9323 89 Chatra 32202 90
Jharkand Ranchi 7140
91 Jammu & Kashmir Srinagar 5845 92 Kerala Kottayam 6022 93 Bhind 6541 94
Madhya Pradesh Chhatarpur 6510
95 Maharashtra Mumbai 11769 96 Tamil Nadu Chennai 7723 97 Kolkata 28477 98 Maldah 5996 99 Medinipur 8168 100
West Bengal
North Twenty Four Parganas 6400 Refer Annexure IV for the 100 districts sending major migration to NCTD in descending order
5.2 Migration to Rest of NCR Districts The constituent areas of rest of NCR are three sub-regions viz (i) Haryana sub-region comprising of Faridabad, Gurgaon, Rohtak, Sonipat, Rewari, Jhajjar, Mewat & Panipat districts; (ii) Rajasthan sub-region comprising of Alwar district; (iii) Uttar Pradesh sub-region comprising of Meerut, Ghaziabad, Gautam Buddha Nagar, Bulandshahr & Baghpat districts. Migration to rest of NCR districts during 1991-2001 is 2548129 persons. Top hundred districts sending major migration to rest of NCR districts provide 2071269 migrants i.e. 81.29 percent of the total migration. Refer table 5.2
Table 5.2: Top 100 districts of major migration to rest of NCR districts (in descending order)
Sl. No. List of Top 100 Districts with
Migration to Delhi State Migration to rest of NCR
% of migration during 1991-2001
1 Bulandshahr * Uttar Pradesh 202061 7.93 2 Alwar * Rajasthan 190262 7.47 3 Ghaziabad * Uttar Pradesh 148804 5.84 4 Meerut * Uttar Pradesh 148801 5.84 5 Sonipat * Haryana 95735 3.76 6 Gurgaon * Haryana 90008 3.53 7 Faridabad * Haryana 85817 3.37 8 Aligarh Uttar Pradesh 73899 2.90 9 Muzaffarnagar Uttar Pradesh 70993 2.79
10 Rohtak * Haryana 67757 2.66 11 Baghpat * Uttar Pradesh 66956 2.63 12 Jhajjar * Haryana 53886 2.11 13 Gautam Buddha Nagar * Uttar Pradesh 42685 1.68 14 Panipat * Haryana 37175 1.46 15 Mathura Uttar Pradesh 36204 1.42 16 Bharatpur Rajasthan 31417 1.23 17 Rewari * Haryana 29214 1.15

Final Report STUDY ON COUNTER MAGNET AREAS TO DELHI & NCR
URBAN & REGIONAL PLANNING 4 of 30 C:\Documents and Settings\singh\Desktop\Final report_CMA\Chapter 5.doc
Sl. No. List of Top 100 Districts with
Migration to Delhi State Migration to rest of NCR
% of migration during 1991-2001
18 Bhiwani Haryana 25324 0.99 19 Jind Haryana 22649 0.89 20 Mahendragarh Haryana 19381 0.76 21 Jaipur Rajasthan 19367 0.76 22 Karnal Haryana 18754 0.74 23 Etah Uttar Pradesh 15052 0.59 24 Moradabad Uttar Pradesh 13500 0.53 25 Agra Uttar Pradesh 13268 0.52 26 Budaun Uttar Pradesh 12819 0.50 27 Patna Bihar 12755 0.50 28 Saharanpur Uttar Pradesh 12269 0.48 29 Siwan Bihar 12266 0.48 30 Hisar Haryana 11740 0.46 31 Gorakhpur Uttar Pradesh 11683 0.46 32 Garhwal Uttrakhand 11295 0.44 33 Bijnor Uttar Pradesh 10643 0.42 34 Kanpur Nagar Uttar Pradesh 10118 0.40 35 Allahabad Uttar Pradesh 9737 0.38 36 Azamgarh Uttar Pradesh 9555 0.37 37 Etawah Uttar Pradesh 8972 0.35 38 Ballia Uttar Pradesh 8939 0.35 39 Dausa Rajasthan 8629 0.34 40 Almora Uttrakhand 8542 0.34 41 Janjgir - Champa Chhattisgarh 8476 0.33 42 Pratapgarh Uttar Pradesh 8387 0.33 43 Kolkata West Bengal 8254 0.32 44 Madhubani Bihar 8180 0.32 45 Bareilly Uttar Pradesh 8108 0.32 46 Sikar Rajasthan 7789 0.31 47 Darbhanga Bihar 7601 0.30 48 Nadia West Bengal 7110 0.28 49 Sultanpur Uttar Pradesh 7025 0.28 50 Lucknow Uttar Pradesh 6982 0.27 51 Samastipur Bihar 6665 0.26 52 Munger Bihar 6575 0.26 53 Nalanda Bihar 6378 0.25 54 Bhagalpur Bihar 6165 0.24 55 Deoria Uttar Pradesh 6162 0.24 56 Chandigarh Chandigarh UT 5897 0.23 57 Hathras Uttar Pradesh 5880 0.23 58 Jhunjhunun Rajasthan 5817 0.23 59 Farrukhabad Uttar Pradesh 5748 0.23 60 Mainpuri Uttar Pradesh 5436 0.21 61 Banda Uttar Pradesh 5314 0.21 62 Faizabad Uttar Pradesh 5258 0.21 63 Gopalganj Bihar 5157 0.20 64 Dehradun Uttrakhand 4883 0.19 65 Hardwar Uttrakhand 4836 0.19 66 Varanasi Uttar Pradesh 4765 0.19 67 Bilaspur Chhattisgarh 4731 0.19 68 Kaithal Haryana 4713 0.18 69 Hardoi Uttar Pradesh 4450 0.17 70 Ghazipur Uttar Pradesh 4450 0.17 71 Raipur Chhattisgarh 4333 0.17 72 Ambala Haryana 4309 0.17

Final Report STUDY ON COUNTER MAGNET AREAS TO DELHI & NCR
URBAN & REGIONAL PLANNING 5 of 30 C:\Documents and Settings\singh\Desktop\Final report_CMA\Chapter 5.doc
Sl. No. List of Top 100 Districts with
Migration to Delhi State Migration to rest of NCR
% of migration during 1991-2001
73 Rae Bareli Uttar Pradesh 4294 0.17 74 Koch Bihar West Bengal 4272 0.17 75 Nainital Uttrakhand 4223 0.17 76 Firozabad Uttar Pradesh 4000 0.16 77 Gaya Bihar 3981 0.16 78 Gonda Uttar Pradesh 3957 0.16 79 Jaunpur Uttar Pradesh 3891 0.15 80 Muzaffarpur Bihar 3813 0.15 81 Amritsar Punjab 3697 0.15 82 Begusarai Bihar 3653 0.14 83 Saran Bihar 3633 0.14 84 Purba Champaran Bihar 3604 0.14 85 Mumbai Maharashtra 3563 0.14 86 Chhatarpur Madhya Pradesh 3524 0.14 87 Unnao Uttar Pradesh 3481 0.14 88 Ludhiana Punjab 3479 0.14 89 Kurukshetra Haryana 3370 0.13 90 Rampur Uttar Pradesh 3217 0.13 91 Jyotiba Phule Nagar Uttar Pradesh 3066 0.12 92 Buxar Bihar 2979 0.12 93 Basti Uttar Pradesh 2937 0.12 94 Ajmer Rajasthan 2902 0.11 95 Jhansi Uttar Pradesh 2887 0.11 96 Unspecified District Rajasthan 2874 0.11 97 Bhojpur Bihar 2872 0.11 98 Shahjahanpur Uttar Pradesh 2798 0.11 99 Uttar Dinajpur West Bengal 2796 0.11
100 Sitamarhi Bihar 2741 0.11 Migration from top 20 districts (1-20) 1539028 60.40 Migration from next 20 districts (21-40) 239903 9.41 Migration from next 20 districts (41-60) 138635 5.44 Migration from Next 20 districts (61-80) 89630 3.52 Migration from Next 20 districts (81-100) 64073 2.51 Total migration from Top 100 districts 2071269 81.29 Migration from other districts 476860 18.71 Total migration to rest of NCR 2548129 100.00 * Districts located within NCR
Refer Annexure V for list of top 119 districts sending migrants to Delhi & rest of NCR in descending order of total migration to NCR It is also observed that top hundred districts sending migrants to Delhi and rest of NCR districts are mostly common i.e. 81 out of 100 districts are the same. These 81 common districts comprise 34,36,058 total migrants to rest of NCR districts plus NCTD which is 72.78% of total migrants. Remaining districts comprises 12,84,831 migrants (27.22 %). Refer Table 5.3 Table 5.3: Migration pattern to Delhi & Rest of NCR Districts
Migration to
Delhi (A) Migration to rest of NCR
districts (B) Total (A+B) Migration from 81 common districts 14,53,989 19,82,069 34,36,058 Percentage of total migration 66.92 77.79 72.78 Migration from other districts of India 7,18,771 5,66,060 12,84,831 Percentage of total migration 33.08 22.21 27.22 Total migration 21,72,760 25,48,129 47,20,889

Final Report STUDY ON COUNTER MAGNET AREAS TO DELHI & NCR
URBAN & REGIONAL PLANNING 6 of 30 C:\Documents and Settings\singh\Desktop\Final report_CMA\Chapter 5.doc
Table 5.4: List of top 119 districts including 81 common districts sending major migrants to NCTD and rest of NCR
Sl. No.
Top 100 Districts Sending Maximum Migration to Delhi State
Migration to Delhi (A)
Migration to rest of NCR Districts (B)
Total (A+B)
I List of 81 common districts sending migration to Delhi & rest of NCR 1 Bulandshahr * Uttar Pradesh 64373 202061 266434 2 Aligarh Uttar Pradesh 50068 73899 123967
3 Meerut * Uttar Pradesh 44274 148801 193075
4 Madhubani Bihar 42299 8180 50479
5 Darbhanga Bihar 38842 7601 46443
6 Ghaziabad * Uttar Pradesh 37418 148804 186222
7 Etah Uttar Pradesh 36477 15052 51529
8 Azamgarh Uttar Pradesh 33381 9555 42936
9 Patna Bihar 31903 12755 44658
10 Garhwal Uttrakhand 31506 11295 42801
11 Gorakhpur Uttar Pradesh 30961 11683 42644
12 Agra Uttar Pradesh 28970 13268 42238
13 Samastipur Bihar 28533 6665 35198
14 Kolkata West Bengal 28477 8254 36731
15 Sonipat * Haryana 28053 95735 123788
16 Muzaffarpur Bihar 25930 3813 29743 17 Rohtak * Haryana 25797 67757 93554 18 Budaun Uttar Pradesh 25412 12819 38231 19 Muzaffarnagar Uttar Pradesh 25180 70993 96173 20 Kanpur Nagar Uttar Pradesh 24314 10118 34432 21 Almora Uttrakhand 23956 8542 32498 22 Etawah Uttar Pradesh 22177 8972 31149 23 Siwan Bihar 21743 12266 34009 24 Moradabad Uttar Pradesh 21362 13500 34862 25 Sultanpur Uttar Pradesh 21290 7025 28315 26 Sitamarhi Bihar 19744 2741 22485 27 Bijnor Uttar Pradesh 19217 10643 29860 28 Jhajjar * Haryana 18859 53886 72745 29 Baghpat * Uttar Pradesh 18846 66956 85802 30 Faizabad Uttar Pradesh 18135 5258 23393 31 Mathura Uttar Pradesh 18131 36204 54335 32 Allahabad Uttar Pradesh 18015 9737 27752 33 Bhagalpur Bihar 17734 6165 23899 34 Bareilly Uttar Pradesh 17180 8108 25288 35 Alwar * Rajasthan 16907 190262 207169 36 Gurgaon * Haryana 16708 90008 106716 37 Faridabad * Haryana 16577 85817 102394

Final Report STUDY ON COUNTER MAGNET AREAS TO DELHI & NCR
URBAN & REGIONAL PLANNING 7 of 30 C:\Documents and Settings\singh\Desktop\Final report_CMA\Chapter 5.doc
Sl. No.
Top 100 Districts Sending Maximum Migration to Delhi State
Migration to Delhi (A)
Migration to rest of NCR Districts (B)
Total (A+B)
38 Basti Uttar Pradesh 16241 2937 19178 39 Pratapgarh Uttar Pradesh 15858 8387 24245 40 Gonda Uttar Pradesh 15187 3957 19144 41 Purba Champaran Bihar 15139 3604 18743 42 Farrukhabad Uttar Pradesh 15046 5748 20794 43 Jaunpur Uttar Pradesh 15031 3891 18922 44 Begusarai Bihar 14972 3653 18625 45 Lucknow Uttar Pradesh 14545 6982 21527 46 Jaipur Rajasthan 13885 19367 33252 47 Mainpuri Uttar Pradesh 13836 5436 19272 48 Ballia Uttar Pradesh 13175 8939 22114 49 Gaya Bihar 13028 3981 17009 50 Rae Bareli Uttar Pradesh 12800 4294 17094 51 Nalanda Bihar 12798 6378 19176 52 Mumbai Maharashtra 11769 3563 15332 53 Bhojpur Bihar 11626 2872 14498 54 Hardoi Uttar Pradesh 10803 4450 15253 55 Varanasi Uttar Pradesh 9820 4765 14585 56 Deoria Uttar Pradesh 9805 6162 15967 57 Nainital Uttrakhand 9795 4223 14018 58 Dehradun Uttrakhand 9764 4883 14647 59 Amritsar Punjab 9524 3697 13221 60 Munger Bihar 9340 6575 15915 61 Saharanpur Uttar Pradesh 8993 12269 21262 62 Firozabad Uttar Pradesh 8699 4000 12699 63 Ghazipur Uttar Pradesh 8690 4450 13140 64 Unnao Uttar Pradesh 8207 3481 11688 65 Gautam Buddha Nagar * Uttar Pradesh 8020 42685 50705 66 Bhiwani Haryana 8016 25324 33340 67 Jind Haryana 7573 22649 30222 68 Rewari * Haryana 7448 29214 36662 69 Bharatpur Rajasthan 7402 31417 38819 70 Ludhiana Punjab 7179 3479 10658 71 Gopalganj Bihar 7150 5157 12307 72 Panipat * Haryana 7085 37175 44260 73 Hisar Haryana 6894 11740 18634 74 Shahjahanpur Uttar Pradesh 6763 2798 9561 75 Chandigarh Chandigarh UT 6700 5897 12597 76 Jhansi Uttar Pradesh 6631 2887 9518 77 Chhatarpur Madhya Pradesh 6510 3524 10034
Final Report STUDY ON COUNTER MAGNET AREAS TO DELHI & NCR
URBAN & REGIONAL PLANNING 8 of 30 C:\Documents and Settings\singh\Desktop\Final report_CMA\Chapter 5.doc
Sl. No.
Top 100 Districts Sending Maximum Migration to Delhi State
Migration to Delhi (A)
Migration to rest of NCR Districts (B)
Total (A+B)
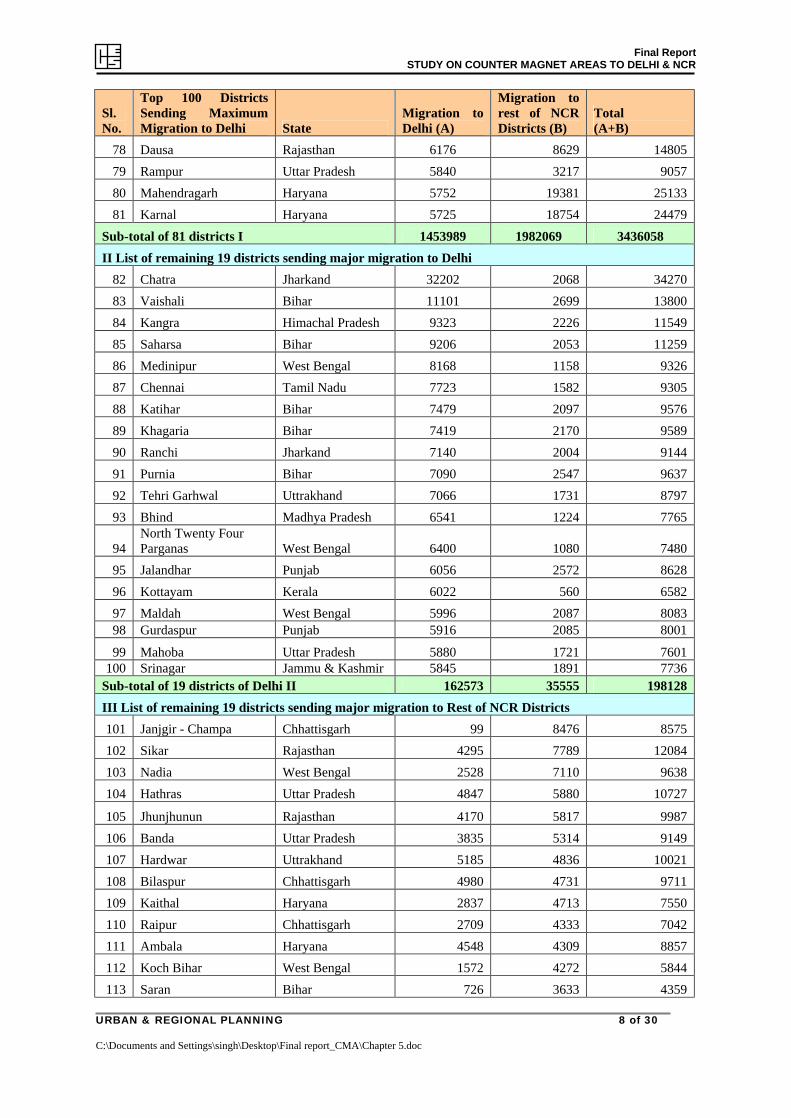
78 Dausa Rajasthan 6176 8629 14805 79 Rampur Uttar Pradesh 5840 3217 9057 80 Mahendragarh Haryana 5752 19381 25133 81 Karnal Haryana 5725 18754 24479
Sub-total of 81 districts I 1453989 1982069 3436058 II List of remaining 19 districts sending major migration to Delhi
82 Chatra Jharkand 32202 2068 34270 83 Vaishali Bihar 11101 2699 13800 84 Kangra Himachal Pradesh 9323 2226 11549 85 Saharsa Bihar 9206 2053 11259 86 Medinipur West Bengal 8168 1158 9326 87 Chennai Tamil Nadu 7723 1582 9305 88 Katihar Bihar 7479 2097 9576 89 Khagaria Bihar 7419 2170 9589 90 Ranchi Jharkand 7140 2004 9144 91 Purnia Bihar 7090 2547 9637 92 Tehri Garhwal Uttrakhand 7066 1731 8797 93 Bhind Madhya Pradesh 6541 1224 7765
94 North Twenty Four Parganas West Bengal 6400 1080 7480
95 Jalandhar Punjab 6056 2572 8628 96 Kottayam Kerala 6022 560 6582 97 Maldah West Bengal 5996 2087 8083 98 Gurdaspur Punjab 5916 2085 8001
99 Mahoba Uttar Pradesh 5880 1721 7601 100 Srinagar Jammu & Kashmir 5845 1891 7736
Sub-total of 19 districts of Delhi II 162573 35555 198128 III List of remaining 19 districts sending major migration to Rest of NCR Districts 101 Janjgir - Champa Chhattisgarh 99 8476 8575 102 Sikar Rajasthan 4295 7789 12084 103 Nadia West Bengal 2528 7110 9638 104 Hathras Uttar Pradesh 4847 5880 10727
105 Jhunjhunun Rajasthan 4170 5817 9987 106 Banda Uttar Pradesh 3835 5314 9149 107 Hardwar Uttrakhand 5185 4836 10021 108 Bilaspur Chhattisgarh 4980 4731 9711 109 Kaithal Haryana 2837 4713 7550 110 Raipur Chhattisgarh 2709 4333 7042 111 Ambala Haryana 4548 4309 8857 112 Koch Bihar West Bengal 1572 4272 5844 113 Saran Bihar 726 3633 4359

Final Report STUDY ON COUNTER MAGNET AREAS TO DELHI & NCR
URBAN & REGIONAL PLANNING 9 of 30 C:\Documents and Settings\singh\Desktop\Final report_CMA\Chapter 5.doc
Sl. No.
Top 100 Districts Sending Maximum Migration to Delhi State
Migration to Delhi (A)
Migration to rest of NCR Districts (B)
Total (A+B)
114 Kurukshetra Haryana 1855 3370 5225 115 Jyotiba Phule Nagar Uttar Pradesh 4212 3066 7278 116 Buxar Bihar 4693 2979 7672 117 Ajmer Rajasthan 4199 2902 7101 118 Unspecified District Rajasthan 4295 2874 7169 119 Uttar Dinajpur West Bengal 2651 2796 5447
Sub-total of 19 districts of rest of NCR III 64236 89200 153436 Total migration from 119 districts (I+II+III) 1680798 2106824 3787622 * Districts located within NCR
5.3 Contender cities for proposed counter magnet areas The district headquarters/cities identified as contenders for proposed counter magnet areas by selecting district headquarters of top 100 districts out of total 119 districts (i. 81 common districts sending major migrants to Delhi & rest of NCR districts; ii. 19 districts sending migration to Delhi and iii. 19 other districts sending migration to rest of NCR districts) (Refer table 5.5). All the 119 districts sending major migration to Delhi & rest of NCR districts are arranged in descending order of total migration to Delhi & rest of NCR. District headquarters of top 100 districts sending major migration to Delhi and rest of NCR districts have been considered as potential contenders for counter magnet areas (CMA’s). The short listing of 100 cities/towns out of 119 identified cities/towns is based on the migration analysis from all the identified districts. It is observed that top 100 districts contribute around 3/4th of the total migration to NCTD and rest of NCR districts. Refer Table 5.5 & 5.6 Table 5.5: Migration pattern for Delhi & rest of NCR districts
Migration to Delhi Migration to rest of
NCR districts Total
No of
migrants % No of
migrants % No of
migrants % Migration from top 100 districts 1602294 73.74 2050190 80.46 3652484 77.37 Migration from remaining top 19 districts 78504 3.61 56634 2.22 135138 2.86 Total migration from top 119 districts 1680798 77.36 2106824 82.68 3787622 80.23 Migration from rest of the country 491962 22.64 441305 17.32 933267 19.77 Total migration 2172760 100.00 2548129 100.00 4720889 100.00
Refer annexure I & II for migration from top 100 districts to Delhi & NCR in descending order Table 5.6: List of contender cities in descending order of migration to NCTD
Sl. No. Top 100 Districts Sending Maximum Migration to Delhi State
Migration to Delhi during 1991-2001
1 Bulandshahr * Uttar Pradesh 64373 2 Aligarh Uttar Pradesh 50068 3 Meerut * Uttar Pradesh 44274 4 Madhubani Bihar 42299 5 Darbhanga Bihar 38842 6 Ghaziabad * Uttar Pradesh 37418 7 Etah Uttar Pradesh 36477 8 Azamgarh Uttar Pradesh 33381 9 Chatra Jharkand 32202 10 Patna Bihar 31903

Final Report STUDY ON COUNTER MAGNET AREAS TO DELHI & NCR
URBAN & REGIONAL PLANNING 10 of 30 C:\Documents and Settings\singh\Desktop\Final report_CMA\Chapter 5.doc
Sl. No. Top 100 Districts Sending Maximum Migration to Delhi State
Migration to Delhi during 1991-2001
11 Garhwal Uttrakhand 31506 12 Gorakhpur Uttar Pradesh 30961 13 Agra Uttar Pradesh 28970 14 Samastipur Bihar 28533 15 Kolkata West Bengal 28477 16 Sonipat * Haryana 28053 17 Muzaffarpur Bihar 25930 18 Rohtak * Haryana 25797 19 Budaun Uttar Pradesh 25412 20 Muzaffarnagar Uttar Pradesh 25180 21 Kanpur Nagar Uttar Pradesh 24314 22 Almora Uttrakhand 23956 23 Etawah Uttar Pradesh 22177 24 Siwan Bihar 21743 25 Moradabad Uttar Pradesh 21362 26 Sultanpur Uttar Pradesh 21290 27 Sitamarhi Bihar 19744 28 Bijnor Uttar Pradesh 19217 29 Jhajjar * Haryana 18859 30 Baghpat * Uttar Pradesh 18846 31 Faizabad Uttar Pradesh 18135 32 Mathura Uttar Pradesh 18131 33 Allahabad Uttar Pradesh 18015 34 Bhagalpur Bihar 17734 35 Bareilly Uttar Pradesh 17180 36 Alwar * Rajasthan 16907 37 Gurgaon * Haryana 16708 38 Faridabad * Haryana 16577 39 Basti Uttar Pradesh 16241 40 Pratapgarh Uttar Pradesh 15858 41 Gonda Uttar Pradesh 15187 42 Purba Champaran Bihar 15139 43 Farrukhabad Uttar Pradesh 15046 44 Jaunpur Uttar Pradesh 15031 45 Begusarai Bihar 14972 46 Lucknow Uttar Pradesh 14545 47 Jaipur Rajasthan 13885 48 Mainpuri Uttar Pradesh 13836 49 Ballia Uttar Pradesh 13175 50 Gaya Bihar 13028

Final Report STUDY ON COUNTER MAGNET AREAS TO DELHI & NCR
URBAN & REGIONAL PLANNING 11 of 30 C:\Documents and Settings\singh\Desktop\Final report_CMA\Chapter 5.doc
Sl. No. Top 100 Districts Sending Maximum Migration to Delhi State
Migration to Delhi during 1991-2001
51 Rae Bareli Uttar Pradesh 12800 52 Nalanda Bihar 12798 53 Mumbai Maharashtra 11769 54 Bhojpur Bihar 11626 55 Vaishali Bihar 11101 56 Hardoi Uttar Pradesh 10803 57 Varanasi Uttar Pradesh 9820 58 Deoria Uttar Pradesh 9805 59 Nainital Uttrakhand 9795 60 Dehradun Uttrakhand 9764 61 Amritsar Punjab 9524 62 Munger Bihar 9340 63 Kangra Himachal Pradesh 9323 64 Saharsa Bihar 9206 65 Saharanpur Uttar Pradesh 8993 66 Firozabad Uttar Pradesh 8699 67 Ghazipur Uttar Pradesh 8690 68 Unnao Uttar Pradesh 8207 69 Medinipur West Bengal 8168 70 Gautam Buddha Nagar * Uttar Pradesh 8020 71 Bhiwani Haryana 8016 72 Chennai Tamil Nadu 7723 73 Jind Haryana 7573 74 Katihar Bihar 7479 75 Rewari * Haryana 7448 76 Khagaria Bihar 7419 77 Bharatpur Rajasthan 7402 78 Ludhiana Punjab 7179 79 Gopalganj Bihar 7150 80 Ranchi Jharkand 7140 81 Purnia Bihar 7090 82 Panipat * Haryana 7085 83 Tehri Garhwal Uttrakhand 7066 84 Hisar Haryana 6894 85 Shahjahanpur Uttar Pradesh 6763 86 Chandigarh Chandigarh UT 6700 87 Jhansi Uttar Pradesh 6631 88 Chhatarpur Madhya Pradesh 6510 89 Dausa Rajasthan 6176 90 Rampur Uttar Pradesh 5840

Final Report STUDY ON COUNTER MAGNET AREAS TO DELHI & NCR
URBAN & REGIONAL PLANNING 12 of 30 C:\Documents and Settings\singh\Desktop\Final report_CMA\Chapter 5.doc
Sl. No. Top 100 Districts Sending Maximum Migration to Delhi State
Migration to Delhi during 1991-2001
91 Mahendragarh Haryana 5752 92 Karnal Haryana 5725 93 Hardwar Uttrakhand 5185 94 Bilaspur Chhattisgarh 4980 95 Hathras Uttar Pradesh 4847 96 Ambala Haryana 4548 97 Sikar Rajasthan 4295 98 Jhunjhunun Rajasthan 4170 99 Banda Uttar Pradesh 3835 100 Nadia West Bengal 2528
* Districts located within NCR Refer map no 5.1 to 5.7 5.4 Criteria for selection of counter magnets – the sieving/scanning process
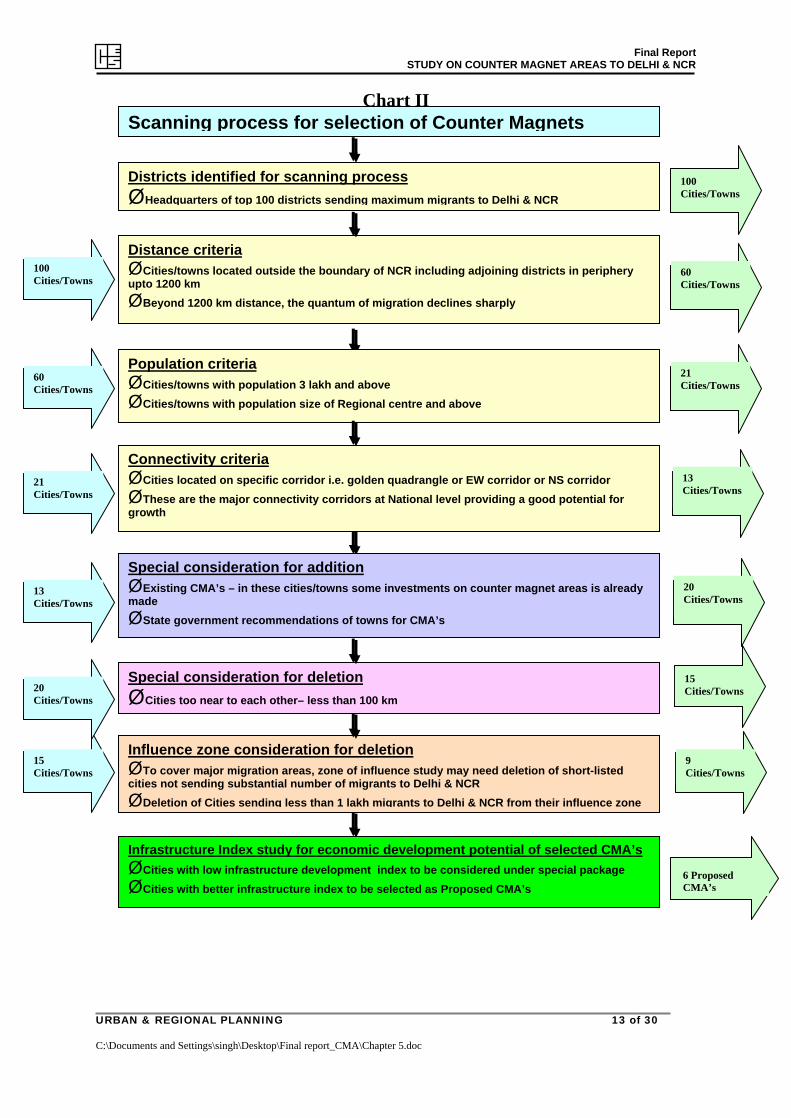
The National Capital Region Planning Board Act, 1985 empowers the Board to select in consultation with the State Government concerned, any urban area outside the National Capital Region having regard to its location, population and potential for growth to achieve the objectives of the Regional Plan. Thus the criteria for the selection process have been worked out as seven step exercise which is derived from three stage exercise as below: (Refer Chart I & II)
Contender districts (100 nos)
Stage I – Preliminary Criteria v Distance v Population v Connectivity
Stage II – Special Consideration for Lateral additional and deletion For Addition
v Existing CMA’s v State Government Recommendation of Cities/towns
For Deletion v Cities/towns located too near (100 distance)
Stage III – Final Criteria for selection v Migration from the influence zone v District Development Index
Chart I - Three Stage Selection Criteria
Final Report STUDY ON COUNTER MAGNET AREAS TO DELHI & NCR
URBAN & REGIONAL PLANNING 13 of 30 C:\Documents and Settings\singh\Desktop\Final report_CMA\Chapter 5.doc
Chart II
Scanning process for selection of Counter Magnets
Districts identified for scanning process ØHeadquarters of top 100 districts sending maximum migrants to Delhi & NCR
Distance criteria ØCities/towns located outside the boundary of NCR including adjoining districts in periphery upto 1200 km ØBeyond 1200 km distance, the quantum of migration declines sharply
Population criteria ØCities/towns with population 3 lakh and above ØCities/towns with population size of Regional centre and above
Connectivity criteria ØCities located on specific corridor i.e. golden quadrangle or EW corridor or NS corridor ØThese are the major connectivity corridors at National level providing a good potential for growth
Special consideration for addition ØExisting CMA’s – in these cities/towns some investments on counter magnet areas is already made ØState government recommendations of towns for CMA’s
Special consideration for deletion ØCities too near to each other– less than 100 km
Influence zone consideration for deletion ØTo cover major migration areas, zone of influence study may need deletion of short-listed cities not sending substantial number of migrants to Delhi & NCR ØDeletion of Cities sending less than 1 lakh migrants to Delhi & NCR from their influence zone
Infrastructure Index study for economic development potential of selected CMA’s ØCities with low infrastructure development index to be considered under special package ØCities with better infrastructure index to be selected as Proposed CMA’s
100 Cities/Towns
60 Cities/Towns
21 Cities/Towns
13 Cities/Towns
20 Cities/Towns
15 Cities/Towns
15 Cities/Towns
9 Cities/Towns
20 Cities/Towns
13 Cities/Towns
21 Cities/Towns
60 Cities/Towns
100 Cities/Towns
6 Proposed CMA’s
Final Report STUDY ON COUNTER MAGNET AREAS TO DELHI & NCR
URBAN & REGIONAL PLANNING 14 of 30 C:\Documents and Settings\singh\Desktop\Final report_CMA\Chapter 5.doc
5.5 Stage I – Distance Criteria
The distance criteria is formed based on the following important observations
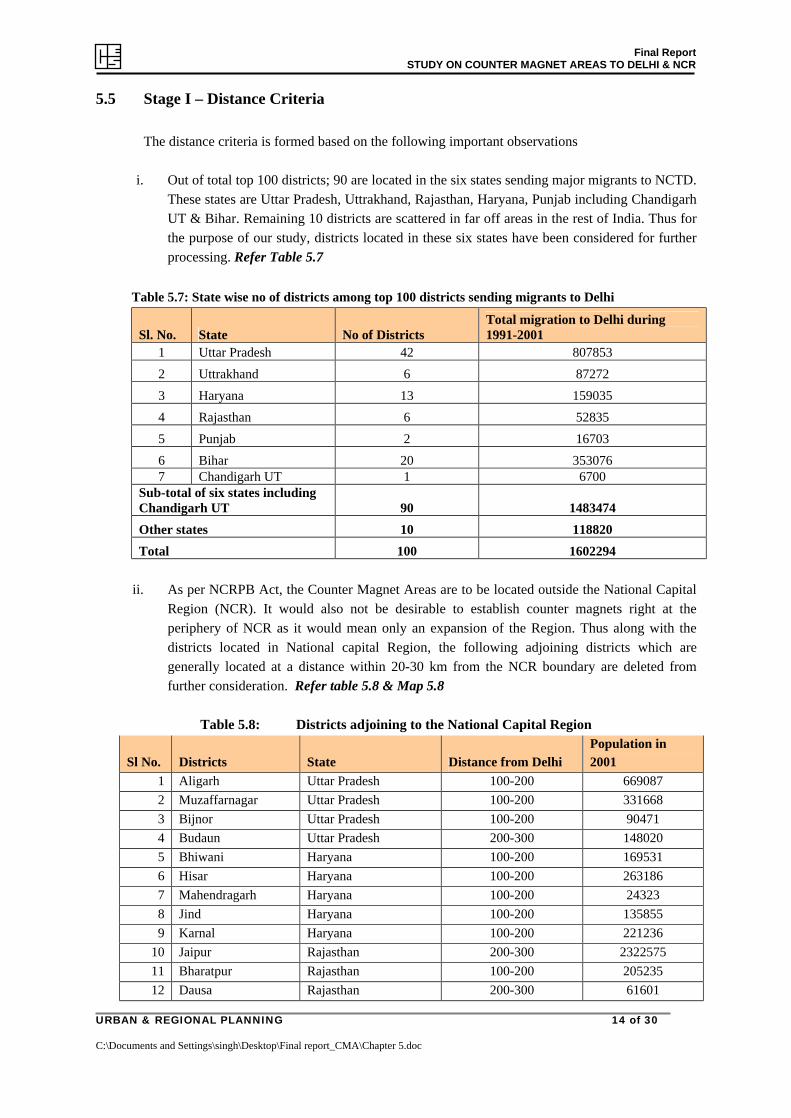
i. Out of total top 100 districts; 90 are located in the six states sending major migrants to NCTD. These states are Uttar Pradesh, Uttrakhand, Rajasthan, Haryana, Punjab including Chandigarh UT & Bihar. Remaining 10 districts are scattered in far off areas in the rest of India. Thus for the purpose of our study, districts located in these six states have been considered for further processing. Refer Table 5.7
Table 5.7: State wise no of districts among top 100 districts sending migrants to Delhi
Sl. No. State No of Districts Total migration to Delhi during 1991-2001
1 Uttar Pradesh 42 807853 2 Uttrakhand 6 87272 3 Haryana 13 159035 4 Rajasthan 6 52835 5 Punjab 2 16703 6 Bihar 20 353076 7 Chandigarh UT 1 6700
Sub-total of six states including Chandigarh UT 90 1483474 Other states 10 118820 Total 100 1602294
ii. As per NCRPB Act, the Counter Magnet Areas are to be located outside the National Capital
Region (NCR). It would also not be desirable to establish counter magnets right at the periphery of NCR as it would mean only an expansion of the Region. Thus along with the districts located in National capital Region, the following adjoining districts which are generally located at a distance within 20-30 km from the NCR boundary are deleted from further consideration. Refer table 5.8 & Map 5.8
Table 5.8: Districts adjoining to the National Capital Region
Sl No. Districts State Distance from Delhi Population in 2001
1 Aligarh Uttar Pradesh 100-200 669087 2 Muzaffarnagar Uttar Pradesh 100-200 331668 3 Bijnor Uttar Pradesh 100-200 90471 4 Budaun Uttar Pradesh 200-300 148020 5 Bhiwani Haryana 100-200 169531 6 Hisar Haryana 100-200 263186 7 Mahendragarh Haryana 100-200 24323 8 Jind Haryana 100-200 135855 9 Karnal Haryana 100-200 221236
10 Jaipur Rajasthan 200-300 2322575 11 Bharatpur Rajasthan 100-200 205235 12 Dausa Rajasthan 200-300 61601
Final Report STUDY ON COUNTER MAGNET AREAS TO DELHI & NCR
URBAN & REGIONAL PLANNING 15 of 30 C:\Documents and Settings\singh\Desktop\Final report_CMA\Chapter 5.doc
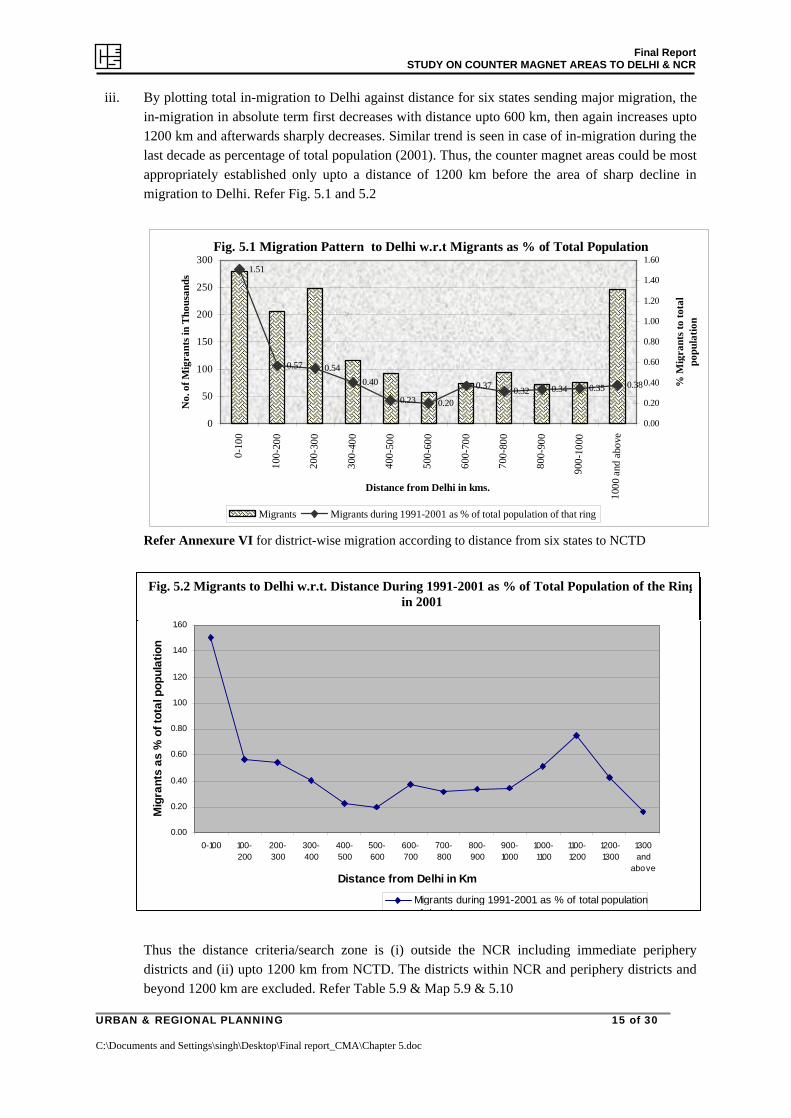
iii. By plotting total in-migration to Delhi against distance for six states sending major migration, the in-migration in absolute term first decreases with distance upto 600 km, then again increases upto 1200 km and afterwards sharply decreases. Similar trend is seen in case of in-migration during the last decade as percentage of total population (2001). Thus, the counter magnet areas could be most appropriately established only upto a distance of 1200 km before the area of sharp decline in migration to Delhi. Refer Fig. 5.1 and 5.2
Fig. 5.1 Migration Pattern to Delhi w.r.t Migrants as % of Total Population1.51
0.57 0.540.40
0.23 0.20
0.37 0.32 0.34 0.35 0.38
0
50
100
150
200
250
300
0-10
0
100-
200
200-
300
300-
400
400-
500
500-
600
600-
700
700-
800
800-
900
900-
1000
1000
and
abo
ve
Distance from Delhi in kms.
No.
of M
igra
nts i
n Th
ousa
nds
0.00
0.20
0.40
0.60
0.80
1.00
1.20
1.40
1.60
% M
igra
nts t
o to
tal
popu
latio
n
Migrants Migrants during 1991-2001 as % of total population of that ring
Refer Annexure VI for district-wise migration according to distance from six states to NCTD
Migrants to Delhi w.r.t. distance during 1991-2001 as % of total population of the ring in 2001
0.00
0.20
0.40
0.60
0.80
1.00
1.20
1.40
1.60
0-100 100-200
200-300
300-400
400-500
500-600
600-700
700-800
800-900
900-1000
1000-1100
1100-1200
1200-1300
1300and
aboveDistance from Delhi in Km
Mig
rant
s as
% o
f tot
al p
opul
atio
n
Migrants during 1991-2001 as % of total populationof that ring
Thus the distance criteria/search zone is (i) outside the NCR including immediate periphery districts and (ii) upto 1200 km from NCTD. The districts within NCR and periphery districts and beyond 1200 km are excluded. Refer Table 5.9 & Map 5.9 & 5.10
Fig. 5.2 Migrants to Delhi w.r.t. Distance During 1991-2001 as % of Total Population of the Ring in 2001
Final Report STUDY ON COUNTER MAGNET AREAS TO DELHI & NCR
URBAN & REGIONAL PLANNING 16 of 30 C:\Documents and Settings\singh\Desktop\Final report_CMA\Chapter 5.doc
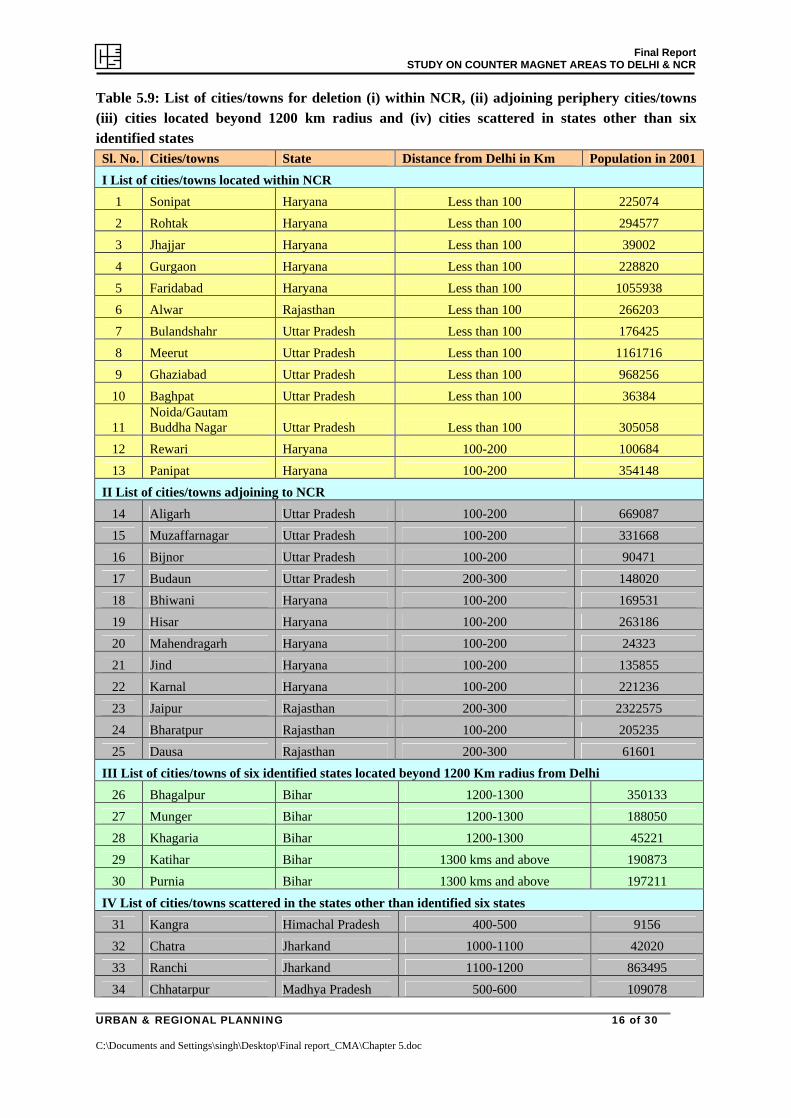
Table 5.9: List of cities/towns for deletion (i) within NCR, (ii) adjoining periphery cities/towns (iii) cities located beyond 1200 km radius and (iv) cities scattered in states other than six identified states Sl. No. Cities/towns State Distance from Delhi in Km Population in 2001 I List of cities/towns located within NCR
1 Sonipat Haryana Less than 100 225074 2 Rohtak Haryana Less than 100 294577 3 Jhajjar Haryana Less than 100 39002 4 Gurgaon Haryana Less than 100 228820 5 Faridabad Haryana Less than 100 1055938 6 Alwar Rajasthan Less than 100 266203 7 Bulandshahr Uttar Pradesh Less than 100 176425 8 Meerut Uttar Pradesh Less than 100 1161716 9 Ghaziabad Uttar Pradesh Less than 100 968256 10 Baghpat Uttar Pradesh Less than 100 36384
11 Noida/Gautam Buddha Nagar Uttar Pradesh Less than 100 305058
12 Rewari Haryana 100-200 100684 13 Panipat Haryana 100-200 354148
II List of cities/towns adjoining to NCR 14 Aligarh Uttar Pradesh 100-200 669087 15 Muzaffarnagar Uttar Pradesh 100-200 331668 16 Bijnor Uttar Pradesh 100-200 90471 17 Budaun Uttar Pradesh 200-300 148020 18 Bhiwani Haryana 100-200 169531 19 Hisar Haryana 100-200 263186 20 Mahendragarh Haryana 100-200 24323 21 Jind Haryana 100-200 135855 22 Karnal Haryana 100-200 221236 23 Jaipur Rajasthan 200-300 2322575 24 Bharatpur Rajasthan 100-200 205235 25 Dausa Rajasthan 200-300 61601
III List of cities/towns of six identified states located beyond 1200 Km radius from Delhi 26 Bhagalpur Bihar 1200-1300 350133 27 Munger Bihar 1200-1300 188050 28 Khagaria Bihar 1200-1300 45221 29 Katihar Bihar 1300 kms and above 190873 30 Purnia Bihar 1300 kms and above 197211
IV List of cities/towns scattered in the states other than identified six states 31 Kangra Himachal Pradesh 400-500 9156 32 Chatra Jharkand 1000-1100 42020 33 Ranchi Jharkand 1100-1200 863495 34 Chhatarpur Madhya Pradesh 500-600 109078

Final Report STUDY ON COUNTER MAGNET AREAS TO DELHI & NCR
URBAN & REGIONAL PLANNING 17 of 30 C:\Documents and Settings\singh\Desktop\Final report_CMA\Chapter 5.doc
Sl. No. Cities/towns State Distance from Delhi in Km Population in 2001 35 Mumbai Maharashtra 1300 kms and above 16434386 36 Chennai Tamil Nadu 1300 kms and above 6560242 37 Kolkata West Bengal 1300 kms and above 13205697 38 Medinipur West Bengal 1300 kms and above 149769 39 Nadia West Bengal 1300 kms and above 148709* 40 Bilaspur Chhattisgarh 1000-1100 335293
*As per census there is no such city Nadia in West Bengal but there is city Krishnanagar UA in Nadia district
After elimination of 40 cities, 60 cities short listed for next stage scanning are as given in Table 5.10. Refer Map 5.10
Table 5.10: List of 60 cities selected/recommended for next stage scanning
Sl. No. Cities located within 100-1200 km radius
State Distance from Delhi in Km
Population in 2001
1 Almora Uttrakhand 300-400 32358 2 Dehradun Uttrakhand 200-300 530263 3 Garhwal Uttrakhand 200-300 24743 4 Hardwar Uttrakhand 200-300 220757 5 Nainital Uttrakhand 200-300 39911 6 Tehri/Tehri Garhwal Uttrakhand 300-400 25423 7 Agra Uttar Pradesh 200-300 1331339 8 Allahabad Uttar Pradesh 700-800 1042229 9 Azamgarh Uttar Pradesh 800-900 93521
10 Ballia Uttar Pradesh 900-1000 101465 11 Banda Uttar Pradesh 500-600 139436 12 Bareilly Uttar Pradesh 200-300 748353 13 Basti Uttar Pradesh 700-800 107601 14 Deoria Uttar Pradesh 800-900 104227 15 Etah Uttar Pradesh 200-300 107110 16 Etawah Uttar Pradesh 300-400 210453 17 Faizabad Uttar Pradesh 600-700 208162 18 Farrukhabad Uttar Pradesh 300-400 242997 19 Firozabad Uttar Pradesh 200-300 432866 20 Ghazipur Uttar Pradesh 800-900 103298 21 Gonda Uttar Pradesh 600-700 120301 22 Gorakhpur Uttar Pradesh 700-800 622701 23 Hardoi Uttar Pradesh 300-400 112486 24 Hathras Uttar Pradesh 100-200 126355 25 Jaunpur Uttar Pradesh 700-800 160055 26 Jhansi Uttar Pradesh 400-500 460278 27 Kanpur Nagar Uttar Pradesh 400-500 2715555 28 Lucknow Uttar Pradesh 500-600 2245509 29 Mainpuri Uttar Pradesh 200-300 104851 30 Mathura Uttar Pradesh 100-200 323315 31 Moradabad Uttar Pradesh 100-200 641583 32 Pratapgarh Uttar Pradesh 600-700 12411 33 Rae Bareli Uttar Pradesh 500-600 169333 34 Rampur Uttar Pradesh 200-300 281494 35 Saharanpur Uttar Pradesh 100-200 455754 36 Shahjahanpur Uttar Pradesh 300-400 321885 37 Sultanpur Uttar Pradesh 600-700 100065 38 Unnao Uttar Pradesh 400-500 144662 39 Varanasi Uttar Pradesh 800-900 1203961 40 Chandigarh Chandigarh UT 200-300 808515 41 Amritsar Punjab 400-500 1003917

Final Report STUDY ON COUNTER MAGNET AREAS TO DELHI & NCR
URBAN & REGIONAL PLANNING 18 of 30 C:\Documents and Settings\singh\Desktop\Final report_CMA\Chapter 5.doc
Sl. No. Cities located within 100-1200 km radius
State Distance from Delhi in Km
Population in 2001
42 Ludhiana Punjab 300-400 1398467 43 Ambala Haryana 100-200 307595 44 Jhunjhunun Rajasthan 200-300 100485 45 Sikar Rajasthan 200-300 185925 46 Begusarai Bihar 1100-1200 107623 47 Bhojpur Bihar 1000-1100 203380 48 Darbhanga Bihar 1100-1200 267348 49 Gaya Bihar 1000-1100 394945 50 Gopalganj Bihar 900-1000 54449 51 Madhubani Bihar 1100-1200 66340 52 Muzaffarpur Bihar 1000-1100 305525 53 Nalanda Bihar 1100-1200 232071 54 Patna Bihar 1000-1100 1697976 55 Purba Champaran Bihar 900-1000 108428 56 Saharsa Bihar 1100-1200 125167 57 Samastipur Bihar 1100-1200 61998 58 Sitamarhi Bihar 1000-1100 87279 59 Siwan Bihar 900-1000 109919 60 Vaishali Bihar 900-1000 119412
5.6 Stage II – Population Criteria
In terms of population, the 60 high migrating districts selected in the previous stage can be grouped into population categories as following. Refer table 5.11 & 5.12
Table 5.11: No of cities/towns grouped on the basis of population size
Sl. No. Population size No of Cities/towns 1 5 lakh & above 13 2 3 lakh to 5 lakh 8 3 1 lakh to 3 lakh 29 4 Below 1 lakh 10
Total 60 Table 5.12: List of cities/towns grouped on the basis of population size
Sl. No. Cities/towns State Distance from Delhi in Km Population in 2001
Population below 1 lakh 1 Pratapgarh Uttar Pradesh 600-700 12411 2 Garhwal Uttrakhand 200-300 24743 3 Tehri/Tehri Garhwal Uttrakhand 300-400 25423 4 Almora Uttrakhand 300-400 32358 5 Nainital Uttrakhand 200-300 39911 6 Gopalganj Bihar 900-1000 54449 7 Samastipur Bihar 1100-1200 61998 8 Madhubani Bihar 1100-1200 66340 9 Sitamarhi Bihar 1000-1100 87279 10 Azamgarh Uttar Pradesh 800-900 93521
Population 1 lakh to 3 lakh 11 Sultanpur Uttar Pradesh 600-700 100065 12 Jhunjhunun Rajasthan 200-300 100485 13 Ballia Uttar Pradesh 900-1000 101465 14 Ghazipur Uttar Pradesh 800-900 103298 15 Deoria Uttar Pradesh 800-900 104227 16 Mainpuri Uttar Pradesh 200-300 104851 17 Etah Uttar Pradesh 200-300 107110

Final Report STUDY ON COUNTER MAGNET AREAS TO DELHI & NCR
URBAN & REGIONAL PLANNING 19 of 30 C:\Documents and Settings\singh\Desktop\Final report_CMA\Chapter 5.doc
Sl. No. Cities/towns State Distance from Delhi in Km Population in 2001
18 Basti Uttar Pradesh 700-800 107601 19 Begusarai Bihar 1100-1200 107623 20 Purba Champaran Bihar 900-1000 108428 21 Siwan Bihar 900-1000 109919 22 Hardoi Uttar Pradesh 300-400 112486 23 Vaishali Bihar 900-1000 119412 24 Gonda Uttar Pradesh 600-700 120301 25 Saharsa Bihar 1100-1200 125167 26 Hathras Uttar Pradesh 100-200 126355 27 Banda Uttar Pradesh 500-600 139436 28 Unnao Uttar Pradesh 400-500 144662 29 Jaunpur Uttar Pradesh 700-800 160055 30 Rae Bareli Uttar Pradesh 500-600 169333 31 Sikar Rajasthan 200-300 185925 32 Bhojpur Bihar 1000-1100 203380 33 Faizabad Uttar Pradesh 600-700 208162 34 Etawah Uttar Pradesh 300-400 210453 35 Hardwar Uttrakhand 200-300 220757 36 Nalanda Bihar 1100-1200 232071 37 Farrukhabad Uttar Pradesh 300-400 242997 38 Darbhanga Bihar 1100-1200 267348 39 Rampur Uttar Pradesh 200-300 281494
Population 3 lakh to 5 lakh 40 Muzaffarpur Bihar 1000-1100 305525 41 Ambala Haryana 100-200 307595 42 Shahjahanpur Uttar Pradesh 300-400 321885 43 Mathura Uttar Pradesh 100-200 323315 44 Gaya Bihar 1000-1100 394945 45 Firozabad Uttar Pradesh 200-300 432866 46 Saharanpur Uttar Pradesh 100-200 455754 47 Jhansi Uttar Pradesh 400-500 460278
Population 5 lakh & above 48 Dehradun Uttrakhand 200-300 530263 49 Gorakhpur Uttar Pradesh 700-800 622701 50 Moradabad Uttar Pradesh 100-200 641583 51 Bareilly Uttar Pradesh 200-300 748353 52 Chandigarh Chandigarh UT 200-300 808515 53 Amritsar Punjab 400-500 1003917 54 Allahabad Uttar Pradesh 700-800 1042229 55 Varanasi Uttar Pradesh 800-900 1203961 56 Agra Uttar Pradesh 200-300 1331339 57 Ludhiana Punjab 300-400 1398467 58 Patna Bihar 1000-1100 1697976 59 Lucknow Uttar Pradesh 500-600 2245509 60 Kanpur Nagar Uttar Pradesh 400-500 2715555
For establishment as counter magnet areas to NCTD in terms of population, the cities should have a population base sufficient to absorb in-migration and counter the existing forces. It would be appropriate to have cities with high population base i.e. 5 lakh and above. However, considering the population size of regional centre in the NCR Plan as 3 lakh and above, minimum population criteria of 3 lakh is accepted for selection of counter magnet areas. Based on this criteria, 21 cities/towns qualify for further scanning. Refer Table 5.13 & Map no 5.11

Final Report STUDY ON COUNTER MAGNET AREAS TO DELHI & NCR
URBAN & REGIONAL PLANNING 20 of 30 C:\Documents and Settings\singh\Desktop\Final report_CMA\Chapter 5.doc
Table 5.13: List of cities/towns qualify at Stage II scanning – Population criteria Sl. No. Cities/towns with population 3 lakh & above State Population in 2001
1 Muzaffarpur Bihar 305525 2 Ambala Haryana 307595 3 Shahjahanpur Uttar Pradesh 321885 4 Mathura Uttar Pradesh 323315 5 Gaya Bihar 394945 6 Firozabad Uttar Pradesh 432866 7 Saharanpur Uttar Pradesh 455754 8 Jhansi Uttar Pradesh 460278 9 Dehradun Uttrakhand 530263
10 Gorakhpur Uttar Pradesh 622701 11 Moradabad Uttar Pradesh 641583 12 Bareilly Uttar Pradesh 748353 13 Chandigarh Chandigarh UT 808515 14 Amritsar Punjab 1003917 15 Allahabad Uttar Pradesh 1042229 16 Varanasi Uttar Pradesh 1203961 17 Agra Uttar Pradesh 1331339 18 Ludhiana Punjab 1398467 19 Patna Bihar 1697976 20 Lucknow Uttar Pradesh 2245509 21 Kanpur Nagar Uttar Pradesh 2715555
5.7 Stage III – Connectivity and Nodality Criteria
Cities located on golden quadrangle, east-west corridor and north-south corridor have better connectivity and nodality i.e. efficient regional transport system. Migrants specially low profile and unskilled labor generally migrate to cities having more development activities which ultimately create better employment opportunities. Such cities having better road and rail connectivity are significant for goods movement and attracting economic activities; also play important role in attracting migrants at broad level and commuters at regional level. Due to locational advantage, cities located on these corridors could have large influence zone as compared to cities located off the corridor. These cities can also play a role of regional hub and help in reducing the pressure on Delhi & NCR. Considering these aspects, cities have been further short listed on the basis of their location on golden quadrangle, east-west corridor and north-south corridor. Out of total twenty one cities, eight cities which do not have this connectivity were eliminated while thirteen cities have been recommended for their better connectivity being located either on golden quadrangle or east-west corridor or north-south corridor. Refer table 5.14 & 5.15 and Map no 5.12
Table 5.14: List of 8 cities not located on specific corridor i.e. Golden Quadrangle or EW corridor or NS corridor
Sl. No. Cities not located on the
major corridor State Distance from Delhi in Km Population in 2001
1 Saharanpur Uttar Pradesh 100-200 455754 2 Moradabad Uttar Pradesh 100-200 641583 3 Bareilly Uttar Pradesh 200-300 748353 4 Shahjahanpur Uttar Pradesh 300-400 321885 5 Dehradun Uttrakhand 200-300 530263 6 Chandigarh Chandigarh UT 200-300 808515
Final Report STUDY ON COUNTER MAGNET AREAS TO DELHI & NCR
URBAN & REGIONAL PLANNING 21 of 30 C:\Documents and Settings\singh\Desktop\Final report_CMA\Chapter 5.doc
Sl. No. Cities not located on the
major corridor State Distance from Delhi in Km Population in 2001
7 Amritsar Punjab 400-500 1003917 8 Patna Bihar 1000-1100 1697976
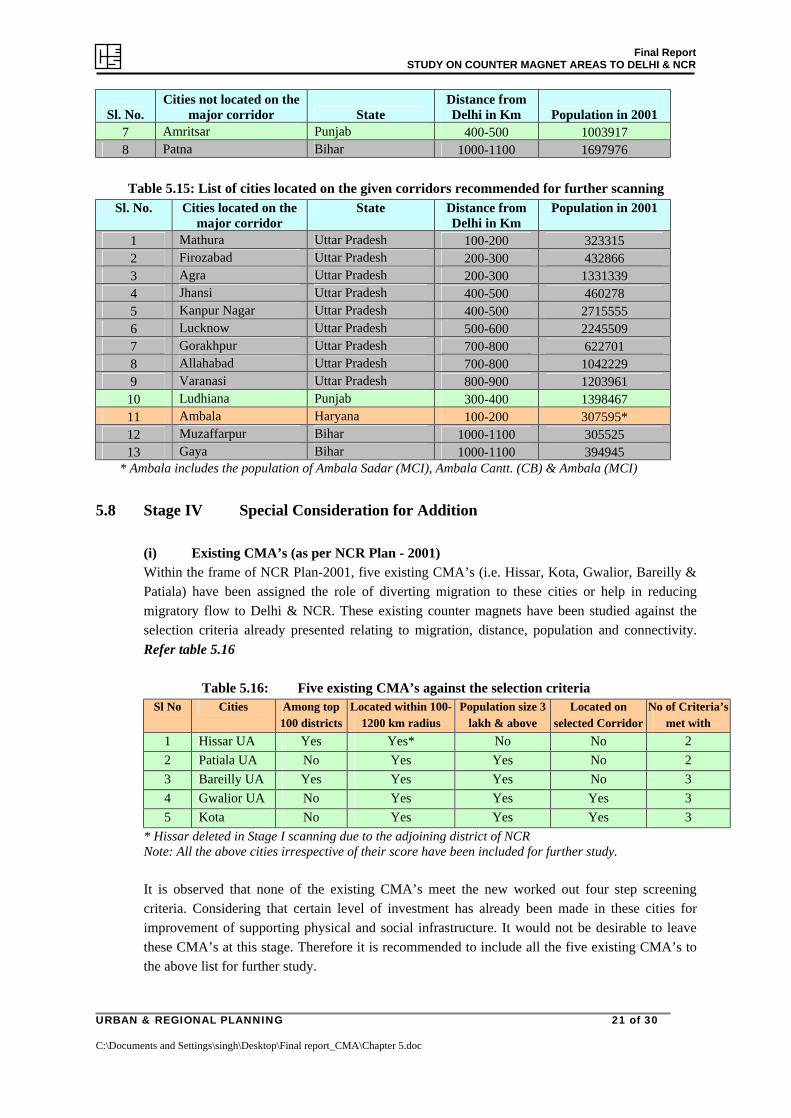
Table 5.15: List of cities located on the given corridors recommended for further scanning
Sl. No. Cities located on the major corridor
State Distance from Delhi in Km
Population in 2001
1 Mathura Uttar Pradesh 100-200 323315 2 Firozabad Uttar Pradesh 200-300 432866 3 Agra Uttar Pradesh 200-300 1331339 4 Jhansi Uttar Pradesh 400-500 460278 5 Kanpur Nagar Uttar Pradesh 400-500 2715555 6 Lucknow Uttar Pradesh 500-600 2245509 7 Gorakhpur Uttar Pradesh 700-800 622701 8 Allahabad Uttar Pradesh 700-800 1042229 9 Varanasi Uttar Pradesh 800-900 1203961 10 Ludhiana Punjab 300-400 1398467 11 Ambala Haryana 100-200 307595* 12 Muzaffarpur Bihar 1000-1100 305525 13 Gaya Bihar 1000-1100 394945
* Ambala includes the population of Ambala Sadar (MCI), Ambala Cantt. (CB) & Ambala (MCI) 5.8 Stage IV Special Consideration for Addition
(i) Existing CMA’s (as per NCR Plan - 2001) Within the frame of NCR Plan-2001, five existing CMA’s (i.e. Hissar, Kota, Gwalior, Bareilly & Patiala) have been assigned the role of diverting migration to these cities or help in reducing migratory flow to Delhi & NCR. These existing counter magnets have been studied against the selection criteria already presented relating to migration, distance, population and connectivity. Refer table 5.16
Table 5.16: Five existing CMA’s against the selection criteria
Sl No Cities Among top 100 districts
Located within 100-1200 km radius
Population size 3 lakh & above
Located on selected Corridor
No of Criteria’s met with
1 Hissar UA Yes Yes* No No 2 2 Patiala UA No Yes Yes No 2 3 Bareilly UA Yes Yes Yes No 3 4 Gwalior UA No Yes Yes Yes 3 5 Kota No Yes Yes Yes 3
* Hissar deleted in Stage I scanning due to the adjoining district of NCR Note: All the above cities irrespective of their score have been included for further study.
It is observed that none of the existing CMA’s meet the new worked out four step screening criteria. Considering that certain level of investment has already been made in these cities for improvement of supporting physical and social infrastructure. It would not be desirable to leave these CMA’s at this stage. Therefore it is recommended to include all the five existing CMA’s to the above list for further study.
Final Report STUDY ON COUNTER MAGNET AREAS TO DELHI & NCR
URBAN & REGIONAL PLANNING 22 of 30 C:\Documents and Settings\singh\Desktop\Final report_CMA\Chapter 5.doc
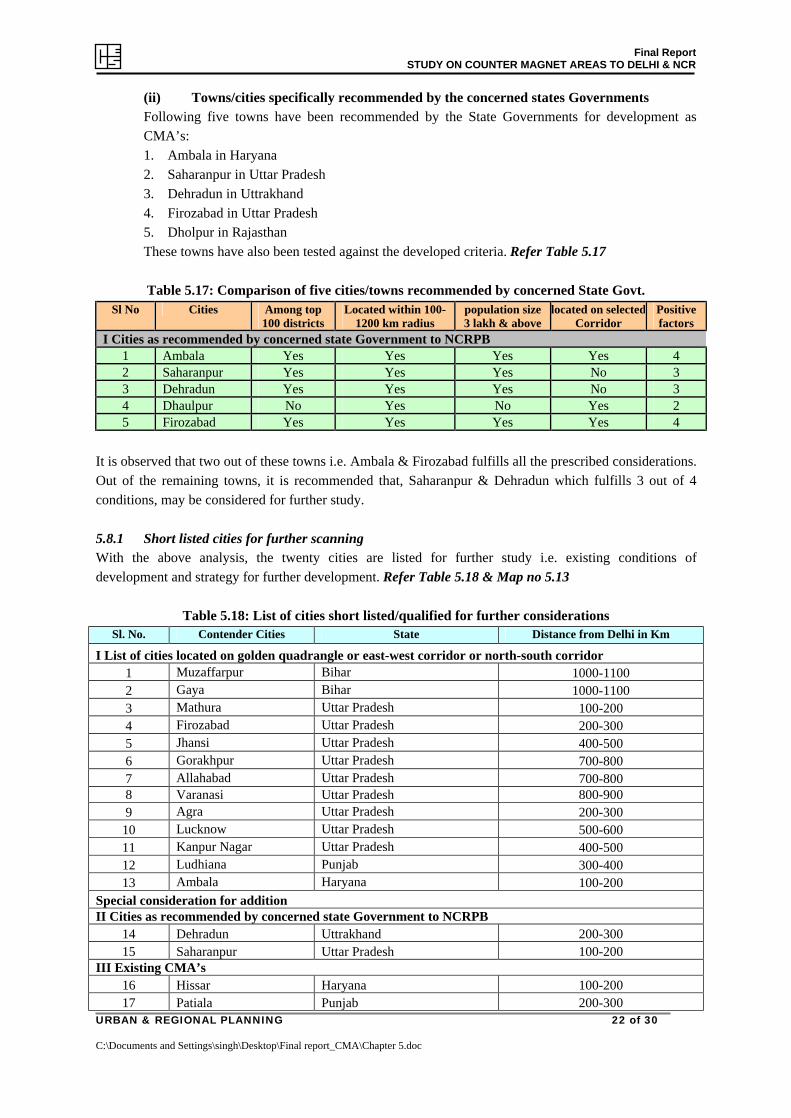
(ii) Towns/cities specifically recommended by the concerned states Governments Following five towns have been recommended by the State Governments for development as CMA’s: 1. Ambala in Haryana 2. Saharanpur in Uttar Pradesh 3. Dehradun in Uttrakhand 4. Firozabad in Uttar Pradesh 5. Dholpur in Rajasthan These towns have also been tested against the developed criteria. Refer Table 5.17
Table 5.17: Comparison of five cities/towns recommended by concerned State Govt.
Sl No Cities Among top 100 districts
Located within 100-1200 km radius
population size 3 lakh & above
located on selected Corridor
Positive factors
I Cities as recommended by concerned state Government to NCRPB 1 Ambala Yes Yes Yes Yes 4 2 Saharanpur Yes Yes Yes No 3 3 Dehradun Yes Yes Yes No 3 4 Dhaulpur No Yes No Yes 2 5 Firozabad Yes Yes Yes Yes 4
It is observed that two out of these towns i.e. Ambala & Firozabad fulfills all the prescribed considerations. Out of the remaining towns, it is recommended that, Saharanpur & Dehradun which fulfills 3 out of 4 conditions, may be considered for further study. 5.8.1 Short listed cities for further scanning With the above analysis, the twenty cities are listed for further study i.e. existing conditions of development and strategy for further development. Refer Table 5.18 & Map no 5.13
Table 5.18: List of cities short listed/qualified for further considerations Sl. No. Contender Cities State Distance from Delhi in Km
I List of cities located on golden quadrangle or east-west corridor or north-south corridor 1 Muzaffarpur Bihar 1000-1100 2 Gaya Bihar 1000-1100 3 Mathura Uttar Pradesh 100-200 4 Firozabad Uttar Pradesh 200-300 5 Jhansi Uttar Pradesh 400-500 6 Gorakhpur Uttar Pradesh 700-800 7 Allahabad Uttar Pradesh 700-800 8 Varanasi Uttar Pradesh 800-900 9 Agra Uttar Pradesh 200-300 10 Lucknow Uttar Pradesh 500-600 11 Kanpur Nagar Uttar Pradesh 400-500 12 Ludhiana Punjab 300-400 13 Ambala Haryana 100-200
Special consideration for addition II Cities as recommended by concerned state Government to NCRPB
14 Dehradun Uttrakhand 200-300 15 Saharanpur Uttar Pradesh 100-200
III Existing CMA’s 16 Hissar Haryana 100-200 17 Patiala Punjab 200-300

Final Report STUDY ON COUNTER MAGNET AREAS TO DELHI & NCR
URBAN & REGIONAL PLANNING 23 of 30 C:\Documents and Settings\singh\Desktop\Final report_CMA\Chapter 5.doc
Sl. No. Contender Cities State Distance from Delhi in Km 18 Bareilly Uttar Pradesh 200-300 19 Gwalior Madhya Pradesh 300-400 20 Kota Rajasthan 400-500
5.9 Stage V Special consideration for deletion
Some of the towns/cities available at this stage after the sieving process are located near to each other i.e. within 100 km distance. As it may not be appropriate to develop counter magnet areas too near to each other. In such cases, the city/town with better potential for industrial and other development or for other significant reasons has been retained and the other deleted. These are as given below Refer Table 5.19 to 5.20:
i. Agra & Mathura deleted while Firozabad retained which has better industrial potential
ii. Varanasi deleted while Allahabad retained which have better education and IT potential iii. Lucknow has been deleted while Kanpur retained which have industrial development potential
and located on the main transport corridor. iv. Saharanpur deleted being located in proximity to Dehradun, the only city in Uttrakhand
Table 5.19: List of cities deleted due to special consideration
Sl. No. Contender Cities State 1 Mathura Uttar Pradesh 2 Varanasi Uttar Pradesh 3 Agra Uttar Pradesh 4 Lucknow Uttar Pradesh 5 Saharanpur Uttar Pradesh
Table 5.20: List of selected cities
Sl. No. Cities/towns after Stage V State Distance from Delhi in Km I List of cities qualified the scanning process
1 Ludhiana Punjab 300-400 2 Firozabad Uttar Pradesh 200-300 3 Jhansi Uttar Pradesh 400-500 4 Gorakhpur Uttar Pradesh 700-800 5 Allahabad Uttar Pradesh 700-800 6 Kanpur Nagar Uttar Pradesh 400-500 7 Muzaffarpur Bihar 1000-1100 8 Gaya Bihar 1000-1100 9 Ambala Haryana 100-200
Special consideration for addition II Cities as recommended by concerned state Government to NCRPB
10 Dehradun Uttrakhand 200-300 III Existing CMA’s
11 Hissar Haryana 100-200 12 Patiala Punjab 200-300 13 Bareilly Uttar Pradesh 200-300 14 Gwalior Madhya Pradesh 300-400 15 Kota Rajasthan 400-500
Refer Map 5.14
Final Report STUDY ON COUNTER MAGNET AREAS TO DELHI & NCR
URBAN & REGIONAL PLANNING 24 of 30 C:\Documents and Settings\singh\Desktop\Final report_CMA\Chapter 5.doc
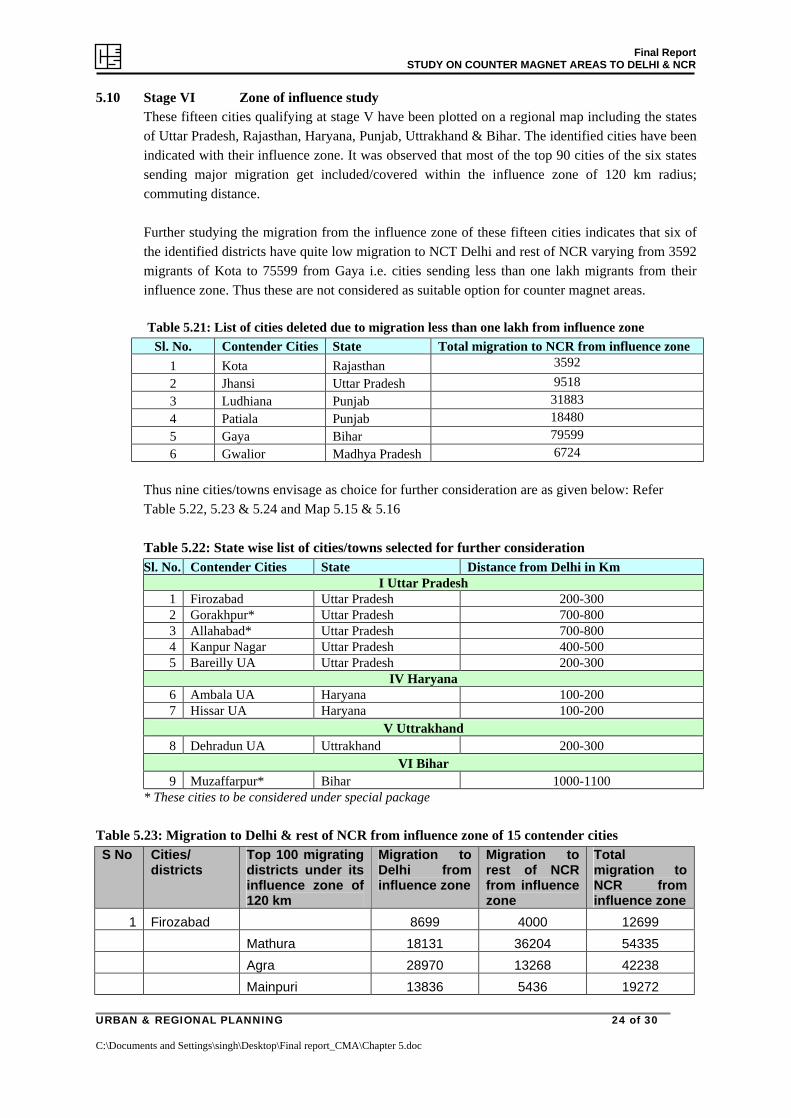
5.10 Stage VI Zone of influence study These fifteen cities qualifying at stage V have been plotted on a regional map including the states of Uttar Pradesh, Rajasthan, Haryana, Punjab, Uttrakhand & Bihar. The identified cities have been indicated with their influence zone. It was observed that most of the top 90 cities of the six states sending major migration get included/covered within the influence zone of 120 km radius; commuting distance. Further studying the migration from the influence zone of these fifteen cities indicates that six of the identified districts have quite low migration to NCT Delhi and rest of NCR varying from 3592 migrants of Kota to 75599 from Gaya i.e. cities sending less than one lakh migrants from their influence zone. Thus these are not considered as suitable option for counter magnet areas.
Table 5.21: List of cities deleted due to migration less than one lakh from influence zone
Sl. No. Contender Cities State Total migration to NCR from influence zone 1 Kota Rajasthan 3592 2 Jhansi Uttar Pradesh 9518 3 Ludhiana Punjab 31883 4 Patiala Punjab 18480 5 Gaya Bihar 79599 6 Gwalior Madhya Pradesh 6724
Thus nine cities/towns envisage as choice for further consideration are as given below: Refer Table 5.22, 5.23 & 5.24 and Map 5.15 & 5.16 Table 5.22: State wise list of cities/towns selected for further consideration Sl. No. Contender Cities State Distance from Delhi in Km
I Uttar Pradesh 1 Firozabad Uttar Pradesh 200-300 2 Gorakhpur* Uttar Pradesh 700-800 3 Allahabad* Uttar Pradesh 700-800 4 Kanpur Nagar Uttar Pradesh 400-500 5 Bareilly UA Uttar Pradesh 200-300
IV Haryana 6 Ambala UA Haryana 100-200 7 Hissar UA Haryana 100-200
V Uttrakhand 8 Dehradun UA Uttrakhand 200-300
VI Bihar 9 Muzaffarpur* Bihar 1000-1100
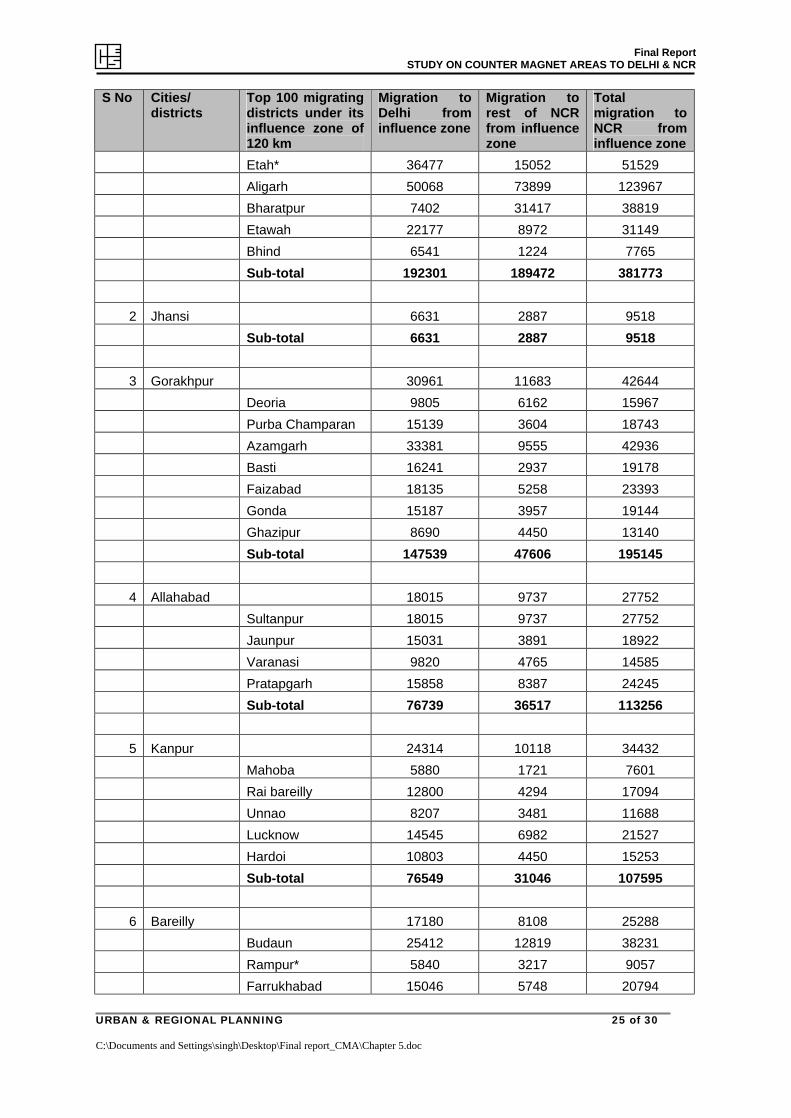
* These cities to be considered under special package Table 5.23: Migration to Delhi & rest of NCR from influence zone of 15 contender cities S No Cities/
districts Top 100 migrating districts under its influence zone of 120 km
Migration to Delhi from influence zone
Migration to rest of NCR from influence zone
Total migration to NCR from influence zone
1 Firozabad 8699 4000 12699 Mathura 18131 36204 54335 Agra 28970 13268 42238 Mainpuri 13836 5436 19272
Final Report STUDY ON COUNTER MAGNET AREAS TO DELHI & NCR
URBAN & REGIONAL PLANNING 25 of 30 C:\Documents and Settings\singh\Desktop\Final report_CMA\Chapter 5.doc
S No Cities/ districts
Top 100 migrating districts under its influence zone of 120 km
Migration to Delhi from influence zone
Migration to rest of NCR from influence zone
Total migration to NCR from influence zone
Etah* 36477 15052 51529 Aligarh 50068 73899 123967 Bharatpur 7402 31417 38819 Etawah 22177 8972 31149 Bhind 6541 1224 7765 Sub-total 192301 189472 381773
2 Jhansi 6631 2887 9518 Sub-total 6631 2887 9518
3 Gorakhpur 30961 11683 42644 Deoria 9805 6162 15967 Purba Champaran 15139 3604 18743 Azamgarh 33381 9555 42936 Basti 16241 2937 19178 Faizabad 18135 5258 23393 Gonda 15187 3957 19144 Ghazipur 8690 4450 13140 Sub-total 147539 47606 195145
4 Allahabad 18015 9737 27752 Sultanpur 18015 9737 27752 Jaunpur 15031 3891 18922 Varanasi 9820 4765 14585 Pratapgarh 15858 8387 24245 Sub-total 76739 36517 113256
5 Kanpur 24314 10118 34432 Mahoba 5880 1721 7601 Rai bareilly 12800 4294 17094 Unnao 8207 3481 11688 Lucknow 14545 6982 21527 Hardoi 10803 4450 15253 Sub-total 76549 31046 107595
6 Bareilly 17180 8108 25288 Budaun 25412 12819 38231 Rampur* 5840 3217 9057 Farrukhabad 15046 5748 20794

Final Report STUDY ON COUNTER MAGNET AREAS TO DELHI & NCR
URBAN & REGIONAL PLANNING 26 of 30 C:\Documents and Settings\singh\Desktop\Final report_CMA\Chapter 5.doc
S No Cities/ districts
Top 100 migrating districts under its influence zone of 120 km
Migration to Delhi from influence zone
Migration to rest of NCR from influence zone
Total migration to NCR from influence zone
Shahjahanpur 6763 2798 9561 Etah* 36477 15052 51529 Sub-total 106718 47742 154460
7 Kota 2202 1390 3592 Sub-total 2202 1390 3592
8 Gwalior 4692 2032 6724 Sub-total 4692 2032 6724 9 Ambala 4548 4309 8857
Mujaffarnagar* 25180 70993 96173 Saharanpur* 8993 12269 21262 Karnal 5725 18754 24479 Panipat 7085 37175 44260 Chandigarh* 6700 5897 12597 Sub-total 58231 149397 207628
10 Hissar 6894 11740 18634 Jind 7573 22649 30222 Bhiwani 8016 25324 33340 Rewari 7448 29214 36662 Sub-total 29931 88927 118858
11 Dehradun 9764 4883 14647 Tehri Garwal 7066 1731 8797 Pauri Garwal 31506 11295 42801 Bijnor* 19217 10643 29860 Mujaffarnagar* 25180 70993 96173 Saharanpur* 8993 12269 21262 Sub-total 101726 111814 213540
12 Ludhiana 7179 3479 10658 Jalandhar 6056 2572 8628 Chandigarh* 6700 5897 12597 Sub-total 19935 11948 31883
13 Patiala 3363 2520 5883 Chandigarh* 6700 5897 12597

Final Report STUDY ON COUNTER MAGNET AREAS TO DELHI & NCR
URBAN & REGIONAL PLANNING 27 of 30 C:\Documents and Settings\singh\Desktop\Final report_CMA\Chapter 5.doc
S No Cities/ districts
Top 100 migrating districts under its influence zone of 120 km
Migration to Delhi from influence zone
Migration to rest of NCR from influence zone
Total migration to NCR from influence zone
Sub-total 10063 8417 18480
14 Muzaffarpur 25930 3813 29743 Sitamarhi 19744 2741 22485 Madhubani 42299 8180 50479 Darbanga 38842 7601 46443 Saharsa 9206 2053 11259 Khagaria 7419 2170 9589 Munger 9340 6575 15915 Samastipur 28533 6665 35198 Begusarai 14972 3653 18625 Patna 31903 12755 44658 Vaishali 11101 2699 13800 Siwan 21743 12266 34009 Gopalganj 7150 5157 12307 Ballia 13175 8939 22114 Sub-total 281357 85267 366624
15 Gaya 13028 3981 17009 Nalanda 12798 6378 19176 Chatra 32202 2068 34270 Ranchi 7140 2004 9144 Sub-total 65168 14431 79599
* Cities overlapping within the influence zone of other CMA’s
Table 5.24: Migration tackled by shortlisted cities/towns in descending order S No Cities/districts No of districts covered
under the influence zone of 120 km
Migration to Delhi from influence zone
Migration to rest of NCR from influence zone
Total migration to NCR from influence zone
1 Firozabad 8 192301 189472 381773 2 Muzaffarpur 13 281357 85267 366624 3 Dehradun 5 101726 111814 213540 4 Ambala 5 58231 149397 207628 5 Gorakhpur 7 147539 47606 195145 6 Bareilly 5 106718 47742 154460 7 Hissar 3 29931 88927 118858 8 Allahabad 4 76739 36517 113256 9 Kanpur 5 76549 31046 107595
Total 55 1071091 787788 1858879 Total migration 2172760 2548128 4720888 Migration tacked by 9 short listed cities/towns in percentage 49.30 30.92 39.38

Final Report STUDY ON COUNTER MAGNET AREAS TO DELHI & NCR
URBAN & REGIONAL PLANNING 28 of 30 C:\Documents and Settings\singh\Desktop\Final report_CMA\Chapter 5.doc
5.11 Stage VII Development index study Two development indexes have been studied for final selection of cities as proposed CMA’s. These indexes are explained below: (i) Infrastructure development index of CMIE The Centre for Monitoring of Indian Economy (CMIE) have prepared profile for districts and worked out infrastructure development index considering seven sectors i.e. Transport, facilities, energy, irrigation facilities, banking, communication facilities, education facilities and health facilities with weightage as given below:
• The indicators used in each of the broad sectors were: 1. Villages electrified 2. Railway route per 100 sq. km. of area 3. Surfaced roads per 100 sq. km. of area 4. Unsurfaced roads per 100 sq. km. of area 5. Gross irrigated area as % of gross cropped area 6. Bank branches per lakh of population 7. Post offices per lakh of population 8. Telephone lines per 100 persons 9. Primary schools per lakh of population 10. Hospital beds per lakh of population 11. Primary health centers per lakh of population
Relative index has been computed as follows: Xij = value of the ith indicator for the jth state/district XiA = value of the ith indicator for all India Yij = 100 * Xij / XiA is the transformed value for the ith indicator for the jth state/district Let wi = weights for the ith indicators such that Sum (wi) for all i is 1 The infrastructure index for the jth state/district denoted by Ij is defined as Ij = Sum (wi*Yij) for all i (ii) Development index of Ministry of Finance Ministry of Finance prepared all India Gradation list by giving total weightage of 1500 to three type of parameters as explained below:
Table 5.25: Type of Parameters for Development Index
Sector Weight (%) Transport facilities 26 Energy 24 Irrigation facilities 20 Banking facilities 12 Communication facilities 6 Educational facilities 6 Health facilities 6
Sr No. Type of parameters All India weighted index I Financial Parameters 500 • Per capita credit 300 • Per capita deposit 200 II Infrastructure 500 • Urbanization 100 • Phone per 1000 100 • Per capita power 200 • Road per 100 sq km 100 III Industrial 500 • Factory workers per 1000 300 • Per capita GVA from manufacturing 200

Final Report STUDY ON COUNTER MAGNET AREAS TO DELHI & NCR
URBAN & REGIONAL PLANNING 29 of 30 C:\Documents and Settings\singh\Desktop\Final report_CMA\Chapter 5.doc
Finally to select the proposed CMA’s on the basis of their economic potential, in addition to the composite infrastructure index compiled by the Centre for Monitoring of the Indian Economy (CMIE), the consultants have also applied development index published by Ministry of Finance1. Cities/towns selected in the previous stage have been studied with respect to composite infrastructure development index and development index. Refer table 5.26 & Map 5.17
Table 5.26: Development Index for ten selected CMA’s
Sr No City/Town Infrastructure Development Index of CMIE Development index of Ministry of Finance 1 Ambala 129 2301 2 Bareilly 108 1005 3 Dehradun 118 2707 4 Firozabad 118 1033 5 Hissar 141 1111 6 Kanpur Nagar 124 3388 7 Gorakhpur 84 675 8 Allahabad 101 887 9 Muzaffurpur 97 377
Refer Annexure VII for development index published by MOF
It is observed that two districts i.e. Gorakhpur & Muzaffarpur have very low infrastructure development index (less than 100) while Allahabad is marginally with 101 score. These three districts also have low development index published by MOF (less than 1000). As the available infrastructure and development potential is of low level, these three cities may not be taken up as CMA’s. The immediate priority for these cities would be upgradation of physical and social infrastructure by giving a special package.
Considering various aspects six cities that emerged in final selection as Counter Magnet Areas for immediate development are: (Refer Map no 5.17).
1 Ambala ( Haryana) 2 Bareilly (Uttar Pradesh) 3 Dehradun (Uttrakhand) 4 Firozabad (Uttar Pradesh) 5 Hissar (Haryana) 6 Kanpur Nagar (Uttar Pradesh) The emerged counter magnet areas are located in all directions of high migration with respect to NCTD.
5.12 Inputs from the Workshop
In a workshop held on the subject it was stated that Firozabad is a part of Taj Trapezium Zone (TTZ) and is environmentally sensitive area. Thus, bringing more industries to this area would be difficult. In view of this, Firozabad has been deleted from the final list of proposed CMAs. (Refer Map no 5.18).
The selected counter magnet areas are well distributed sending major migration to Delhi. The proposed CMA’s are located as following: (Refer table 5.27) v 2 proposed CMA’s are located within 100-200 km; v 2 CMA’s within 200-300 km and; v 1 CMA’s within 400-500 km
1 Gazette of India Extraordinary Part II, Section 3 (ii), 1997 {F.No.142/20/94-TPL/No.10403}

Final Report STUDY ON COUNTER MAGNET AREAS TO DELHI & NCR
URBAN & REGIONAL PLANNING 30 of 30 C:\Documents and Settings\singh\Desktop\Final report_CMA\Chapter 5.doc
Table 5.27: Grouping of cities/towns qualifying selection criteria Sl. No. Contender Cities State Distance from Delhi in Km Population in 2001
Group I Existing CMA’s 1 Hissar Haryana 100-200 263186 2 Bareilly Uttar Pradesh 200-300 748353
Group II Proposed New CMA’s 3 Kanpur Nagar Uttar Pradesh 400-500 2715555 4 Ambala* Haryana 100-200 307595 5 Dehradun* Uttrakhand 200-300 530263 * Firozabad, Ambala & Dehradun are also recommended by the concerned state governments
Five proposed CMA’s covers 24 districts within their influence zone and have the potential to tackle 8,02,081 persons migrated to NCR including NCT Delhi during the previous decade i.e. 1991-2001. Refer Table 5.28
Table 5.28: No of cities/towns from top 100 migrating districts and other cities Sl No.
Classification/category of districts sending migrants to Delhi
No. (Proposed CMA’s)
No of top 100 districts within the influence zone
Total migration from influence zone to NCR including NCTD
1 Among top 20-40 districts 2 (Kanpur & Bareilly) 10 262055 2 Among top 40-60 districts 1 (Dehradun) 5 213540 3 Among top 60-80 districts 1 (Hissar) 3 118858 4 Among top 80-100 districts 1 (Ambala) 6 207628 Total 5 24 802081
5.13 Recommendation for Allahabad, Gorakhpur & Muzaffarpur – Special Package These three cities are located on specific road and rail corridor. Gorakhpur and Muzaffarpur are located on east-west corridor while Allahabad is located on Golden Quadrangle. Therefore their regional/national connectivity will be improved due to the development of these important corridors while there is requirement for upgradation of basic infrastructure. Allahabad is already covered under JNNURM scheme for upgradation/strengthening of existing basic infrastructure. Considering substantial migration to Delhi & NCR from the influence zone of Gorakhpur & Muzaffarpur and having very low level of available infrastructure, there is immediate need for upgradation of existing physical & social infrastructure (including connectivity). In view of this, it is recommended to consider Gorakhpur & Muzaffarpur at par with JNNURM scheme for upgradation of existing infrastructure. In addition to their consideration, these cities should also be given special package (i.e. grant/loan) from the Ministry of urban development or given priority in the five year plan prepared by the Central/State Government.
5.14 Recommendation for Patiala, Gwalior and Kota
Patiala, Gwalior and Kota are three existing counter magnet areas not included in the list of proposed counter magnet areas being located in the areas sending very low level of migration. These are also not in the top 100 districts sending major migration to Delhi and NCR. Moreover, Patiala is not on the selected transport major corridor. It is suggested that these should be phased out by completing the projects in operation in regard to special assistance as CMA’s and pave way for other more important to be included as CMA’s.