test of momentum investment strategy for the insurance ...charvey/teaching/663_2014/nava/na… ·...
TRANSCRIPT
Test of Momentum Investment Strategy
For the Insurance Industry in the U.S.
Finance 663
Prepared by:
Derek Song
(Locker#552)
German Hurtado
Mustafa Jalil Qureshi
Rodrigo De La Maza

Momentum Investment
Page 2 of 21
Abstract
The objective of this paper was to confirm our hypothesis about momentum investing in US insurance
industry. We analyzed stock return data of companies from 2001 to 2012 for empirical evidence to
evaluate our hypothesis. This strategy, “FxH” consists of longing stocks that have performed well in the
past and shorting stocks that have performed poorly in the past, therefore generating significant positive
returns over 3-, 6- and 12-month holding periods. Our research findings show that employing momentum
investing in US Insurance industry can lead to a return of approximately 28.92 % in a year. We also show
that the profitability of this strategy is not due to the systematic risk. Finally, this is in line with the
research result findings suggested by Jegadessh and Titman (1993)
1. Executive Summary
Momentum is the tendency of investments to persist in their relative performance. Assets that perform
well over a 3 to 12 month period tend to continue to perform well into the future. Investors, employing
momentum strategy, tend to invest only in top performing stocks at a given time. Momentum strategy
investors don’t rely on diversification of their portfolio to manage risk-return equilibrium. Instead they
continue switching their stocks by investing in the top performers and offloading poor performers. This
may require continuous adjustment to the portfolio held by the investor to continue to hold the most
popular and better performing stock.
However, the economists struggle to explain the phenomenon based on the efficient market system. Such
returns, given a perfect market with asymmetrical information, should not exist. This has resulted in two
popular explanations for the gains from this strategy. Some analysts argue that return from momentum
investment is due to the excessive risks taken by the investors, while others suggest that investors benefit
from the herd mentality, lead lag, over and under reaction, and confirmation bias of other investors in the
market. As a matter of fact, near zero-beta portfolios have been created in the past, which have been
found to produce superior absolute returns - much higher than risk free rate of return. Momentum profits
have thus remained an anomaly in the markets and provide fund managers with an excellent opportunity
to create beta-neutral, superior-return portfolios.
Over the past two decades, many studies on momentum investment strategies have been undertaken in
Global markets. The momentum effect of Jegadeesh and Titman (1993) is one the most recognized one
analyzing this issue. Other researchers have proved its existence in U.S. stocks (Fama and French (2008)),
in industries (Moskowitz and Grinblatt (1999), in styles (Lewellen (2002), (2004)), in foreign stocks

Momentum Investment
Page 3 of 21
(Rouwenhorst (1998), Chan, Hameed and Tong (2000), in emerging markets (Rouwenhorst (1999)), in
country indices (Fama and French (2011)), in commodities, Miffre and Rallis (2007)), and also in
currencies (Menkoff, Sarno, Schmeling, and Schrimpf (2011)), Since its first publication, momentum has
been shown to work going forward in time (Grundy and Martin (2001).
There is an obvious fact that nutshell momentum investors are guided by the asset performance and not
by the type of the asset or the industry. Whichever instrument or industry is trending, momentum
investors rally behind it. However, due to few studies having not been done on a specific sector of the U.S.
equity market, we will try to focus on the application of this strategy in a particular industry (Insurance)
to gauge the effectiveness of the strategy. We have employed a methodology used commonly by
researchers studying momentum investment strategies and sample for the study consists of all stocks of
insurance companies issued publically in the U.S. for the period 2001 to 2012. Moreover, we do not
consider the size of companies or liquidity of stocks because of lack of related data. Nevertheless, we are
satisfied with the results we found.
After carrying out the analyses, we were able to find very relevant results. First, the insurance industry in
the U.S is a pretty good investment target in order to implement this long-short momentum investment
strategy. The average accumulative return during 12-month or one year by using this trading strategy is
about 28.92%. This figure is better than the return obtained by using a passive investment strategy
investing index or ETF. Second, the optimal formation period in this industry during 2001 – 2012 is 6
months and holding period is 12 months. Third, this paper also provides some evidences that this trading
strategy works well in both market downturn and upturn.
2. Analysis on why insurance sector
There are different considerations that we took into account when deciding which sector we should use to
properly test the theory behind momentum investment. Based on the type of analysis that we planned to
carry out, we found critical to choose a sector with enough historical data as to be able to be confident
that the results that we found were reliable. The insurance sector in the United States serves that purpose;
we have enough data, which is easily accessible and consistent throughout the period considered.
Moreover, the large number of companies listed in the U.S. allows us to have a uniform number of
players in the sample, and with this, we make sure that the industry is mature enough to remain unaffected
by the entrance of new participants in the market. Also, it provides an additional advantage because we
can analyze and determine whether there is a distinctive performance, in terms of momentum or reversal

Momentum Investment
Page 4 of 21
performance, in companies with different sizes (i.e. market capitalization or revenues) and liquidity
patterns.
Furthermore, we considered as an important factor that the insurance sector usually had a more consistent
and predictable performance, when compared with other industries publicly listed in the U.S. In general
terms, the insurance sector has a low beta (as seen in Graph 1.) and the stock performance of companies
in this universe is not as volatile and susceptible to drastic fundamental changes as it is in the case of
other industries. We understand that the momentum investment theory does not rely on fundamental
figures underlying these companies but rather on the technical aspect of its performance, consequently,
the insurance sector allow us to better analyze the momentum investment theory without the noise or
distortions of fundamental variables.
Graph. 1. Leveraged Beta for selected industries in the U.S. (NYU Stern – Damodaran)
Similarly, we also found that even though the sector had a more predictive behavior, the companies
within the sector were driven by very different variables and had very distinctive performances during the
period analyzed, a condition that we consider critical in order to test the momentum investment theory.
Finally, the stock market in the U.S. is the most developed globally, a large amount of information is
equally available among investors and therefore, there should not be considerable information gaps
among market participants and distortions in the information reflected in the historical prices should be
not significant.
0.92
00.20.40.60.8
11.21.41.61.8
Advert
isin
g
Appa
rel
Bank
Bevera
ge
…
Bro
ke
rage &
…
Ca
ble
TV
Co
nstr
uction
Ele
ctr
on
ics
Environ
men
tal &
…
Foo
d P
roce
ssin
g
He
althcare
…
He
avy…
Ho
useho
ld…
Inte
rnet…
Me
tals
& M
inin
g
Packa
gin
g &
…
Pow
er
R.E
.I.T
.
Re
cre
atio
n
Re
tail
(Gene
ral)
Ship
build
ing &
…
Tob
acco
Utilit
y (
Ge
nera
l)
Average

Momentum Investment
Page 5 of 21
3. Methodology
3.1 Data Collection
Adjusted monthly return1 of the stocks on insurance industry was obtained from the CRSP database
2. The
sample period related to this study includes the period Between [January-2001 and December-2012].
Specifically, we have chosen such period as it includes two major ups and downs in the U.S. equity
markets over the last decade: the first cycle involves the stock market (High Tech) slump between 2001
and 2003 and its corresponding rebound between 2003 and 2007. The second cycle includes the great
depression (Financial Industry) between 2007 and 2009 and its recovery between 2009 and 2012.
3.2 Trading Strategy
In order to test the hypothesis, we test momentum opportunities by using a [F x H] strategy. Specifically,
this strategy is based on selecting stocks considering their past returns3 over “F” months (Formation
Period) and holding them for “H” subsequent months (Holding Period). With that, at the beginning of
each month “t”, all stocks from the sample are ranked on the basis of their accumulative returns over that
past “F” months or Formation Period. As a result, the portfolio strategy is based on: i) simultaneously
buying an equally weighted portfolio of the top ten performing stocks (namely Winners) and selling
(shorting) an equally weighted of the bottom ten (namely Losers) and; ii) Holding this [Winner-Loser]
portfolio for H months.
To test the momentum trading strategy for US insurance market we used overlapping portfolios.
Jegadeesh and Titman (1993, 2001) suggest that using overlapping portfolios (moving averages) provides
more robust results. Hence, in order to test any [F x H] specific strategy, for any given portfolio selected
in month “n” within our sample with a formation period Fn, the following portfolio to be selected should
be in month “n + 1” with a formation period Fn + 1 and so on. For instance, in a [6 x 12] strategy, the first
portfolio should be created in July-2001, with a formation period between [January-2001 to June-2001];
consequently, the second portfolio within the test should be selected as of August 2001 with a respective
formation period between [February-2001 to July-2001] and so on. Consequently, for this specific
strategy we must test the returns of 126 different portfolios formed throughout the sample period.
1 -A Return is the change in the total value of an investment in a security over some period of time per dollar of initial investment.
Total Return is the Holding Period Total Return for a sale of a security on the given day, taking into account and reinvesting all
distributions to shareholders. It is based on a purchase on the most recent time previous to this day when the security had a valid
price. Usually, this time is the previous calendar period, but may be up to ten calendar periods prior to the calculation. 2 http://www.crsp.com/products/documentation/crsp-calculations 3 Stock returns are measured monthly on adjusted monthly price of the companies by using the formula (Pn/Pn-1) -1where Pn
and Pn-1 are the adjusted closing prices of the last trading day of the two relevant months.

Momentum Investment
Page 6 of 21
3.3 Step by Step Analysis:
1) Portfolio Creation:
a. [CR] = Cumulative Returns = CR[F x H] = (P1/P0)-1 + (P2/P1)-1 + (P3/P2)-1+ … +(PF/PF-1)-1;
where P is the adjusted monthly closing stock price.
b. Rank CR from the sample and define top and bottom performing ten (Winners-Losers).
c. Create an equally weighted portfolio going long Winners and short Losers.
d. Hold the selected portfolio for “H” months (Winners-Losers).
e. This is done on a monthly basis and the step is repeated (144 – (F + H)) times for the
period chosen in our sample.
2) Holding Period Performance:
a. [R] = Calculate month-on-month returns for all winner and loser portfolios (separately)
for each of the (144 – (F + H)) particular months during the holding period “H”.
RANK (R(1,1), R(1,2), R(1,3),……, R(H, (144 – (F + H)))).
b. [AR] = Calculate Average Return of (144 – (F + H)) portfolios for each month during
Holding Period “H”.
ARt, = [R(t,1), R(t,2), ….., R(t, (144 – (F + H)))] / (144 – (F + H));
where t = any of the “H” Holding months.
c. [CAR] = Cumulative Average Return of (144 – (F + H)) portfolios for each month of the
Holding Period “H”.
CAR c,n = AR1,n + AR2,n + ……. + ARc,n; where “c” is any of the “H” Holding
months until we want to calculate the cumulative return of the portfolio and; “n”
any of the (144 – (F + H)) ARs portfolios analyzed from the sample.
d. [MCAR] = Mean Cumulative Average Returns of (144 – (F + H)) portfolios during each
month of the Holding Period “H”.
MCAR t = [CARc,1 + CARc,2 + ……. + ARc,(144 – (F + H))] / (144 – (F + H)); where “c”
is any of the “H” Holding months until we want to calculate the cumulative
return of the portfolio.

Momentum Investment
Page 7 of 21
e. [MAR] = Mean Average Returns of (144 – (F + H)) portfolios during each month of the
Holding Period “H”.
MAR t = [ARt,1 + ARt,2 + ……. + ARt,(144 – (F + H))] / (144 – (F + H)); where “t” is
any of the “H” Holding months until we want to calculate the cumulative return
of the portfolio.
3.4 Definitions of AR, CAR, MCAR and MAR
N
i
tiARN
tWAR1
,*)1
(),(
N
i
tiARN
tLAR1
,*)1
(),(
t
i
tWARtWCAR1
),(),(
t
i
tWARtLCAR1
),(),(
K
i
t iWCARK
tWMCAR1
),(*1
),(
K
i
t iWCARK
tLMCAR1
),(*1
),(
K
i
t iWARK
tWMAR1
),(*1
),(
K
i
t iWARK
tWMAR1
),(*1
),(
Where N is number of stocks in each portfolio when t= 1 to 12
K = number of times test repetition
3.5 [Winner-Losers] Return Test
This specific test of performance indicates, on average, how much potential cumulated return could
generate your [Winner-Losers] portfolio.
If markets are efficient, the [Long-Winners] portfolio cumulative return should be offset by the [Short-
Losers] portfolio cumulative return throughout the holding period. However, if that’s not the case, our
momentum hypothesis implies that:
[Long-Winners] - [Short-Losers] > 0
4. Result and Analysis
In particular, we will use MCAR and MAR tests to find the optimal trading strategy.
Momentum Investment
Page 8 of 21
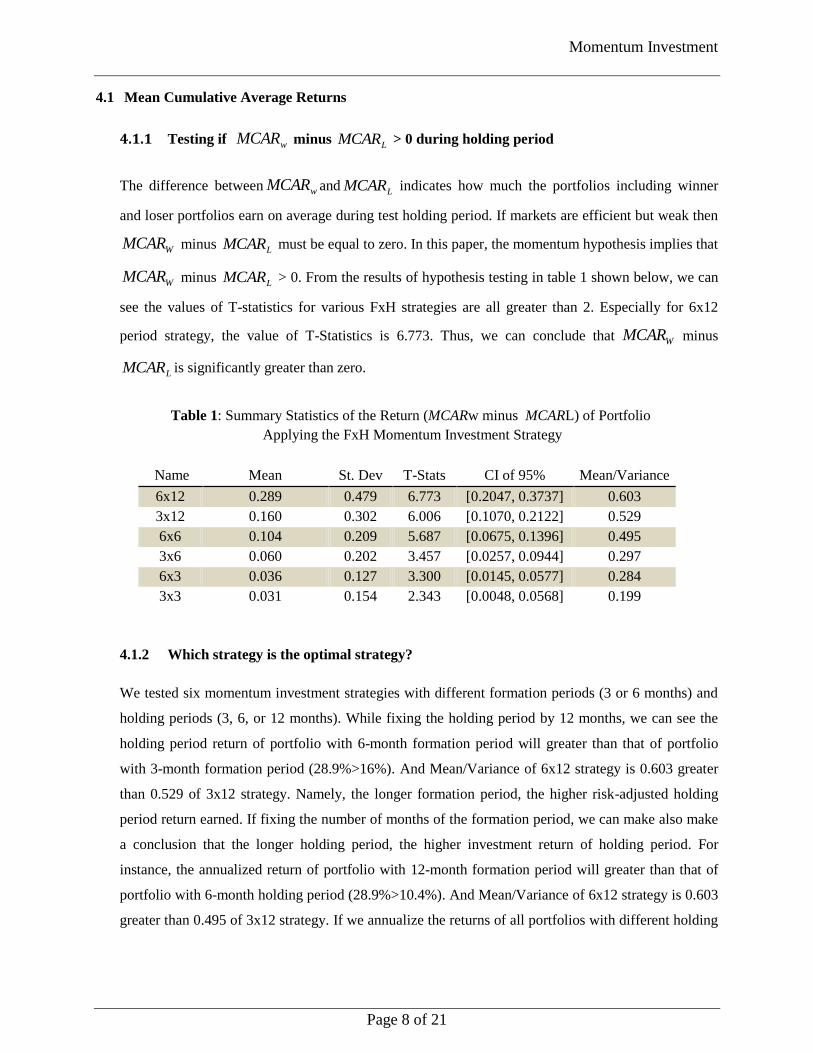
4.1 Mean Cumulative Average Returns
4.1.1 Testing if minus > 0 during holding period
The difference between wMCAR and LMCAR indicates how much the portfolios including winner
and loser portfolios earn on average during test holding period. If markets are efficient but weak then
WMCAR minus LMCAR must be equal to zero. In this paper, the momentum hypothesis implies that
WMCAR minus LMCAR > 0. From the results of hypothesis testing in table 1 shown below, we can
see the values of T-statistics for various FxH strategies are all greater than 2. Especially for 6x12
period strategy, the value of T-Statistics is 6.773. Thus, we can conclude that WMCAR minus
LMCAR is significantly greater than zero.
Table 1: Summary Statistics of the Return (MCARw minus MCARL) of Portfolio
Applying the FxH Momentum Investment Strategy
Name Mean St. Dev T-Stats CI of 95% Mean/Variance
6x12 0.289 0.479 6.773 [0.2047, 0.3737] 0.603
3x12 0.160 0.302 6.006 [0.1070, 0.2122] 0.529
6x6 0.104 0.209 5.687 [0.0675, 0.1396] 0.495
3x6 0.060 0.202 3.457 [0.0257, 0.0944] 0.297
6x3 0.036 0.127 3.300 [0.0145, 0.0577] 0.284
3x3 0.031 0.154 2.343 [0.0048, 0.0568] 0.199
4.1.2 Which strategy is the optimal strategy?
We tested six momentum investment strategies with different formation periods (3 or 6 months) and
holding periods (3, 6, or 12 months). While fixing the holding period by 12 months, we can see the
holding period return of portfolio with 6-month formation period will greater than that of portfolio
with 3-month formation period (28.9%>16%). And Mean/Variance of 6x12 strategy is 0.603 greater
than 0.529 of 3x12 strategy. Namely, the longer formation period, the higher risk-adjusted holding
period return earned. If fixing the number of months of the formation period, we can make also make
a conclusion that the longer holding period, the higher investment return of holding period. For
instance, the annualized return of portfolio with 12-month formation period will greater than that of
portfolio with 6-month holding period (28.9%>10.4%). And Mean/Variance of 6x12 strategy is 0.603
greater than 0.495 of 3x12 strategy. If we annualize the returns of all portfolios with different holding
wMCARLMCAR
Momentum Investment
Page 9 of 21
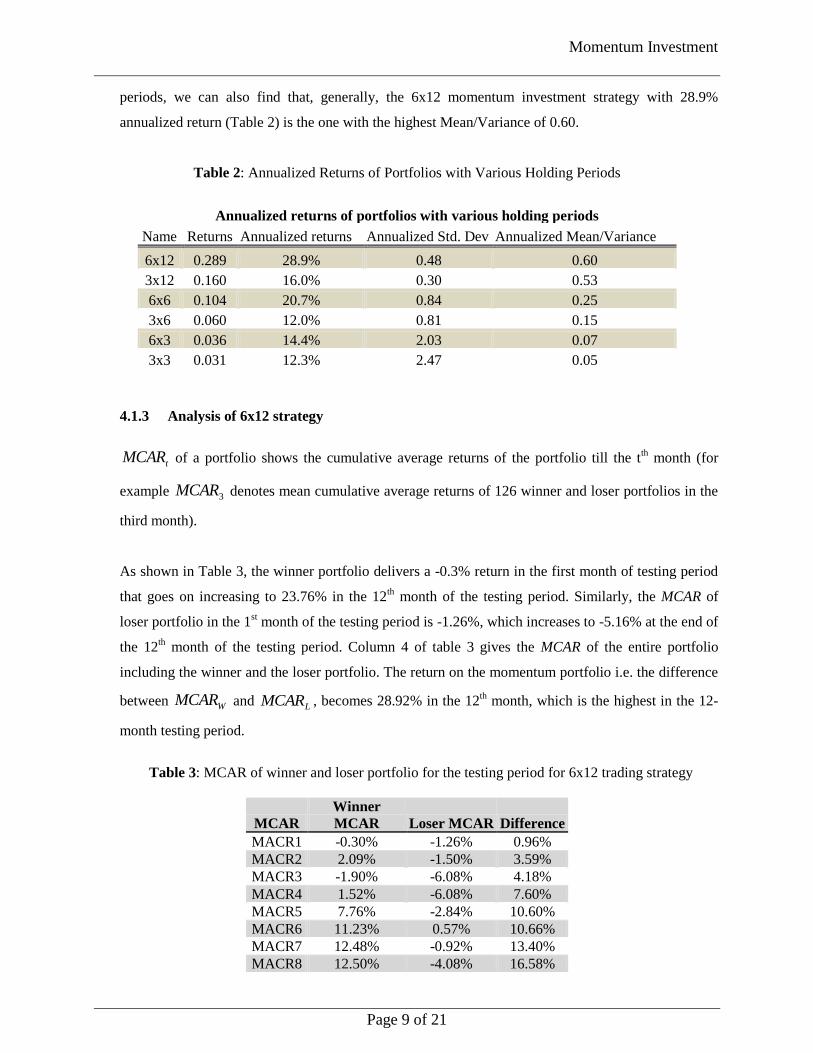
periods, we can also find that, generally, the 6x12 momentum investment strategy with 28.9%
annualized return (Table 2) is the one with the highest Mean/Variance of 0.60.
Table 2: Annualized Returns of Portfolios with Various Holding Periods
Annualized returns of portfolios with various holding periods
Name Returns Annualized returns Annualized Std. Dev Annualized Mean/Variance
6x12 0.289 28.9% 0.48 0.60
3x12 0.160 16.0% 0.30 0.53
6x6 0.104 20.7% 0.84 0.25
3x6 0.060 12.0% 0.81 0.15
6x3 0.036 14.4% 2.03 0.07
3x3 0.031 12.3% 2.47 0.05
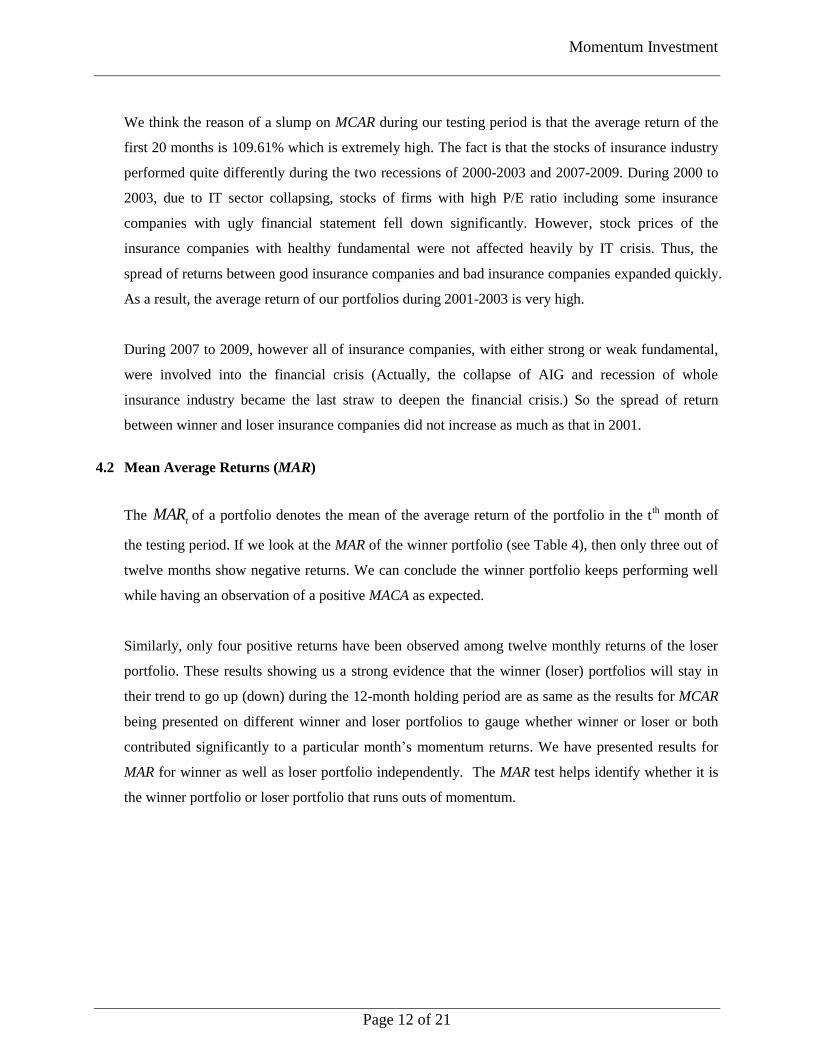
4.1.3 Analysis of 6x12 strategy
tMCAR of a portfolio shows the cumulative average returns of the portfolio till the t
th month (for
example 3MCAR denotes mean cumulative average returns of 126 winner and loser portfolios in the
third month).
As shown in Table 3, the winner portfolio delivers a -0.3% return in the first month of testing period
that goes on increasing to 23.76% in the 12th month of the testing period. Similarly, the MCAR of
loser portfolio in the 1st month of the testing period is -1.26%, which increases to -5.16% at the end of
the 12th month of the testing period. Column 4 of table 3 gives the MCAR of the entire portfolio
including the winner and the loser portfolio. The return on the momentum portfolio i.e. the difference
between WMCAR and LMCAR , becomes 28.92% in the 12th month, which is the highest in the 12-
month testing period.
Table 3: MCAR of winner and loser portfolio for the testing period for 6x12 trading strategy
MCAR
Winner
MCAR Loser MCAR Difference
MACR1 -0.30% -1.26% 0.96%
MACR2 2.09% -1.50% 3.59%
MACR3 -1.90% -6.08% 4.18%
MACR4 1.52% -6.08% 7.60%
MACR5 7.76% -2.84% 10.60%
MACR6 11.23% 0.57% 10.66%
MACR7 12.48% -0.92% 13.40%
MACR8 12.50% -4.08% 16.58%

Momentum Investment
Page 10 of 21
MACR9 14.31% -2.46% 16.76%
MACR10 25.02% 1.37% 23.66%
MACR11 25.08% -1.26% 26.34%
MACR12 23.76% -5.16% 28.92%
It may be observed from Graph 2, that although the accumulative returns of both loser and winner
portfolio grow throughout the 12-month period, the pace of increase slows down for winner
portfolios from the 6th month to the 9
th month. Even in the 2
nd month and the 10
th to 12
th month, the
MCAR of winner portfolio goes down. It may also be observed that MCAR of loser portfolio almost
remains negative except in 6th and 10
th month. In addition, the range of data we are testing covers
two recessions and two rebounds from Jan. 2001 to Dec 2012. The S&P 500 Index slumped greatly
from 1,300 to 800 and rallied to 1557, and then fell down to 683. Thus, from MCAR test, it becomes
clear that irrespective of the market direction, the difference WMCAR minus LMCAR remains
positive and grows during the 12-month holding period. This indicates that this strategy is market
neutral (i.e. non directional market strategy).
Graph 2: MCAR of winner and loser portfolio for the testing period for 6x12 trading strategy
The fact shown in Graph 3 is that the difference between MCAR of winner and loser portfolio almost
grows consecutively during 12-month holding period. When holding period is extending to 24
months (See Graph 4,) the difference between MCAR of winner and loser portfolio keeps rising up
except slight drops in 16th and 17
th month. However, the 2-year MCAR of portfolio of 6x24 strategy
-10.00%
-5.00%
0.00%
5.00%
10.00%
15.00%
20.00%
25.00%
30.00%
1 2 3 4 5 6 7 8 9 10 11 12
MCAR for Winner and Loser Portfolio for 6x12 Strategy
Winner MCAR Loser MCAR

Momentum Investment
Page 11 of 21
is 50% which is less than 66.2%, the compounding 2-year MCAR of portfolio of 6x12 strategy. So,
we still prefer 6x12 momentum investment strategy rather than 6x24 strategy.
Graph 3: MCAR (w,t) minus MCAR (L,t) over the testing period for 6x12 trading Strategy
Graph 4: MCAR (w,t) minus MCAR (L,t) over the testing period for 6x24 trading Strategy
Honestly, the MCAR of 28.92% of 6x12 trading strategy looks obviously too much high. After all, in
the real world, it looks like not possible to obtain such a good return. We think the main reason
resulting in such a high annual return is that the cumulative returns of first 20 months (first 20
portfolios) are extremely high which has significant impact on our calculation for average returns. If
dropped the first 20 months (Jan. 2001 - Dec. 2003) and recalculated the MCAR of portfolios by
using 6x12 momentum trading strategy, then we had a lower MCAR of 13.7% for the rest portfolios.
It is still a high but reasonable return during the past decade of turbulence.
0.00%
10.00%
20.00%
30.00%
40.00%
50.00%
60.00%
1 3 5 7 9 11 13 15 17 19 21 23
MCAR(w,t) minus MCAR (L,t) for 6x24 Strategy
Difference
Momentum Investment
Page 12 of 21
We think the reason of a slump on MCAR during our testing period is that the average return of the
first 20 months is 109.61% which is extremely high. The fact is that the stocks of insurance industry
performed quite differently during the two recessions of 2000-2003 and 2007-2009. During 2000 to
2003, due to IT sector collapsing, stocks of firms with high P/E ratio including some insurance
companies with ugly financial statement fell down significantly. However, stock prices of the
insurance companies with healthy fundamental were not affected heavily by IT crisis. Thus, the
spread of returns between good insurance companies and bad insurance companies expanded quickly.
As a result, the average return of our portfolios during 2001-2003 is very high.
During 2007 to 2009, however all of insurance companies, with either strong or weak fundamental,
were involved into the financial crisis (Actually, the collapse of AIG and recession of whole
insurance industry became the last straw to deepen the financial crisis.) So the spread of return
between winner and loser insurance companies did not increase as much as that in 2001.
4.2 Mean Average Returns (MAR)
The tMAR of a portfolio denotes the mean of the average return of the portfolio in the tth month of
the testing period. If we look at the MAR of the winner portfolio (see Table 4), then only three out of
twelve months show negative returns. We can conclude the winner portfolio keeps performing well
while having an observation of a positive MACA as expected.
Similarly, only four positive returns have been observed among twelve monthly returns of the loser
portfolio. These results showing us a strong evidence that the winner (loser) portfolios will stay in
their trend to go up (down) during the 12-month holding period are as same as the results for MCAR
being presented on different winner and loser portfolios to gauge whether winner or loser or both
contributed significantly to a particular month’s momentum returns. We have presented results for
MAR for winner as well as loser portfolio independently. The MAR test helps identify whether it is
the winner portfolio or loser portfolio that runs outs of momentum.
Momentum Investment
Page 13 of 21
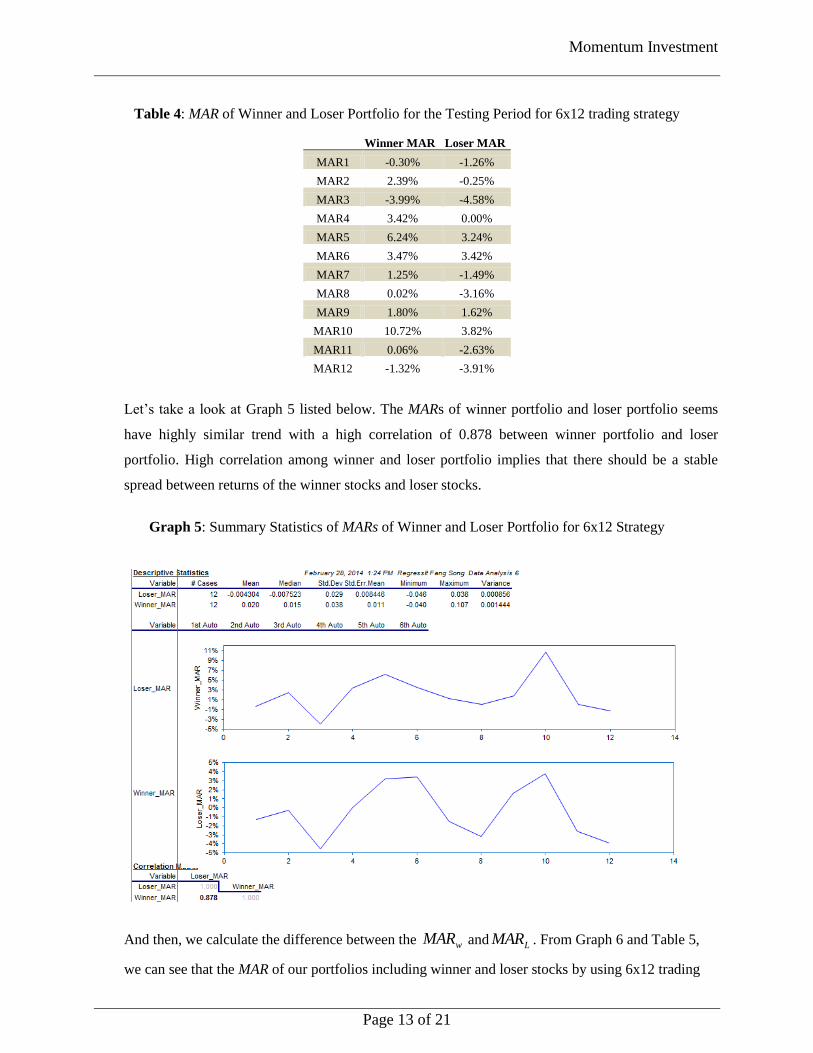
Table 4: MAR of Winner and Loser Portfolio for the Testing Period for 6x12 trading strategy
Winner MAR Loser MAR
MAR1 -0.30% -1.26%
MAR2 2.39% -0.25%
MAR3 -3.99% -4.58%
MAR4 3.42% 0.00%
MAR5 6.24% 3.24%
MAR6 3.47% 3.42%
MAR7 1.25% -1.49%
MAR8 0.02% -3.16%
MAR9 1.80% 1.62%
MAR10 10.72% 3.82%
MAR11 0.06% -2.63%
MAR12 -1.32% -3.91%
Let’s take a look at Graph 5 listed below. The MARs of winner portfolio and loser portfolio seems
have highly similar trend with a high correlation of 0.878 between winner portfolio and loser
portfolio. High correlation among winner and loser portfolio implies that there should be a stable
spread between returns of the winner stocks and loser stocks.
Graph 5: Summary Statistics of MARs of Winner and Loser Portfolio for 6x12 Strategy
And then, we calculate the difference between the wMAR and LMAR . From Graph 6 and Table 5,
we can see that the MAR of our portfolios including winner and loser stocks by using 6x12 trading
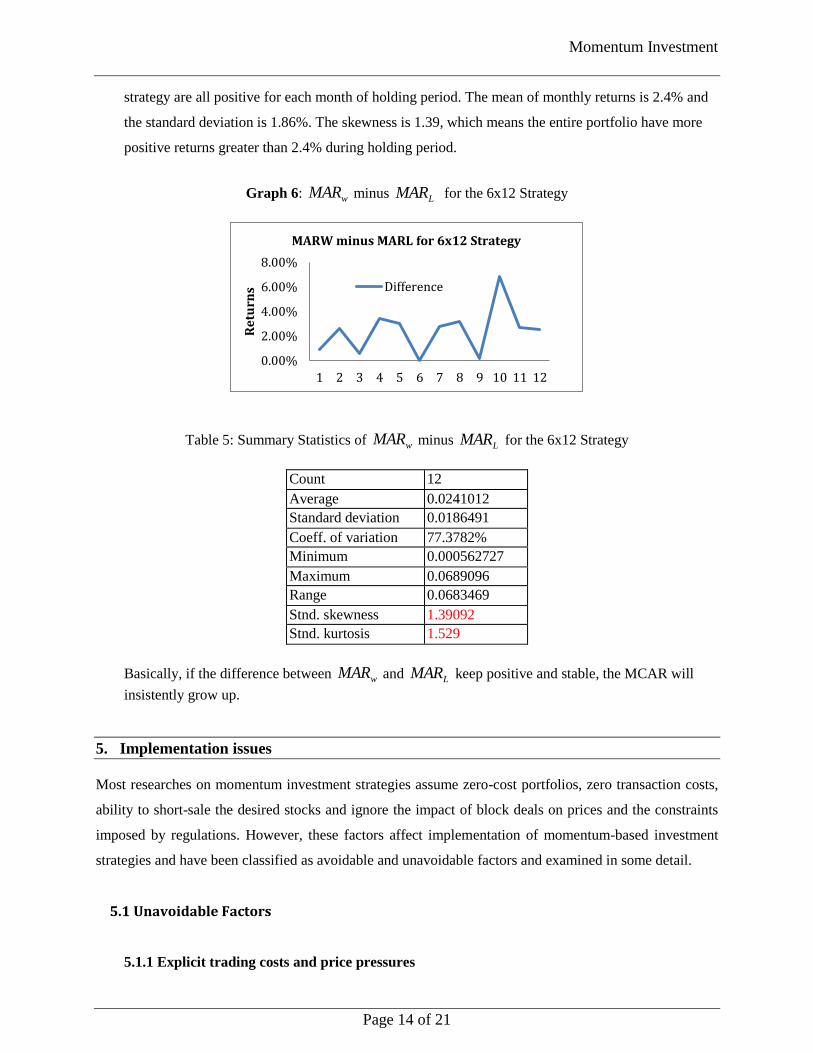
Momentum Investment
Page 14 of 21
strategy are all positive for each month of holding period. The mean of monthly returns is 2.4% and
the standard deviation is 1.86%. The skewness is 1.39, which means the entire portfolio have more
positive returns greater than 2.4% during holding period.
Graph 6: wMAR minus LMAR for the 6x12 Strategy
Table 5: Summary Statistics of wMAR minus LMAR for the 6x12 Strategy
Count 12
Average 0.0241012
Standard deviation 0.0186491
Coeff. of variation 77.3782%
Minimum 0.000562727
Maximum 0.0689096
Range 0.0683469
Stnd. skewness 1.39092
Stnd. kurtosis 1.529
Basically, if the difference between wMAR and LMAR keep positive and stable, the MCAR will
insistently grow up.
5. Implementation issues
Most researches on momentum investment strategies assume zero-cost portfolios, zero transaction costs,
ability to short-sale the desired stocks and ignore the impact of block deals on prices and the constraints
imposed by regulations. However, these factors affect implementation of momentum-based investment
strategies and have been classified as avoidable and unavoidable factors and examined in some detail.
5.1 Unavoidable Factors
5.1.1 Explicit trading costs and price pressures
0.00%
2.00%
4.00%
6.00%
8.00%
1 2 3 4 5 6 7 8 9 10 11 12
Re
turn
s MARW minus MARL for 6x12 Strategy
Difference

Momentum Investment
Page 15 of 21
Use of momentum investment strategies is limited by explicit trading costs and price pressures due to
large trade blocks. Large funds trading on momentum strategy execute block trades; however, the
implicit price pressure costs of such trades reduce the expected returns from this strategy.
5.1.2 Futures market
Futures market provides another mechanism to short an individual stock. Advantages of futures
market include low transaction costs and high liquidity and therefore low impact costs. Roll-over
costs come into picture when a short position has to be maintained beyond three months since the
maturity period for futures contracts is three months.
5.1.3 Short Sale
In short sale, the stock to be shorted is borrowed by the short seller from a lender. In case a stock is
recalled by the lender, the portfolio manager has to take up additional transaction costs to maintain
his short position in the security, which reduces the return of the portfolio. The longer the period of
short position the greater is the probability of the stock being recalled. Thus, the cost of borrowing
stocks and the possibility of the borrowed stock being recalled by the lender makes it difficult for
funds to exploit the short-selling possibilities.
5.2 Avoidable factors
5.2.1 Portfolio weight constraint
According to our long-short momentum investment strategy, there should be at least 20 stocks (10 in
winner portfolio and 10 in loser portfolio) available to invest in insurance sector of the US equity
market. In case the numbers of stocks in the sector we invest in is less than twenty, a reduced number
of stocks to be invested will have to be allowed in our portfolio. It would result in the number of
shares we invest in a specific stock increasing significantly. For example, if only 18 stocks available
to invest in a specific sector. It means that we will have nine stocks each in the winner and a loser
portfolio. In such a case, we need to put more percent in each stock, which may lead to a liquidity
problem, especially for small-cap stocks. This constraint can, however, be avoided by using market
capitalization-weighted investment rather than equal-weighted investment. That means the return of
entire portfolio will be lower in terms of more shares of large-cap being added in.
Momentum Investment
Page 16 of 21
5.2.2 Passive investment characteristics
Our long-short momentum investment strategy merely depends on the statistical figures of stocks in
the market. What fund managers who use this strategy need to do is ranking the stocks based on their
performance. To some extent, it is a passive investment strategy. When the market changes and the
spread between returns of winner and loser portfolios shrinks and even goes to zero, this long-short
momentum trading strategy won’t work. However, portfolio managers can avoid such limitations by
doing a good fundamental analysis to find two groups of stocks with the highest alpha and lowest
alpha respectively. Generally, the stocks with high and positive alpha will perform better than the
market and the stocks with low and negative alpha will perform worse than the market. Actively and
pertinently longing the stocks with high alpha and shorting ones with low alpha will bring excess
returns to the portfolio.
6. Conclusion
There is strong evidence of momentum profit for the short-term formation-test period. For each of the
trading strategies 3x3, 3x6, 3x12, 6x3, 6x6 and 6x12, we found presence of momentum profits. After
comparison, we prefer 6x12 momentum investment strategy as the optimal one implemented in the
American insurance sector. It generates a 28.92% annual return. During the entire period of 12-month
holding period, the trend in momentum does not change very much. The winner and loser portfolio
returns do not converge but broaden. The MCAR of portfolio always grows up during the holding period.
We also approve that this investment strategy does not rely on whether or not the market is booming or
slumping. These results are consistent with those of the seminal studies by Jegadeesh and Titman (1993,
2001) and De Bondt & Thaler (1985, 1987 and 1990) in the US markets. To conclude, the study provides
a strong evidence of short-term profits through the use of momentum strategy.
7. References
Chui A.C.W., Titman S., and Wei K.C.J. (2000). “Momentum, Legal Systems and Ownership
Structure: an Analysis of Asian Stock Markets.” Working paper, Hong Kong University of Science
and Technology.
Chan, Kalak, Allaudeen Hameed and Wilson H.S. Tong, 2000, “Profitability of Momentum Strategies
in International Equity Markets,” Journal of Financial and Quantitative Analysis 35, 153-175.

Momentum Investment
Page 17 of 21
Chen, Hsiu Lang and Werner DeBondt, 2004, “Style Momentum within the S&P 500 Index,” Journal
of Empirical Finance 11, 483-507.
Fama, Eugene F. and Kenneth R. French, 2011, “Size, Value, and Momentum in International Stock
Returns,” working paper.
Grundy, Bruce D and J Spencer Martin, 2001, “Understanding the Nature of the Risks and the
Sources of the Rewards to Momentum Investing,” Review of Financial Studies 14, 29-78.
Hong H. and Stein J.C. (1999). “A Unified Theory of Underreaction, Momentum Trading, and
Overreaction in Asset Markets.” Journal of Finance, 54, pp. 2143-2184. Jegadeesh N. and Titman S. (1993). “Return to Buy Winners and Selling Losers: Implications for
Stock Market Efficiency.” Journal of Finance, 48, pp.65-91.
Lewellen, Jonathen, 2002, “Momentum and Autocorrelation in Stock Returns,” Review of Financial
Studies 15, 533-563.
Mankar, Tejas, 2010, “Test of Momentum Investment Strategy using Constituents of CNX 100 Index”
working paper
Miffre, Joelle and Georgios Rallis, 2007, “Momentum Strategies in Commodity Futures Markets,”
Journal of Banking and Finance 31, 1863-1886.
Rouwenhorst, K. Geert, 1998, “International Momentum Strategies,” Journal of Finance 53, 267-284.

Momentum Investment
Page 18 of 21
8. Appendix:
MCAR 3x3 Trading Strategy
Winner
MCAR
Loser
MCAR Difference
MCAR1 2.55% 1.12% 1.44%
MCAR2 9.06% 8.37% 0.69%
MCAR3 14.04% 10.96% 3.08%
MCAR 3x6 Trading Strategy
Winner
MCAR Loser MCAR Difference
MACR1 2.59% 1.06% 1.53%
MACR2 9.11% 8.34% 0.77%
MACR3 14.14% 10.92% 3.22%
MACR4 13.66% 10.17% 3.49%
MACR5 15.66% 10.01% 5.65%
MACR6 11.95% 5.94% 6.00%
MCAR 3x12 Trading Strategy
Winner
MCAR Loser MCAR Difference
MCAR1 2.80% 1.09% 1.71%
MCAR2 9.38% 8.36% 1.02%
MCAR3 14.67% 10.95% 3.71%
MCAR4 14.19% 10.19% 4.00%
MCAR5 16.36% 9.94% 6.42%
MCAR6 12.55% 5.74% 6.81%
MCAR7 15.15% 6.33% 8.82%
MCAR8 20.81% 10.05% 10.76%
MCAR9 24.84% 13.03% 11.81%
MCAR10 25.42% 11.91% 13.51%
MCAR11 25.55% 10.04% 15.51%
MCAR12 28.15% 12.19% 15.96%
MCAR 6x3 Trading Strategy
Winner
MCAR Loser MCAR Difference
MCAR1 -0.43% -1.12% 0.68%
MCAR2 1.65% -1.30% 2.94%
MCAR3 -2.07% -5.68% 3.61%

Momentum Investment
Page 19 of 21
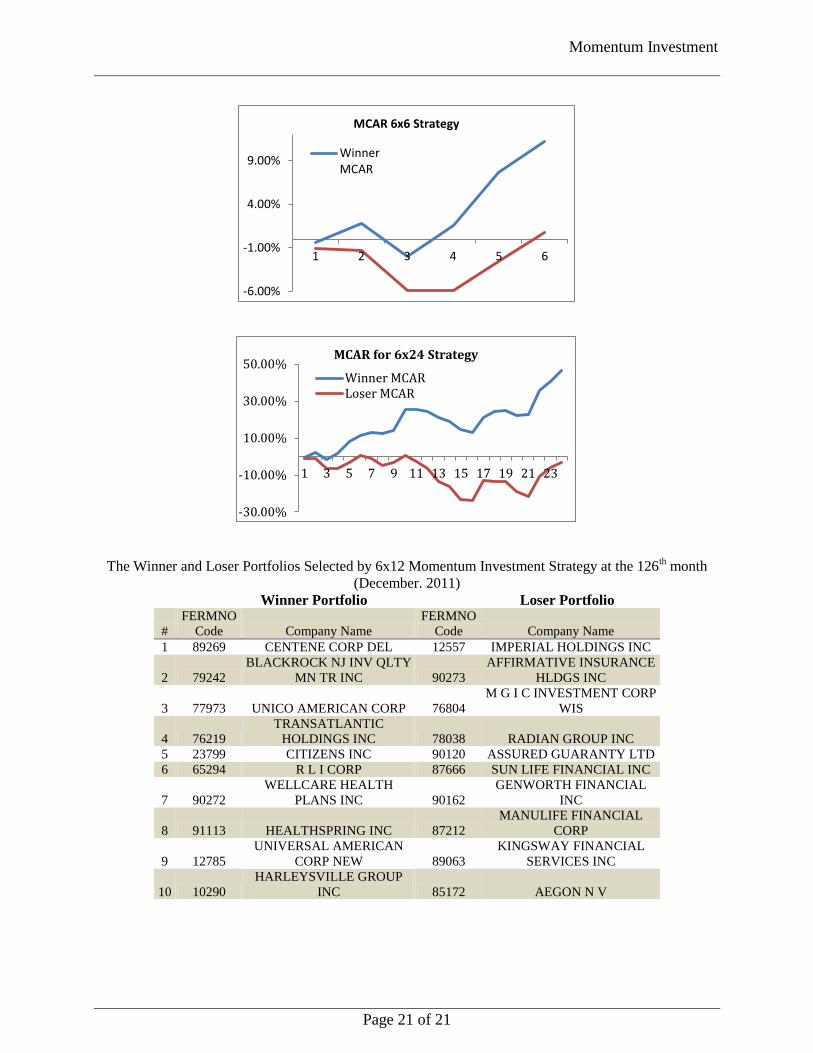
MCAR 6x6 Trading Strategy
Winner
MCAR Loser MCAR Difference
MCAR1 -0.39% -1.14% 0.74%
MCAR2 1.81% -1.36% 3.17%
MCAR3 -2.02% -5.86% 3.84%
MCAR4 1.51% -5.87% 7.38%
MCAR5 7.64% -2.52% 10.16%
MCAR6 11.17% 0.81% 10.36%
MCAR 6x24 Trading Strategy
Winner
MCAR Loser MCAR Difference
MCAR1 -0.27% -1.19% 0.92%
MCAR2 2.39% -1.30% 3.69%
MCAR3 -1.75% -6.23% 4.48%
MCAR4 1.65% -6.56% 8.20%
MCAR5 8.13% -3.37% 11.50%
MCAR6 11.62% 0.40% 11.21%
MCAR7 12.85% -1.19% 14.04%
MCAR8 12.46% -4.61% 17.07%
MCAR9 14.30% -3.01% 17.31%
MCAR10 25.72% 0.44% 25.28%
MCAR11 25.70% -2.66% 28.37%
MCAR12 24.11% -6.63% 30.74%
MCAR13 21.32% -13.71% 35.03%
MCAR14 19.18% -16.31% 35.49%
MCAR15 14.75% -23.16% 37.92%
MCAR16 13.11% -23.94% 37.05%
MCAR17 21.32% -12.69% 34.01%
MCAR18 24.13% -13.77% 37.90%
MCAR19 24.82% -13.56% 38.38%
MCAR20 22.46% -19.05% 41.52%
MCAR21 22.84% -21.47% 44.31%
MCAR22 35.88% -10.98% 46.87%
MCAR23 40.68% -5.85% 46.53%
MCAR24 46.38% -3.39% 49.77%

Momentum Investment
Page 20 of 21
0.00%
5.00%
10.00%
15.00%
1 2 3
MCAR 3x3 Trading Strategy
Winner MCAR
Loser MCAR
-4.00%
1.00%
6.00%
11.00%
16.00%
1 2 3 4 5 6
MCAR 3x6 Strategy
WinnerMCAR
-1.00%
9.00%
19.00%
29.00%
1 2 3 4 5 6 7 8 9 10 11 12
MCAR 3x12 Strategy
Winner MCARLoser MCAR
-6.00%
-4.00%
-2.00%
0.00%
2.00%
4.00%
1 2 3
MCAR 6x3 Strategy
WinnerMCAR
Momentum Investment
Page 21 of 21
The Winner and Loser Portfolios Selected by 6x12 Momentum Investment Strategy at the 126th month
(December. 2011)
Winner Portfolio Loser Portfolio
#
FERMNO
Code Company Name
FERMNO
Code Company Name
1 89269 CENTENE CORP DEL 12557 IMPERIAL HOLDINGS INC
2 79242
BLACKROCK NJ INV QLTY
MN TR INC 90273
AFFIRMATIVE INSURANCE
HLDGS INC
3 77973 UNICO AMERICAN CORP 76804
M G I C INVESTMENT CORP
WIS
4 76219
TRANSATLANTIC
HOLDINGS INC 78038 RADIAN GROUP INC
5 23799 CITIZENS INC 90120 ASSURED GUARANTY LTD
6 65294 R L I CORP 87666 SUN LIFE FINANCIAL INC
7 90272
WELLCARE HEALTH
PLANS INC 90162
GENWORTH FINANCIAL
INC
8 91113 HEALTHSPRING INC 87212
MANULIFE FINANCIAL
CORP
9 12785
UNIVERSAL AMERICAN
CORP NEW 89063
KINGSWAY FINANCIAL
SERVICES INC
10 10290
HARLEYSVILLE GROUP
INC 85172 AEGON N V
-6.00%
-1.00%
4.00%
9.00%
1 2 3 4 5 6
MCAR 6x6 Strategy
WinnerMCAR
-30.00%
-10.00%
10.00%
30.00%
50.00%
1 3 5 7 9 11 13 15 17 19 21 23
MCAR for 6x24 Strategy
Winner MCARLoser MCAR