keep up the momentum - thierry-roncalli.com · keep up the momentum 1 de ning momentum strategies...
TRANSCRIPT

Keep Up The Momentum∗
Thierry RoncalliQuantitative Research
Amundi Asset Management, [email protected]
December 2017
Abstract
The momentum risk premium is one of the most important alternative risk premiaalongside the carry risk premium. However, it appears that it is not always well under-stood. For example, is it an alpha or a beta exposure? Is it a skewness risk premiumor a market anomaly? Does it pursue a performance objective or a hedging objective?What are the differences between time-series and cross-section momentum? What arethe main drivers of momentum returns? What does it mean when we say that it is aconvex and not a concave strategy? Why is the momentum risk premium a diversifyingengine, and not an absolute return strategy?
The goal of this paper is to provide specific and relevant answers to all these ques-tions. The answers can already be found in the technical paper “Understanding theMomentum Risk Premium” published recently by Jusselin et al. (2017). However, theunderlying mathematics can be daunting to readers. Therefore, this discussion paperpresents the key messages and the associated financial insights behind these results.
Among the main findings, one result is of the most importance. To trend is todiversify in bad times. In good times, trend-following strategies offer no significantdiversification power. Indeed, they are beta strategies. This is not a problem, sinceinvestors do not need to be diversified at all times. In particular, they do not needdiversification in good times, because they do not want that the positive returns gen-erated by some assets to be cancelled out by negative returns on other assets. This iswhy diversification may destroy portfolio performance in good times. Investors onlyneed diversification in bad economic times and stressed markets.
This diversification asymmetry is essential when investing in beta strategies likealternative risk premia. On the contrary, this diversification asymmetry is irrelevantwhen investing in absolute return strategies. However, we know that generating perfor-mance with alpha strategies is much more difficult than generating performance withbeta strategies. Therefore, beta is beautiful, but convex beta is precious and scarce.Among risk premia, momentum is one of the few strategies to offer this diversificationasymmetry. This is why investing in momentum is a decision of portfolio construction,and not a search for alpha.
Keywords: Momentum, trend-following, diversification, payoff.
JEL classification: C50, C60, G11.
∗I am very grateful to my co-authors Paul Jusselin, Edmond Lezmi, Hassan Malongo, Come Masselin andTung-Lam Dao for sharing their views on these topics. The working paper “Understanding the MomentumRisk premium: An In-Depth Journey Through Trend-Following Strategies” can be downloaded from SSRN:www.ssrn.com/abstract=3042173. I would also like to thank Alexandre Burgues, Jean-Thomas Heissat,Edouard Knockaert, Raphael Sobotka and Bruno Taillardat for their helpful comments and discussion.
1
Keep Up The Momentum
'
&
$
%
Key Takeaways
• The performance of momentum strategies depends on three main parameters:
– The absolute value of Sharpe ratios
– The correlation matrix of asset returns
– The moving average duration to estimate the trends
• Time-series momentum likes zero-correlated assets. This is why time-series momentummakes sense in a multi-asset framework.
• Cross-section-momentum likes highly correlated assets. This is why cross-section mo-mentum makes sense within a universe of homogenous assets, e.g. a universe of stocksthat belong to the same region.
• Short-term momentum is more risky than long-term momentum. Therefore, the cross-section dispersion of short-term momentum returns is broader than the cross-sectiondispersion of long-term momentum returns.
• The Sharpe ratio of long-term momentum is higher than the Sharpe ratio of short-termmomentum.
• The choice of the moving average estimator is more crucial for short-term momentumthan for long-term momentum.
• Too much leverage can be harmful for the strategy, since momentum portfolios are nothomothetic transformations with respect to the portfolio’s leverage.
• The payoff of a trend-following strategy is a long straddle option profile. Therefore,trend-following strategies exhibit a convex payoff.
• Trend-following portfolios are not absolute return strategies. In the long-run, trend-following strategies present a low moderate correlation with traditional asset classes.However, it is an illusion due to long-term averaging, since they present either a highpositive or a high negative beta.
• The main motivation of momentum investing is diversification, not performance. Theconvexity of trend-following strategies mitigates the risk of diversified portfolios inbad times. This is why momentum strategies must be located in diversifying buckets,and not in absolute return buckets. Therefore, analysing the risk/return trade-off ofmomentum strategies on a standalone basis does not make sense.
• It follows that momentum risk premium is key for building an alternative risk premiaportfolio.
2

Keep Up The Momentum
1 Defining momentum strategies
Momentum is one of the oldest and most popular trading strategies in the investment indus-try. For instance, momentum strategies are crucial to commodity trading advisors (CTAs)and managed futures (MFs) in the hedge funds industry. They also represent the basic trad-ing rules that are described in the famous Turtle trading experiment conducted by RichardDennis and William Eckhardt in 1980s1. Momentum strategies are also highly popularamong asset managers. For instance, the four-factor model of Carhart (1997) is the stan-dard approach for analysing the performance of equity asset managers. Another importantfact concerns the relationship between options and momentum. Indeed, it is well-knownthat the manufacturing of structured products is based on momentum strategies. Hedgingdemand from retail and institutional investors is therefore an important factor explainingthe momentum style.
The momentum investment style is often opposed to the contrarian investment style. Inthe first approach, the investor follows the market or the current trend of some assets. This iswhy we also speak about trend-following strategies. In the second approach, the investor goesagainst the market or the current trend of some assets. This investment style is also knownas the mean-reverting or reversal strategy. Contrarian investors think that financial marketsoverreact and crowd behaviour leads to a mispricing of assets. Therefore, value investingis generally classified as a contrarian strategy. It consists calculating the fundamental (orfair) value of the security, comparing this intrinsic value to the market value, and buying (orselling) the security if it is underpriced (or overpriced) by the market. Momentum investorsare generally seen as lazy investors that demonstrate herding behaviour2. On the contrary,contrarian and value investors are perceived as smart people that “think outside the box”. Itis no coincidence that the most famous book on value investing is “The Intelligent Investor”written by Benjamin Graham. Therefore, momentum investors feel a sense of inferiorityand often hide that they follow the crowd. In a nutshell, “value and contrarian investingare gratifying while momentum investing is shameful”. However, it’s not as simple as that,because all investors cannot be value or contrarian investors, even if they pretend that theyare. For instance, by analysing the quarterly portfolio holdings of 155 equity mutual fundsbetween 1974 and 1984, Grinblatt et al. (1995) found that “77% of these mutual funds weremomentum investors”.
As for value, there is a gap between the concept of momentum investing and the momen-tum risk premium. For instance, in a series of articles in the 1990s, Fama and French clearlydefined the value risk factor and specified the quantitative metrics to measure the value ofa stock. For momentum, we have to make the distinction between two generic strategies:time-series and cross-section. These two risk premium strategies assume that the past trendis a predictor of the future trend. In the case of the time-series momentum risk premium, theportfolio is long on assets with a positive past trend and short on assets with a negative pasttrend, whereas the cross-section momentum strategy consists in building a portfolio that islong on assets that have outperformed and short on assets that have underperformed. Thus,the time-series momentum is called the trend-following strategy or the trend-continuationstrategy, because it assumes that assets with a current positive trend will continue to have afuture positive trend and assets with a current negative trend will continue to have a futurenegative trend. A cross-section momentum is called a winners-minus-losers strategy. It as-
1See http://www.investopedia.com/articles/trading/08/turtle-trading.asp.2The academic research community has often laughed about momentum strategies, which were classified
as cooking recipes for amateur investors. All this has changed with the publication of Fung and Hsieh (2001).In fact, momentum can be easily explained by behavioural finance theory formulated by the recent NobelPrize winner Richard Thaler and his co-authors.
3

Keep Up The Momentum
sumes that the current winners will continue to outperform the current losers in the future.As a consequence, the net exposure of a time-series momentum is not equal to zero, whereasthe net exposure of a cross-section momentum is equal to zero. The time-series momentumstrategy is intensively used by CTAs with a multi-asset universe and is generally imple-mented with equity, bond, currency and commodity futures contracts. The cross-sectionmomentum strategy is one of the pillars when a fund manager builds an equity multi-factorportfolio by mixing size, value, momentum, low risk and quality stocks. In the sequel, whenthe type of strategy is not specified, we systematically refer to the time-series momentum.
2 Why do investors pay so much attention to momen-tum risk premia?
Momentum is no longer taboo with the emergence of alternative risk premia, and is underthe scrutiny of sophisticated institutional investors, including pension funds and sovereignwealth funds that are contrarian investors3. Therefore, Roncalli (2017) supports the viewthat carry and momentum are the most relevant alternative risk premia since they arepresent across different asset classes, and must be included in a strategic asset allocation.Since the main objective of alternative risk premia is to build a better diversified portfoliothan a traditional stock-bond asset mix policy, one could have trouble understanding thelink between momentum and diversification. Indeed, in one sense, momentum strategies arethe opposite of diversification strategies because they follow the market. In fact, there is amisconception of diversification that we will explain later.
It is obvious that alternative risk premia revisit portfolio construction in two directions.First, in terms of the investment universe. For a long time, strategic asset allocation wasmainly related to the concept of asset classes. The idea was to group individual securitiesto form a homogenous investment universe called an asset class. These asset classes canbe broadly defined by distinguishing stocks, bonds, currencies and commodities or morespecifically by considering US equities, European equities, Japanese equities, EM equities,etc. This type of approach is the foundation of strategic asset allocation, but is limiting interms of security selection, because it is based on the capitalization-weighted portfolio. Theidea of alternative risk premia is to group individual securities in another way in order todefine new risk factors (Ang, 2014). Thus, alternative risk premia allow us to extend thebuilding blocks of a strategic asset allocation, by completing the investment universe withrisk premia strategies.
Nevertheless, the introduction of these new risk factors forces the investor to change hisframework of asset allocation. For many decades, these new risk factors were extensively usedby hedge funds and active managers under the name “absolute return” or alpha strategies.This concept suggests that they are independent from traditional asset classes. In thiscontext, portfolio allocation consists in building two portfolios, a beta portfolio and an alphaportfolio, and mixing them in order to benefit from the performance and the diversificationof the alpha portfolio. Improving the Sharpe ratio is then the “raison d’etre” of absolutereturn strategies.
However, this magic formula has been put under pressure by the Global Financial Crisisin 2008 and afterwards. These risk factors have therefore been seen as dependent on tra-ditional asset classes. The reason is that most of them are beta strategies, meaning thattheir performance also depends on the performance of the market. If alternative risk premia
3For instance, the strategic asset allocation of these investors is generally defined as a constant-mixportfolio, which is a typical contrarian investment approach.
4
Keep Up The Momentum
are beta strategies, and not alpha strategies, the traditional diversification approach is notappropriate. As explained by Burgues et al. (2017), it must then be replaced by the payoffdiversification approach for two main reasons. First, volatility is not the right risk measureof long-term investors, which are more sensitive to expected drawdowns. In other words,volatility risk is a tactical asset allocation decision, whereas skewness risk is a strategic assetallocation decision. Second, relationships between risk premia become highly non-linear. Inthis case, correlation is time-varying. This is why the values taken by the correlation mustbe interpreted with respect to the state of the market.
By differentiating convexity and concavity in the portfolio, alternative risk premia reshuf-fle the notion of “bad” and “good” diversification. A bad diversification consists in addingan asset that will help in bad times, but that will also destroy performance in good times.In this case, we risk ending up with a non- or low-performing portfolio. This is the exampleof systematically buying put options. This type of behavior is contrary to the long-runinvestment mindset, because it assumes that there are no positive risk premia in the long-term. A good diversification consists in adding an asset that will help in bad times withoutcompromising the long-run performance. This can only be achieved with a risk premiumstrategy that exhibits a time-varying beta: a positive beta in good times and a negativebeta in bad times. This is exactly the beta profile of momentum risk premia.
Most alternative risk premia portfolios include carry and momentum. What is the ra-tionale? Like many risk premia, carry has a concave payoff like a short put option profile.The motivation behind carry is then different. The underlying idea is to improve the per-formance of traditional risk premia or to generate income. Therefore, the issue is not toaccumulate only concave payoffs or short put payoffs, because it is too risky. This is whythe momentum risk premium plays a central role in diversified portfolios, because it is oneof the few convex strategies that can mitigate the risk of the rest of the portfolio, includingalso the traditional risk premia.
In summary, diversification is the main objective of long-term investors when investing inmomentum, whereas performance is the main objective of long-term investors when investingin carry4.
3 Risk-return analysis of trend-following strategies
Jusselin et al. (2017) demonstrate that the payoff of the trend-following strategy is convexand is similar to a long exposure on a straddle option (see Figure 1). This result was alreadyfound by Fung and Hsieh (2001) and Bruder and Gaussel (2011). The convexity of the payoffimplies that the strategy has a positive skewness. Roncalli (2017) classifies alternative riskpremia into two families:
1. Skewness risk premiaThe investor is rewarded in good times for taking a skewness risk in bad times.
2. Market anomaliesThey correspond to trading strategies that have delivered good performance in thepast, but their performance cannot be explained by the existence of a systematic riskin bad times. Their performance can only be explained by behavioral theories.
4We must not confuse volatility diversification and skewness diversification. Mixing several carry strate-gies with traditional risk premia reduces the volatility risk, which is a high-frequency diversification measure.At low frequencies, carry does not diversify.
5

Keep Up The Momentum
Figure 1: Payoff of the trend-following strategy
Following Roncalli (2017), trend-following strategies can only be market anomalies. Thisis confirmed by the cumulative distribution function of the P&L, which is reported in Figure2. We notice that the loss is bounded, but the gain may be infinite, even if the asset has azero Sharpe ratio. These generic results are impacted by three main parameters:
• the duration of the moving average that estimates the trends;
• the Sharpe ratio of the assets that compose the investment universe;
• the correlation matrix of asset returns.
Figure 2: Cumulative distribution function of the P&L when the Sharpe ratio of the assetis equal to zero
-30 -15 0 15 30 45 60 75
Annualized return (in %)
20
40
60
80
100 CDF (in %)
The effect of the moving average frequency is interesting. Indeed, the P&L of short-term trend-following strategies has a larger volatility than the P&L of long-term trend-following strategies. This result is not so obvious, because we may have the feeling that riskmanagement of short-term trading is easier than risk management of long-term trading. Infact, this result is related to the fact that short-term trends are more difficult to estimate
6

Keep Up The Momentum
than long-term trends. This explains that short-term trend-following strategies are moresensitive to trading recipes, proprietary models and the “savoir-faire” of the managementteam. This result is also confirmed by the broader dispersion of returns that is observedbetween Short-term CTAs than between long-term CTAs.
The convexity of the payoff is due to the impact of the Sharpe ratio. Indeed, the perfor-mance of the trend-following strategy does not depend on the sign of the Sharpe ratio, butonly on its absolute value. Therefore, we obtain a symmetry property: a negative Sharperatio has the same impact than a positive Sharpe ratio. This property explains the rationalebetween long-only portfolios and long/short portfolios. When building a long-only portfolio,the investor needs to be strongly convinced about the (positive) risk premium of asset classesthat are included in the investment universe. When considering a momentum strategy, theinvestor needs to be convinced that assets in the investment universe will exhibit trends,whatever the direction. This explains that the investment universe of a buy-and-hold orconstant-mix portfolio is generally composed of stocks and bonds, whereas the investmentuniverse of a momentum portfolio also includes currencies and commodities that are notrisk premia.
The Sharpe ratio is a statistic that combines the trend and the volatility. In order toperform, momentum strategies need significant trends compared to the volatility. What doesit mean? In fact, we can show that momentum strategies have a negative vega, implyingthat the investor pays a systematic premium because of the short exposure on the short-term volatility. This is why the momentum risk premium does not like that the volatilityincreases. Therefore, the Sharpe ratio is a relative measure of the strength of the trend, anda strong trend with high volatility is not necessarily better than a medium trend with verylow volatility. In Figure 1, we notice that there is an area that corresponds to a negativeP&L. In this area, the trend is too low to generate a sufficient return that will offest volatilitytrading costs. Like the theory of options, the theory of momentum is then based on severaltrade-offs: trend versus volatility, delta gain versus gamma cost, long-term volatility versusshort term-volatility. The trade-off gain versus loss is particularly interesting. Indeed, “trendfollowers lose more often than they gain” as shown by Potters and Bouchaud (2006). Thisis due to the fact that big trends are not so frequent in financial markets. Most of thetime, gamma costs dominate implying that the performance of the momentum strategy ispoor, but sometimes there is a big trend and the momentum strategy posts an outstandingperformance.
By comparing momentum and long-only (buy-and-hold or constant mix) strategies, Jus-selin et al. (2017) find that the momentum strategy has a better Sharpe ratio than a longexposure when the Sharpe ratio of underlying assets is lower than 35%. Again, we face herea new asymmetry, which is quite understandable. It is obvious that a momentum portfoliowill do a better job than a long portfolio if the asset’s Sharpe ratio is negative. This isalso the case when this latter is low, because the asset can exhibit temporary (negative andpositive) trends. For instance, when we simulate a Geometric Brownian motion with a zeroSharpe ratio, we are surprised that we observe statistical trends. An illustration is given inFigure 3 with four simulated paths – we use a semi-logarithmic plot for the y-axis in orderdistinguish the relative performance. The maximum trend of each simulation is respectivelyequal to +84%, +73%, −56% and −48%. On the contrary, when the Sharpe ratio is suffi-ciently high, the long portfolio does a better job than the momentum portfolio, because theperformance of the latter portfolio is not impacted by the gamma trading costs.
The third important parameter is the correlation between asset returns. When theSharpe ratio is equal to zero, Jusselin et al. (2017) find a curious result: the P&L of thetrend-following strategy does not depend on the sign of the correlation. As shown in Figure
7

Keep Up The Momentum
Figure 3: Geometric Brownian motions exhibit trends
0 1 2 3 4 5
Time (in years)
20
30
50
100
200
300
400500
Price
4, a correlation of −80% is equivalent to a correlation of +80%. This result contrasts with thetraditional diversification approach. In the case of a long-only investment portfolio, the bestcase for diversification is when some assets are negatively correlated to other assets. Thisexplains why the stock/bond asset mix policy is certainly the most well-known diversifiedportfolio. In the case of a long/short investment portfolio, the case of negative correlation issymmetric to the case of positive correlation. For instance, if we consider the two extremecases, a correlation of +100% between two assets is equivalent to a correlation of −100% ina long/short momentum portfolio. In this later case, if we observe a positive trend on oneasset, this implies a negative trend on the second asset. Therefore, the portfolio will be longon this asset and short on the second asset. However, the portfolio is not diversified, becauseit is exposed to the same trend. Thus, the best case is when the correlation is equal to zero,because we have two independent trends. In fact, the concept of diversification is morecomplex for momentum than for long-only portfolios. In particular, we must distinguishtime-series and cross-section momentum.
Figure 4: The correlation symmetry puzzle when the Sharpe ratio is equal to zero
-20 0 20 40 60 80
Annualized return (in %)
20
40
60
80
100 CDF (in %)
Correlation = -80%
Correlation = +80%
8

Keep Up The Momentum
4 Time-series versus cross-section momentum
In the previous section, we have presented results concerning the traditional trend-followingstrategy or the time-series momentum risk premium. However, as we indicated before, thereare two momentum risk premia that present different behaviours. For instance, in Figure5 we have represented the cumulative distribution function of the trend-following strategywhen the cross-correlation is equal to 80% with respect to the number of assets that make upthe investment universe. We notice that the diversification gain is limited when we considermore than three assets. This result confirms that the time-series momentum does not like(positively or negatively) correlated assets.
Figure 5: Correlation is not the friend of time-series momentum
-25 0 25 50 75 100 125 150 175 200
Annualized return (in %)
20
40
60
80
100 CDF (in %)
With cross-section momentum, it is another story. In Figure 6, we have representedthe Sharpe ratio of the cross-section momentum strategy with respect to the correlationbetween asset returns. We notice that the Sharpe ratio of the strategy increases with thecorrelation. Correlation is then the friend of cross-section momentum. How do we explainthis big difference between the two momentum risk premia? We have seen that time-seriesmomentum is a beta strategy. The dependence between the strategy return and the assetreturn increases with the magnitude of the trend. Therefore, having a zero correlation helpsto reduce the volatility of the trend-following strategy. In the case of the cross-sectionmomentum, the return of the portfolio depends on the relative difference between assettrends. If assets are weakly correlated, the dispersion of the P&L is very high. The outcomeof the strategy is then very uncertain. This is why cross-section momentum likes highlycorrelated assets.
This difference between time-series and cross-section momentum is well known by hedgefund managers. This is the same issue as the difference between long/short matching andlong/short managing. For instance, equity market neutral strategies aim to build a short ex-posure that is correlated to the long exposure. This is particularly true when fund managersuse pairs trading. They expect that the performance will come from long/short matching.In this case, one pair is seen as one investment bet, not two investment bets. When imple-menting cross-section momentum, the investor has a similar approach. He expects that theperformance comes from long/short matching. When implementing time-series momentum,the investor expects that the performance comes both from the short and long exposures.Thus, cross-section momentum is more a relative value (or an alpha) strategy whereas time-series momentum is typically a beta strategy.
9

Keep Up The Momentum
Figure 6: Correlation is the friend of cross-section momentum
-100 -50 0 50 100
Correlation (in %)
0.2
0.4
0.6
0.8
1
1.2
1.4 Sharpe ratio
This distinction has major implications when designing a strategy. Time-series momen-tum makes sense for a multi-asset universe, including equity, fixed-income, currency andcommodity futures contracts, in order to have a diversified investment universe. Cross-section momentum makes sense for a universe of homogeneous securities, for instance thestocks of an equity index that is focused in one country or one region. If we considercommodities, it is then better to implement time-series momentum at the global level andcross-section momentum at the category level (agricultural, energy, livestock, metals, etc.).
5 Hidden risks of momentum strategies
The concept of an “all weather fund” is a marketing idea that is difficult to achieve inpractice. It is a little bit different from the concept of an absolute return strategy. The twoportfolios have the same objective: they claim to perform reasonably well during both goodand bad times. However, they do not use the same approach. Absolute return portfoliosare based on alpha strategies that are weakly correlated to traditional risk premia. Allweather portfolios are based on beta exposures, and diversification is the main driving forceto achieve good performance in bad times. However, it is extremely difficult to find the magicformula. The behavior of a diversified portfolio in bad times is not easy to predict. Withthe emergence of alternative risk premia, it would be illusory to think that diversificationwill completely protect the investor from bad times. As explained by Ang (2014), each(traditional and alternative) risk premia has its own bad times. Of course, diversificationhelps to mitigate drawdown risks, but it cannot eliminate them.
Momentum strategy is not an exception. We have seen that its loss is bounded. Thisresult has been obtained under two conditions. The first one assumes that the momentumstrategy uses a reasonable leverage. It would be wrong to think that the leverage only im-pacts the sizing of long/short exposures, implying that there is a linear relationship betweenthe level of leverage, and the return and volatility of the portfolio. The problem comesfrom the costs induced by gamma trading, which are not linear with respect to portfolio’sleverage. In particular, we can show that too much leverage can be harmful for the strategy.
The second condition assumes that there is no jump or discontinuity in asset prices.Without this assumption, the payoff is not necessarily convex and the loss is not bounded.For instance, we think that there is a misconception about CTAs. Many people think that
10

Keep Up The Momentum
CTAs are good strategies for hedging the skewness risk of the stock market. In reality,trend-following strategies help to hedge drawdowns due to volatility risk. For instance,CTAs did a very good job in 2008, because the Global Financial Crisis is more a high-volatility event than a pure skewness-risk event. However, it is not obvious that CTAs maypost similar performances when facing skewness events. For instance, the performance ofCTAs was disappointing during the Eurozone crisis in 2011 and the Swiss CHF chaos inJanuary 2015. In Figure 7, we have reported the cumulative performance of the trend-following strategy applied to the CHF/USD currency. On January 15th, 2015, we observeda large drawdown. This illustration shows that time-series momentum may also suffer incase of market discontinuities.
Figure 7: Cumulative performance of the CHF/USD trend-following strategy
2002 2004 2006 2008 2010 2012 2014 2016
70
80
90
100
110
120
Another important risk concerns trend reversals. This point has been already observedby Daniel and Moskowitz (2016), who showed that investors may face momentum crashes,especially when they use a cross-section implementation. This risk is related to the coherencebetween the duration of the trend and the duration of the moving average. Finally, we alwaysverify that there is no free lunch in finance.
Since cross-section momentum is implemented using securities (stocks or bonds), theinvestor also faces a transaction cost risk. Indeed, the turnover of cross-section momentumis much higher than the turnover of other risk factors (value, quality, etc.). More generally,the liquidity of the asset universe is a key parameter when considering momentum strategies.
6 How do momentum strategies benefit from traditionalrisk premia?
When we consider trend-following strategies, we generally think that their good performancecomes from their ability to be long and short. And we imagine that the short exposure isof the same magnitude than the long exposure on average. This is not true. Most of thetime, a trend-following strategy is net long. This is particularly true for equities and bonds.For instance, Jusselin et al. (2017) find that the average exposure for a trend-followingstrategy, whose volatility is comparable to the asset volatility, is equal to 58% for bonds,52% for equities, 23% for commodities and 10% for currencies. We notice that there isa large difference between bonds and equities, and the other assets. Therefore, we can
11
Keep Up The Momentum
wonder if the momentum strategy benefits from trend patterns or risk premia? In the caseof bonds, Jusselin et al. (2017) show that risk premium is the most important effect, sinceabout 70% of exposure is long. An interesting point is that the magnitude of short exposureis comparable to the magnitude of long exposure. This is not the case for equities. Onaverage, the size of long exposure is twice the size of short exposure. Again, the momentumstrategy benefits from the equity risk premium. For commodities and currencies, we obtainan opposite effect. The main contribution comes from trend patterns. This result is obvioussince it is generally accepted that currencies and commodities do not exhibit risk premia.This explains that there is a symmetry between long and short exposures for currencies andcommodities, but not for equities and bonds.
The case of equities demonstrates that the momentum risk premium comes also from thecapacity to leverage or deleverage traditional risk premia. And it is not obvious that shortmanagement contributes more than leverage management. There is certainly a myth aboutshort selling in CTA strategies. Many people believe that the good performance of CTAs in2008 is due to their short equity exposure. However, on average, CTAs were 15% net shorton equities in 2008. Why such a small value? Because it is extremely difficult to have a bigexposure when the volatility is so high5. This explains that CTAs have more difficulties tobe short on equities than long on equities, because negative trends are associated with highvolatility regimes whereas positive trends are observed in low volatility regimes.
How to explain the good performance of CTAs in 2008? One of the reason is thestock/bond correlation. We should reiterate here that a negative correlation is equivalentto a positive correlation in long/short portfolios, because it corresponds to the same bet.However, this result assumes that there are no volatility differences between normal andstressed markets. If two assets are highly negatively correlated, and if we observe a negativetrend in the first asset, the trend-following strategy has the choice between being short ofthe first asset and/or being long on the second asset. In 2008, the negative trend on equitieshas been primarily implemented by trend followers as a big long exposure on bonds, and asmall short exposure on equities.
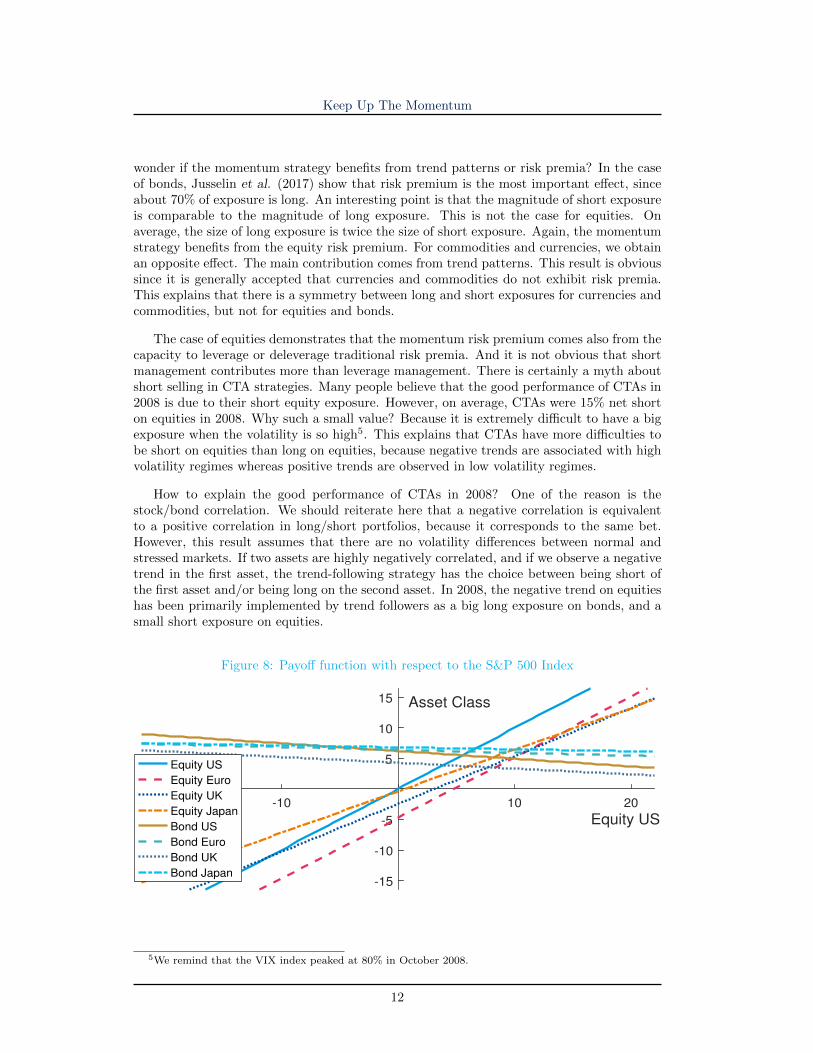
Figure 8: Payoff function with respect to the S&P 500 Index
-20 -10 10 20
Equity US
-15
-10
-5
5
10
15 Asset Class
Equity US
Equity Euro
Equity UK
Equity Japan
Bond US
Bond Euro
Bond UK
Bond Japan
5We remind that the VIX index peaked at 80% in October 2008.
12

Keep Up The Momentum
7 To trend is to diversify
The concept of diversification has been extensively discussed by Burgues et al. (2017), whodifferentiate the “correlation diversification” approach and the “payoff diversification” ap-proach. In Figure 8, we report the payoff function of several asset classes by consideringthat the reference asset is the S&P 500 index. The payoff function has been estimated forthe period from January 2000 to December 2016 by assuming a constant correlation.
Figure 9: Worst diversification case
We notice that the payoff of equity asset classes is an increasing affine function, because oftheir high cross-correlations. On the contrary, the payoff of bond asset classes is a decreasingaffine function, because of the negative stock/bond correlation. However, it is remarkablethat equity and bond payoffs are crossing within the top right quadrant. As said previously,the worst case of diversification is obtained when the good return of one asset is offset bythe bad return of the other asset (see Figure 9). Therefore, a long-only diversified portfolioof stocks and bonds really makes sense, because bonds diversify equities in bad times andthey are also performance assets in good times.
Figure 10: Stylized payoff of some strategies
-20 -10 10 20
-15
-10
-5
5
10
15
Diversified
Alpha
Carry
Momentum
13

Keep Up The Momentum
Figure 10 represents the generic payoff of some strategies: diversified risk parity, alpha,carry and momentum. By construction, an alpha or absolute return strategy is uncorrelatedto traditional asset classes. It helps to improve the risk/return profile of a diversified fund,but its diversification power is limited. Carry may suffer in bad times. Therefore, carrymay diversify at a high-frequency time scale (daily or weekly), but its diversification poweris limited at a lower frequency time scale (yearly or more). The case of momentum ismore interesting. As explained by Burgues et al. (2017), it helps to mitigate risk in badtimes. But its payoff is very different from a long exposure in bonds (see Figures 8 and 10).And like bonds, the worst diversification case is avoided because of the convexity. Indeed,momentum strategies also generate performance in good times, even if they drag comparedto a constant-mix portfolio.
In this context, momentum investing could not be motivated by the search for alpha,because it is a beta strategy, more precisely a time-varying beta strategy. We can nowunderstand why Burgues et al. (2017) say that traditional portfolio optimization is notadapted when building a portfolio of alternative risk premia or when including ARP in adiversified portfolio. In the long run, the correlation between momentum strategies anddiversified portfolios is close to zero. As such, portfolio optimization considers momentumas an alpha strategy and selects it in order to reduce the volatility. In the short run,we obtain two cases. After good times, momentum is generally not selected by portfoliooptimization, because it has a high beta with performance that is lower than that of a simpleconstant-mix strategy. After bad times, portfolio optimization overweights the allocation inmomentum because of its good performance. Portfolio optimization is therefore not adaptedwhen allocating between alternative risk premia, because it is totally blind to convexity andconcavity.
Figure 11: One-year historical weekly correlation between risk parity, momentum and carry
2006 2008 2010 2012 2014 2016
-40
-20
0
20
40
60
80
100
Risk parity / Momentum
Risk parity / Carry
Carry / Momentum
To illustrate why diversification cannot be reduced to volatility mitigation, we report thecorrelation between risk parity, momentum and carry strategies6 in Figure 11. The long-termhistorical correlation is respectively equal to 50% between risk parity and momentum, 50%between risk parity and carry and 30% between carry and momentum. Since the correlationare positive, we may conclude that diversification is limited. However, it is perfectly normalthat we obtain positive correlations because they are beta strategies. If we had got negative
6The risk parity corresponds to an ERC portfolio between equities and bonds; the momentum is imple-mented using a universe of bonds, equities and currencies; the carry strategy is a mix of three portfolios:fixed-income “roll-down”, currency “forward rate bias” and volatility carry.
14

Keep Up The Momentum
correlations, we would certainly be in the worst diversification case. Therefore, positive long-term correlations are fine in order to generate long-term performance. But we also noticethat these correlations vary over time and may be negative in bad times. This is good news,because investors do not need diversification at all times. They need diversification in badtimes, and particularly when they invest in beta strategies like alternative risk premia7.
References
[1] Ang, A. (2014), Asset Management – A Systematic Approach to Factor Investing,Oxford University Press.
[2] Bruder, B., and Gaussel, N. (2011), Risk-Return Analysis of Dynamic InvestmentStrategies, SSRN, www.ssrn.com/abstract=2465623.
[3] Bruder, B., Kostyuchyk, N. and Roncalli, T. (2016), Risk Parity Portfolios withSkewness Risk: An Application to Factor Investing and Alternative Risk Premia, SSRN,www.ssrn.com/abstract=2813384.
[4] Burgues, A., Knockaert, A., Lezmi, E., Malongo, H., Roncalli, T. andSobotka, R. (2017), The Quest for Diversification – Why Does It Make Sense toMix Risk Parity, Carry and Momentum Risk Premia?, Amundi Discussion Paper, 25.
[5] Carhart, M.M. (1997), On Persistence in Mutual Fund Performance, Journal of Fi-nance, 52(1), pp. 57-82.
[6] Daniel, K.D., and Moskowitz, T.J. (2016), Momentum Crashes, Journal of FinancialEconomics, 122(2), pp. 221-247.
[7] Dao, T-L., Nguyen, T.T., Deremble, C., Lemperiere, Y., Bouchaud, J-P., andPotters, M. (2016), Tail Protection for Long Investors: Trend Convexity at Work,SSRN, www.ssrn.com/abstract=2777657.
[8] Fama, E.F., and French, K.R. (1992), The Cross-Section of Expected Stock Returns,Journal of Finance, 47(2), pp. 427-465.
[9] Fung, W., and Hsieh, D.A. (2001), The Risk in Hedge Fund Strategies: Theory andEvidence from Trend Followers, Review of Financial studies, 14(2), pp. 313-341.
[10] Grinblatt, M., Titman, S., and Wermers, R. (1995), Momentum Investment Strate-gies, Portfolio Performance, and Herding: A Study of Mutual Fund Behavior, AmericanEconomic Review, 85(5), pp. 1088-1105.
[11] Hamdan, R., Pavlowsky, F., Roncalli, T., and Zheng, B. (2016), A Primer onAlternative Risk Premia, SSRN, www.ssrn.com/abstract=2766850.
[12] Jegadeesh, N., and Titman, S. (1993), Returns to Buying Winners and Selling Losers:Implications for Stock Market Efficiency, Journal of Finance, 48(1), pp. 65-91.
[13] Jusselin, P., Lezmi, E., Malongo, H., Masselin, C., Roncalli, T. and Dao, T-L.(2017), Understanding the Momentum Risk premium: An In-Depth Journey ThroughTrend-Following Strategies, SSRN, www.ssrn.com/abstract=3042173.
7When Burgues et al. (2017) say that diversification is multi-faceted, they also include other directionsthan payoff functions. For instance, time horizon is another important factor of diversification. This makesshort-term risk factors (e.g. cross-section momentum) and long-term risk factors (e.g. value) complementary.
15

Keep Up The Momentum
[14] Koijen, R.S.J., Moskowitz, T.J., Pedersen, L.H., and Vrugt, E.B. (2017), Carry,Journal of Financial Economics, forthcoming.
[15] Potters, M., and Bouchaud, J-P. (2006), Trend Followers Lose More Often ThanThey Gain, Wilmott Magazine, 26, pp. 58-63.
[16] Roncalli, T. (2013), Introduction to Risk Parity and Budgeting, Chapman &Hall/CRC Financial Mathematics Series.
[17] Roncalli, T. (2017), Alternative Risk Premia: What Do We Know?, in Jurczenko, E.(Ed.), Factor Investing and Alternative Risk Premia, ISTE Press – Elsevier.
16