tesis: fabrication of optical fiber photonic lanterns...
TRANSCRIPT

UNIVERSIDAD NACIONAL AUTÓNOMA DE MÉXICO PROGRAMA DE MAESTRÍA Y DOCTORADO EN INGENIERÍA
ELÉCTRICA – INSTRUMENTACIÓN
FABRICATION OF OPTICAL FIBER PHOTONIC LANTERNS AND MICRORESONATORS
TESIS
QUE PARA OPTAR POR EL GRADO DE: DOCTOR EN INGENIERÍA
PRESENTA:
AMADO MANUEL VELÁZQUEZ BENÍTEZ
TUTOR PRINCIPAL
DR. JUAN ARNALDO HERNÁNDEZ CORDERO
INSTITUTO DE INVESTIGACIONES EN MATERIALES (IIM)
COMITÉ TUTOR
DR. MATHIEU CHRISTIAN ANNE HAUTEFEUILLE
FACULTAD DE CIENCIAS
DR. NASER QURESHI
CENTRO DE CIENCIAS APLICADAS Y DESARROLLO TECNOLÓGICO (CCADET)
MÉXICO, CD. MÉXICO, ENERO 2017

UNAM – Dirección General de Bibliotecas
Tesis Digitales
Restricciones de uso
DERECHOS RESERVADOS ©
PROHIBIDA SU REPRODUCCIÓN TOTAL O PARCIAL
Todo el material contenido en esta tesis esta protegido por la Ley Federal del Derecho de Autor (LFDA) de los Estados Unidos Mexicanos (México).
El uso de imágenes, fragmentos de videos, y demás material que sea objeto de protección de los derechos de autor, será exclusivamente para fines educativos e informativos y deberá citar la fuente donde la obtuvo mencionando el autor o autores. Cualquier uso distinto como el lucro, reproducción, edición o modificación, será perseguido y sancionado por el respectivo titular de los Derechos de Autor.

2
JURADO ASIGNADO:
Presidente: Dr. Augusto García Valenzuela
Secretario: Dr. Mathieu Christian Anne Hautefeuille
Vocal: Dr. Juan Arnaldo Hernández Cordero
1er Suplente: Dr. Ramón Gutiérrez Castrejón
2do Suplente: Dr. Nicolas K. Fontaine Lugar o lugares donde se realizó la tesis: Instituto de Investigaciones en Materiales (IIM), UNAM; México CREOL - The College of Optics and Photonics, University of Central Florida (UCF); USA Bell Laboratories / Nokia, Crawford Hill; USA
TUTOR DE TESIS:
Dr. Juan Arnaldo Hernández Cordero
-------------------------------------------------- FIRMA
(Segunda hoja)
i
CONTENT
FIGURES AND TABLES .................................................................................................................................. iii
AGRADECIMIENTOS / ACKNOWLEDGEMENTS .................................................................................................... vi
RESUMEN ................................................................................................................................................viii
ABSTRACT ................................................................................................................................................. ix
CHAPTER I: INTRODUCTION ........................................................................................................................ - 1 -
I.1 Background .......................................................................................................................... - 2 -
I.1.1 Space Division Multiplexing (SDM)................................................................................. - 2 -
I.1.2 Optical micro–ring resonators ....................................................................................... - 3 -
I.2 Objectives ............................................................................................................................ - 3 -
CHAPTER II: FIBER OPTICS FUNDAMENTALS-PROPAGATION, TAPERING, AND COUPLING PROCESS ............................... - 5 -
II.1 Propagation of light in optical fibers ..................................................................................... - 5 -
II.1.1 Modes in optical fibers ............................................................................................... - 10 -
II.1.2 Graded-index fibers .................................................................................................... - 13 -
II.2 Fabrication of tapered optical fibers ................................................................................... - 14 -
II.2.1 Adiabatic tapered fibers ............................................................................................. - 15 -
II.2.2 Fabrication using the flame torch approach ................................................................ - 16 -
II.2.3 Fabrication using the laser absorption approach ........................................................ - 18 -
II.2.4 Light coupling in tapered fibers .................................................................................. - 19 -
CHAPTER III: PHOTONIC LANTERNS ............................................................................................................ - 21 -
III.1 Principles of fabrication and operation ............................................................................... - 21 -
III.1.1 Modal features .......................................................................................................... - 25 -
III.1.2 Modal selectivity ....................................................................................................... - 26 -
III.2 Fabrication and mode profiles ............................................................................................ - 28 -
III.2.1 Assembly and tapering stations ................................................................................. - 28 -
III.2.2 Capillaries and microstructured preforms .................................................................. - 30 -
III.2.3 Three fibers PLs – 2 LP modes.................................................................................... - 31 -
III.2.4 Six fibers PLs – 4 LP modes ........................................................................................ - 33 -

ii
III.2.5 Ten fibers PLs – 6 LP modes ....................................................................................... - 34 -
III.2.6 Fifteen fibers PLs – 9 LP modes .................................................................................. - 36 -
III.3 Additional considerations for PL fabrication ....................................................................... - 39 -
III.3.1 Step-index VS graded-index fibers ............................................................................. - 39 -
III.3.2 Wavelength dependence ........................................................................................... - 40 -
III.3.3 Fiber positions and defects ........................................................................................ - 42 -
III.4 Characterization ................................................................................................................. - 43 -
III.4.1 Mode-intensity profiles ............................................................................................. - 44 -
III.4.2 Fiber coupling: losses and transfer matrices .............................................................. - 45 -
CHAPTER IV: MICRO-RING RESONATORS ..................................................................................................... - 50 -
IV.1 Micro-resonators principles and fabrication ....................................................................... - 51 -
IV.1.1 Sensing with micro-ring resonators ....................................................................... - 55 -
IV.2 Thin-layer coatings ............................................................................................................. - 56 -
IV.2.1 Coating instabilities ................................................................................................... - 58 -
IV.2.2 Single-layer coatings ................................................................................................. - 59 -
IV.2.3 Multiple-layer coatings.............................................................................................. - 62 -
IV.3 Functional polymeric materials .......................................................................................... - 64 -
IV.3.1 Azopolymers ............................................................................................................. - 64 -
IV.3.2 Fluorescent composites ............................................................................................ - 66 -
IV.4 Micro-ring resonators with functional polymers ................................................................. - 67 -
IV.4.1 All-glass resonators ................................................................................................... - 67 -
IV.4.2 Resonators coated with a single material .................................................................. - 68 -
IV.4.3 Multilayer coated resonators .................................................................................... - 71 -
IV.5 Device packaging................................................................................................................ - 73 -
CHAPTER V: CONCLUSIONS ...................................................................................................................... - 75 -
REFERENCES ......................................................................................................................................... - 77 -
APPENDIX A: PDMS COMPOSITES ............................................................................................................. - 85 -
APPENDIX B: PUBLICATIONS..................................................................................................................... - 86 -

iii
FIGURES AND TABLES
Fig. II - 1. Step-index optical fiber scheme and its refractive index profile. ............................................................ - 7 - Fig. II - 2. Field-intensity distributions of the first twelve lower order LP modes. ................................................. - 11 - Fig. II - 3. Propagation of the LP modes (marked in the corresponding plot) dependent of normalized propagation
constant (b) as function of the normalized frequency (V) in step-index fibers. Taken from [2]. .............. - 12 - Fig. II - 4. Refractive index distribution of graded index fibers with different grade profile parameter (q). ...... - 14 - Fig. II - 5. Schematic representation of a tapered optical fiber. .......................................................................... - 15 - Fig. II - 6. Schematic of the heat-brushing method for tapering optical fibers. .................................................... - 17 - Fig. II - 7. Illustration of the heat-and-pull technique used for fiber tapering. ..................................................... - 19 - Fig. II - 8. Illustration of the cross section of two optical fibers fused and tapered together: a) both fibers before
tapering launching light in one of the fibers, b) transition section with the formation of "supermodes", and
c) waist section forming a higher order mode. Light coupling by from a tapered fiber to another proximate
non-tapered fiber. ............................................................................................................................... - 19 -
Fig. III - 1. Illustration of a Photonic Lantern formed by N input SMFs at one end, merging to originate a MMF
capable of support M number of modes at the output end. ............................................................... - 22 - Fig. III - 2. Spot arrangements of supermodes to excite fiber LP modes [84]. ...................................................... - 23 - Fig. III - 3. Illustration of the energy coupling and mode evolution at tapering process of the PLs at different stages. .
........................................................................................................................................................ - 24 - Fig. III - 4. Microscope pictures of the cleaved end facet from a three fiber PL showing the energy coupling and
mode evolution at different stages of the tapering process. .............................................................. - 25 - Fig. III - 5. Modal evolution simulations for a PL formed by three identical SMFs. Blue and red lines indicate the
modes propagating through the core and the cladding, respectively. Taken from [86]. ...................... - 25 - Fig. III - 6. Modal evolution simulations for a mode-selective PL formed by dissimilar fibers. Blue and red lines
indicate the modes propagating through the core and the cladding, respectively. Taken from [86]. ... - 27 - Fig. III - 7. PLs assembly station. a) Photograph of the system, and b) fibers being placed inside a microstructured
preform. ........................................................................................................................................... - 29 - Fig. III - 8. CO2 laser tapering station: a) AFL LAZERmaster LZM-100, and b) internal system. ............................. - 30 - Fig. III - 9. Optical microscope images from the glass capillaries used in the construction of PLs: a) capillary with a
fluorine-doped inner layer used in low-order modes photonic lanterns, and microstructured preforms for
higher-order modes lanterns, b) ten and c) fifteen modes.................................................................. - 31 - Fig. III - 10. Three fibers photonic lantern. a) End facet cleaved at the waist section. b) Near filed mode profiles from
a non-mode-selective PL at 1550 nm................................................................................................. - 32 - Fig. III - 11. Three modes mode-selective photonic lantern. a) Fiber core positions, b) near field mode profiles, and c)
far field mode profiles at 1550 nm. ................................................................................................... - 32 - Fig. III - 12. Six fibers photonic lantern. a) End facet cleaved at the waist section. b) Near filed mode profiles from a
non-mode-selective PL at 1550 nm. .................................................................................................. - 33 - Fig. III - 13. Six modes mode-selective photonic lantern. a) Fiber core positions, b) near field mode profiles, and c)
far field mode profiles at 1550 nm. ................................................................................................... - 34 - Fig. III - 14. Ten fibers photonic lantern. a) End facet cleaved at the waist section. b) Near filed mode profiles from a
non-mode-selective PL at 1550 nm. .................................................................................................. - 35 -

iv
Fig. III - 15. Ten modes mode-selective photonic lantern. a) Fiber core positions, b) near field mode profiles, and c)
far field mode profiles at 1550 nm. ................................................................................................... - 35 - Fig. III - 16. Fifteen fibers photonic lantern: a) End facet cleaved at the waist section. b) Near filed mode profiles
from a non-mode-selective PL at 1550 nm. ....................................................................................... - 36 - Fig. III - 17. Fifteen modes mode-selective photonic lantern. a) Fiber core positions. b) Near field mode profiles, and
c) far field mode profiles at 1550 nm (only one degenerate mode per fiber core size is shown). ......... - 37 - Fig. III - 18. Group-mode-selective photonic lantern. a) Fiber core distribution and b) near field mode profiles at
1550 nm. .......................................................................................................................................... - 38 - Fig. III - 19. Near-field LP02 mode profile from MSPLs with different transitions lengths: (a) step-index and (b)
graded-index fibers........................................................................................................................... - 39 - Fig. III - 20. Near field mode profiles at a wavelength of 980 nm from: a) three, b) six, c) ten, and d) fifteen fiber
MSPLs. ............................................................................................................................................. - 41 - Fig. III - 21. Near field mode profiles from a three fibers MSPL with a tapering factor of 14.4 at a wavelengths of:
a) 980 nm, b) 1310 nm, and c) 1550 nm. ........................................................................................... - 41 - Fig. III - 22. Ten fiber PLs with different light patterns at the output. Different fiber diameters: a) fiber core
distributions and b) near field mode profiles. Different fiber positions: c) fiber core distributions and d)
near field mode profiles. ................................................................................................................... - 42 - Fig. III - 23. Defect present during the PLs fabrication process: a) image of an air bubble encapsulated in the
transition section, and b) near field mode profiles from a fifteen fiber MSPL with defects. ................. - 43 - Fig. III - 24. Mode-intensity profiles from the MSPLs: a) near field and b) far field mode profiles. c) Theoretical light
distributions of the fiber LP modes included for direct comparison. ................................................... - 44 - Fig. III - 25. Near field mode profiles of the MSPLs spliced to FMFs. a) Three fiber MSPL spliced to a 2 LP mode FMF.
b) Six fiber MSPL spliced to a 6 LP mode FMF. c) Ten fiber MSPL spliced to a 6 LP mode FMF. d) Fifteen
fiber MSPL spliced to a MMF and then to a 9 LP mode FMF. .............................................................. - 47 - Fig. III - 26. Theoretical transfer matrices for ideal mode-selective ten fiber PLs. a) Perfect mode-selective fiber
transmission system without group or degenerate modal mixing. Perfect mode group-selective fiber
transmission system: b) fiber to fiber and c) mode-group blocks representations. Fiber No. 1 correspond
to the lowest order mode, whereas fiber No. 10 correspond to the highest order mode. .................... - 48 - Fig. III - 27. Transfer matrices showing the normalized light intensity. Ten fiber MSPL with a) fiber-to-fiber and
b) mode-group blocks representations. Fifteen fiber PL without modal selectivity with c) fiber to fiber and
d) mode-group blocks representations. ............................................................................................. - 48 - Fig. III - 28. Comparison between experimental results obtained for photonic lanterns with and without modal
selectivity. ........................................................................................................................................ - 49 -
Fig. IV - 1. Micro-ring resonator scheme. A light signal (EI1) is launched through a single-mode waveguide and
coupled to the resonant cavity (radius R), yielding a resonant response (EO1). .................................... - 52 -
Fig. IV - 2. Typical transmission spectra from a micro-ring resonators (R = 62.5 m). ......................................... - 53 - Fig. IV - 3. Example of a multimode WGM resonator in a sphere. Top: intensity distributions at the surface of the
sphere; the insets show the intensity at the cross-section of the sphere for the fundamental mode and
second-order radial and azimuthal mode, respectively. Bottom: the corresponding effective potentials
and wavefunctions. Taken from [31] ................................................................................................. - 54 - Fig. IV - 4. Sensing responses in micro-ring resonators. a) Change in the resonance wavelength. b) Change in the
quality factor. c) Change in the peak transmission. Taken from [30]. ................................................. - 55 - Fig. IV - 5. Light confinement in MRRs with circular cross-section: a) bulk materials (WGM resonances), b) single-
layer coating, c) multilayer coatings, and d) functional polymer multilayer coated MRR. ................... - 56 - Fig. IV - 6. Wire coating technique scheme. A layer of coating material (thickness h) is left on the surface of the wire
(radius r) by pulling the coating material at a constant velocity (V) through a liquid container ........... - 57 -

v
Fig. IV - 7. Optical microscope image from the coating instabilities produced when coating an optical fiber with
PDMS containing a colorant. ............................................................................................................ - 58 - Fig. IV - 8. Scanning electronic microscopy (SEM) images of an optical fiber coated with a layer of UVpoly of
approximately 1.15 μm at a speed of 1 mm/min: a) initial section of the coating, and b) uniformly coated
optical fiber (bright dot caused by sample preparation-manipulation for SEM imaging)..................... - 59 - Fig. IV - 9. Measured layer thicknesses for the UVpoly at different coating velocities and calculated thickness for
two different temperatures. ............................................................................................................. - 60 - Fig. IV - 10. Characterization of the coating layer thickness for PDMS at different coating velocities and viscosities. ..
........................................................................................................................................................ - 61 - Fig. IV - 11. Transmission losses registered after coating with tapered optical fibers polymer thin-layers. .......... - 62 - Fig. IV - 12. Characterization of the layer thickness of UVpoly for multiple layers on optical fibers: a) SEM images of
the bare and coated fibers; b) measured thicknesses for the layers and fitting using the slipping condition
(see text). ......................................................................................................................................... - 63 - Fig. IV - 13. PDMS+DR1 azopolymer characterization. a) Absorbance spectrum. b) Photoinduced birefringence with
a laser beam of 475 nm and measured at 633 nm. ............................................................................ - 65 -
Fig. IV - 14. Emission spectrum from the PDMS+Yb composite upon irradiation with a = 975 nm laser diode. .. - 66 - Fig. IV - 15. a) Typical transmission spectrum for an all-glass MRR. The resonant element is a SMF silica fiber
(125±0.7 m diameter); b) FFT obtained from the transmission spectrum. ....................................... - 68 - Fig. IV - 16. Transmission spectra for two different states of polarization (SOP) coupled into the SMF-based MRRs. ...
........................................................................................................................................................ - 68 -
Fig. IV - 17. Transmission spectra and FFT for the MRRs using single-layer coatings (1.55 m thicknesses) of:
a) PDMS, b) PDMS+DR1, and c) PDMS+Yb. ........................................................................................ - 69 - Fig. IV - 18. Insertion losses and resonance features in the transmission spectra for the MRRs. .......................... - 70 - Fig. IV - 19. a) Illustration of the multilayer coated micro-ring resonator. b) Experimental setup to excite and
analyze the multilayer MRRs............................................................................................................. - 71 - Fig. IV - 20. Transmission spectra of the multilayer MRRs coated with photoactive materials. ........................... - 72 - Fig. IV - 21. Wavelength peak shift upon 975 nm laser signal excitation in different polymer coated micro-ring
resonators. ....................................................................................................................................... - 72 - Fig. IV - 22. Illustration of a multilayer coated MRR packed in PDMS ................................................................. - 73 - Fig. IV - 23. Pure silica rod used as micro-resonator packed entirely in PDMS..................................................... - 74 -
Table II - 1. List of LP fiber modes and their corresponding degenerate modes [41]. ........................................... - 11 - Table II - 2. List of LP fiber modes corresponding to the different mode groups classification (M). ...................... - 14 -
Table III - 1. Near field mode purity analysis of the MSPLs. ................................................................................ - 44 - Table III - 2. Characteristics of the graded-index fibers coupled to MSPLs. ......................................................... - 45 - Table III - 3. Coupling losses resulting from MSPLs and FMFs splices. ................................................................. - 46 -

vi
AGRADECIMIENTOS /
ACKNOWLEDGMENTS
En primer lugar quiero agradecer a mis padres y hermano por todo su apoyo incondicional
día a día, sin ellos no hubiese podido terminar este trabajo. Infinitas gracias por todas las enseñanzas,
consejos de vida y por darme fuerzas y ánimo en todo momento y ocasión. Lo que he logrado es
gracias a ustedes.
Agradezco enormemente a mi tutor Juan Hernández Cordero por haberme guiado en todos mis
estudios y preparación a lo largo del posgrado. Gracias por compartir sus conocimientos, ofrecerme
excelentes oportunidades para desarrollarme, por las largas pláticas en diversos temas, su confianza
y en especial su amistad.
Gracias a los miembros del jurado, los Drs. Augusto García Valenzuela, Ramón Gutiérrez Castrejón,
Mathieu Hautefeuille y Nicolas Fontaine, por su tiempo, observaciones y sugerencias. Adicionalmente
agradezco a los miembros de mi comité tutor, Drs. Mathieu y Naser, quienes a lo largo de mis estudios
de doctorado me proporcionaron siempre consejos para la realización de mi trabajo de investigación,
y sobre todo por esas preguntas inocentes que son siempre las más difíciles de contestar pero de las
que más aprende uno.
I would like to thank Dr. Rodrigo Amezcua-Correa from CREOL for the great opportunity to work
with him. It was an extraordinary and enlightening experience for me, in which I acquired an
immense amount of knowledge, experience, and impacted my professional career in a remarkable
way. I also would like to thank to Dr. Guifang Li and his research group for the very important
collaboration. I would like to include Enrique Antonio-Lopez and Juan C. Alvarado-Zacarías, for their
invaluable help and partnership to conduct my research during my stay in CREOL.
I want to thank to Drs. Nicolas Fontaine, Roland Ryf, and Haoshuo Chen from Bell Labs/Nokia for
allowing me to perform research under their supervision. Especially, I want to thank to Nick for all
the help during my time in Bell Labs, for his trust, fun at the lab, and friendship. Also, I would like to
thank to all the people that I met in Bell Labs, particularly to Guilhem De V., Gregory R., Damiano B.,
Joseph K., and Pat for their kindness, good moments, and help in so many aspects.
In addition, I would like to thank to Dr. Sergio León-Saval and Dr. Chigo Okonkwo for their valuable
advices during the conferences and collaborations.
Gracias a todos los compañeros del laboratorio de Fotónica y Dispositivos de Fibra óptica del IIM-
UNAM (Violeta, Yadira, Mildred, Beatriz, Reinher, Natanael, Giovani y Rodrigo). Gracias a ustedes
aprendí mucho dentro y fuera del laboratorio, además de que siempre me ayudaron en todo lo

vii
posible. También quiero mencionar a todos aquellos que de alguna forma indirecta me apoyaron para
poder dar término a esta etapa de mi vida; gracias a todos mis amigos y personas especiales.
Por último, quiero agradecer a las instituciones que hicieron posible la realización de mi trabajo de
investigación. Gracias al Instituto de Investigaciones en Materiales de la UNAM por las instalaciones
y el equipo proporcionado durante estos años. Gracias al Dr. Francisco Sánchez Arévalo por
permitirme hacer uso de su laboratorio y equipo. Le agradezco al Dr. Omar Novelo por la asistencia
en las sesiones de microscopía electrónica, vitales para obtener resultados de mi tesis. Gracias a la
UNAM por el apoyo brindado mediante la beca de doctorado y los proyectos PAPIIT IN102112,
IN108016 y IT101215.
Gracias también al CONACyT por la beca otorgada durante mis estudios de Doctorado, el apoyo de
beca mixta para poder realizar mis estancias de investigación en CREOL ubicado en la Universidad
Central de Florida, USA, así como por el apoyo mediante el proyecto 154464.

viii
RESUMEN
Los dispositivos de fibra óptica han probado ser una de las tecnologías más eficientes para la
transmisión y procesamiento de la luz durante las últimas décadas. Este trabajo se centra en los
detalles y parámetros de la fabricación de dos tipos de dispositivos totalmente de fibra óptica:
linternas fotónicas y micro resonadores de anillo. Las linternas fotónicas de fibra óptica son de gran
interés para la siguiente generación de sistemas de comunicaciones. La selectividad modal en estos
dispositivos fue lograda mediante los procesos de fabricación descritos en este trabajo. Dicha
característica otorga la capacidad de generar diferentes modos espaciales de manera independiente
mediante cada una de las fibras de entrada, donde fue capaz de demostrar dispositivos de hasta
nueve diferentes modos linealmente polarizados en las fibras. La diversidad de núcleos de las fibras
ópticas y sus posiciones específicas dentro de las linternas fotónicas para lograr de manera exitosa
estos resultados fueron halladas experimentalmente. Adicionalmente, un nuevo método de
fabricación para estos dispositivos mediante preformas micro estructuradas especiales fue utilizado
para demostrar la posibilidad de escalar la fabricación de dispositivos con un gran número de fibras.
Los dispositivos fabricados fueron caracterizados analizando los patrones de luz generados en su
puerto de salida. Los resultados obtenidos en este trabajo proveen las bases para la fabricación de
dichos dispositivos en desarrollo con selectividad modal.
Una nueva técnica para fabricar micro resonadores mediante el uso de elementos cilíndricos
recubiertos con múltiples capas de polímero es igualmente presentada, incluyendo fibras ópticas
estándar de vidrio y tubos capilares de vidrio. Mediante esta técnica, las características espectrales
de los resonadores pueden ser establecidas para satisfacer requerimientos específicos. La posibilidad
de emplear materiales funcionalizados fue comprobada utilizando como recubrimientos polímeros
fluorescentes y reconfigurables, los cuales mostraron ser útiles para ajustar la respuesta espectral de
los resonadores. El procedimiento de fabricación de estos dispositivos y las consideraciones
consecuentes son discutidos, incluyendo su uso potencial para el desarrollo de elementos de sensado.

ix
ABSTRACT
Fiber optic devices have proved to be one of the most efficient technologies for light
transmission and processing over the last decades. This works covers the relevant details and
parameters for the fabrication of two types of all-fiber devices: photonic lanterns and micro-ring
resonators. All-fiber photonic lanterns are of interest for the next generation of optical
communication systems. Modal selectivity of these devices was achieved following the fabrication
procedures described in this work. This feature grants the capability to address independently
different spatial modes with each input fiber, and we were able to demonstrate devices exciting up
to nine different LP fiber modes. The required diversity of fiber core diameters and their specific
positions within the photonic lanterns to successfully achieve these results were found
experimentally. Additionally, a novel fabrication approach using special microstructured preforms
was used to demonstrate the possibility to scale the fabrication of devices with a larger number of
fibers. The fabricated devices were characterization by analyzing the light patterns generated at the
output end. Results obtained in this work provide the foundations for the fabrication of these
emerging fiber devices with modal selectivity.
A new technique to fabricate micro ring resonators is also presented using polymer multilayer
coatings on cylindrical elements, including standard glass fibers and glass capillaries. With this
technique, the spectral features of the resonators can be tailored to fulfill specific requirements. The
possibility to employ functionalized materials was validated using fluorescent and optical
reconfigurable polymers as coatings, which were show to be useful for tuning the spectral response
of the resonators. The procedure to fabricate these devices and further fabrication considerations
are discussed, including their potential use for developing sensing elements.

- 1 -
CHAPTER I: INTRODUCTION
The use of light has quickly spread into several fields of life with a great number of
applications ranging from the understanding of matter, to new ways of entertainment. In science and
technology, it has proved to be extremely useful in a wide variety of applications. Major applications
ranges technological areas involving data transmission, material processing, imaging, and sensing;
other purposes include biological organisms and their interaction with light, as well as exploration
of new horizons in astrophotonics and manipulation of miniature objects [1-10]. Therefore, elements
capable of perform light processing are required for numerous purposes, such as light shaping,
filtering, sensing, etc. Light confinement and transmission are also crucial features for optical
interconnection of photonic systems, where optical fibers have demonstrated to be remarkably
efficient and versatile.
Among the many characteristics of optical fibers, the most attractive are the intrinsic minimal losses,
micrometric size, good compatibility with existing technologies, and low cost. Their physical features
(e.g., geometry, size, etc.) can also be further modified by post-processing or by the addition of
materials in specific sections, aiming at providing additional functionalities for different applications.
Post-processing of optical fibers is in fact one of the most used approaches for fabrication of fiber
optic devices such as couplers, allowing linking not only optical fibers but also between photonic
structures. A wide variety of devices working on this principle are currently available, e.g. fiber
couplers, long period gratings, mode scramblers, etc. These devices can redistribute optical signals
either in the frequency or in the spatial domain. Frequency-selective devices allow to separate and
to manipulate wavelengths in a very precise manner, a useful feature for redirecting a signal or for
filtering. Spatial-selective devices offer the capacity to manipulate the light intensity distribution
confined within a specific area of a photonic structure.
Fiber optic technology has grown enormously owing to the versatility and advantages of the use of
light on the last years. Many of the applications use single-mode fibers and hybrid free space/fiber
optic devices for their simplicity of fabrication, ease of analysis, and the extensive availability of tools
and equipment already developed for these purposes. In general, fiber optic systems are developed
aiming at avoiding the use of free-space optical devices because this results in less complex
assemblies and lower losses due to coupling and interconnection. A desired approach to reach these
goals is the inclusion of all-fiber devices able to perform a series of light processing functions.
Additionally, switching from single-mode to multimode devices offers the opportunity of increasing
the capabilities for information acquisition and processing. Low losses and high compatibility with
standard fiber technologies are hence highly desirable features for current fiber devices. The focus
of the present work is centered on the fabrication and characterization of optical fiber devices

- 2 -
intended for optical telecommunications and sensing applications: photonic lanterns and micro-ring
resonators.
I.1 BACKGROUND
I.1.1 SPACE DIVISION MULTIPLEXING (SDM)
Optical communications is an area of technology that has expanded all over the world during
the last decades thanks to the use of optical fibers. The increasing progress in electronics and
informatics demands a growth in communications capable of handling the immense amount of data
[11]. Increase in deployment of actual single-mode optic fiber (SMF) systems is not a feasible option
due to high cost of equipment and devices. Various techniques to increase data transmission in a sole
SMF have made use of wavelength division multiplexing (WDM), time division multiplexing (TDM),
polarization division multiplexing (PDM), and modulation of phase and quadrature of optical signals
[11-13]. However, because of the non-linear Shannon limitation of single-mode fiber systems a
different approach is necessary to overcome capacity crunch in optical systems.
Space division multiplexing (SDM) has emerged as an alternative to increase data transmission in a
single optical fiber. SDM technique consists in using the different spatial modes as independent
transmission channels. This technique involves the use of multimode fibers which have a bigger core
diameter and hence the fiber non-linearity decreases [11-13]. The use of SDM in telecommunications
has been already demonstrated to work successfully for a few modes [14]. Nevertheless, the need for
multiplexers (MUX) and demultiplexers (DEMUX) are required as critical components to link single-
mode to multimode devices. Previous implementations for the generation of spatial modes were
based on bulk phase masks or integrated devices to directly excite the modes in multimode fibers
[15, 16]. A drawback from phase masks are the large insertion losses and scaling to a high number of
modes is thus severely limited [17, 18]. Alike phase masks, an approach to excite the linear
combination of modes was by spot launching technique by means of bulk optics [19]. Similarly, spot
arrays can be generated by 3D laser inscribed waveguides proving to be a compact and passive
element compatible with multimode fibers [18, 20]. Resonant fiber and waveguide-based mode MUX
such as fused fiber couplers, long period gratings, Y-junctions, and micro-ring resonators have also
been proposed [21, 22]. A solution based on optical fibers has emerged to solve this problematic, the
photonic lantern [23]. These all-fiber devices are able to perform as MUX/DEMUX devices with low-
insertion loss and precise modal control based on the fabrication parameters, proving to be an
exceptional alternative.

- 3 -
I.1.2 OPTICAL MICRO–RING RESONATORS
Optical sensing techniques are currently very popular because of their potential for highly
sensitive detection of micro- and nanometer scale particles; these are also capable of detecting
diminutive change in some materials properties [24, 25]. Non-contact sensing and risk-free
techniques are also available; hence, offering advantages when compared to mechanical and
electrical approaches [26]. Light confinement at micrometric scales is an attractive feature that has
impelled the fabrication of integrated optical elements based on mature technological platforms. An
example of a highly sensitive device, useful for sensing and for light modulation is the micro-ring
resonator. This resonant element confines light at specific wavelengths depending on physical
parameters such as refractive index, geometry, and optical absorption. A slight modification in any
of the resonator parameters will generate a noticeable change in the spectral response.
Fabrication of optical micro-resonators by photolithography processes is a mature technology in
integrated photonics devices [27-30]. Nonetheless, a variety of techniques can be implemented to
fabricate these devices depending on the sought application. Tapered optical fibers are commonly
used in micro-ring devices in order to couple light into micro-spheres or micro-disks [30, 31].
Another fabrication technique involves the entanglement of subwavelength tapered fibers to obtain
a micro-knot. This approach, yields devices with good quality response but involves a high difficulty
of fabrication [30, 32, 33]. Other techniques require special fibers like photonic crystal fibers [34],
thin capillaries [35], or bottle-like resonators [36].
Micro-ring resonators are of great interest due to their wide range of applications. Biosensing is one
of the trendiest applications, since single virus and protein or DNA detection can be accomplished
[24, 30, 37]. Properties of liquids and solutions such as the change in concentrations or refractive
index can also be detected using these elements [38]. Detection and monitoring of thermal effects on
small-scale objects is one of the current challenges that have been recently addressed with micro-
resonators [39]. Development of miniature lasers is another hot topic in photonics, and micro-
resonators have also shown to be useful for implementing micrometer size tunable lasers [40].
I.2 OBJECTIVES
This work focuses on the fabrication and characterization of two optical fiber devices:
photonic lanterns and micro-ring resonators. The key aspects and issues found during the fabrication
processes of both devices are covered in the following sections. A photonic lantern is sought to create
a fiber-based solution for space division multiplexing systems, specifically in the area of optical fiber
communications. In essence, a photonic lantern serves as MUX/DEMUX elements for SDM systems.
The pursuit to establish a standardized fabrication process is investigated in this work, looking to
create photonic lanterns capable of addressing different numbers of modes. Further assessments of
the fabrication process include the conditions to obtain devices with modal selectivity and low losses.
- 4 -
The suitability of these devices for fiber optic communications is assessed upon evaluating their
modal features, and coupling to multimode fibers. Finally, an alternative approach for the fabrication
of micro-ring resonators is explored, aiming at developing versatile devices. The proposed
fabrication method involves the use of low-cost materials and standard methodologies used for fiber
optic technology. An interesting feature for a wavelength responsive component is a tunable
response. This aspect is studied upon modifying the resonant elements using different materials used
as coatings on the resonators.
The organization of the present dissertation is as follows: In Chapter II a brief summary of the
fundamentals of light propagation in fiber optics relevant for this work, and the basis of the tapering
and coupling processes are presented. The operation and fabrication principles of the photonic
lanterns and a summary of the required parameters to obtain modal selectivity, as well as the
characterization of the fabricated devices, are described in Chapter III. Chapter IV covers an
alternative way to fabricate micro-ring resonators based on a functional polymer multilayers
approach and the considerations to be taken into account for these devices. Finally, in Chapter V the
conclusions and future work are presented. A list of the publications resulting from the entire
research conducted during my PhD studies is included in Appendix B.

- 5 -
CHAPTER II: FIBER OPTICS
FUNDAMENTALS-PROPAGATION,
TAPERING, AND COUPLING PROCESS
Optical fibers are dielectric waveguides with cylindrical geometries formed by two concentric
structures: a core and a cladding [1, 2, 41]. Light is confined and transmitted through this structure
travelling mostly within the core, while the cladding serves as an isolation medium around the core.
Propagation of light in waveguides can be analyzed by geometrical optics approach based on Snell’s
law, describing the total reflection of light inside dielectric structures [1, 41]. This phenomenon is
due different refractive indices of the materials used in the cladding and the core, and ultimately
defines the propagation features of the light in the fiber waveguide.
Depending on the physical characteristics of the fiber, a certain number of rays will be totally
reflected within the core/cladding interface and these represent the optical paths, or modes, that
light can follow inside the waveguide. A single-mode fiber (SMF) results when only one trajectory is
allowed; if multiple trajectories are allowed, the waveguide is defined as a multimode fiber (MMF).
While the diameter of the cladding can range from micrometers to a few millimeters, the core is
usually of a few micrometers. Fabrication of fiber-based devices, such as photonic lanterns and
micro-resonators, requires full understanding of light propagation in optical fibers. Hence, a detailed
description of light propagation in these waveguides will be discussed in the following section.
II.1 PROPAGATION OF LIGHT IN OPTICAL FIBERS
A formal description of light propagation in waveguides with dimensions close to the
wavelength requires wave theory. The propagation characteristics within a waveguide can be
obtained using Maxwell’s equations. For media with no charge, lossless, linear, and isotropic, the
electric (E) and magnetic (B) fields are described by [1, 2, 41]:
t
BE <II.1>
t
DH <II.2>
0 D <II.3>

- 6 -
0 B <II.4>
D and B are the electric and magnetic flux densities, respectively. These parameters are defined by
the constitutive relations:
D E <II.5>
B H <II.6>
where 𝜀and μ are the permittivity and permeability of the medium, respectively.
Upon applying the curl, and after some manipulations of the above equations (<II.1> and <II.2>), the
wave equation for E and H can be obtained as:
2
2t t t t t
E B H D E <II.7>
2
2t t t t t
H D E B H <II.8>
Using the vector identity 2- A A A on <II.7> and <II.8>, it yields in:
22
20
t
E E <II.9>
22
20
t
H H <II.10>
Typically, the E-field equation is solved in terms of a harmonic function in the time domain with the
form cosz zg t tv v
, where is the angular frequency 2 f , f is the frequency,
and v the phase velocity. Further simplifications can be made upon considering field propagation
along the z-axis and using the complex form j te
. The propagation constant, is defined as the
phase shift rate of the wave when traveling a given distance in z. Alternatively, this can also be defined
asv
. Using the phasor representation, and defining k , the wave equations for the
electric and magnetic fields yields the Helmholtz equations [1, 41]:
2 2 0k E E <II.11>
2 2 0k H H <II.12>
For light propagation in one direction (z-direction) through the waveguide and assuming a planar
wave in the xy-plane, the propagation constant is given by:

- 7 -
0k nk <II.13>
where k0 is the propagation constant in free space. Propagation in the z-direction can be represented
by a factor j ze
and this result in the following expressions for the electric and magnetic fields:
0, , , j zx y z x y e E = E = E <II.14>
0, , , j zx y z x y e H = H = H <II.15>
The resulting Helmholtz equations are then given by:
2 2 2
0 0 0k E E <II.16>
2 2 2
0 0 0k H H <II.17>
Then, the refractive index can be described as the impedance of the medium as:
0
0
nk
E
H <II.18>
Light confinement and propagation in optical fibers is described in terms of the guiding structure. As
the fibers possess cylindrical geometry, it is convenient to use cylindrical coordinates: radius r,
azimuthal angle , and z. Figure II-1 shows a schematic representation of an optical fiber, with a core
of radius a surrounded by the cladding, and with a step-index variation.
0 , core
( ), cladding
co
cl
n r an r
n r a
<II.19>
Fig. II - 1. Step-index optical fiber scheme and its refractive index profile.
To fulfill the total internal reflection criteria, the relationship co cln n has to be satisfied. Hence, light
confinement within the optical fiber is defined in terms of the materials and their refractive indices.
For a step-index fiber, such as the one depicted in Figure II-1, the difference in refractive indices is
customarily defined as [1, 2, 41, 42]:
- 8 -
2 2
22
co cl co cl
co co co
n n n n n
n n n
<II.20>
Typically, in optical fibers only a small number of trajectories or modes are desired to be transmitted.
Such a goal is achieved with small core diameters and by generating a very low-refractive index
difference among the core and cladding materials 1co cln n [2]. Under these circumstances only
one or few modes are allowed to be transmitted, suppressing the rest of the modes. This condition is
defined as the weakly guiding approximation.
Another important parameter is the maximum acceptance angle of incidence M a x for which the
light rays can be confined in the waveguide. This angle is defined in terms of the numerical aperture,
NA, defined as:
2 2
co clNA r n r n <II.21>
For simplicity, in what follows only step-index fibers operating in the weakly guiding approximation
will be considered to analyze the electric field propagation in optical fibers.
Given the cylindrical geometry of the fibers, transverse fields with an arbitrary state of polarization
can be considered for the propagation analysis. The axial components of the electromagnetic wave,
E0 and H0, can be obtained considering a general function ,r , and the Helmholtz equation [2,
41, 42]:
2 2 2 0 k <II.22>
The transverse field variations are defined only in terms of r and ; then, using the Laplacian in
cylindrical coordinates the above equation is explicitly:
2 2
2 2
2 2 2
1 10k r
r r r r
<II.23>
Each of the solutions for Eq. <II.23> represents a mode traveling along the z-direction. These can be
obtained using separation of variables. First, azimuthal symmetry allows for 2periodic solutions
in ; hence, the full solution will read:
, , j z jp j zr z r e r e e R R <II.24>
where p is an integer ( 0,1,2,...p ). Substitution of this function in Eq. <II.23> yields the
corresponding equation for the radial coordinate, R(r):
2 2
2 2
2 2
10
R R pk r R
r r r r
<II.25>

- 9 -
Since the energy distribution inside the fiber is determined by the physical properties of the
structure, the solutions of the wave equation allow for multiple propagating modes. The field
distribution on the optical fiber is then established by the core-cladding existing boundary, and two
regimes can be defined owing to these sections:
22 2
2
0
22
2
0
, guided mode ( )
0 , radiated mode ( )
cl co
cl
n n r ak
n r ak
<II.26>
It is convenient to separate both regions using the following definitions:
2 2 2
0 coU a k n <II.27>
2 2 2
0 clW a k n <II.28>
Using these, Eq. <II.25> can be separated in two independent equations, one for the core and one for
the cladding:
2 2
2 2 2
2 2
2 2 2
10,
10,
R R U pR r a
r r r a r
R R W pR r a
r r r a r
<II.29>
The solutions for these equations are in the form of Bessel functions pJ (first kind Bessel function)
and pK (modified Bessel function), where p is the order of the corresponding function. Considering
the components of the propagated wave, the solutions for E and H are then obtained in the z-direction
as [1, 2, 41]:
1
2
sin ,
sin ,
j z
p
zj z
p
UrA J p e r aa
EWrA K p e r a
a
<II.30>
1
2
cos ,
cos ,
j z
p
zj z
p
UrB J p e r aa
HWrB K p e r a
a
<II.31>
where A1,2 and B1,2 are constants. The radial distribution of the electromagnetic field defined by pJ
show an oscillatory behavior inside the core region. Resulting number of oscillations for each mode

- 10 -
will depend on the order p, decreasing in amplitude in the radial direction. Similarly, the pK
functions define an exponential decay in the field distribution, and a larger value for p indicates a
more rapid decay. This decaying field in the cladding region is known as the evanescent field in
optical fibers.
II.1.1 MODES IN OPTICAL FIBERS
The solutions of the wave equation determine the multiple modes of the electric and magnetic
fields able to propagate inside the core. These solutions define the propagation constants and hence,
the modal refractive indices, which are also affected by the core. Since the physical properties of the
structure determine the number of modes, fibers with a large core diameter or large refractive index
difference are generally capable of supporting numerous modes. The weakly guiding approximation
provides a useful means to simplify the analysis of light propagation with scalar calculations in
optical fibers [2, 41-43].
In general, fibers can support different EM wave polarizations: transverse electrical (TE), transverse
magnetic (TM), or hybrid modes, as in the case of skewed rays (EH and HE). For each of these
polarizations, a corresponding solution can be found. However, using the weakly guiding
approximation, several TE, TM, EH, and HE modes will have the same propagation constants, i.e., they
become degenerate modes. Hence, aggrupation of modes with the same can be denoted as linearly
polarized modes, or LP modes. The solutions are then given in terms of the LPlm modes, in which l
and m represent the azimuthal and radial indices of the modes, respectively. These new sets of indices
are related to the index p (with multiple solutions of mth order) as [2, 41]:
1 TE , TM , 0
1 EH , 1
1 HE , 1
lm lm
lm
lm
m
l p m
p m
<II.32>
LPlm modes arise from the assumption of a wave maintaining its polarization during propagation;
superposition of degenerate modes is also considered. The values for the subscript l indicate the half
of the minima or maxima in the intensity pattern, whereas the values of m represent the number of
maxima along the radial direction. It is worth mentioning that for all of the LP modes, with exception
of the LP0m, there will be a set of two degenerate modes, a and b. The only difference between these
degenerate modes is a rotation, yielding a swapping between the minima and maxima in the intensity
patterns. Examples of intensity profiles for the twelve lower order LP modes in step-index fibers are
shown in Figure II-2. This classification of modes is used in practice to describe the field-intensity
profile of the modes. However, during propagation, energy exchange can occur among modes with
similar propagation constant, such as the degenerate modes [2, 41, 44]. Table II-1 lists the degenerate
modes of the LP modes shown in Figure II-2.

- 11 -
Table II - 1. List of LP fiber modes and their corresponding degenerate modes [41].
LP mode Degenerate modes
LP01 HE11
LP11 TE01, TM01, HE21
LP21 EH11, HE31
LP02 HE12
LP31 EH21, HE41
LP12 TE02, TM02, HE22
LP41 EH31, HE51
LP22 EH12, HE32
LP03 HE13
LP51 EH41, HE61
LP32 EH22, HE42
LP13 TE03, TM03, HE23
Fig. II - 2. Field-intensity distributions of the first twelve lower order LP modes.
An important parameter, useful to estimate the number of modes and the corresponding propagation
constants is the normalized frequency, also called the V-number, calculated as [1, 2, 41, 42]:
2 2 2 2
0
0
2co cl
aV U W k a n n NA
<II.33>
Finally, a complete description of the propagating modes in fibers requires the propagation constant
lm for each LP mode. These can be obtained in terms of the normalized propagation constant, b,
given by:
2 2 22 2
0
2 2 2 2 2 2
0 0
1 cl
co cl
n kU Wb
V V n k n k
<II.34>
The range of values that b can take is 0 1b , where the normalized cutoff frequency is obtained for
b = 0. Hence, the propagation constant for each mode can be determined by [41, 42]:
2
0 0 0 21 2 1 1 1 lm
lm cl cl cl
Un k b n k b n k
V
<II.35>
A plot of the normalized propagation constant as a function of the normalized frequency is shown in
Figure II-3.

- 12 -
Fig. II - 3. Propagation of the LP modes (marked in the corresponding plot) dependent of normalized propagation constant (b) as function of the normalized frequency (V) in step-index fibers. Taken from [2].
It is clear from Figure II-3 that for a fixed value of V, only a given number of modes can propagate in
a step-index fiber. Single-mode operation for a fiber guiding only the LP01 is achieved when
2.405V . Larger values of V will result in a fiber capable of supporting propagation of multiple
modes (i.e., a multimode fiber). Increasing V will therefore increase the number of modes transmitted
in a fiber (see Eq. <II.33>). In practice, this is achieved using a larger core diameter, or upon
increasing the difference in refractive indices of the fiber. In MMFs with a large value of V, the number
of modes (N) can be estimated as [23, 42]:
2
4
VN <II.36>
Habitual core sizes for SMFs used in the telecommunications area range between 4 to 10 m, whereas
for MMFs the core sizes range from 50 to 62.5 m. For both types of fibers, the outer diameter
(cladding size) is typically 125 m [45-47]. In the last few years, few-mode fibers (FMFs) have
attracted a lot of attention due to their capability to operate in the multimode regime, but only
propagating a few lower order modes [48, 49]. This type of fiber has been used mostly for optical
telecommunications, and in particular in the area of space division multiplexing, employing each
mode as an independent channel for data transmission [11, 14, 50]. To date, FMFs are intended to
transmit 3, 6, and 9 LP modes with minimum crosstalk [49-53].

- 13 -
II.1.2 GRADED-INDEX FIBERS
In graded-index fibers (GIFs), the value of the refractive index increases gradually from the
cladding-core boundary to the center of the core to reach its maximum value. Such a refractive index
profile is commonly used to compensate the difference of group velocities of the different modes
propagating in MMFs. As a consequence of the gradual variation in refractive index, rays propagating
in the core will propagate along curved trajectories as opposed to straight ones, as observed in step-
index fibers. Light propagation in GIFs is described using the same equations exposed in the previous
section. However, some important variations in the mathematical description arise from considering
the radial variation in refractive index. Nonetheless, the propagation constants may also be obtained
for each mode using approximated solutions for the appropriate equations [2, 42, 44].
A description of the core refractive index distribution in GIFs is typically given by the function:
2 2 1 2
q
co
rn r n
a
<II.37>
The steepness of the refractive index profile is determined by the grade profile parameter q. If 1q ,
the change in refractive index will be a linear function of r, whereas if q , the function represents
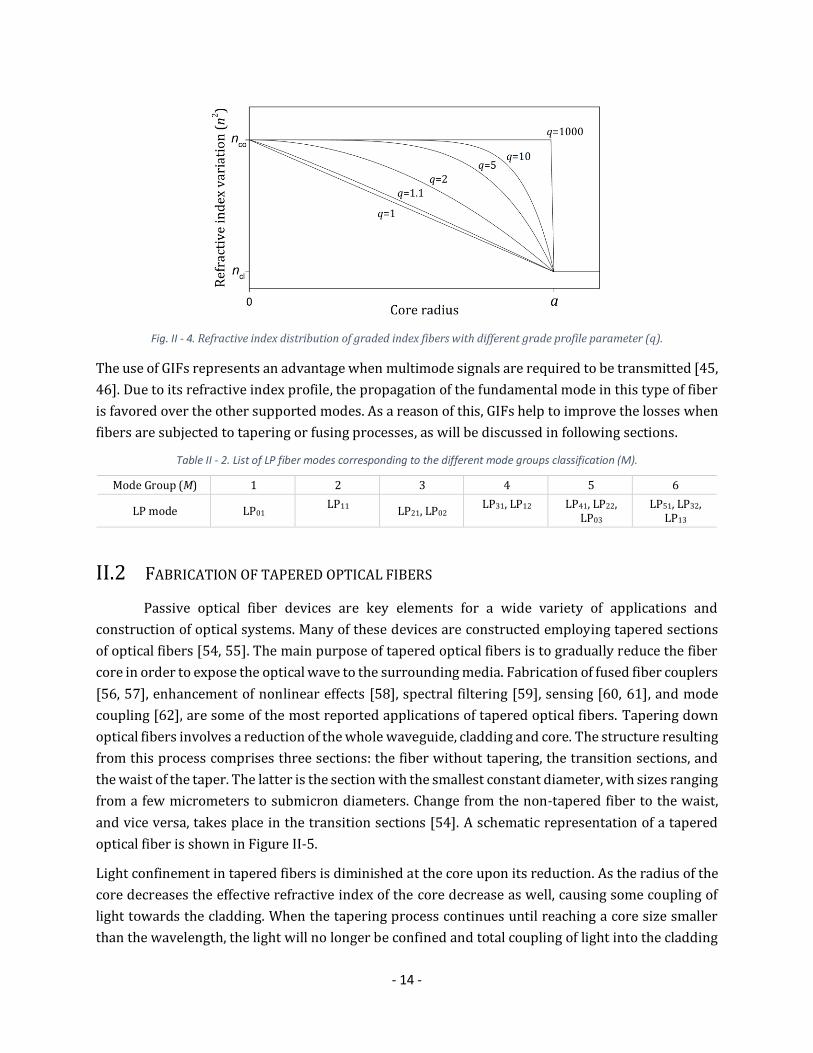
a step-index profile. The refractive index distribution in the core of the fibers is shown in Figure II-4,
illustrating the resulting index profiles for different values of q [1, 2, 42]. GIFs usually support several
or many modes; an estimate of the number of modes can be made upon proper modifications of
Eq. <II.36> taking into account the grade profile parameter:
2
2 2
qN V
q
<II.38>
For graded-index fibers another criterion is preferred to group the propagated LP modes. Upon
considering the refractive index profile, solutions of the propagation constants in GIFs can be
obtained by [2, 44]:
12
2
1 2
co
Vkn
N
(I.39)
where the principal mode groups are defined by integer solutions of the mode group number (M),
defined as [44, 45]:
2 1M m l (I.40)
- 14 -
Fig. II - 4. Refractive index distribution of graded index fibers with different grade profile parameter (q).
The use of GIFs represents an advantage when multimode signals are required to be transmitted [45,
46]. Due to its refractive index profile, the propagation of the fundamental mode in this type of fiber
is favored over the other supported modes. As a reason of this, GIFs help to improve the losses when
fibers are subjected to tapering or fusing processes, as will be discussed in following sections.
Table II - 2. List of LP fiber modes corresponding to the different mode groups classification (M).
Mode Group (M) 1 2 3 4 5 6
LP mode LP01 LP11
LP21, LP02 LP31, LP12 LP41, LP22,
LP03 LP51, LP32,
LP13
II.2 FABRICATION OF TAPERED OPTICAL FIBERS
Passive optical fiber devices are key elements for a wide variety of applications and
construction of optical systems. Many of these devices are constructed employing tapered sections
of optical fibers [54, 55]. The main purpose of tapered optical fibers is to gradually reduce the fiber
core in order to expose the optical wave to the surrounding media. Fabrication of fused fiber couplers
[56, 57], enhancement of nonlinear effects [58], spectral filtering [59], sensing [60, 61], and mode
coupling [62], are some of the most reported applications of tapered optical fibers. Tapering down
optical fibers involves a reduction of the whole waveguide, cladding and core. The structure resulting
from this process comprises three sections: the fiber without tapering, the transition sections, and
the waist of the taper. The latter is the section with the smallest constant diameter, with sizes ranging
from a few micrometers to submicron diameters. Change from the non-tapered fiber to the waist,
and vice versa, takes place in the transition sections [54]. A schematic representation of a tapered
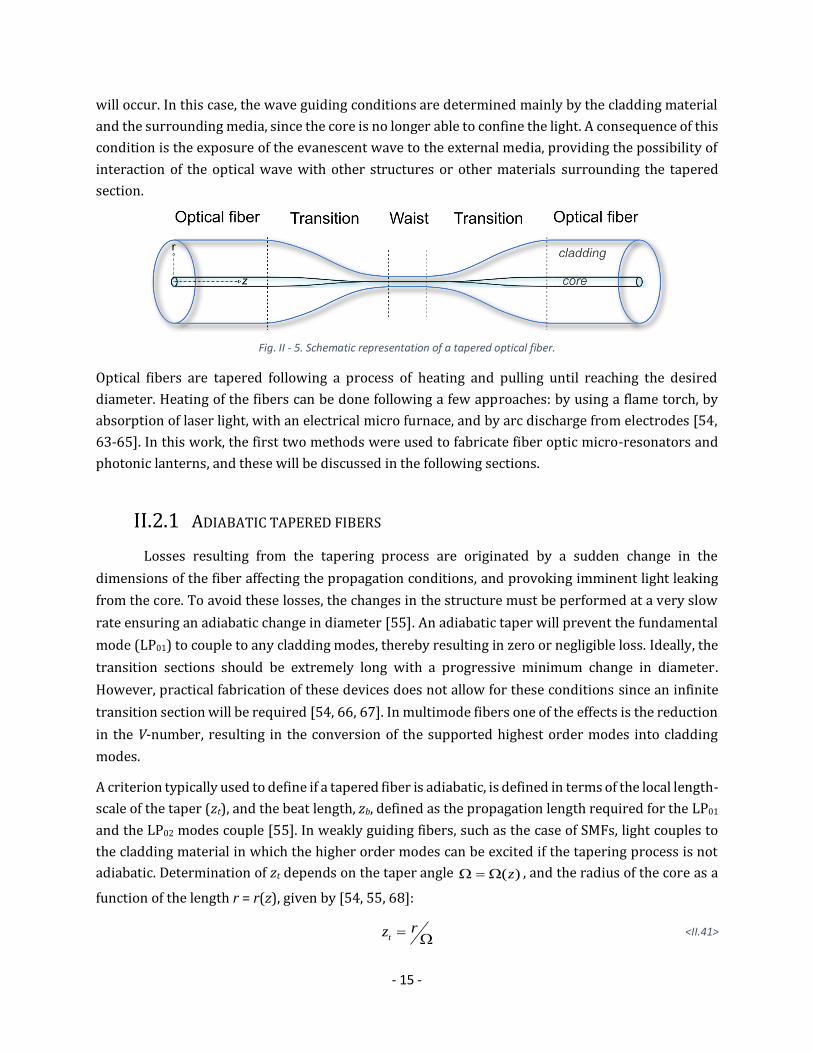
optical fiber is shown in Figure II-5.
Light confinement in tapered fibers is diminished at the core upon its reduction. As the radius of the
core decreases the effective refractive index of the core decrease as well, causing some coupling of
light towards the cladding. When the tapering process continues until reaching a core size smaller
than the wavelength, the light will no longer be confined and total coupling of light into the cladding
- 15 -
will occur. In this case, the wave guiding conditions are determined mainly by the cladding material
and the surrounding media, since the core is no longer able to confine the light. A consequence of this
condition is the exposure of the evanescent wave to the external media, providing the possibility of
interaction of the optical wave with other structures or other materials surrounding the tapered
section.
Fig. II - 5. Schematic representation of a tapered optical fiber.
Optical fibers are tapered following a process of heating and pulling until reaching the desired
diameter. Heating of the fibers can be done following a few approaches: by using a flame torch, by
absorption of laser light, with an electrical micro furnace, and by arc discharge from electrodes [54,
63-65]. In this work, the first two methods were used to fabricate fiber optic micro-resonators and
photonic lanterns, and these will be discussed in the following sections.
II.2.1 ADIABATIC TAPERED FIBERS
Losses resulting from the tapering process are originated by a sudden change in the
dimensions of the fiber affecting the propagation conditions, and provoking imminent light leaking
from the core. To avoid these losses, the changes in the structure must be performed at a very slow
rate ensuring an adiabatic change in diameter [55]. An adiabatic taper will prevent the fundamental
mode (LP01) to couple to any cladding modes, thereby resulting in zero or negligible loss. Ideally, the
transition sections should be extremely long with a progressive minimum change in diameter.
However, practical fabrication of these devices does not allow for these conditions since an infinite
transition section will be required [54, 66, 67]. In multimode fibers one of the effects is the reduction
in the V-number, resulting in the conversion of the supported highest order modes into cladding
modes.
A criterion typically used to define if a tapered fiber is adiabatic, is defined in terms of the local length-
scale of the taper (zt), and the beat length, zb, defined as the propagation length required for the LP01
and the LP02 modes couple [55]. In weakly guiding fibers, such as the case of SMFs, light couples to
the cladding material in which the higher order modes can be excited if the tapering process is not
adiabatic. Determination of zt depends on the taper angle ( )z , and the radius of the core as a
function of the length r = r(z), given by [54, 55, 68]:
t
rz
<II.41>

- 16 -
1tandr
zdz
<II.42>
For an axially symmetric tapered fiber, the LP01 mode will only couple to azimuthally symmetric
higher order modes (LP0m) propagating at the cladding material. Hence, zb depends on the
propagation constants of the LP01 mode, 1, and the second mode to couple, 2, resulting in:
1 2
2bz
<II.43>
If t bz z , light coupling from the fundamental mode to other modes is negligible and the taper is
considered adiabatic. In contrast, a taper is considered as “lossy” taper when t bz z .
As previously said, light confinement in tapers is lost when the core is reduced to a diameter
comparable to the wavelength of the signal [54, 55]. A more accurate definition for this condition is
given in terms of the core and cladding mode cutoffs. In practice, a simplified method to find this
point guiding transition is by directly using the physical parameters of the fiber. Then, a cutoff V-
number (Vcc) depending of the core and cladding radii (rcl) can be defined as [55, 68]:
2
cc
cl
Vr
Lnr
<II.44>
As an example, for typical step-index SMFs with core and cladding diameters of 8.2 and 125 m,
respectively, a value of 0.85ccV indicates when the light starts to couple from the core to the cladding
[46].
II.2.2 FABRICATION USING THE FLAME TORCH APPROACH
The tapering process by flame torch is one of the most widely used techniques owing to its
low complexity and high potential to fabricate axisymmetric submicron diameter tapers. A large
number of tapering techniques have been developed aiming at achieving full control of the shape of
the taper to comply with the adiabatic requirement and thus yielding low-loss devices [54, 61, 63-65,
69, 70]. The heat-brushing technique is the most popular approach, and this relies on a flame torch
traveling back and forth across the tapering section of the fiber under tensile stretching [54]. A
moving torch allows for defining a desired taper shape with high exactitude, which is hard to obtain
using only a stationary flame. Improvements of this technique have been developed in order to
achieve a better control, avoid imperfections, and possible mismatch generated by every sweep of
the flame [63, 64]. The fuels used for the torch are mainly butane or hydrogen gas; while the former

- 17 -
is a low-cost and widely available option, the latter provides a cleaner flame minimizing the
generation of potential impurities affecting the surface of the devices.
In the heat-brushing technique, a heating zone over a section of the fiber is produced by a flame torch;
simultaneously, the fiber is pulled at both ends in opposite directions. The heating and pulling
processes are usually performed sweeping at constant speed and tension, respectively. However, the
hot-zone can vary in length to obtain different transition profiles [54, 63, 64, 69]. Heating of the fibers
must ensure the necessary softening of the glass in order to be deformable under the applied tensile
force. For silica fibers, a temperature of around 1700 ℃ is required to make sure that the melting
point is reached. A schematic of this process is illustrated in Figure II-6.
Fig. II - 6. Schematic of the heat-brushing method for tapering optical fibers.
Profiles of the waist radius and transition can be obtained considering conservation of mass as the
fiber is stretched over time. The final length of the taper (zw) will depend on length of the hot-zone
(L) and the fiber radius ( )r z . Initially, the length of the hot-zone is defined as L0, although this might
increase as the process takes place. The condition for an adiabatic process is taken into account upon
considering that 1r z . Following the considerations of mass conservation, the variation of the
waist radius (rw) along the total extension of the fiber is given by [54]:
2
w wdr r
dz L <II.45>
At the end of the process, the length of the waist (lw) will be the same as the length of the hot-zone or
final scanning length of the torch. Thus, the variation of rw is obtained integrating <II.45> with an
initial condition 00wr r , where r0 is the initial radius of the fiber, and an adjustable hot-zone length
L(z). The resulting expression is:
0
0
1exp
2
z
w
dzr z r
L z
<II.46>
Further simplifications can be considered from this expression: a constant hot-zone is obtained when
the swept length of the torch is fixed, and a linear hot-zone variation results when the initial and final

- 18 -
torch swept lengths are different. Both practical scenarios can be represented mathematically
considering [54]:
0
0
, constant hot-zone
, linearly variable hot-zonew
L z L
L z L z
<II.47>
Using these expression in <II.46> and upon integration we obtain:
0
12
0
, constant hot-zone
21 , linearly variable hot-zone
1
z
L
cl
cl
r e
r zz
rL
<II.48>
where is a constant indicating the relative rate of the hot-zone change and the taper elongation. It
is worth to name special cases for certain values of resulting in very well defined shapes:
0.5 , linear transitions to the waist diameter.
0 , exponential transitions (same case as a constant hot-zone).
1 , no transitions, an abrupt change to the waist diameter.
The flame torch tapering approach is ideal for tapering small diameter fibers (e.g., standard SMF with
125 m) and reaching submicron sizes. However, if thicker fibers or glass elements are to be tapered,
other methods have proven to be more effective.
II.2.3 FABRICATION USING THE LASER ABSORPTION APPROACH
An alternative to the flame torch technique is the use of light-induced heating by means of a
laser source. This technique is based on absorption of light by the materials of the fiber and the
subsequent increase in temperature. For silica-based fibers the most commonly employed type of
laser is the CO2 laser, operating in the mid-infrared wavelengths [71]. Among other advantages, this
approach provides highly localized heating, quick adjustment of the temperature, and does not
require special operational environments. Because the heat source is a light beam, optical elements
such as lenses and mirrors can also be used to reshape the beam spot and adjust the hot-zone.
Until recently, the most popular use for CO2 lasers in fiber optics was the fabrication of fiber devices
such as long period gratings, as well as for collapsing photonic crystal fibers [72]. Due to the
capabilities of this approach to obtain a localized heating section, as well as the possibility to control
the temperature in a precise manner, CO2 lasers have recently become an attractive solution for
fabrication of tapered-fiber devices. In contrast to the flame brushing technique, the CO2 laser
remains at a fixed position while the fiber is pulled and displaced across the hot-zone to achieve the
desired shape in the taper [71, 73]. This is known as the heat-and-pull method.

- 19 -
A reduction in the diameter of the fiber is achieved by pulling and feeding the material at different
speeds. This process modifies the diameter of the fiber when passing through the hot-zone, relying
on mass conservation. The initial and final diameters of the device, d1 and d2 respectively, are related
to the pulling and feeding speeds, v1 and v2 respectively, as 2
1 2 1 2d d v v . Speed variation profiles
will determine the shape of the transitions. An illustration of the heat-and-pull technique is shown in
Figure II-7.
Fig. II - 7. Illustration of the heat-and-pull technique used for fiber tapering.
II.2.4 LIGHT COUPLING IN TAPERED FIBERS
Evanescent wave coupling is typically used to fabricate splitters/combiners, long period
gratings, resonators, and nonlinear components [56, 57, 60, 61]. In the context of this work, the
operational principle of the fabricated fiber devices is explained in terms of the evanescent coupling
effect. Let us begin with the case of two parallel fibers fused and tapered down together. The crucial
section of the device to analyze is the transition section as opposed to the waist section, where light
will actually be guided by the resulting fused structure. Initially, both fibers are in contact but they
are independent waveguides, without light coupling between the cores, as depicted in Figure II-8a.
Fig. II - 8. Illustration of the cross section of two optical fibers fused and tapered together: a) both fibers before tapering launching light in one of the fibers, b) transition section with the formation of "supermodes", and c) waist section forming a
higher order mode. Light coupling by from a tapered fiber to another proximate non-tapered fiber.
As both fibers are subjected to the heating and pulling processes, they begin to fuse forming a new
structure composed by both cores and claddings. Along the transition section, there will be a point at

- 20 -
which light will start coupling from one core to the other. For some adequate length of this section,
directional coupling will occur (Figure II-8b) [56, 74]. This particular section of the device will then
present a combination of the individual modes (spots) of the cores, resulting in the so-called
supermodes [75, 76]. The supermodes are a superposition of isolated modes habitually analyzed as
light spot arrays. If the tapering process continues, the supermodes evolve into fiber modes at the
resulting structure, as shown in Figure II-8c (e.g., the waist of a fused coupler) [56, 75, 76]. Following
this example, a larger number of fibers can then be combined together and scaled to a larger number
of cores. Similarly, if one fiber is tapered down to the point at which light starts leaking from the core
and remains guided in the cladding material, then an external structure can be placed in close contact
to transfer the energy, as illustrated in Figure II-8d [70, 77]. These effects are used to fabricate
photonic lanterns and fiber micro-resonators, both explained in the following sections.
Equation Section (Next)

- 21 -
CHAPTER III: PHOTONIC LANTERNS
The photonic lantern (PL) is a spatial mode converter connecting multiple single-waveguide
cores to a multicore array. A more common way to describe a PL is to refer to it as a device capable
of coupling light from multiple single-mode fibers (SMFs) to a multimode fiber (MMF), and vice versa
[23, 78]. These devices were foremost developed for astrophysics to capture starlight using the
multimode end and then decompose it on multiple single-Gaussian modes [79, 80]. Later on, these
devices found their use in the telecommunications area serving as multiplexer (MUX) and
demultiplexer (DEMUX) for Spatial Division Multiplexing (SDM) applications. This application in
particular encouraged the improvement of these devices for achieving a more rigorous control over
the modal features obtained at the output end, such as mode selectivity.
Fabrication of fiber photonic lanterns is done by constructing a circular array of multiple fibers,
fusing and stretching them together until the multicore fiber array is formed. Different methods have
been explored to form fiber bundles to accomplish the creation of PLs. The first method consisted in
using a silica cane with an array of air holes, similar to the one employed for photonic crystal fibers
fabrication, allocating individual fibers within the cane and the resulting MMF was surrounded by air
[79]. Onward fabrication processes made use of low-refractive index glass capillaries to enclose all
the fibers, resulting in the creation of a complete few-mode or multimode structure at the tapered
end [23, 81, 82]. An extra method to fabricate the PLs was accomplished by making use of multicore
fibers fabricating a single structure, where upon tapering the structure the multimode (MM) section
was then generated [23]. Alternatively to this last procedure, a photonic crystal fiber with multiple
cores was used as well, collapsing the air holes to generate a MM section [23, 83].
This chapter covers the principles of operation, design, and construction of the PLs. Different devices
fabricated using the heat-and-pull technique are described and the influence of the fabrication
parameters in their modal features are explained. Finally, the characterization of the fabricated PLs
and integration to fiber systems is presented.
III.1 PRINCIPLES OF FABRICATION AND OPERATION
The basic principle in which the photonic lanterns are based is in the fusing and tapering of
individual fibers. This process generates light coupling among the separate cores of the fibers
yielding a characteristic pattern of light in the resulting structure, which depends mostly on the
coupling and propagation conditions. For this reason, the fabrication parameters will define the
characteristics at the tapered end of the device. Because one of most popular uses for the PLs is in

- 22 -
telecommunications applications, it is of great interest to achieve operation in wavelengths around
= 1550 nm.
The fabrication method used in this work is based on stacking single-mode optical fibers within a
glass capillary. Due to wave guiding conditions, the glass capillary must have a lower refractive index
than that of the cladding material of the fibers. Once the fibers are placed inside the capillary, the
resulting assembly is then tapered down and fused together until the whole structure collapses. As a
consequence, a waveguide with multimode structure is formed at the tapered end, with the low-index
glass capillary serving as the new cladding for the SMFs material, which in turn functions as the new
core. A schematic representation of a PL can be seen in Figure III-1. The spectral features of the
lantern are determined by the following aspects:
The number and type of fibers used for its construction.
The position of the fibers inside the capillary.
The characteristics of the capillary such as refractive index, dimensions, and inner diameter.
The tapering ratio.
Fig. III - 1. Illustration of a Photonic Lantern formed by N input SMFs at one end, merging to originate a MMF capable of support M number of modes at the output end.
The losses in PLs can be evaluated from the point of view of brightness conservation by analyzing
light coupling from the SMFs to the MMF, and vice versa [23]. An ideal device will conserve all the
energy when operated in both directions. For accomplishing a low-loss system, the number of input
modes (MIN) and output modes (MOUT) requires to fulfill the condition:
<III.1>
Given this, for a number of input modes larger than those supported at the output, there will be some
light that will not couple and will be radiated outside the lantern. An ideal scenario is to have a system
IN OUTM M

- 23 -
where . Notice that this condition does not allow a device with a SMF as an input able to
excite all the modes supported by a MMF at the output. Conversely, it is not possible to have a device
with a MMF input capable of couple all of its modes into a sole SMF. Considering an adiabatic taper
and identically SMFs, the number of fibers used (N) will determine the number of excited modes at
the output MMF [23, 78, 79]. Therefore, according to the directionality, light propagation in PLs in
terms of the individual number modes at the single-mode fibers (MSM) and the multimode side (MMM)
can be summarized by [23, 84, 85]:
, from MMF to SMFs
, from SMF to MMFs
SM MM
MM SM
M M
M M
<III.2>
Determination of the excited transmission modes is given by the fiber positions that match those
corresponding to the excitation of the supermodes. For cylindrical geometries, spot arrays
originating supermodes and evolving into LP fiber modes capable of couple to FMF has been carried
out in previous works by Ryf et al. [84]. These spot positions must follow a very specific configuration
depending on the number of LPlm modes. The correct core geometry is formed with a ring equal to
the radial index m, adding a spot at the center every time that m increases. Each one of these rings
consists of a number of fibers following the rule of , where lMax is the largest value of the
azimuthal index, l, for each value of m. The positions for the fiber array scaling up to the lowest nine
LP fiber modes including one spot for every non-degenerate mode and two spots per degenerate
mode, are shown in Figure III-2. It is important to emphasize that a correct configuration of the fibers
inside the capillary must be achieved; otherwise the spot array will evolve into different supermodes.
Excitation of different supermodes will lead to LP fiber modes that are not supported by the
multimode fused structure, leading to losses by radiation modes. The appropriate locations of the
spot arrays have been tested by numerical simulations including modal analysis, coupled mode
theory, and beam propagation method (BPM) [75, 76, 85,].
Fig. III - 2. Spot arrangements of supermodes to excite fiber LP modes [84].
The low-refractive index capillary in the PL is a key component serving for a couple of functions.
Firstly, it serves as container for the fibers, and the inner diameter must be adequate to contain the
required number of the fibers necessary to obtain the desired number of LP modes. The thickness of
the capillary is also important to guarantee a complete confinement of the evanescent wave, and the
IN OUTM M
2 1Maxl

- 24 -
outer diameter must also be adequate to end up with a proper final diameter compatible with FMFs
for further coupling. The second function of the capillary is for the definition of light propagation in
the MM tapered end. In this case, the relevant parameter to consider is the difference in refractive
index between the glass capillary and the fibers ( ); this affects the V-number and hence, the
number of modes allowed at the tapered end.
Given the previous considerations and following the tapering process and adiabatic conditions
exposed in sections II.2.1 and II.2.2, formation of the modes takes place at the transition section. For
a better description of the process, let us consider the case of a device consisting of two fibers
(stage I). As the whole structure fuses together and starts to reduce in size, the effective refractive
index (neff) decreases causing a less confined single-mode at each of the SMF cores evolving into N
degenerate supermodes (stage II). When the reduction in the cores is such that light extends
considerably into the surroundings, interaction with the neighboring cores starts to take place
leading to energy coupling (stage III). In this exact stage of the tapering process, the number of
supermodes (N ) starts to split into a number of N non-degenerate modes. If the tapering process is
continued after this stage (IV), the structure will have smaller cores reaching the core-mode cutoff,
and a different neff for each non-degenerate mode depending on the surrounding cores. At this stage
light guidance is determined by the low-refractive index capillary. Once this point is reached, the
cores will no longer guide light and will couple to the whole structure, causing that each non-
degenerate mode will evolve into N LP fiber modes [23, 78]. Then, the final diameter of the lantern is
obtained from the tapering ratio established during the design stage of the device (stage V).
Figure III-3 illustrates the energy coupling process and mode evolution along a tapered structure.
Fig. III - 3. Illustration of the energy coupling and mode evolution at tapering process of the PLs at different stages.
Along with , the final radius of the new core of the MM side of the lantern also plays a role in the
number of modes that will propagate. An estimation of the number of modes supported at the
multimode side of the lantern can be obtained using Eq. <II.38>. The number of fibers used for the
construction of the PL also determines the size of the core since the material of each fiber contributes
in its formation. Figure III-3 shows light coupling at the different stages of the fabrication process;
whereas in Figure III-4, the microscope images of a three fiber PL using identical fibers at different
stages of the fabrication process are presented. A more descriptive theory of the power coupling
occurring at the transition of a fiber array can be found in [82].
n
n

- 25 -
Fig. III - 4. Microscope pictures of the cleaved end facet from a three fiber PL showing the energy coupling and mode evolution at different stages of the tapering process.
III.1.1 MODAL FEATURES
A better understanding of how light evolves from a SM to a MM signal requires modal
analysis. Works performed by León-Saval et al. [78, 86] and Fontaine et al. [87] demonstrate how
mode evolution takes place along the tapered region upon considering a change in the modal effective
refractive indices, neff. The simplest scenario illustrated in the previous section is when all the SMFs
are identical and thus, the propagation constants for each core are the same along the whole
structure. Under these conditions, light will start to couple from each fiber to the multimode structure
in the same region of the taper. Then, the allowed degenerate modes will start to originate almost
simultaneously and propagate through the fused part. Eventually, at certain point of the tapered
section the mode effective index splits for each mode group, originating a break in the degeneracy of
the modes. To exemplify this, Figure III-5 shows a plot illustrating the mode evolution for a photonic
lantern fabricated with three identical SMFs [86].
Fig. III - 5. Modal evolution simulations for a PL formed by three identical SMFs. Blue and red lines indicate the modes propagating through the core and the cladding, respectively. Taken from [86].

- 26 -
PLs fabricated with identical fibers will present a certain degree of coupling to all the possible modes
of the MMF upon launching light into each of the SMF cores. Therefore, the output signal will be a
light pattern composed by the superposition of all the modes. Depending on the core position inside
the fiber array, preferential coupling can also occur since the light coupling will take place at different
positions within the fiber array. Also, scrambling among the modes is caused by structural
imperfections that may occur during the fabrication process [78, 86].
III.1.2 MODAL SELECTIVITY
Control over mode generation is a desirable feature in multimode devices and systems. Mode-
selective photonic lanterns (MSPLs) are devices in which each individual input fiber excites only one
LP mode at the MM tapered end without any mixing among the supported modes [86, 88]. Devices
with such a feature require different coupling condition for each individual core along the transition
of the tapered section, thereby providing a different evolution of the propagated modes. To obtain
MSPLs, it is necessary to break the degeneracy between the modes of the uncoupled cores, as well as
to provide different propagation constants for each mode. Both of these conditions must be
maintained across the entire transition section of the PLs [86].
Mode selectivity in PLs can be accomplished during the fabrication process by generating different
propagation constants in each fiber. This generates different propagation conditions for the
fundamental mode in each SMF, which in turn will determine the mode to be excited at the MM
output. In other words, each propagation constant ( ) in the SMFs will become the propagation
constant of one LP mode at the MM end. This difference in propagation constants must be adequate
to excite different LP modes in the PLs. For these devices, the largest β will correspond to the lowest
order LP mode of the structure, and the smallest will correspond to the highest LP mode [86]. A
way to achieve this condition is to use dissimilar fiber cores for the construction of the fiber array,
which can be accomplished in the following ways:
Using identical core diameters but different ∆n.
Using different core diameters but the same ∆n.
Using a combination of both.
In principle, addressing each of the LP modes, including the two degenerate modes a and b when this
is the case, will require one fiber per mode. This of course would require a large number of fibers for
the lantern assembly. Thus, a simplification to achieve this objective consists in only employing a core
size for every LP mode, and breaking the degeneracy of the LPlma and LPlmb modes with a proper
tapering ratio in the MM end structure. Therefore, the required tapering length is also decreased
since the degeneracy of the modes is broken. To illustrate the modal evolution of a MSPL, a plot from
[86] is shown in Figure III-6, demonstrating the modal refractive indices from a PL constructed with
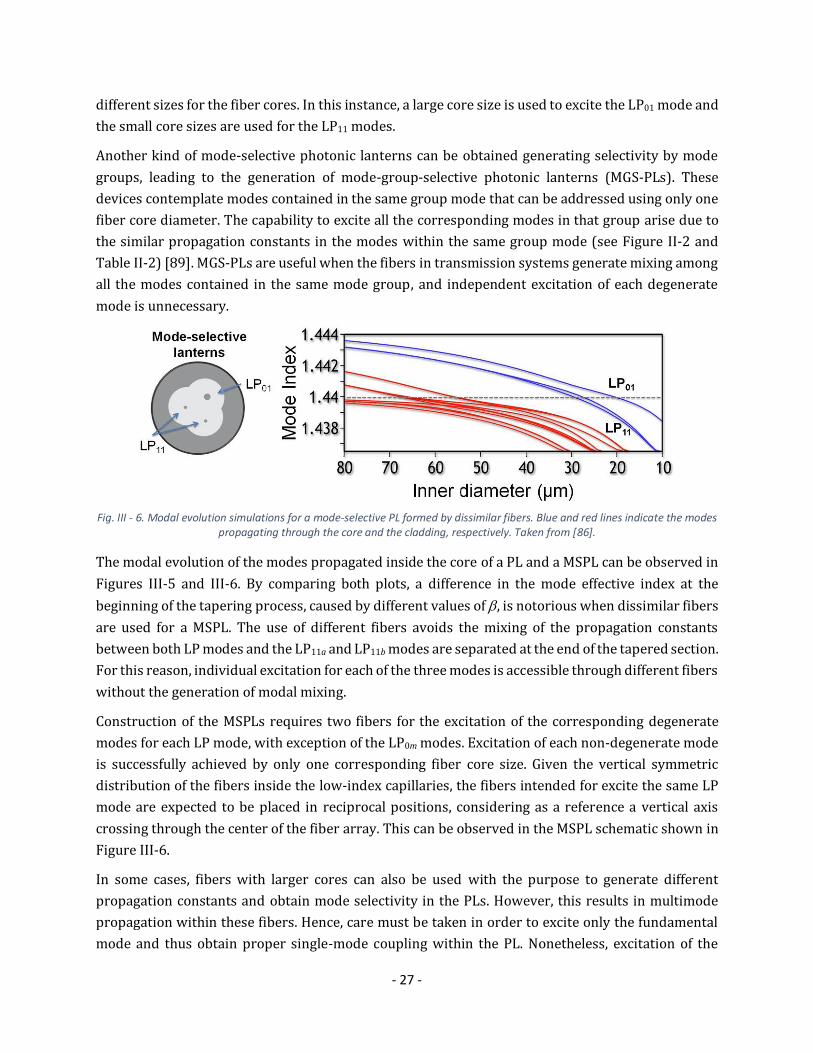
- 27 -
different sizes for the fiber cores. In this instance, a large core size is used to excite the LP01 mode and
the small core sizes are used for the LP11 modes.
Another kind of mode-selective photonic lanterns can be obtained generating selectivity by mode
groups, leading to the generation of mode-group-selective photonic lanterns (MGS-PLs). These
devices contemplate modes contained in the same group mode that can be addressed using only one
fiber core diameter. The capability to excite all the corresponding modes in that group arise due to
the similar propagation constants in the modes within the same group mode (see Figure II-2 and
Table II-2) [89]. MGS-PLs are useful when the fibers in transmission systems generate mixing among
all the modes contained in the same mode group, and independent excitation of each degenerate
mode is unnecessary.
Fig. III - 6. Modal evolution simulations for a mode-selective PL formed by dissimilar fibers. Blue and red lines indicate the modes propagating through the core and the cladding, respectively. Taken from [86].
The modal evolution of the modes propagated inside the core of a PL and a MSPL can be observed in
Figures III-5 and III-6. By comparing both plots, a difference in the mode effective index at the
beginning of the tapering process, caused by different values of , is notorious when dissimilar fibers
are used for a MSPL. The use of different fibers avoids the mixing of the propagation constants
between both LP modes and the LP11a and LP11b modes are separated at the end of the tapered section.
For this reason, individual excitation for each of the three modes is accessible through different fibers
without the generation of modal mixing.
Construction of the MSPLs requires two fibers for the excitation of the corresponding degenerate
modes for each LP mode, with exception of the LP0m modes. Excitation of each non-degenerate mode
is successfully achieved by only one corresponding fiber core size. Given the vertical symmetric
distribution of the fibers inside the low-index capillaries, the fibers intended for excite the same LP
mode are expected to be placed in reciprocal positions, considering as a reference a vertical axis
crossing through the center of the fiber array. This can be observed in the MSPL schematic shown in
Figure III-6.
In some cases, fibers with larger cores can also be used with the purpose to generate different
propagation constants and obtain mode selectivity in the PLs. However, this results in multimode
propagation within these fibers. Hence, care must be taken in order to excite only the fundamental
mode and thus obtain proper single-mode coupling within the PL. Nonetheless, excitation of the

- 28 -
fundamental mode is achieved by carefully alignment, considering their operation in the single-mode
regime.
III.2 FABRICATION AND MODE PROFILES
Fabrication and characterization of PLs devices were done in two laboratories: the
Microstructured Fibers and Devices Laboratory, under the supervision of Dr. Rodrigo Amezcua-
Correa and Dr. Axel Schülzgen, at CREOL, the College of Optics and Photonics at the University of
Central Florida (UCF), USA; and in the Optics Communications Laboratories under the supervision of
Dr. Nicolas Fontaine and Dr. Roland Ryf, at Bell Laboratories/Alcatel–Lucent, USA. The relevant
details of the fabrication process of these devices will be covered in the following sections.
III.2.1 ASSEMBLY AND TAPERING STATIONS
Assembly of the photonic lanterns starts by placing the required number of SMFs inside the
capillaries. These must be placed in the correct positions according the desired number of modes at
the output of the PL. An assembly station consisting of positioning and visualization systems was
built to carry out these actions. The capillaries or microstructured preforms are placed in a special
holder serving also for protection and transportation of the assembled structure (A). The fibers are
inserted without the polymer coating and are fixed on a V-groove on top of the positioning system.
The latter is further contained in an XYZ-translation stage with fine movement (B). An optical
microscope with a long work distance objective comprises the visualization system (C); this is
intended to achieve the correct placement of each fiber within the structure. Once the fibers are set
on the correct position, an additional long-travel linear translation stage (D) is used to insert
completely the fibers inside the capillaries. Additional elements enhancing the station capabilities
include adequate illumination (E) and an electrostatic suppressing system (F). A photograph of the
system is shown in Figure III-7.
Some of the advantages using this station include the visual inspection of the capillaries and
microstructured preforms for identifying possible structural defects. Also, examination of the correct
positioning of the fibers along the entire length of the capillary allows finding bends, twists, or
obstructions of the fibers, which originate mode mixing and losses. Another advantage of the station
is that it minimizes the hand manipulation of the bare fibers within the capillaries, thereby reducing
contamination sources for the assemblies.

- 29 -
a) b)
Fig. III - 7. PLs assembly station. a) Photograph of the system, and b) fibers being placed inside a microstructured preform.
After assembling the fibers/capillary structures these were cleaned and placed inside a glass
processing station. Figure III-8 shows images of the tapering station used to fabricate the PLs. This is
an AFL Fujikura LZM-100 LAZERMaster that uses a CO2 laser to fuse and taper optical fibers and glass
rods/capillaries, and is able to taper cylindrical glass elements with diameters of up to 2 mm [90, 91].
The operational principle of the station is based on the heat-and-pull method, incorporating a
thermal imaging system, which allows for real-time monitoring of the element under heating.
Operation of the system is carried out by computer control allowing to set the relevant fabrication
parameters, such as initial and final diameters (d1, d2), pulling speeds (v1, v2), taper section lengths,
and laser power. Upon programing these parameters in the control software results in a repeatable
process and hence allows the production of devices with the same features. After the PLs are tapered
to their final diameter, the section of the second transition has to be removed. This is done in the
same tapering station with an in situ cleaving process performed by scribe-scratching and pulling at
a controlled velocity.
In the subsequent sections, the general procedure for the assembly of PLs with 3, 6, 10, and 15 fibers
is described. The requirements to obtain modal selectivity with these devices are also covered.

- 30 -
a) b)
Fig. III - 8. CO2 laser tapering station: a) AFL LAZERmaster LZM-100, and b) internal system.
III.2.2 CAPILLARIES AND MICROSTRUCTURED PREFORMS
The glass capillary in the PLs provides support and adequate enclosing for the optical fibers
within a lower refractive index material (Figure III-9). Low-refractive index capillaries include an
inner fluorine-doped layer, which has a refractive index lower than that of silica. Typically, the fibers
are placed in the capillary forming a hexagonal array; however, some configurations to obtain specific
modal patterns require fiber positions that will not fit in a hexagonal pattern (see Figure III-2) [80,
84]. This limitation is overcome using capillaries with custom inner structures capable of holding the
fibers with the required geometrical arrangements. PLs requiring these microstructured capillaries
arrangements are those with two or more fiber rings and more than one fiber at the center of the
array [92]. In general, PLs with eight or more optical fibers require the use of these microstructured
capillary arrays. In this work, we fabricated PLs with ten and fifteen optical fibers.
Construction of the microstructured preforms is based on stacking synthetic silica capillaries within
the fluorine-doped tube. These are placed according to the theoretically estimated positions for ten
and fifteen supermodes [84]. Thin silica glass capillaries with high air filling fraction (ID/OD > 0.95)
were used to minimize the inclusion of additional silica material around the fibers, and preserving
the distance between cores for subsequent coupling. The structure of a preform with ten fibers
consists of a central array of three capillaries (ID = 110 m) forming a triangular geometry. These
are then surrounded by a ring array of seven capillaries with an ID = 170 μm. The resulting preform
is then a structure with an OD of 900 μm (see Figure III-9b). For the preform using fifteen fibers, the
structure requires two arrays of capillaries (ID = 145 μm) forming concentric rings of nine and five
capillaries for the outer and inner rings, respectively. This preform also includes additional silica rods
to fill any air gaps between the capillaries and the central region is left empty to hold the fifteenth
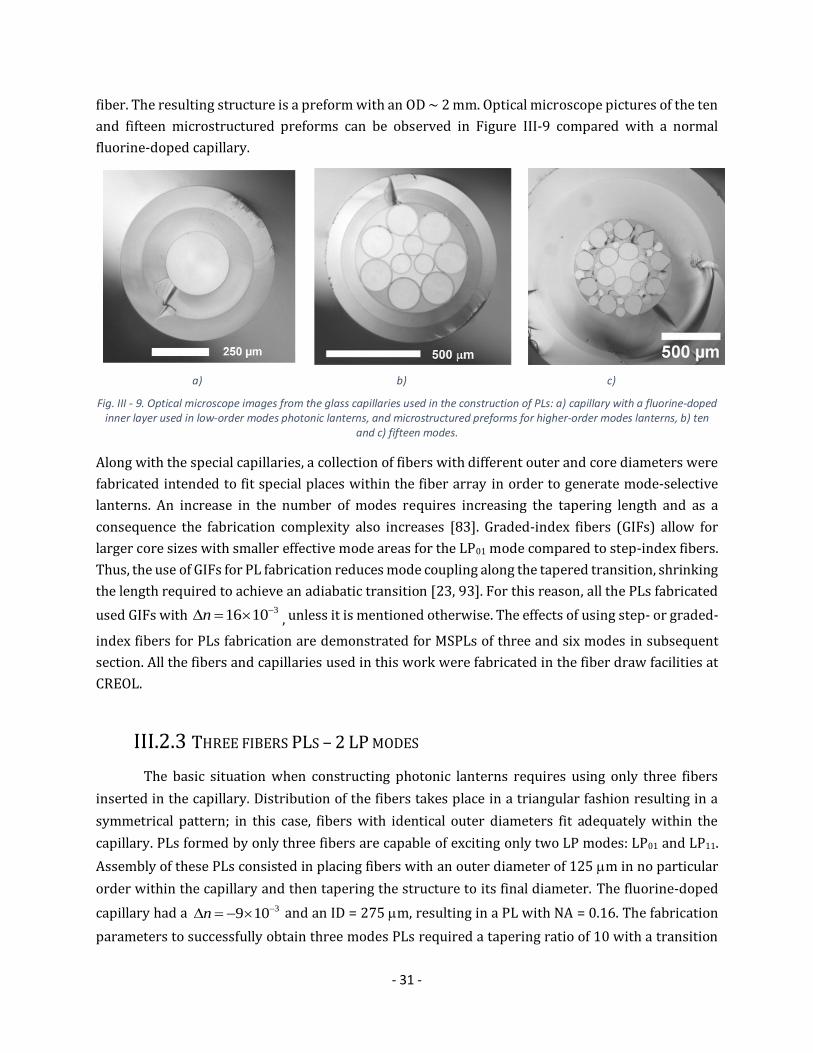
- 31 -
fiber. The resulting structure is a preform with an OD ~ 2 mm. Optical microscope pictures of the ten
and fifteen microstructured preforms can be observed in Figure III-9 compared with a normal
fluorine-doped capillary.
a) b) c)
Fig. III - 9. Optical microscope images from the glass capillaries used in the construction of PLs: a) capillary with a fluorine-doped inner layer used in low-order modes photonic lanterns, and microstructured preforms for higher-order modes lanterns, b) ten
and c) fifteen modes.
Along with the special capillaries, a collection of fibers with different outer and core diameters were
fabricated intended to fit special places within the fiber array in order to generate mode-selective
lanterns. An increase in the number of modes requires increasing the tapering length and as a
consequence the fabrication complexity also increases [83]. Graded-index fibers (GIFs) allow for
larger core sizes with smaller effective mode areas for the LP01 mode compared to step-index fibers.
Thus, the use of GIFs for PL fabrication reduces mode coupling along the tapered transition, shrinking
the length required to achieve an adiabatic transition [23, 93]. For this reason, all the PLs fabricated
used GIFs with , unless it is mentioned otherwise. The effects of using step- or graded-
index fibers for PLs fabrication are demonstrated for MSPLs of three and six modes in subsequent
section. All the fibers and capillaries used in this work were fabricated in the fiber draw facilities at
CREOL.
III.2.3 THREE FIBERS PLS – 2 LP MODES
The basic situation when constructing photonic lanterns requires using only three fibers
inserted in the capillary. Distribution of the fibers takes place in a triangular fashion resulting in a
symmetrical pattern; in this case, fibers with identical outer diameters fit adequately within the
capillary. PLs formed by only three fibers are capable of exciting only two LP modes: LP01 and LP11.
Assembly of these PLs consisted in placing fibers with an outer diameter of 125 m in no particular
order within the capillary and then tapering the structure to its final diameter. The fluorine-doped
capillary had a and an ID = 275 m, resulting in a PL with NA = 0.16. The fabrication
parameters to successfully obtain three modes PLs required a tapering ratio of 10 with a transition
316 10n
39 10n

- 32 -
section of 50 mm. The end facet of a three modes lantern cleaved at the waist section can be seen in
Figure III-10a, showing the triangular geometry of the core with an approximate diameter of 22 m.
Fig. III - 10. Three fibers photonic lantern. a) End facet cleaved at the waist section. b) Near filed mode profiles from a non-mode-selective PL at 1550 nm.
Upon coupling light from a superluminiscent diode centered at 1550 nm into each of the input fibers,
it was possible to observe the near field mode profiles at the output end. As expected, the devices
fabricated using standard step-index SMFs yielded a response with no modal selectivity. As shown in
Figure III-11b, the same light patterns are observed when exciting each of the fibers. This is because
each fiber shares the same neighboring conditions (i.e., each fiber has two nearest neighbors). A
triangular shape in the output mode profiles is noticeable owing to the geometry of the PL core
obtained when the capillary collapses and the air gaps within the fibers are filled.
Fig. III - 11. Three modes mode-selective photonic lantern. a) Fiber core positions, b) near field mode profiles, and c) far field mode profiles at 1550 nm.
To generate mode selectivity in this kind of PLs, only one of the cores must have a different size. Using
GIFs and a fiber with larger diameter than the ones of the other two fibers, a mode-selective photonic
lantern was thus fabricated. The fiber cores for this device were 13 and 10 m, aiming at exciting the
LP01 and LP11 modes, respectively. The near field mode profiles at the output of the PL and the fiber

- 33 -
positions inside the capillary are shown in Figure III-11a and 11b. The evolution of the mode profiles
is observed in the far field mode profiles shown in Figure III-11c.
The mode profiles clearly show that the two identical fibers used to excite the same LPlm mode,
produce the corresponding degenerate modes at the output of the PL. In this particular case, the LP11a
mode is generated by one of the 10 m fiber, whereas the LP11b mode is obtained upon launching
light through the other 10 m fiber.
III.2.4 SIX FIBERS PLS – 4 LP MODES
Handling a larger number of modes in photonic lanterns demands the use of more optical
fibers inside the capillary. The LP modes that can be excited in PLs with six fibers include the LP01,
LP11, LP21, and LP02. For these PLs, the arrangement includes a central fiber with a smaller diameter
than the surrounding five fibers used to complete the array. Hence, the fibers inserted in the fluorine-
doped capillary include five 125 m OD fibers surrounding an 83-86 m OD fiber. The 375 m inner
diameter fluorine-doped capillary had a , yielding a photonic lantern with NA = 0.16.
A tapering ratio of 11.3 with a transition section of 60 mm was required for obtaining these devices.
The core diameter for these PLs was around 27 m, as observed in the cleaved end facet shown in
Figure III-12a. The near field mode profiles from non-mode-selective PLs constructed using fiber core
diameters of 13 m are shown in Figure III-12b. Notice that the excitation of each fiber produces a
different mode profile in spite of using identical core diameters. The reason of this effect is due to the
different number of neighboring fibers for each one of the fibers forming the PLs.
Fig. III - 12. Six fibers photonic lantern. a) End facet cleaved at the waist section. b) Near filed mode profiles from a non-mode-selective PL at 1550 nm.
For the fabrication of MSPLs, four different core diameters (20, 18, 15, and 6 m) were used for
exciting the LP01, LP11, LP21, and LP02.modes. The horizontally symmetrical location of the fibers
within the arrangement is depicted in Figure III-13a. Typically near and far field mode profiles for a
wavelength of 1550 nm obtained at the output of these MSPLs are shown in Figure III-13. For this
39 10n

- 34 -
case, the core geometry shows a pentagonal distribution, defining the output light patterns observed
in the near field mode profiles.
Fig. III - 13. Six modes mode-selective photonic lantern. a) Fiber core positions, b) near field mode profiles, and c) far field mode profiles at 1550 nm.
III.2.5 TEN FIBERS PLS – 6 LP MODES
As mentioned in a previous section, scaling to higher order modes PLs involves more
elaborated fiber arrangements. For ten or more fiber devices, the use of microstructured preforms is
mandatory due to the complexity of the fiber arrangements (see Figure III-9). For the ten fibers
preform, two different fibers were used: 125 m and 83 m outer diameters. While the fibers with
larger diameter were inserted into capillaries (170 m ID) forming the outer ring of the preform, the
fibers with the smaller diameter were inserted in the three remaining capillaries (110 m ID). The
fabrication parameters used for these PLs include a tapering ratio of 16 and a transition length of
57.5 mm to reach the desired reduction in diameter.
The preform was assembled within a fluorine-doped capillary with a , and with an
inner diameter big enough to house the set of smaller capillaries holding the optical fibers. Thus, the
resulting PL yielded a MM output with a NA = 0.216 after the fusing and tapering process. As shown
in Figure III-14a, the tapered end of the PL exhibits a core size of 27 m with a more rounded shape
when compared to PLs with a smaller number of fibers. As for the devices described previously, a
non-MSPL was fabricated using fibers with identical core diameters of 13 m. The near field mode
profiles at the output end are shown in Figure III-14b. As seen in the figure, similar light patterns at
the PL output are obtained when the central fibers are excited. In contrast, mode mixture can be
clearly observed when light is launched into the surrounding fibers.
316 10n

- 35 -
Fig. III - 14. Ten fibers photonic lantern. a) End facet cleaved at the waist section. b) Near filed mode profiles from a non-mode-selective PL at 1550 nm.
The construction of a MSPL with ten fibers results in a device capable of producing the LP01, LP11,
LP21, LP02, LP31, and LP12 modes. The fibers needed to generate this type of lantern involved core
diameters of 23, 20, 17, 9, 13, and 6 μm, exciting respectively the LP modes listed before. For a
successful excitation of the LP modes, a specific fiber position was necessary, yielding the core
distribution illustrated in Figures III-15a. The light patterns generated at the output of the MSPL can
be observed from the near and far field mode profiles shown in Figures III-15b and III-15c,
respectively.
Fig. III - 15. Ten modes mode-selective photonic lantern. a) Fiber core positions, b) near field mode profiles, and c) far field mode profiles at 1550 nm.

- 36 -
A point to highlight for this particular device is the need of a larger core diameter for exciting the LP31
compared to the core size used for the LP31. Intuitively, one would expect that the LP31 mode would
require a smaller core diameter than that used to excite the LP02 mode; however, experimental
results showed that the opposite was necessary for generating these modes at the MSPL output using
these microstructured preforms. This may be due to the fact that dissimilar cladding fiber diameters
were used for this device, which in turn may affect light coupling conditions. Numerical studies have
shown that the distance among the fiber cores within the structure affect the evolution of the modes
propagating along the MSPL [78, 75]. The use of different microstructured preforms, optical fibers,
or a combination of both, will change the fabrication parameters.
III.2.6 FIFTEEN FIBERS PLS – 9 LP MODES
The most complex devices to fabricate were the mode-selective photonic lanterns with fifteen
fibers. This sort of PLs was also constructed using a microstructured preform capable of allocating
all the required fibers, forming an array of three concentric layers (see the 15-spot array shown in
Figure III-2). The fabricated preform had a and the glass capillaries had the proper
dimensions to enclose fibers with 125 m cladding diameter. Fabrication parameters for these PLs
comprised a tapering ratio of 20, requiring a 6 cm-long transition section. With these parameters, the
output end of the device is multimodal with 35 m core diameter, as shown in Figure III-16a. Notice
that in contrast with previous devices, the fifteen fiber array yields a PL with circular core geometry.
Fig. III - 16. Fifteen fibers photonic lantern: a) End facet cleaved at the waist section. b) Near filed mode profiles from a non-mode-selective PL at 1550 nm.
As in previous cases, we first fabricated a PL without modal selectivity, using fifteen fibers with the
same core size (13 m). The near field patterns obtained with this device are shown in Figure III-16b.
As expected for non-MSPL, modal mixing occurs at the output of the device, showing a response
39 10n

- 37 -
comparable to a standard MMF. Evidently, such a device would not provide any significant
advantages for SDM applications or for controlled generation of specific light patterns.
The fifteen fiber MSPLs allowed for the excitation of nine different LP modes and the corresponding
degenerate modes. For these PLs, the accessible modes were the LP01, LP11, LP21, LP02, LP31, LP12, LP41,
LP22, and LP03, respectively excited using fibers with core diameters of 30, 28, 23, 20, 17, 15, 13, 10,
and 6 m. To obtain modal selectivity and independent excitation of all the LP fiber modes, the fibers
were allocated within the preform as shown in Figure III-17a. Characterization of these lanterns was
performed observing the near and far mode profiles produced upon launching light into each of the
different cores. In Figure III-17, the mode profiles obtained from a series of fifteen fiber MSPLs are
shown (the degenerate modes are not included).
Fig. III - 17. Fifteen modes mode-selective photonic lantern. a) Fiber core positions. b) Near field mode profiles, and c) far field mode profiles at 1550 nm (only one degenerate mode per fiber core size is shown).
Although these devices were successfully fabricated and showed good modal selectivity, the
scalability to obtain full-modal selectivity exciting each of the available LP modes individually,
involves an increase in fabrication complexity. For instance, fabrication of MSPLs with a large number
of LP modes will require an equal number of fibers with different core diameters. It must be pointed
out that higher order modes will be more susceptible to mixing in the presence of minor
imperfections due to the similarity in propagation constant. For this purpose, the available range of
values for the fiber cores needs to be large enough to completely avoid mode mixing; a larger
transition section in the taper will also be required. An additional aspect is related to the

- 38 -
microstructured preforms, which involves the fabrication of more elaborated structures;
nonetheless, the same fabrication technique can be used.
An alternative to manufacture PLs with a large number of fibers is to address each mode through
group modal selectivity (MGS-PL). In contrast to the MSPLs, this approach requires a smaller
difference in propagation constants or fiber core diameters in order to address each mode group. In
this case, the structure allows isolating the modes by groups, although mixing can occur among the
modes within the same group. Isolation of the modal group is achieved upon using fibers with
different core sizes, one size for each modal group. This sort of PL is suitable for applications where
mixing between modes comprised in the same group mode is acceptable (e.g., in telecommunications
using FMFs in which mode mixing usually occurs).
The construction of the MGS-PLs for 5 mode groups was accomplished using core diameters of 30,
28, 23, 17, and 8 m corresponding to the mode groups 1, 2, 3, 4, and 5. The fiber core distribution
inside the preform illustrated in Figure III-18a follows the same order in core diameters used in the
case of the MSPLs, with the larger core diameters in the outer ring of the fiber array and the fiber
with the largest core at the top position. The characteristic near field-intensity profiles obtained at
the output of the device demonstrates an evident mode mixing (Figure III-18b). The resulting light
patterns are composed by the superposition of the available LP fiber modes and their corresponding
degenerate modes within the mode group; this can be readily observed in groups 2, 3, and 4.
Fig. III - 18. Group-mode-selective photonic lantern. a) Fiber core distribution and b) near field mode profiles at 1550 nm.

- 39 -
III.3 ADDITIONAL CONSIDERATIONS FOR PL FABRICATION
The optimal fabrication parameters for the described PLs and their characteristics were
covered in the previous sections. However, some variations in the fabrication processes will produce
device with different features that might be important for particular applications or needs. In this
section, we will discuss a few important variations in the fabrication process parameters and their
effect on the resulting PLs.
III.3.1 STEP-INDEX VS GRADED-INDEX FIBERS
Given the nature of the fabrication process for all-fiber photonic lanterns, the details
involving the adiabatic tapering and fusing of the device are crucial. Increasing the number of modes,
increases the required taper length and thus the PL fabrication complexity [83]. This is evident from
the increased tapering ratio required for the PL as the number of fibers is increased as well. As
explained in section II.2.1, the transition lengths in a device ultimately determine the mode coupling
and losses of a device, as analyzed for the case of step-index fibers. Graded-index fibers offer the
advantage of low-mode coupling of the fundamental mode to higher order modes over shorter
distances [89, 94]. Therefore, using GIFs reduces mode coupling along the transition zone of the
device allowing for a better confinement of the fundamental mode, yielding shorter devices with
improved losses.
To demonstrate the effect of using graded- and step-index fibers, several photonic lanterns of six
fibers were fabricated. For the PLs fabricated with step-index fibers, well defined mode profiles were
observed for a 6 cm transition length. In contrast, a PL with a transition length of 5 cm showed some
scattered light in the modes, as typically observed in devices with non-adiabatic transition sections.
In comparison, PLs constructed with GIFs preserved the quality of the mode profiles when the taper
transition length was reduced from 6 to 3 cm. Hence, a reduction by a factor of ~ 2 in the tapering
length is obtained when using GIFs, compared to PLs fabricated using step-index fibers. These results
are illustrated in Figure III-19, showing the LP02 mode from lanterns fabricated using both types of
fibers with different transition lengths.
a) b)
Fig. III - 19. Near-field LP02 mode profile from MSPLs with different transitions lengths: (a) step-index and (b) graded-index fibers.
An important parameter that provides information about the performance of the PLs is the mode
purity. This parameter is obtained upon analyzing the intensity distribution of the near field mode

- 40 -
profiles, quantifying the ratio between the minimum and maximum peak intensities of the lobes. For
the PLs fabricated with step-index fibers, the mode purity changed from -11.76 to -6.73 dB when the
transition length was reduced from 6 to 5 cm. In contrast, for the devices with graded-index fibers a
length reduction in the transition section from 6 to 3 cm only diminished the mode purity from -17.67
to -16.28 dB. Furthermore, this mode purity was preserved even for transition lengths of ~ 4 cm.
III.3.2 WAVELENGTH DEPENDENCE
The main use of PLs is targeted for telecommunication applications operating in wavelengths
centered at = 1550 nm. Nonetheless, operation of the PLs at different wavelengths is desirable for
diverse applications. The wavelength dependence of the devices was evaluated using light sources
operating at wavelengths of 980 and 1310 nm. These light sources were launched in the input fibers
of the MSPLs, and the near field mode profiles were obtained for lanterns formed by three, six, ten,
and fifteen fibers. A typical pattern obtained at the tapered end of the MSPLs for = 980 nm is shown
in Figure III-20. While the output mode profiles for the higher order modes are well defined at the
output, the lowest order modes appear like supermodes formed by the light coupled among all the
fiber cores.
From the response of the MSPLs, it is obvious that this behavior is caused due to the small tapering
ratio used to fabricate the device. At this wavelength, light is significantly confined and propagates
inside each independent core in the fiber array, thus yielding an output composed of independent
spots [75, 78]. A similar behavior is observed for a wavelength of = 1310 nm. Thus, the geometry
of the devices, such as the final diameter, must be chosen adequately for proper operation at shorter
wavelengths.
As a proof of concept, a three fiber MSPL was fabricated by tapering down with a ratio of 14.4. The
near field mode profiles at the output obtained for wavelengths of 980, 1310, and 1550 nm are shown
in Figure III-21. While well-defined mode profiles can be appreciated for shorter wavelengths, the
output pattern at 1550 nm shows a partial light leaking from the tapered end due to the small size of
the resulting waveguide.

- 41 -
Fig. III - 20. Near field mode profiles at a wavelength of 980 nm from: a) three, b) six, c) ten, and d) fifteen fiber MSPLs.
Fig. III - 21. Near field mode profiles from a three fibers MSPL with a tapering factor of 14.4 at a wavelengths of: a) 980 nm,
b) 1310 nm, and c) 1550 nm.

- 42 -
III.3.3 FIBER POSITIONS AND DEFECTS
Photonic lanterns can produce diverse light patterns originated by mode mixing. An example
of this behavior can be found in the mode profiles from MGS-PLs, like those presented in Figure III-
18. These light patterns can be generated when the fiber core diameters used for the PLs construction
are similar in dimensions, thus yielding similar propagation constants in the device resulting in mode
mixing. Another possibility to generate this effect is to use fibers with different diameters but placing
them in different positions inside the low-index capillary or microstructured preform (as in the
MSPLs); hence, the coupling among the different fiber cores will change. Owing to the wide variety of
combinations available during the fabrication process, a large diversity of mode patterns can be
obtained through mode mixing.
To explore this situation, two ten fiber PLs were fabricated using similar fiber core diameters located
at similar positions as those used for the ten fiber. Both modified PLs were based on the structure
shown in Figure III-15: one was fabricated keeping the same fiber positions but reducing the sizes of
two of the fiber cores (one changed from 20 to 17 m and the other from 17 to 15 m); for the second
PL, only one fiber core was reduced (from 17 to 15 m) and two fibers were swapped from their
original positions. The locations of the fibers in the resulting devices are illustrated in Figure III-22a
and III-22c. Both of these PLs were constructed using the same fabrication parameters (e.g., tapering
ratio, length, etc.) as those used for the regular ten fiber PLs described earlier.
Fig. III - 22. Ten fiber PLs with different light patterns at the output. Different fiber diameters: a) fiber core distributions and b) near field mode profiles. Different fiber positions: c) fiber core distributions and d) near field mode profiles.

- 43 -
Near field patterns obtained at the output of both devices are shown in Figure III-22. The first PL
shows a slight but clear mode mixing, causing the characteristic bright spots of the LP modes to look
as “connected” spots; nonetheless, each LP fiber mode can still be identified. The second type of PL
shows stronger mode mixing effects, yielding very different light distributions at the output.
Generation of such responses can be originated from the different light coupling among the different
fiber core diameters. Light exposed from a fiber core will couple first to a neighboring core with a
larger diameter, rather than to one of a smaller diameter. These devices clearly demonstrate that the
choice of diameters for the fiber cores, as well as their position within the fiber array provide a means
for tuning the light patterns generated at the output of these devices.
Defects and imperfections generated during the fabrication process are an important factor to
consider. The most common defects arise from fiber twisting/bending, ellipticity when tapering the
structure, air bubbles, or cracks in the glass capillaries. Figure III-23.a shows the image of an air
bubble encapsulated in the transition section of a PL. The presence of any of these defects results in
mode mixing at the output of the devices. As an example of this situation, the near field mode profiles
of a fifteen fiber MSPL with imperfections at the fabrication stage are shown in Figure III-23 in which
mode mixing is clearly noticeable.
a) b)
Fig. III - 23. Defect present during the PLs fabrication process: a) image of an air bubble encapsulated in the transition section, and b) near field mode profiles from a fifteen fiber MSPL with defects.
III.4 CHARACTERIZATION
Evaluation of the performance of photonic lanterns requires additional characterization. One
aspect to cover includes the analysis of the intensity distribution of the mode profiles. Also, the
evaluation of the PLs when coupled to transmission fibers is a key aspect, since these devices are
designed for their integration in fiber transmission systems. This last feature is generally achieved
by obtaining the transfer matrix of the transmission system, measuring the crosstalk of the devices.
Both aspects are described in the following sections.

- 44 -
III.4.1 MODE-INTENSITY PROFILES
Quantification of the mode purities was carried out for each type of MSPL fabricated by
analyzing the intensity distribution from the near field and far field mode profiles. Numerical results
of the mode purities measured for the MSPLs are listed in Table III-1. Typical results for the energy
distribution for each LP mode are presented in Figure III-24, showing the near field (blue) and far
field (orange) intensity profiles; theoretical mode profiles are also included for a direct comparison
of the intensity distribution.
Table III - 1. Near field mode purity analysis of the MSPLs.
LP mode
Mode Purity (dB)
3 fiber MSPL 6 fiber MSPL 10 fiber MSPL 15 fiber MSPL
Near field Far field Near field Far field Near field Far field Near field Far field
LP11 -13.0 -13.4 -10.5 -8.9 -12.2 -8.9 -11.3 -11.0
LP21 -14.4 -17.7 -10.2 -15 -11.2 -10.6
LP02 -19.4 -17.7 -14.2 -10.9 -13.4 -9.7
LP31 -12.6 -13.4 -11.4 -11.3
LP12 -11.6 -12.4 -10.9 -12.4
LP41 -9.75 -12.9
LP22 -12 -10.1
LP03 -13.1 -12.9
a)
b)
c)
Fig. III - 24. Mode-intensity profiles from the MSPLs: a) near field and b) far field mode profiles. c) Theoretical light distributions of the fiber LP modes included for direct comparison.
Measured light maxima of the experimental mode-intensity patterns show a good agreement with
the theoretical light distributions. From analyzing the near and far field-intensity profiles, the peaks
remain within the same spatial allocation indicating mode preservation. However, for some modes
the peak intensity contrast change; specifically for the LP02 and LP12 modes. A relevant feature visible
in the far field mode-intensity profiles is a smoother distribution for the peaks in the plots, as in
contrast for the near field case.

- 45 -
III.4.2 FIBER COUPLING: LOSSES AND TRANSFER MATRICES
One of the attractiveness of photonic lanterns is their ease of integration to fiber systems for
signal transmission. A correct pairing between the cores of the PL and the transmission fiber is a
critical factor for a successful alignment and for a full excitation of all the modes supported by the
fiber. Recent research in few-mode fibers (FMFs) has been developed aiming at reducing mode
coupling [49, 95, 96] during transmission as well as at minimizing the differential group delay (DGD)
of the modes [51-53]. FMFs were created for their use in telecommunications but they are also
attractive for sensing applications due to its increased sensitivity to perturbations of higher order
modes [97, 98]. Integration and performance of PLs in fiber systems are commonly tested by coupling
and splicing the lanterns to FMFs, and consecutively evaluating their capabilities to excite and
transmit each of the supported modes. The PLs described in the previous sections were tested with
FMFs supporting 2, 6 and 9 LP fiber modes [52, 53].
Coupling of the PLs to the FMFs was performed in the tapering system, which possesses the capability
of splicing a wide variety of fibers. The PLs are first butt coupled to the FMF and a correct alignment
is verified upon observing the mode profiles at the output end of the fiber. Splicing is then performed
by means of the CO2 laser of the tapering system. A thorough evaluation of the PLs/FMFs coupling is
achieved using mode-selective devices since each LP mode can be analyzed independently. The
features of the graded-index FMFs coupled to each of the fabricated MSPLs are listed in Table III-2.
Table III - 2. Characteristics of the graded-index fibers coupled to MSPLs.
Fiber ID/OD [m] Spliced to
2 LP modes 14/125 3 fiber PLs
6 LP modes 28/125 6 and 10 fiber PLs
9 LP modes 30/125 Tapered MMF
MMF 50/125 15 fiber PLs
Particular attention was paid in splicing the fifteen fiber PLs due to the low n housing capillary used
for the microstructured preforms. This resulted in a small NA restricting the final diameter of the
device and impeding a direct splice to a 9 LP modes FMF due to modal mismatch. Because the
resulting core diameter of the fifteen fiber PLs is greater than the 9 LP-FMF core (35 m vs. 30 m)
and the different refractive index profile (step-index vs. graded-index, respectively), an intermediate
standard MMF of 50 m core diameter had to be spliced in between in order to reduce the difference
in core sizes.
The MMF for core matching is further adapted by tapering process, thus reducing the core diameter
to 30 m. Additional tapering of the MMF restricts the propagation of unnecessary modes, thereby
allowing the transmission of only the desired 9 LP modes. Near field mode profiles at the output of
the FMFs spliced to 3, 6, 10, and 15 fiber MSPLs are shown in Figure III-25. As seen in these mode
profiles, conservation of the light patterns generated by the MSPLs is apparent after 2 m of
propagation along the FMF. However, mode mixing of the LP modes within the same group mode is

- 46 -
evident in the modal patterns. This modal mixing occurs among the radial order modes with the same
azimuthal order between the step-index and the graded-index fibers. Also, this effect can be provoked
due to the use of the intermediate MMF for core size matching.
Further characterization of the devices included measuring the fabrication and coupling losses after
splicing a meter of FMF to the MSPLs. Fabrication losses measured in all the devices were usually in
the range of 0.1 – 0.5 dB. Due to the FMF splice, an increase in losses occurs as the mode group
increases; this effect is known as mode-dependent loss (MDL) [99]. Table III-3 summarizes the
measured coupling losses from splicing the MSPLs to FMFs. For the fifteen fiber devices, MGS-PLs
were used instead of a MSPL because of the additional losses caused by the low-NA preform and
mode mixing.
Table III - 3. Coupling losses resulting from MSPLs and FMFs splices.
LP mode FMF Splicing Losses [dB]
3 fiber MSPL 6 fiber MSPL 10 fiber MSPL 15 fiber GMS-PL
LP01 0.3 0.17334 0.405 0.34
LP11 -- 0.22998 0.46 0.96
LP21 0.15619 0.82 1.11667
LP02 0.54167 1.52
LP31 1.4275 1.41708
LP12 2.3
LP41
4.576 LP22
LP03
The PLs performance as MUX and DEMUX devices was tested upon splicing pairs of lanterns onto the
opposite ends of FMFs. Light from a swept wavelength interferometer (SWI) with spatial diversity
was then launched into every single-mode fiber of the MUX, and the output power at each of the
output fibers of the DEMUX was measured with a photodetector. This arrangement allows obtaining
the transfer matrix along the entire C- and L-bands, commonly used in the optical fiber
communications [100]. The transfer matrix of a SDM transmission system plots the normalized
intensities at the inputs and outputs of the PLs used for MUX/DEMUX purposes. An important feature
of this graphic representation is the capability to provide information about crosstalk among the
spatial channels, as well as information regarding mode mixing.

- 47 -
Fig. III - 25. Near field mode profiles of the MSPLs spliced to FMFs. a) Three fiber MSPL spliced to a 2 LP mode FMF. b) Six fiber MSPL spliced to a 6 LP mode FMF. c) Ten fiber MSPL spliced to a 6 LP mode FMF. d) Fifteen fiber MSPL spliced to a MMF and
then to a 9 LP mode FMF.
Ideally, a system with modal selectivity should present zero mixing between modes and crosstalk
should be negligible. For ideal MSPLs and FMF, neither LP modes of the fiber nor their corresponding
degenerate modes should mix, and light launched into a single fiber should exit only at its reciprocal
output fiber [100, 101]. This is illustrated in Figure III-26a, showing the transfer matrix for this ideal
case. If modal mixing is present at the level of group modes, the total power launched in any single
fiber will be equally distributed only among the fibers corresponding to the same group mode (see
Figures III-26b and III-26c). In contrast, for a system with no modal selectivity at all, the light
launched at any input fiber will spread evenly among all of the output fibers.
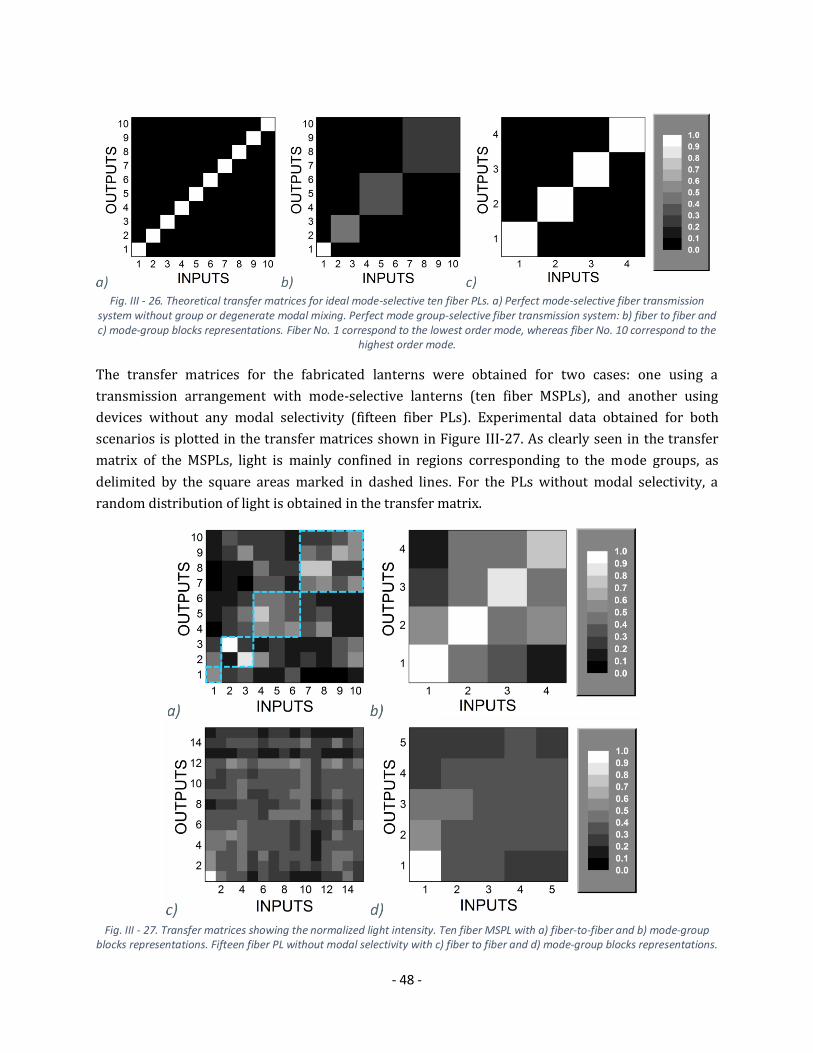
- 48 -
Fig. III - 26. Theoretical transfer matrices for ideal mode-selective ten fiber PLs. a) Perfect mode-selective fiber transmission system without group or degenerate modal mixing. Perfect mode group-selective fiber transmission system: b) fiber to fiber and c) mode-group blocks representations. Fiber No. 1 correspond to the lowest order mode, whereas fiber No. 10 correspond to the
highest order mode.
The transfer matrices for the fabricated lanterns were obtained for two cases: one using a
transmission arrangement with mode-selective lanterns (ten fiber MSPLs), and another using
devices without any modal selectivity (fifteen fiber PLs). Experimental data obtained for both
scenarios is plotted in the transfer matrices shown in Figure III-27. As clearly seen in the transfer
matrix of the MSPLs, light is mainly confined in regions corresponding to the mode groups, as
delimited by the square areas marked in dashed lines. For the PLs without modal selectivity, a
random distribution of light is obtained in the transfer matrix.
Fig. III - 27. Transfer matrices showing the normalized light intensity. Ten fiber MSPL with a) fiber-to-fiber and b) mode-group blocks representations. Fifteen fiber PL without modal selectivity with c) fiber to fiber and d) mode-group blocks representations.

- 49 -
A useful parameter for crosstalk evaluation is the mode selectivity factor. This is defined as the ratio
of the power contained in the desired mode to that obtained for all of the remaining modes within a
mode group. In other words, this parameter compares the light confinement in a mode group in a
MSPL and a non-mode-selective PL. The plot in Figure III-28 shows the comparison of the results
between the two analyzed scenarios. For MSPLs, clear mode selectivity of around 3 dB is achieved
for the second, third, and fourth mode groups. In contrast, for the common PLs the mode selectivity
is negligible, with the exception of the first group mode, which presents mode selectivity similar to
that obtained for a MSPL. This can be attributed to the graded-index of the transmission fibers, which
tend to favor the propagation of the fundamental mode.
Fig. III - 28. Comparison between experimental results obtained for photonic lanterns with and without modal selectivity.
The performance of the photonic lanterns indicates how this developing technology possesses the
capabilities to generate specific light patterns. Specific light patterns at the output of these devices
can be obtained by the appropriate selection of the fabrication parameters and fibers characteristics.
An amazing advantage of these all-fiber PLs over other existing technologies is the minimum losses
achievable if the tapering process is completely adiabatic; in fact, all-fiber devices for SDM are
hypothetically lossless. Furthermore, all-fiber PLs can directly be integrated into fiber systems,
avoiding the use of free-space optics or other materials. Notice also that scalability to a larger number
of modes with these PLs is more straightforward than other fiber approaches [62]. Other applications
for these devices will surely emerge as this technology evolves.
Equation Section (Next)

- 50 -
CHAPTER IV: MICRO-RING
RESONATORS
Micro-ring resonators (MRRs) are a popular technology for sensing applications nowadays
because they offer outstanding sensitivity to external perturbations. These typically affect the
refractive index of the device leading to changes of the resonance conditions, hence modifying the
transmission spectrum [25, 28-31]. The use of reconfigurable materials in the fabrication of MRRs
allows for the adjustment in their spectral features. Fabrication of devices working on this principle
has been explored with acusto- and electro-optic materials [102, 103]. The use of polymeric materials
has also been demonstrated for fabricating micro–ring resonators, yielding devices with lower
fabrication costs, ease of processing, and showing adequate performance for sensing applications
[104]. An advantage of utilizing polymers, is the possibility of further functionalization using
additional materials such as doped polymers, which are capable of modifying their refractive index
with external signals [105-108]. These capabilities have proven to be useful for optics and photonics
applications [106-108].
An approach for fabrication of tunable MRRs is the use of cylindrical elements coated with thin layers
of functional polymers. Coating films in optics are required to be smooth and uniform, in order to
achieve good quality devices. A crucial factor in optical coatings is the control of thickness as it defines
the interaction of light with the coated material. Usually thin layers of solid materials are preferred
for coating optical elements requiring highly controllable deposition process (e.g., PVD, CVD,
sputtering, etc.) [109-111]. The use of fluidic materials represents an alternative to create coating
layers, making use of the physical properties of the coating material to define the resulting coatings.
This approach usually implies a simpler fabrication, where the most common methods include spin
coating, dip coating, and roll coating [112-114]. However, all of these methods are limited to planar
surfaces and are not the most suitable options to apply on other geometries, such as cylinders.
Uniform coating of wires or fibers is normally performed upon pulling them through a container with
the liquid solution to be deposited. The thickness of the resulting coating is given by the diameter of
the output aperture of the container. However, this technique requires large lengths of fiber to work
properly and induces strain over the elements to be coated, thus representing a problem when fragile
optical devices are used or when coating short elements [115, 116]. Adapted techniques based on
variations of the dip and wire coating processes, have been efficiently accomplished for fabrication
of small diameter photonic devices incorporating thin and uniform layers of polymeric materials
[117-119]. These approaches are based on displacing a small reservoir or drop of the coating fluid
along the cylindrical element, leaving a layer of the material on the surface of the element.

- 51 -
In this chapter we demonstrate the fabrication and characterization of MRRs fabricated with
cylindrical elements coated with thin layers of polymeric materials. Characterization of the coating
process using two different polymers is described for the single-layer and multiple-layer approaches.
The use of polymers incorporating photoluminiscent, absorbent, and birefringent materials is
studied with the purpose to generate an optically tunable response. We further explore the use of
multilayer resonators aiming at improving the tuning effect achieved in these MRRs.
IV.1 MICRO-RESONATORS PRINCIPLES AND FABRICATION
In general, a micro-resonator is formed by a waveguide which conducts light in a closed loop
trajectory in the micrometric scale size. When the light waves propagated through the loop build up
a phase shift equal to a multiple integer of 2 in a round trip, constructive interference of the waves
takes place and generates a resonant effect yielding intense confinement of light within a small
volume [28-30, 120]. Normally, this loop trajectory can be formed by different circular-like
geometrical configurations, such as rings, disks, spheres, racetracks, or ellipses. Micro-ring
resonators are formed by a closed circular waveguide, confining light inside by conventional total
internal reflection (TIR). The supported transverse and azimuthal modes in these waveguide
structures are defined by their physical dimensions [28-30]. Since MRRs are very small, they offer
great potential for integration with other technologies and/or components such as fiber optics [30,
31]. These optical devices have been used for a wide variety of applications, and the most common
include filters, switches, modulators, sensors, wavelength division multiplexers (WDMs), and
micron-size lasers [29-31, 120]. Photolithographic processes compatible with the electronics
industry are normally used for the fabrication of micro-ring resonators. However, fiber approaches
have been studied presenting the advantage of direct coupling to fiber optic technologies.
A special case of resonance commonly found in micro-disks and micro-spheres are the whispering
gallery modes (WGM). In WGM, the resonances are originated by the waves propagated azimuthally
at the boundary of the resonator and the surrounding media [29-31]. This particular type of
resonance is considered only when the outer boundary plays a role in the confinement of the wave,
usually present in single material micro-resonators [29]. Therefore, in WGM light does not penetrate
inside the material of the resonator. When an inner boundary exists, the requirement for generating
WGM is that the caustic radius of the inner material lies between the other two interfaces. Otherwise,
the waveguide is multimode and several modes will couple at different resonance wavelengths [29,
30, 31, 121].
The most common method for coupling light into resonating cavities is through evanescent waves
from another optical waveguide [28-30]. The use of tapered optical fibers is the most popular
approach for light coupling [30]. To fully describe the resonance features of the MRRs it is useful to
consider a straight single-mode waveguide close to a circular single-mode waveguide. Light traveling
through the straight waveguide couples to the resonant cavity, as depicted in Figure IV-1. The

- 52 -
complex mode amplitudes interacting in the coupling process include the input (EI1 and EI2) and
output (EO1 and EO2) signals in the straight and curved waveguide, respectively.
Fig. IV - 1. Micro-ring resonator scheme. A light signal (EI1) is launched through a single-mode waveguide and coupled to the
resonant cavity (radius R), yielding a resonant response (EO1).
The relationship between the inputs and outputs of the system can be obtained from coupled mode
theory analyzing the interaction between both guiding structures. For this analysis the propagation
constants for the straight and resonant waveguides are assumed to be identical 1 2 . Taking
into account the parameters of the directional coupler such as the coupling length ( ℓ ), the mode-
coupling coefficient (κ), and intensity-insertion-loss coefficient (𝛾 ), the output signals are defined as
[2]:
1
21 1 21 cos sinO I IE E jE <IV.1>
1
22 2 11 cos sinO I IE E jE <IV.2>
Considering the circular geometry of the waveguide of radius R, the light travels a total trajectory
presenting a single-pass shift ( L ), the losses can be accounted with the intensity
attenuation coefficient ( ρ ). Then, the energy coupling back to the straight waveguide after a round
trip in the resonator is [2]:
2
2 2
L j L
I OE E e
<IV.3>
Given these relationships, determination of the amplitude transmittance through the straight
waveguide can be defined as [2, 28, 29]:
122
11 2
11 22
cos 11
1 1 cos
L j L
O
L j LI
eE
Ee
<IV.4>
Redefining the parameters of the previous equation, the parameters x and y are defined as:
2L R

- 53 -
1
221L
x e
<IV.5>
cosy <IV.6>
The condition 2 m is required for resonance to occur, where m is an integer; hence, <IV.4> can
be rewritten as [2, 28, 120]:
2 2 2
1
2 21
1 1( ) 1 1
1 4 sin2
O
I
x yET
E xy xy
<IV.7>
This expression shows that coupling into the cavity occurs only at certain wavelengths. A typical
transmission spectrum for these devices is shown in Figure IV-2.
Fig. IV - 2. Typical transmission spectra from a micro-ring resonators (R = 62.5 m).
As illustrated in Figure IV-2, resonance occurs at wavelengths with a separation given by the features
of the micro-ring, which is inverse to the time delay in a round trip. The separation between these
resonant wavelengths () is known as the Free Spectral Range (FSR), defined as [28, 29]:
2 2
2g g
FSRn L n R
<IV.8>
0
0 0
eff
g eff
nn n
<IV.9>
where is the central wavelength between both resonances, and ng is the group refractive index
given in terms of the effective refractive index (neff).
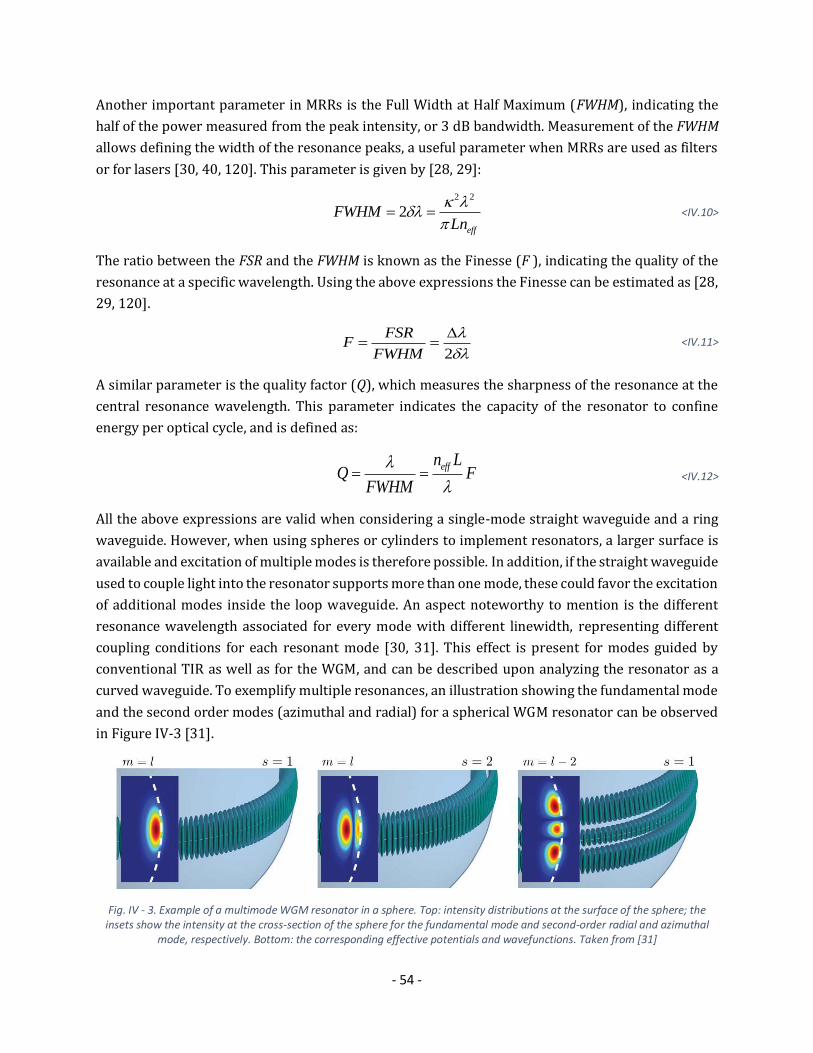
- 54 -
Another important parameter in MRRs is the Full Width at Half Maximum (FWHM), indicating the
half of the power measured from the peak intensity, or 3 dB bandwidth. Measurement of the FWHM
allows defining the width of the resonance peaks, a useful parameter when MRRs are used as filters
or for lasers [30, 40, 120]. This parameter is given by [28, 29]:
2 2
2eff
FWHMLn
<IV.10>
The ratio between the FSR and the FWHM is known as the Finesse (F ), indicating the quality of the
resonance at a specific wavelength. Using the above expressions the Finesse can be estimated as [28,
29, 120].
2
FSRF
FWHM
<IV.11>
A similar parameter is the quality factor (Q), which measures the sharpness of the resonance at the
central resonance wavelength. This parameter indicates the capacity of the resonator to confine
energy per optical cycle, and is defined as:
effn L
Q FFWHM
<IV.12>
All the above expressions are valid when considering a single-mode straight waveguide and a ring
waveguide. However, when using spheres or cylinders to implement resonators, a larger surface is
available and excitation of multiple modes is therefore possible. In addition, if the straight waveguide
used to couple light into the resonator supports more than one mode, these could favor the excitation
of additional modes inside the loop waveguide. An aspect noteworthy to mention is the different
resonance wavelength associated for every mode with different linewidth, representing different
coupling conditions for each resonant mode [30, 31]. This effect is present for modes guided by
conventional TIR as well as for the WGM, and can be described upon analyzing the resonator as a
curved waveguide. To exemplify multiple resonances, an illustration showing the fundamental mode
and the second order modes (azimuthal and radial) for a spherical WGM resonator can be observed
in Figure IV-3 [31].
Fig. IV - 3. Example of a multimode WGM resonator in a sphere. Top: intensity distributions at the surface of the sphere; the insets show the intensity at the cross-section of the sphere for the fundamental mode and second-order radial and azimuthal
mode, respectively. Bottom: the corresponding effective potentials and wavefunctions. Taken from [31]

- 55 -
IV.1.1 SENSING WITH MICRO-RING RESONATORS
The principal mechanism for sensing with MRRs consists on the modification of resonance
conditions. Mainly, the cavity dimensions and the refractive index of the materials used for their
fabrication define the spectral response of the resonators. Detection in micro-resonators is usually
performed analyzing the spectral changes in the resonance. Changes in the resonance wavelengths
can be categorized as follows (see Figure IV-4) [30]:
Resonant wavelength (or frequency) shift.- this effect is originated by changes in the refractive
index or resonator dimensions.
Change in the quality factor.- this is provoked by changes in absorption of the resonator
materials affecting the broadening of the resonance.
Change in peak transmission.- this effect is generated by variations in the coupling conditions
between the straight waveguide and the micro-resonator.
Fig. IV - 4. Sensing responses in micro-ring resonators. a) Change in the resonance wavelength. b) Change in the quality factor. c) Change in the peak transmission. Taken from [30].
Light coupling into resonators of circular cross section, such as micro-spheres or rods, commonly
give place to WGM resonances. In contrast, micro-ring resonators make use of elements with thin
walls (e.g., thin wall glass capillaries), resulting in light confinement due to conventional TIR.
Deposition of thin layers on the cylindrical elements further leads to light confinement conditions
analogous to those obtained for optical waveguides. When the material used as coating possess a
higher refractive index than the cylindrical element, light is confined mostly within the coating layer.
In contrast, the use of a material with lower refractive index yields light propagation within the
coating and the cylindrical element, and some modes will be confined in the cylindrical element. The
use of multiple layers in this kind of resonator thus offers the potential for customizing light
confinement and the spectral features of devices upon selecting adequate materials. As an example,
micro-ring resonators formed with two coating layers may offer the capability to confine most of the
light either within the outer layer or allow for it to extend to both layers, depending on the choice of
refractive indices. Such a feature can lead to devices with tunable resonances upon the use of
reconfigurable materials. Furthermore, these may render useful for sensing applications as well.

- 56 -
Micro-resonators operating under these schemes are illustrated in Figures IV-15a to IV-15c, showing
how light is confined and propagates depending on the number of layers used for the structure.
a) b) c) d)
Fig. IV - 5. Light confinement in MRRs with circular cross-section: a) bulk materials (WGM resonances), b) single-layer coating, c) multilayer coatings, and d) functional polymer multilayer coated MRR.
New approaches for fabricating micro-ring resonators formed by distinct layers of functionalized
materials can yield versatile devices for a wide variety of applications. Under this approach, the
combination of reconfigurable layers can be used (i.e., materials capable of change the refractive
index under an external signal or by the interaction with external objects/substances). As an
example, tunable devices may be obtained upon appropriately selecting the materials forming the
layers of the resonators. This can be realized by depositing two different polymeric thin coatings on
solid glass rods as illustrated in Figure IV-5d. While the inner layer of the MRR may contain a
fluorescent material activated by infrared light, the outermost coating may include a material whose
optical features change upon absorption of the light emitted from the inner layer. Thus, the
combination of these coating layers provides a means to modify the refractive indices of the
materials, thereby changing the spectral features of the MRR. Fabrication details and characterization
of these multilayer-coated MRRs are provided in the following sections.
IV.2 THIN-LAYER COATINGS
Coating of cylindrical optical elements to generate the functional MRRs is based on the wire
coating technique first described by Landau, Levich, and Derjaguin (LLD theory). The dynamics of
this process were later defined by Ryck and Quéré [122, 123]. The principle of this technique relies
on pulling a wire of constant diameter with smooth and uniform surface through a liquid solution;
during the pulling process, a small amount of the liquid is left on the surface of the wire. As a result,
a wire (radius r) can be coated with a thin-layer of liquid (see Figure IV-6). The thickness of the
coating layer (h) is given by the speed at which the process takes place (V), and the intrinsic
properties of the liquid, such as the viscosity ( ) and surface tension (). These parameters conform
the capillary number (Ca), defined as:

- 57 -
<IV.13>
For h < r, and the thickness of the coating layer can be obtained as:
2
31.34h rCa <IV.14>
If , it is necessary to adjust <IV.14> replacing r by resulting in [124]:
23
23
1.34
1 1.34
rCah
rCa
<IV.15>
Fig. IV - 6. Wire coating technique scheme. A layer of coating material (thickness h) is left on the surface of the wire (radius r) by pulling the coating material at a constant velocity (V) through a liquid container
Coating of glass optical fibers, both, tapered and of standard diameters, was realized through a
modified version of the wire coating technique. A coating system was specifically design for this task,
capable of housing cylindrical devices to be coated with liquid polymers [117]. Polymer-coated MRRs
were fabricated with this system, which maintains the cylindrical element fixed and moves the
coating fluid along the section to be coated. Using this approach, only a small section of the element
to be coated is fully immersed in the liquid, thus avoiding the rupture or deformation by strain of the
element. The reservoir containing the liquid is displaced at a controlled velocity along the cylindrical
element by activating a stepper motor. This capability allows for generating a uniform thickness in
the coating. The system can also accommodate devices ranging from one micron in diameter (e.g.,
single-mode tapered optical fibers) up to a millimeter (e.g., glass capillary tubes). An additional
feature of this coating system is the capability of placing up to ten cylindrical elements for
simultaneous coating, granting similar fabrication conditions for multiple devices. A more detailed
description of the coating system can be found in [117].
Selection of the polymeric materials for the fabrication of photonic devices is based on their
properties such as refractive index, hardness, thermal features, just to name a few. Usually, the
polymers used for photonic applications are based on acrylate, styrene, carbonate, and silicone
compounds [125]. In our case, we used two different polymers: polydimethilsiloxane (PDMS, Sylgard
184) which is thermally curable, and an acrylate UV-curable polymer (Efiron PC-414, further denoted
VCa
1Ca
1Ca r h

- 58 -
as UVpoly). Characterization of the coatings for single and multiple layers, as well as the generation
of coating instabilities, are discussed in the following sections.
IV.2.1 COATING INSTABILITIES
Under certain conditions, the coating on a wire can present undulations owing to liquid
instabilities. Such an effect is described by the Plateau-Rayleigh instability, resulting in the generation
of a series of periodic droplets [126]. The characteristic growth of the periodic droplets occurs at a
characteristic time (t0), which depends on the wire and the coating thicknesses as follows:
4
0 312
r ht
h
<IV.16>
Another factor to take into consideration is gravity, which may cause radial variations in the coating.
This effect can be gauged upon comparing the capillary and gravity forces, determined by the density
of the liquid polymer and the gravitational acceleration . A common dimensional parameter
used to evaluate this is the Bond number, given by:
<IV.17>
A criterion used is for a value of Bo ≪ 1, where gravity effects on the coating material can be neglected
given the characteristics of the fluid and thus radial uniformity on the coating layer can be assumed.
Otherwise, the thickness and geometry of the deposited coating layer will depend on the capillary
and Bond numbers [123].
Fig. IV - 7. Optical microscope image from the coating instabilities produced when coating an optical fiber with PDMS containing a colorant.
From Eq. <IV.16>, it can be inferred that for h < r, the required time for formation of instabilities will
be large. Conversely, for thick coatings the instability will appear after short periods of time once the
coating layer has been deployed, thus producing a non-uniform coating. The formation of instabilities
is a very important factor to consider in the wire coating process since its characteristic growth time
limits the dimensions of a uniform layer. If polymers are sought as coating materials, the instability
growth time must be larger than the time required for curing the polymer and hence obtain a uniform
g
2grBo

- 59 -
coating layer. Figure IV-7 shows an unstable layer obtained in a PDMS coating deposited onto a glass
capillary using a coating velocity of 2.5 mm/min.
IV.2.2 SINGLE-LAYER COATINGS
To evaluate the performance of single-layer coatings, standard single-mode optical fibers
with a diameter of 125 m (Corning SMF-28e) were coated at different speeds with thin-layers of
PDMS and the UVpoly in 35 mm long sections. Prior coating, the protective polymer of the optical
fibers was removed; the glass cladding was then cleaned with laboratory grade isopropyl alcohol and
acetone, and finally they were placed in the coating system.
a)
b)
Fig. IV - 8. Scanning electronic microscopy (SEM) images of an optical fiber coated with a layer of UVpoly of approximately 1.15 μm at a speed of 1 mm/min: a) initial section of the coating, and b) uniformly coated optical fiber (bright dot caused by
sample preparation-manipulation for SEM imaging).
Once the coating process was finished, the thickness of the deposited coating was measured using
scanning electron microscopy (SEM). Thickness measurements were performed analyzing the SEM
images in sections of 215 m of length, every 5 mm along the entire coated section of the fiber. A
direct comparison between the images obtained from the coated sections and those obtained from
an uncoated section of the fibers yielded the increase in diameter due to the coating layer. In order
to ensure uniform polymer thin coatings and avoid fluid instabilities, the fibers were coated at low
velocities (< 2 mm/min). An example of an optical fiber coated with the UVpoly is shown in Figure IV-
8. A noticeable difference between the bare fiber and the coated section is appreciated in Figure IV-
8a, whereas the uniformity of the resulting coating is demonstrated in Figure IV-8b.
Thin layers of UVpoly were deposited at velocities of 0.5, 0.75, 1.0, and 1.5 mm/min., curing the
polymer after the coating process was finished. Curing was carried out with a single sweep across
the coated section with an UV curing LED system (Thorlabs CS2010, 365 nm) with a power density
of 6 W/cm2 for a period of time of 2 minutes. The thicknesses of the single-layer UVpoly coatings are

- 60 -
plotted in Figure IV-9 with their corresponding coating velocities. For comparison, the measured
thicknesses are plotted along with the curve experimentally obtained using the LLD theory.
Fig. IV - 9. Measured layer thicknesses for the UVpoly at different coating velocities and calculated thickness for two different temperatures.
Since the data sheet of the UVpoly only includes the values of the viscosity as a function of
temperature, the surface tension was estimated by fitting Eq. <IV.14> with the experimental data.
The coatings in this experiment were performed at a room temperature of 27.5 °C, which yields an
estimated viscosity of 6.45 Pa∙s according to the data sheet. Based on this estimated value, we
obtained a surface tension of 36.09 mN/m, which is in good agreement with previous reports for
acrylate polymers [126]. It is important to notice that the surface tension and viscosity are highly
affected by temperature, and this consequently affects the resulting coating thicknesses. Thermal
variations during the coating process are thus accounted in the error bars included in the plot. To
illustrate the temperature effects on the coating thickness, a plot of Eq. <IV.14> for a room
temperature of 25 °C is also included in Figure IV-9.
PDMS is a thermally curable material composed by a silicone base polymer and a crosslinking agent.
Owing to its curing mechanism (thermal), the surface tension and the viscosity vary with time, and
the coating and characterization are thus more complex than the UVpoly. An additional factor to take
into consideration is the mixture ratio of base polymer and curing agent affecting the properties of
the cured PDMS. As an example, the data sheet specifies a 𝜂 = 5.1 Pa∙s for the base polymer and a
𝜂 = 3.5 Pa∙s for a mixture ratio of 10:1, for which a γ = 19.8 mN/m is reported elsewhere [128, 129].
In our experiments, the coatings were made of a polymer to curing agent mixture ratio of 8:1 to
ensure complete solidification of the composite. In order to consider appropriate values for the PDMS
viscosity, a time-dependent rheological characterization was carried out with a rheometer (ARG2, TA
Instruments, cone-plate geometry 60 mm, 2 °). The results from this characterization yielded a nearly
Newtonian viscosity of 0.5 Pa∙s for a temperature of 27.5 °C during the first half hour after the mixture
was done. However, four hours later, the viscosity of the mixture was measured to be 𝜂 = 10 Pa∙s,
clearly showing that the rheological properties of PDMS vary considerably during the curing process.

- 61 -
Several bare optical fibers were coated with PDMS mixed in an 8:1 ratio at velocities ranging from
0.375 to 1.5 mm/min. As for the UVpoly case, the coatings were measured via SEM images. As
illustrated in Figure IV-10, different thicknesses were obtained for the same coating velocity when
using different PDMS viscosities. The fitting curves shown in the figure were obtained considering a
γ = 19.8 mN/m. From these results, it is clear that an increase in the layer thickness occurs as the
polymer viscosity increases as a consequence of thermal effects. In some of these cases, the polymers
were prepared and deposited as coatings in different days and under different environmental
conditions. Nonetheless, the results are consistent with the predictions of wire coating theory.
Fig. IV - 10. Characterization of the coating layer thickness for PDMS at different coating velocities and viscosities.
Optical losses induced by the coatings are an important factor to consider in photonic devices. These
were evaluated on the transmission spectra of tapered optical fibers fabricated with standard single-
mode fibers using the flame-brushing technique [54]. Optical fiber tapers with a total length of 4 cm
and with a constant waist diameter of approximately 6 m along 1 cm were coated at a speed of
1.5 mm/min using both materials, UVpoly and PDMS; the resulting coating layers were estimated to
had thicknesses of 200 and 110 nm, respectively. As the radius of the tapered section is significantly
reduced, light propagation in occurs in the cladding material of the fiber. As a consequence, light
confinement is then defined by the surrounding material.
Typical attenuation losses on the transmission spectrum after depositing the polymer coatings onto
the tapered section of the fibers are shown in Figure IV-11. While PDMS coating layers can present
losses from 1.8 to 0.75 dB, the UVpoly coatings losses are below 0.75 dB. The attenuation slope over
the spectral range observed for PDMS layers is attributable to wavelength dependent power
confinement or mode field extension due to the effective refractive index of the coating. Similarly, the
spectral modulation registered in the spectra is most likely due to the refractive index and due to
variations in mode confinement when a layer with similar n value surrounds the optical fiber. Small
fluctuations with maximum amplitude of 0.3 dB observed for both coatings may be attributed to
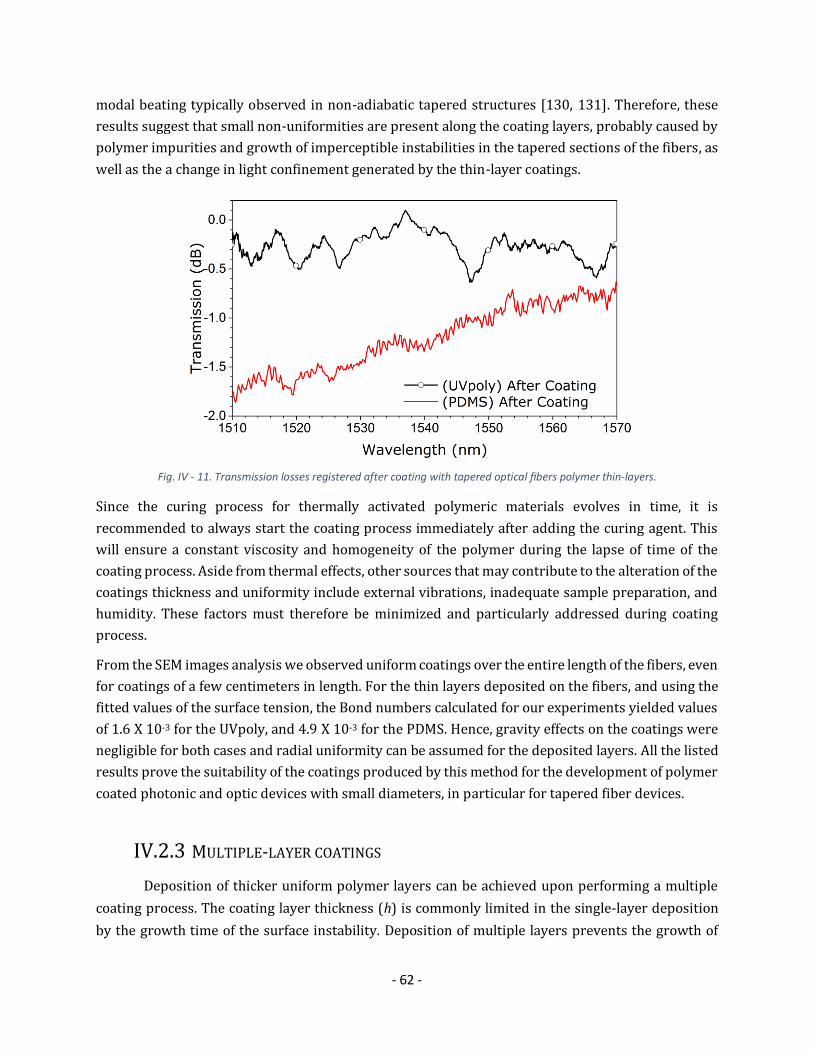
- 62 -
modal beating typically observed in non-adiabatic tapered structures [130, 131]. Therefore, these
results suggest that small non-uniformities are present along the coating layers, probably caused by
polymer impurities and growth of imperceptible instabilities in the tapered sections of the fibers, as
well as the a change in light confinement generated by the thin-layer coatings.
Fig. IV - 11. Transmission losses registered after coating with tapered optical fibers polymer thin-layers.
Since the curing process for thermally activated polymeric materials evolves in time, it is
recommended to always start the coating process immediately after adding the curing agent. This
will ensure a constant viscosity and homogeneity of the polymer during the lapse of time of the
coating process. Aside from thermal effects, other sources that may contribute to the alteration of the
coatings thickness and uniformity include external vibrations, inadequate sample preparation, and
humidity. These factors must therefore be minimized and particularly addressed during coating
process.
From the SEM images analysis we observed uniform coatings over the entire length of the fibers, even
for coatings of a few centimeters in length. For the thin layers deposited on the fibers, and using the
fitted values of the surface tension, the Bond numbers calculated for our experiments yielded values
of 1.6 X 10⁻³ for the UVpoly, and 4.9 X 10⁻³ for the PDMS. Hence, gravity effects on the coatings were
negligible for both cases and radial uniformity can be assumed for the deposited layers. All the listed
results prove the suitability of the coatings produced by this method for the development of polymer
coated photonic and optic devices with small diameters, in particular for tapered fiber devices.
IV.2.3 MULTIPLE-LAYER COATINGS
Deposition of thicker uniform polymer layers can be achieved upon performing a multiple
coating process. The coating layer thickness (h) is commonly limited in the single-layer deposition
by the growth time of the surface instability. Deposition of multiple layers prevents the growth of

- 63 -
instabilities provided that h is decreased in every step of the deposition process. This approach was
explored by applying multiple layers of the described polymers onto optical fibers and glass
capillaries.
An important factor to consider during the deposition of multiple layers is the solid polymer–liquid
polymer interface (i.e., liquid polymer over a cured polymer, instead of having a glass-liquid polymer
interface). This is important because such an interface favors the slippage of the liquid upon applying
the second polymer layer [132]. Thus, the LLD thickness model (Eq. <IV.14>) requires adjustments
to account for this slipping condition during the coating process. This is addressed by using an
apparent viscosity (app) defined as [133]:
<IV.18>
where λslip is the slip length, which accounts for the non-zero velocity at the interface.
Standard single-mode optical fibers were coated at a speed of 1.5 mm/min with one layer of UVpoly
and cured with UV light irradiation; subsequently, a second coating layer of the same polymer was
deposited and cured. Thickness results exhibit an increase in fiber diameter for a two-layer coating,
as shown in Figure IV-12. Using Eqs. <IV.14> and <IV.18> we obtained a 𝜂app = 2.93 Pa∙s. The
experimental thickness measured after deposition of the second layer coating agrees well with the
value predicted by the LLD model.
a) b)
Fig. IV - 12. Characterization of the layer thickness of UVpoly for multiple layers on optical fibers: a) SEM images of the bare and coated fibers; b) measured thicknesses for the layers and fitting using the slipping condition (see text).
Coating of cylindrical elements with bigger dimensions is also of interest for diverse applications
which may require thicker layers. Several applications have arisen based on glass capillaries in the
fields of optofluidics and photonics [134, 135]. An example of this is the use of photoresponsive
polymer layers on glass capillaries proposed as a novel approach for inducing thermocapillary flow
[134].
Evaluation of the multilayer approach was performed in [117], coating 20 μL glass capillary tubes
(Drummond, 450.85 μm radius) with the UVpoly at a velocity of 5.21 mm/min. These results were
app
slip
h
h
- 64 -
then compared with those previously reported in [134], where multiple layers of PDMS with carbon
nanopowder (PDMS+CNP) were deposited at the same velocity. Measurements of layer thicknesses
exhibited a lower slippage for the UVpoly in glass capillaries than for the coated optical fibers, with a
𝜂app = 5 Pa∙s. As for the PDMS+CNP composite, the measurements and fitting yielded a 𝜂app = 2.7 Pa∙s
[134]. As expected from Eq. <IV.18>, thicker coatings will be less affected by the variations caused by
the apparent viscosity and hence slippage will decrease (i.e., app ). The resulting Bond numbers
for the capillaries were 0.085 for the UVpoly and 0.1 for the PDMS, respectively; as before, gravity
effects on the coating layers are minimum.
As shown above, multiple layer coatings can be readily deposited on devices ranging from the
micrometric to millimetric diameter scales. It is important to notice that the desired thickness of each
layer can be easily adjusted upon controlling the coating process velocity following the guidelines
provided by simple wire coating theory. Adjustment of the coating thickness allows for the definition
of the final diameter of micro-resonators using cylindrical elements.
IV.3 FUNCTIONAL POLYMERIC MATERIALS
A long list of different polymer based materials has been developed for optics and photonics
applications [106-108, 136]. Polymers grant a simpler processing and fabrication processes
compared to other materials. Moreover, a wide diversity of functional materials can arise from their
flexibility for hosting additional materials. As an example, PDMS is a polymer extensively used in
MEMS, electronics, optics, and biomedical applications due to its mechanical, rheological, thermal,
and optical properties. The use of PDMS in optics has grown due to its transparency over a wide
spectral range and its ease of use in replica-molds fabrication processes [137].
Incorporation of different materials into PDMS has been successfully demonstrated for the creation
of reconfigurable composites. Examples of these include the addition of azobenzenes, carbon
nanoparticles, metallic powder, etc. [107, 138]. For our experiments, light activated composites were
obtained upon mixing azobenzenes and fluorescent materials with PDMS as a host polymer matrix.
A detailed description of the mixing procedure for these composites can be found in Appendix A. The
relevant characteristics of these photoactive composites are discussed in the following sections.
IV.3.1 AZOPOLYMERS
Azopolymers are functional polymers originated from the inclusion of azobenzenes in a
polymeric matrix. Azobenzenes are chemical molecules commonly used as colorants or dyes,
although the most attractive feature of these materials for photonics is the photoisomerization
process. This can generate physical changes in the azobenzene molecules through light irradiation.
Typically, the photoisomerization process leads to the trans-cis transformation as well as to the

- 65 -
realignment of the molecules when interacting with linearly polarized light [108, 139]. These changes
originate optical anisotropy, which is of interest for the fabrication of photonic devices.
MRRs with azopolymer coatings were fabricated using Disperse Red 1 (DR1) obtained from Sigma-
Aldrich (CAS: 2872-52-8) as azobenzene. As shown in the spectrum of Figure IV-13a, the absorbance
of DR1 lies within the range of 410 – 555 nm. This azobenzene has been proved to generate
birefringence under irradiation with linearly polarized light when contained in polymeric matrices
[108, 139]. In our experiments, the concentration ratio used for the mixture of DR1 with PDMS was
of 0.1 % in weight; this composite is denoted as PDMS+DR1. Removal of DR1 clusters was done
through filtering with two syringe polytetrafluoroethylene (PTFE) filters: first a 1 m filtering stage
followed by a second stage of 0.4 m. This filtering process yielded a red-translucent composite.
Photoinduced birefringence in the azopolymer mixture was tested with an array of crossed
polarizers [139, 140]. A probe beam is launched through a film of a given thickness (d), measuring
the change in the beam intensity at the input (I0 ) and output (I ) of the sample. The probe beam used
for this experiment must be of a wavelength (λ ) where the material under study presents null
absorbance. Change in refractive index (∆n) generated in the azopolymer can be described by [139]:
1
0
sinI
nd I
<IV.19>
A 138 ± 11 m layer of PDMS+DR1 was deposited on a glass substrate and subsequently irradiated
with a semiconductor laser ( = 532 nm, 5 mW). A HeNe laser ( = 632.8 nm) was used as a probe
signal to measure the birefringence, and the change in optical power transmission through the
polarizers was measured with a silicone photodiode (S150C, Thorlabs). The change in power
transmission registered with this arrangement is shown in Figure IV-13b. Using this result, the
change in refractive index for this composite was estimated according Eq. <IV.19> yielding a result of
, which in good agreement with previous reports for similar compounds [139].
a) b)
Fig. IV - 13. PDMS+DR1 azopolymer characterization. a) Absorbance spectrum. b) Photoinduced birefringence with a laser beam of 475 nm and measured at 633 nm.
52.41 10n

- 66 -
IV.3.2 FLUORESCENT COMPOSITES
Upconversion process is an attractive feature in some materials that can be used to trigger
different effects activated by light. As an example, emission of visible light can occur in materials such
as erbium and ytterbium, owing to IR light absorption and subsequent electron transition to higher
electronic states. The radiative decay of these electrons will thus lead to the emission of photons
within the visible spectrum. Erbium and ytterbium, which are among the most popular materials
used with optical fibers, can thus radiate visible light (typically green-like) through upconversion
[142]. An improved composite to generate fluorescence in visible wavelengths under IR irradiation
is the ytterbium and erbium-doped sodium yttrium fluoride (NaYYbErF). Commercially available
NaYYbErF powder (Sigma-Aldrich, CAS: 753489-02-0) was used for doping PDMS with a weight ratio
of 1 %; this composite was labeled as PDMS+Yb. A typical fluorescence spectrum generated with this
material is shown in Figure IV-14. As seen in the figure, upon irradiation with a laser diode
( = 975 nm), the fluorescence peaks occur at wavelengths of 539.5 nm and 653.5 nm.
The PDMS+Yb composite offers the possibility to generate changes in its optical properties by means
of an optical signal, a feature desired in photonic devices. Specifically, the incorporation of PDMS+Yb
in fiber optic devices use an excitation signal with = 975 nm, and a signal with = 1550 nm can be
used as a probe beam, for instance, as a carrier for data transmission. Thus, the required optical signal
to generate fluorescence in this material can have a different wavelength than that used for signal
transmission. Both wavelengths are normally used in optical telecommunications applications.
Another possibility is the combination with other layers of different materials, where the emission
generated by the upconversion process may be absorbed to induce further changes, as occurs in
azopolymers.
Fig. IV - 14. Emission spectrum from the PDMS+Yb composite upon irradiation with a = 975 nm laser diode.

- 67 -
IV.4 MICRO-RING RESONATORS WITH FUNCTIONAL POLYMERS
Micro-ring resonators coated with layers of PDMS+Yb and a PDMS+DR1 were fabricated
using the wire coating technique described earlier. The MRRs were excited by coupling light from the
waist section of a single-mode tapered optical fiber, with a waist diameter of approximately 3.5 m,
along 1 cm section, and total length of 5.5 cm. Coupling was generated by setting the resonator
perpendicularly to the tapered fiber aiming to generate a circular-cross section for the resonances
instead other geometries (i.e., elliptical-cross sections for tilted resonators). Analysis of the MRRs
features was performed upon recording the transmission spectra with an Optical Spectrum Analyzer
(OSA, Agilent 86140B); further details of the spectra were obtained through the Fast Fourier
Transform (FFT). A broadband probe signal coming from an amplified stimulated emission (ASE)
from an erbium doped fiber amplifier (EDFA, Pritel LNHPFA-27-IO) centered at a wavelength of
1550 nm was used, which was launched into the tapered fiber. The spectral features of the polymer
coated MRRs are described in the following sections.
IV.4.1 ALL-GLASS RESONATORS
Standard single-mode silica (SiO2) fibers were used as the building blocks for the MRRs. In
these experiments the resonator is constituted only by the cylindrical-glass rod. The typical
transmission spectrum of a resonator using a bare single-mode fiber (125 ± 0.7 m diameter) is
shown in Figure IV-15a. The resonances are periodic dips with a FSR = 4.26 nm (delimited by the red
dashed-lines) and a FWHM = 0.1 nm. With the measured values and by using Eq. <IV.8>, a group
refractive index of 1.4361 was determined for the 125 m diameter fiber MRR. As seen in Figure IV-
15a, the spectrum shows multiple resonant peaks within a single period, indicating that several
resonant modes are excited in the resonator due to light penetration in the bulk material. The
response obtained was repeatable under the same coupling conditions, whereas changing the
position of the resonator or parameters of the tapered fiber resulted in similar responses but
different resonant wavelengths. The strongest resonance peak corresponds to the fundamental
mode, showing a contrast of 2 dB. For these all-glass MRRs, the registered average losses were in the
range of 1.5 – 4 dB.
Further details of the registered spectra were obtained using the FFT. In particular, the magnitude of
the FFT indicates how many periodic signals are present in the transmission spectrum, and each
point indicates the number of periods of each component. For the spectrum shown in Figure IV-15a,
the FFT shows a strong single low-order component, corresponding to the number of periodic lobes
for the fundamental mode component, shown in Figure IV-15b. Higher order components indicate
the multimodal resonances obtained in the cylindrical structure decaying in a gradual fashion.
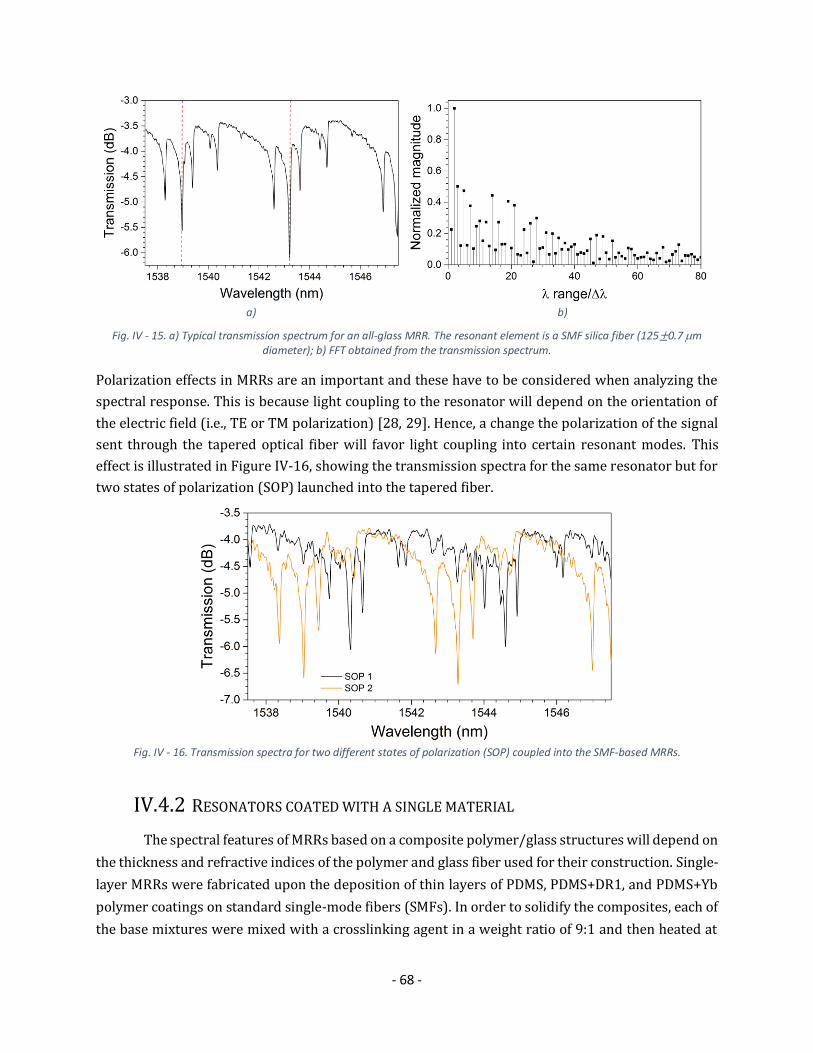
- 68 -
a) b)
Fig. IV - 15. a) Typical transmission spectrum for an all-glass MRR. The resonant element is a SMF silica fiber (125±0.7 m diameter); b) FFT obtained from the transmission spectrum.
Polarization effects in MRRs are an important and these have to be considered when analyzing the
spectral response. This is because light coupling to the resonator will depend on the orientation of
the electric field (i.e., TE or TM polarization) [28, 29]. Hence, a change the polarization of the signal
sent through the tapered optical fiber will favor light coupling into certain resonant modes. This
effect is illustrated in Figure IV-16, showing the transmission spectra for the same resonator but for
two states of polarization (SOP) launched into the tapered fiber.
Fig. IV - 16. Transmission spectra for two different states of polarization (SOP) coupled into the SMF-based MRRs.
IV.4.2 RESONATORS COATED WITH A SINGLE MATERIAL
The spectral features of MRRs based on a composite polymer/glass structures will depend on
the thickness and refractive indices of the polymer and glass fiber used for their construction. Single-
layer MRRs were fabricated upon the deposition of thin layers of PDMS, PDMS+DR1, and PDMS+Yb
polymer coatings on standard single-mode fibers (SMFs). In order to solidify the composites, each of
the base mixtures were mixed with a crosslinking agent in a weight ratio of 9:1 and then heated at

- 69 -
85°C during a period of time of 2 hours [117]. These coatings were deposited using the same coating
system described earlier (see section IV.2), using a coating velocity of 0.935 mm/min for all cases.
The resulting coating thicknesses were approximately 1.55 m and these were excited with a tapered
fiber. Obtained normalized transmission spectra and the corresponding FFT for each of these coated
resonators are shown in Figure IV-17.
Fig. IV - 17. Transmission spectra and FFT for the MRRs using single-layer coatings (1.55 m thicknesses) of: a) PDMS, b) PDMS+DR1, and c) PDMS+Yb.
Analysis of the PDMS coated resonator provides information of the effects generated only by the
polymeric matrix, which is further used to host the active materials. Since PDMS possesses a smaller
refractive index than that of silica, light confinement in this structure is similar to the case illustrated
Trasnmission spectra a) PDMS
1.0 -r-'c:....::= ----,----------;------,
0.8
0.6
OA
0.2
1538 1540 1542 1544 1546
§ b) PDMS + DRl .(ji 1 .0 .,.--''-'--'='-'--='-----------c-----,
en E 0.8 en e ~ 0.6 ~
al 0.4
.!:::! ro 0.2
E es O . O -L.-~--~--~--~-~_--.--.J Z 1538 1540 1542 1544 1546
1.0.2...:.:::";"'-.:....:.:=------------,
0.8
0.6
OA
0.2
Wavelength (nm)
(l) "O :::J
:'.:: e en ro E "O (l) N
ro E .... o Z
FFT spectra
1.0
0.8
0.4
1.0
0.8
0.6
0.4
0.2
0.0
" •
.... ,'. '.. '. .., •... : ~: . • 0° .......... •••• ~ : • • ~" . O0 • •• ~
o 20 40 60 80
1.0
0.8
0.6
0.4
0.2
0.0 o 20 40 60 80
A rangelL1A
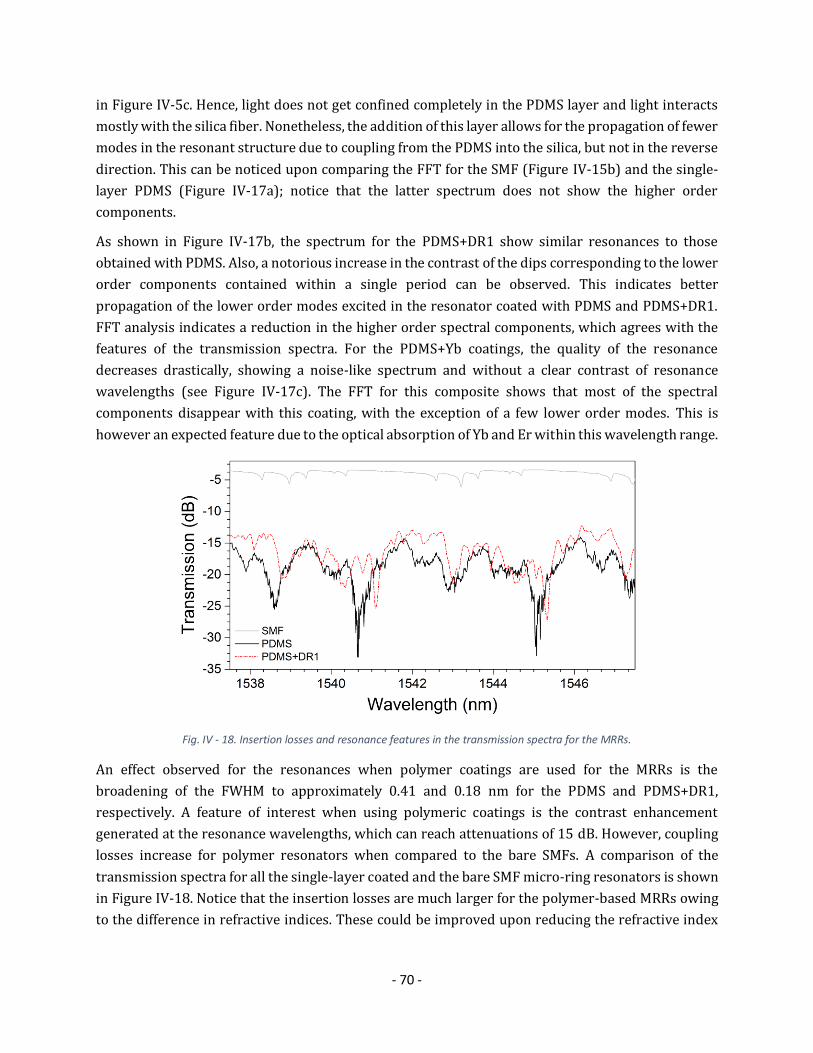
- 70 -
in Figure IV-5c. Hence, light does not get confined completely in the PDMS layer and light interacts
mostly with the silica fiber. Nonetheless, the addition of this layer allows for the propagation of fewer
modes in the resonant structure due to coupling from the PDMS into the silica, but not in the reverse
direction. This can be noticed upon comparing the FFT for the SMF (Figure IV-15b) and the single-
layer PDMS (Figure IV-17a); notice that the latter spectrum does not show the higher order
components.
As shown in Figure IV-17b, the spectrum for the PDMS+DR1 show similar resonances to those
obtained with PDMS. Also, a notorious increase in the contrast of the dips corresponding to the lower
order components contained within a single period can be observed. This indicates better
propagation of the lower order modes excited in the resonator coated with PDMS and PDMS+DR1.
FFT analysis indicates a reduction in the higher order spectral components, which agrees with the
features of the transmission spectra. For the PDMS+Yb coatings, the quality of the resonance
decreases drastically, showing a noise-like spectrum and without a clear contrast of resonance
wavelengths (see Figure IV-17c). The FFT for this composite shows that most of the spectral
components disappear with this coating, with the exception of a few lower order modes. This is
however an expected feature due to the optical absorption of Yb and Er within this wavelength range.
Fig. IV - 18. Insertion losses and resonance features in the transmission spectra for the MRRs.
An effect observed for the resonances when polymer coatings are used for the MRRs is the
broadening of the FWHM to approximately 0.41 and 0.18 nm for the PDMS and PDMS+DR1,
respectively. A feature of interest when using polymeric coatings is the contrast enhancement
generated at the resonance wavelengths, which can reach attenuations of 15 dB. However, coupling
losses increase for polymer resonators when compared to the bare SMFs. A comparison of the
transmission spectra for all the single-layer coated and the bare SMF micro-ring resonators is shown
in Figure IV-18. Notice that the insertion losses are much larger for the polymer-based MRRs owing
to the difference in refractive indices. These could be improved upon reducing the refractive index
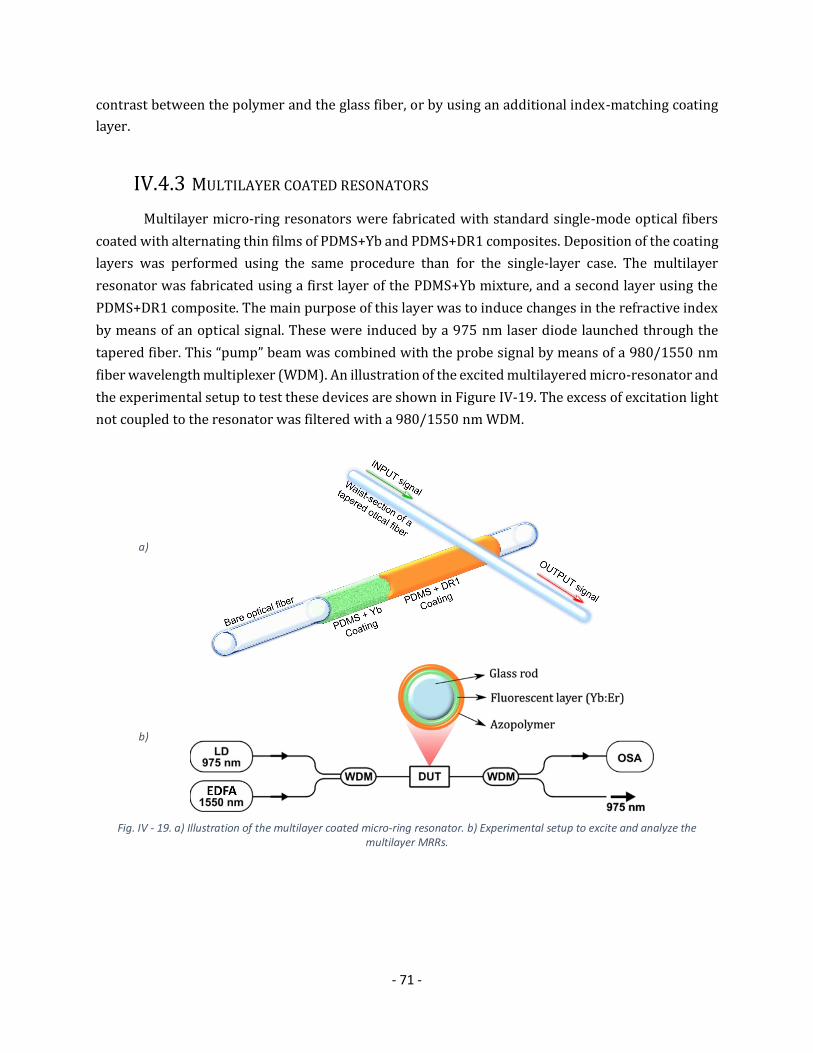
- 71 -
contrast between the polymer and the glass fiber, or by using an additional index-matching coating
layer.
IV.4.3 MULTILAYER COATED RESONATORS
Multilayer micro-ring resonators were fabricated with standard single-mode optical fibers
coated with alternating thin films of PDMS+Yb and PDMS+DR1 composites. Deposition of the coating
layers was performed using the same procedure than for the single-layer case. The multilayer
resonator was fabricated using a first layer of the PDMS+Yb mixture, and a second layer using the
PDMS+DR1 composite. The main purpose of this layer was to induce changes in the refractive index
by means of an optical signal. These were induced by a 975 nm laser diode launched through the
tapered fiber. This “pump” beam was combined with the probe signal by means of a 980/1550 nm
fiber wavelength multiplexer (WDM). An illustration of the excited multilayered micro-resonator and
the experimental setup to test these devices are shown in Figure IV-19. The excess of excitation light
not coupled to the resonator was filtered with a 980/1550 nm WDM.
a)
b)
Fig. IV - 19. a) Illustration of the multilayer coated micro-ring resonator. b) Experimental setup to excite and analyze the multilayer MRRs.

- 72 -
Fig. IV - 20. Transmission spectra of the multilayer MRRs coated with photoactive materials.
The transmission spectrum of the device and the effects generated when the pump signal is launched
are shown in Figure IV-20. For this arrangement the pump light is absorbed mostly by the PDMS+Yb
layer and the resonance features are only shifted towards longer wavelengths. Notice that for this
configuration, resonance occurs at outermost polymer layer, which incorporates the azobenzene.
Excitation of the PDMS+DR1 layer is realized by the green luminescence generated in the PDMS+Yb
layer. This is produced through upconversion effects when this polymer layer is pumped with the
975 nm signal. The green fluorescence signal is thus absorbed by the DR1 molecules and an
additional change in the refractive index is therefore obtained. Larger wavelength shifts were
observed upon increasing the power of the 975 nm pump laser. This is due to the infrared light
absorption of the PDMS+Yb layer and reabsorption of the green light by the PDMS+DR1, generating
a continuous change in the refractive index. This effect will cease once the saturation point of the Yb
and Er is reached. In our experiments, we did not observed any saturation effects. Finally, upon
turning the pump signal off, the original spectral features are readily obtained.
Fig. IV - 21. Wavelength peak shift upon 975 nm laser signal excitation in different polymer coated micro-ring resonators.

- 73 -
When using only PDMS as coating material, a slight displacement is gradually induced until a
saturation point is reached. A similar response is generated when DR1 is added into the PDMS matrix,
indicating no interaction of infrared light with the azobenzene. In contrast, for the PDMS+Yb
resonators (not included in the plot), absorption of the 975 nm laser signal induces a larger
modification in the refractive index. However, this leads to a distortion in the transmission spectra
and the resonance peaks are lost. Notice that for the multilayer arrangement, no saturation point was
observed and a maximum wavelength shift of 1.6 nm was registered. The addition of a second layer
(PDMS+DR1) thus contributes to an enhanced tuning response, without distorting the resonance
effects.
IV.5 DEVICE PACKAGING
As exposed earlier, applications of wavelength tunable MRRs devices include sensor
development and filtering for signal conditioning. An important factor to be addressed for these
devices resides in the packaging procedure. Proper packaging of MRRs is a challenge that commonly
limits their use in real-life applications [30, 142]. A simple way to alleviate this problem is to
encapsulate the devices in a polymeric matrix. This approach allows ensuring a fixed position of the
optical elements composing the MRR, thus yielding a stable spectral response. PDMS has proven
suitable for packaging and fabricating optical elements with low losses. Therefore, packaging may
contemplate entirely or partially embedding the MRRs in PDMS [143]. An example of the multilayer
MRRs enclosed in PDMS is shown in Figure IV-22.
Fig. IV - 22. Illustration of a multilayer coated MRR packed in PDMS
It is important to recognize that the packaging process modifies the surrounding medium of the MRR
and thus changes the number of resonant modes. This effect is illustrated in Figure IV-23, showing
the transmission spectra for a MRR before and after being embedded in a PDMS housing. An
improvement in the total losses is observed due to the reduction of the refractive index contrast of
the materials. Notice however that the contrast in the resonant dips decreases; hence, optimization
in the refractive index difference is required in order to obtain adequate spectral features for a
specific application.

- 74 -
Fig. IV - 23. Pure silica rod used as micro-resonator packed entirely in PDMS.
The use of multiple polymer layers for the construction of micro-ring resonators clearly represents
an attractive option the fabrication of low-cost devices. Their ease of fabrication and the possibility
to incorporate different materials provide a versatile platform for developing photonic devices.

- 75 -
CHAPTER V: CONCLUSIONS
All-fiber photonic lanterns formed with multiple fibers were fabricated exhibiting the
capability of produce diverse light patterns at the output in a controlled fashion. The fabrication
process followed to obtain adequate devices was fully described. Also, the relevant parameters and
aspects needed for the realization of these devices were also defined. Modal selectivity granted
independent excitation of linearly polarized fiber modes through separate input fibers. This feature
was achieved by a correct selection and positioning of the optical fibers during the assembly process
of these devices. For the arrangements and methodology followed in this work, it was possible to
address the first nine LP fiber modes without additional requirements other than a proper design of
mode-selective photonic lanterns.
Fabrication of PLs able to generate a larger number of modes was accomplished by using
microstructured preforms specifically tailored for this purpose. These preforms simplified the
fabrication process of the PLs, resulting in a straightforward and repeatable method. Additionally,
the use of this approach allows for overcoming the intrinsic fabrication complexity when scaling to a
larger number of fibers. Nonetheless, there is still room for improvements in the preforms used for
fabrication of these devices since novel designs may lead to generate specific light patterns, devices
with lower losses, and compatibility with other multimode fibers.
Integration of the PLs to fiber systems was tested upon splicing them to fibers supporting multiple
modes (i.e., few-mode fibers, FMFs). Transmission of the generated mode profiles through these
fibers was verified further showing low-coupling losses. The use of the PLs as MUX/DEMUX devices
showed to be a viable application, directly compatibility with FMFs that have been developed for the
upcoming generation of fiber optics telecommunications systems. Additional information obtained
from this study corroborated the modal selectivity of these devices, as observed from the output
mode profiles. Hence, a proper design of photonic lanterns can allow for a correct match with FMFs
and successful transmission of each particular light pattern.
Careful analysis of the intensity distributions at the output of the mode-selective PLs revealed
remarkable mode purity values. Complementary examination of MSPLs demonstrated that following
the correct fabrication procedure, it is possible to obtain operation in a broadband wavelength range,
preserving the same light intensity distribution. This feature proved the suitability of these devices
for multiple applications aside the telecommunications area. Therefore, a significant number of
research areas using complex devices to generate specific light patterns could be simplified with the
use of passive and compact devices, such as mode-selective PLs.
A simple methodology to fabricate reconfigurable micro-ring resonators was also proposed in this
work. This may offer a viable option for developing reconfigurable devices with potential use in

- 76 -
sensing applications. The use of polymeric materials as coatings allowed for easily incorporate
different compounds. Such a capability offers the possibility to include different functionalities in a
single device, and thus address diverse needs. Furthermore, the incorporation of multiple layers of
material serves as a mechanism to control light confinement in these devices. Therefore, the
interaction of light with multiple layered materials can be adjusted upon the appropriate choice of
refractive indices. As shown in this work, control of the coating process is key feature for successfully
producing resonators with a specific thickness. In this sense, the coating system used for this purpose
offered the necessary means for obtaining well defined thicknesses of polymer coatings by varying
the speed of the coating process.
The fabrication of polymeric multilayer resonators is an attractive proposal as it employs low-cost
materials, with high commercial availability and ease of fabrication. Adjustments in the coating
thickness allows for the definition of the final diameter of the micro-resonators, which in turn defines
the resonance conditions. Another attractive aspect of this method is the use of standard cylindrical
elements as a building block for the micro-resonators, avoiding the need of specialized substrates or
materials, typically requiring additional processes to fabricate resonant structures.
Incorporation of light-activated materials prevents the use of electrical signals to activate specific
functions of the materials used as coatings for the resonators. On this basis, activation and monitoring
of the proposed devices can be achieved through a single optical fiber. As an example, devices using
a layer of photoluminiscent material, in combination with a photoactivated material, yielded a device
capable of tuning its spectral response by means of an optical signal.
The achievements and progress presented in this work comprise contributions on the area of fiber
optic devices fabrication. The most relevant aspects of the fabricated devices can be summarized as:
The relevant fabrication parameters to obtain mode-selective photonic lanterns, able to
excite several number of LP fiber modes, were defined.
A new method to fabricate micro-ring resonators, based on multiple coatings of
reconfigurable polymeric materials, was demonstrated.
Future work on these devices may address improvements in photonic lantern design, aiming at
obtaining LP modes of a superior quality. Further efforts are also required in order to obtain direct
compatibility between the PLs and the FMFs, in particular for spatial division multiplexing
applications. As for the MRRs, the next step is their use in a specific application; this will define the
number of layers, coating materials, and thicknesses required to achieve the desired performance.
Evidently, packaging must be improved on both devices in order to grant stability in their spectral
responses as well as robustness. This will lead to rugged devices which may find direct application
in a wide variety of photonic related areas.

- 77 -
REFERENCES
[1] B. Saleh y M. Teich; “Fundamentals of Photonics,” Wiley Interscience, 2nd Edition, 2007.
[2] Katsunari Okamoto, “Fundamentals of Optical Waveguides,” Academic Press, 2nd Edition, 2005.
[3] S. Sudho and K. Okamoto, “New Photonics Technologies for The Information Age: The Dream of Ubiquitous Services,” Artech House optoelectronics library, 2006.
[4] E. Udd, “Fibre Optic Sensors,” Wiley Interscience, 2002.
[5] Chen Sun,Mark T. Wade, Yunsup Lee, Jason S. Orcutt, Luca Alloatti, Michael S. Georgas,Andrew S. Waterman, Jeffrey M. Shainline, Rimas R. Avizienis, Sen Lin, Benjamin R. Moss, Rajesh Kumar, Fabio Pavanello, Amir H. Atabaki, Henry M. Cook, Albert J. Ou, Jonathan C. Leu, Yu-Hsin Chen, Krste Asanović, Rajeev J. Ram, Miloš A. Popović & Vladimir M. Stojanović, “Single-chip microprocessor that communicates directly using light,” Nature 528, pp. 534–538, 2015.
[6] Jeffrey J. Fielda, Keith A. Wernsing, Scott R. Domingue, Alyssa M. Allende Motz, Keith F. DeLuca, Dean H. Levi, Jennifer G. DeLuca, Michael D. Young, Jeff A. Squier, and Randy A. Bartels, “Superresolved multiphoton microscopy with spatial frequency-modulated imaging,” PNAS, vol. 113 No. 24, 2016
[7] Meng-Tsen Ke, Yasuhiro Nakai, Satoshi Fujimoto, Rie Takayama, Shuhei Yoshida, Tomoya S. Kitajima, Makoto Sato, Takeshi Imai, “Super-Resolution Mapping of Neuronal Circuitry With an Index-Optimized Clearing Agent,“ Cell Reports, Volume 14, Issue 11, pp. 2718 – 2732, 2016.
[8] Paras N. Prasad, “Introduction to Biophotonics,” J. Wiley & Sons, Inc, 2003.
[9] Maria Dienerowitz, Michael Mazilu, and Kishan Dholakia, “Optical manipulation of nanoparticles: a review,” Journal of Nanophotonics, Vol. 2, 021875, 2008.
[10] J. Bland-Hawthorn, "Astrophotonics: The Future of Astronomical Instrumentation," in CLEO: 2015, OSA Technical Digest (online), paper STu4L.1, 2015.
[11] P. J. Winzer, “Spatial multiplexing: the next frontier in network capacity scaling,” in 39th European Conference and Exhibition on Optical Communication (ECOC), pp. 372–374, 2013.
[12] D. J. Richardson, J. M. Fini, and L. E. Nelson, Space-division multiplexing in optical fibres,” Nat. Photonics 7, 354, 2013.
[13] Guifang Li, Neng Bai, Ningbo Zhao, and Cen Xia, "Space-division multiplexing: the next frontier in optical communication," Adv. Opt. Photon. 6, pp. 413-487, 2014.
[14] Roland Ryf, Sebastian Randel, Alan H. Gnauck, Cristian Bolle, Alberto Sierra, Sami Mumtaz, Mina Esmaeelpour, Ellsworth C. Burrows, René-Jean Essiambre, Peter J. Winzer, David W. Peckham, Alan H. McCurdy, and Robert Lingle, "Mode-Division Multiplexing Over 96 km of Few-Mode Fiber Using Coherent 6 × 6 MIMO Processing," J. Lightwave Technol. 30, pp. 521-531, 2012.
[15] H. Chen, V. Sleiffer, B. Snyder, M. Kuschnerov, R. van Uden, Y. Jung, C. M. Okonkwo, O. Raz, P. O’Brien, H. de Waardt, and T. Koonen, “Demonstration of a Photonic Integrated Mode Coupler With MDM and WDM Transmission,” IEEE Photon. Technol. Lett. 25(21), pp. 2039–2042, 2013.
[16] Andrew Forbes, Angela Dudley, and Melanie McLaren, "Creation and detection of optical modes with spatial light modulators," Adv. Opt. Photon. 8, pp. 200-227, 2016.
[17] R. G. H. van Uden, R. Amezcua-Correa, E. Antonio-Lopez, F. M. Huijskens, C. Xia, G. Li, A. Schülzgen, H. de Waardt, A. M. J. Koonen, and C. M. Okonkwo, “Ultra-high-density spatial division multiplexing with a few-mode multicore fibre,” Nat. Photonics 8, 865, 2014.
- 78 -
[18] Benyuan Zhu, John M. Fini, Man F. Yan, Xiang Liu, S. Chandrasekhar, Thierry F. Taunay, Michael Fishteyn, Eric M. Monberg, and Frank V. Dimarcello, "High-Capacity Space-Division-Multiplexed DWDM Transmissions Using Multicore Fiber," J. Lightwave Technol. 30, pp. 486-492, 2012.
[19] R. Ryf, S. Randel, N. K. Fontaine, M. Montoliu, E. Burrows, S. Chandrasekhar, A. H. Gnauck, C. Xie, R. Essiambre, P. Winzer, R. Delbue, P. Pupalaikis, A. Sureka, Y. Sun, L. Gruner-Nielsen, R. V. Jensen, and R. Lingle, "32-bit/s/Hz Spectral Efficiency WDM Transmission over 177-km Few-Mode Fiber," in Optical Fiber Communication Conference/National Fiber Optic Engineers Conference 2013, OSA Technical Digest (online) (Optical Society of America, 2013), paper PDP5A.1.
[20] Haoshuo Chen, Roy van Uden, Chigo Okonkwo, and Ton Koonen, "Compact spatial multiplexers for mode division multiplexing," Opt. Express 22, pp. 31582-31594, 2014.
[21] Jeffrey B. Driscoll, Richard R. Grote, Brian Souhan, Jerry I. Dadap, Ming Lu, and Richard M. Osgood, "Asymmetric Y junctions in silicon waveguides for on-chip mode-division multiplexing," Opt. Lett. 38, pp. 1854-1856, 2013.
[22] Liang Fang and Hongzhi Jia, "Mode add/drop multiplexers of LP02 and LP03 modes with two parallel combinative long-period fiber gratings," Opt. Express 22, pp. 11488-11497, 2014.
[23] T. A. Birks, I. Gris-Sánchez, S. Yerolatsitis, S. G. Leon-Saval, and R. R. Thomson, "The photonic lantern," Adv. Opt. Photon. 7, pp. 107-167, 2015.
[24] Jiangang Zhu, Şahin Kaya Özdemir, Lina He, Da-Ren Chen, and Lan Yang, "Single virus and nanoparticle size spectrometry by whispering-gallery-mode microcavities," Opt. Express 19, pp. 16195-16206, 2011.
[25] Carol E. Soteropulos, Kevin M. Zurick, Matthew T. Bernards, and Heather K. Hunt, “Tailoring the Protein Adsorption Properties of Whispering Gallery Mode Optical Biosensors,” Langmuir 28 (44), pp. 15743–15750, 2012
[26] Carlos Moreno-Hernández, D. Monzón-Hernández, Joel Villatoro, “Contactless optical fiber refractive index sensor for liquid and solid samples,” Sixth European Workshop on Optical Fibre Sensors, paper 99161A, 2016.
[27] L. Pavesi and G. Guillot, “Optical Interconnects - the silicon approach,” Springer-Verlag, Heidelberg, 2006.
[28] D.G. Rabus, “Integrated Ring Resonators: The Compendium,” Springer Series in Optical Sciences, 2007.
[29] John Heebner, Rohit Grover, and Tarek Ibrahim, “OpticalMicroresonators: Theory, Fabrication, and Applications,” Springer Series in Optical Sciences, 2008.
[30] Ioannis Chremmos, Otto Schwelb, and Nikolaos Uzunoglu, “Photonic Microresonator Research and Applications, Springer Series in Optical Sciences, 2010.
[31] Matthew R. Foreman, Jon D. Swaim, and Frank Vollmer, "Whispering gallery mode sensors," Adv. Opt. Photon. 7, pp. 168-240, 2015.
[32] Limin Xiao and T. A. Birks, "High finesse microfiber knot resonators made from double-ended tapered fibers," Opt. Lett. 36, pp. 1098-1100, 2011.
[33] M. Sumetsky, Y. Dulashko, J. M. Fini, A. Hale, and D. J. DiGiovanni, "The Microfiber Loop Resonator: Theory, Experiment, and Application," J. Lightwave Technol. 24, pp. 242-250, 2006.
[34] Kyriaki Kosma, Gianluigi Zito, Kay Schuster, and Stavros Pissadakis, "Whispering gallery mode microsphere resonator integrated inside a microstructured optical fiber," Opt. Lett. 38, pp. 1301-1303, 2013.
[35] Vanessa Zamora, Antonio Díez, Miguel V. Andrés, and Benito Gimeno, "Refractometric sensor based on whispering-gallery modes of thin capillaries," Opt. Express 15, pp. 12011-12016, 2007.

- 79 -
[36] Ming Ding, Ganapathy Senthil Murugan, Gilberto Brambilla, and Michalis N. Zervas, “Whispering gallery mode selection in optical bottle microresonators,” Appl. Phys. Lett. 100, 081108, 2012.
[37] J. D. Suter, I. M. White, H. Zhu, H. Shi, C. W. Caldwell, and X. Fan, “Label-free quantitative DNA detection using the liquid core optical ringresonator,” Biosens. Bioelectron. 23, pp.1003–1009, 2008.
[38] Anna Boleininger, Thomas Lake, Sophia Hami and Claire Vallance, “Whispering Gallery Modes in Standard Optical Fibres for Fibre Profiling Measurements and Sensing of Unlabelled Chemical Species,” Sensors 2010, 10(3), 2010.
[39] Kevin D. Heylman, Kassandra A. Knapper, and Randall H. Goldsmith, “Photothermal Microscopy of Nonluminescent Single Particles Enabled by Optical Microresonators,” J. Phys. Chem. Lett., 5 (11), pp. 1917–1923, 2014.
[40] Jonathan M. Ward, Yong Yang & Síle Nic Chormaic, “Glass-on-Glass Fabrication of Bottle-Shaped Tunable Microlasers and their Applications,” Scientific Reports 6, 25152, 2016.
[41] John A. Buck, “Fundamentals of optical fibers,” Wiley series in pure and applied optics, 1995.
[42] Frank Träger, “Handbook of Lasers and Optics,” Springer, 2nd Edition, 2012.
[43] C. Vassallo, “Optical Waveguide Concepts”, Elsevier Science Publishers B.V., 1991.
[44] R. Olshansky, “Propagation in Glass Optical Waveguides,” Rev. Modern Phys., 51:2, pp. 341–367, 1979.
[45] J. Gowar, “Optical Communication Systems,” Prentice Hall International, Inc., 1984.
[46] S. Kawakami and H. Tanji, “Evolution of power distribution in graded-index fibres,” Electr. lett., 19(3), pp. 100–102, 1983.
[47] Ming-Jun Li and Daniel A. Nolan, "Optical Transmission Fiber Design Evolution," J. Lightwave Technol. 26, pp. 1079-1092, 2008.
[48] Hirokazu Kubota, Toshio Morioka, “Few-mode optical fiber for mode-division multiplexing,” Optical Fiber Technology 17, pp. 490–494, 2011.
[49] Pierre Sillard, Marianne Bigot-Astruc, and Denis Molin, "Few-Mode Fibers for Mode-Division-Multiplexed Systems," J. Lightwave Technol. 32, pp. 2824-2829, 2014.
[50] John van Weerdenburg, Amado Velazquez-Benitez, Roy van Uden, Pierre Sillard, Denis Molin, Adrian Amezcua-Correa, Enrique Antonio-Lopez, Maxim Kuschnerov, Frans Huijskens, Hugo de Waardt, Ton Koonen, Rodrigo Amezcua-Correa, and Chigo Okonkwo, "10 Spatial mode transmission using low differential mode delay 6-LP fiber using all-fiber photonic lanterns," Opt. Express 23, pp. 24759-24769, 2015.
[51] L. Grüner-Nielsen, Y. Sun, R. V. S. Jensen, J. W. Nicholson, and R. Lingle, "Recent Advances in Low DGD Few-mode Fibre Design, Fabrication, Characterization and Experiments," in Optical Fiber Communication Conference, OSA Technical Digest (online) (Optical Society of America), paper M2C.3, 2015.
[52] P. Sillard, D. Molin, M. Bigot-Astruc, H. Maerten, D. van Ras, and F. Achten, "Low-DMGD 6-LP-Mode Fiber," in Optical Fiber Communication Conference, OSA Technical Digest (online) (Optical Society of America), paper M3F.2, 2014.
[53] Pierre Sillard, Denis Molin, Marianne Bigot-Astruc, Koen De Jongh, Frank Achten, Amado M. Velázquez-Benítez, Rodrigo Amezcua-Correa, and Chigo M. Okonkwo, "Low-Differential-Mode-Group-Delay 9-LP-Mode Fiber," J. Lightwave Technol. 34, pp. 425-430, 2016.
[54] Timothy A. Birks and Youwei W. Li,” The Shape of Fiber Tapers,” J. Lightwave Technol. 10. No. 4, 1992.
[55] J.D. Love, W.M. Henry, W.J. Stewart, R.J. Black, S. Lacroix, and F. Gonthier, “Tapered single-mode fibres and devices Part 1: Adiabaticity criteria,” IEE PROCEEDINGS-J, Vol. 138, No. 5, 1991.

- 80 -
[56] Suzanne Lacroix, François Gonthier, and Jacques Bures, "Modeling of symmetric 2 × 2 fused-fiber couplers," Appl. Opt. 33, pp. 8361-8369, 1994.
[57] Bishnu P. Pal, Partha Roy Chaudhuri, M. R. Shenoy, “Fabrication and Modeling of Fused Biconical Tapered Fiber Couplers,” Fiber and Integrated Optics, 22, pp. 97–117, 2003.
[58] Chams Baker and Martin Rochette, "Highly nonlinear hybrid AsSe-PMMA microtapers," Opt. Express 18, pp. 12391-12398, 2010.
[59] Suzanne Lacroix, François Gonthier, and Jacques Bures, "All-fiber wavelength filter from successive biconical tapers," Opt. Lett. 11, pp. 671-673, 1986.
[60] Jingyi Lou, Yipei Wang, and Limin, “Microfiber Optical Sensors: A Review,” Sensors, 14, pp. 5823-5844, 2014.
[61] Gilberto Brambilla, Fei Xu, Peter Horak, Yongmin Jung, Fumihito Koizumi, Neil P. Sessions, Elena Koukharenko, Xian Feng, Ganapathy S. Murugan, James S. Wilkinson, and David J. Richardson, "Optical fiber nanowires and microwires: fabrication and applications," Adv. Opt. Photon. 1, pp. 107-161, 2009.
[62] Tong Rand Ismaeel, Timothy Lee, Bernard Oduro, Yongmin Jung, and Gilberto Brambilla, "All-fiber fused directional coupler for highly efficient spatial mode conversion," Opt. Express 22, pp. 11610-11619, 2014.
[63] Chams Baker and Martin Rochette, "A generalized heat-brush approach for precise control of the waist profile in fiber tapers," Opt. Mater. Express 1, pp. 1065-1076, 2011.
[64] S. Pricking and H. Giessen, "Tapering fibers with complex shape," Opt. Express 18, pp. 3426-3437, 2010.
[65] K.A. Stasiewicz, R. Krajewski, L.R. Jaroszewicz, M. Kujawińska, R. Świłło, “Influence of tapering process on changes of optical fiber refractive index distribution along a structure,” Opto-Electronics Review 18:102, 2010.
[66] Cheng-Ling Lee, Kuo-Hsiang Lin, Nan-Kuang Chen, “Analysis of optical properties of fundamental-mode in waveguide tapered fibers,” Microelectronics Reliability 50, pp. 726–729, 2010.
[67] S. W. Haruna, K. S. Lim, C. K. Tio, K. Dimyati, H. Ahmad, “Theoretical analysis and fabrication of tapered fiber,” Optik 124, pp. 538–543, 2013.
[68] R. J. Black, R. Bourbonnais, “Core-mode cutoff for finite-cladding lightguides,” IEE Proceedings J – Optoelectronics, Vol. 133, Issue 6, pp. 377 – 384, 1986.
[69] Alexandre Felipe, Guilherme Espíndola, Hypolito J. Kalinowski, José A. S. Lima, and Aleksander S. Paterno, "Stepwise fabrication of arbitrary fiber optic tapers," Opt. Express 20, pp. 19893-19904, 2012.
[70] Jacques Bures and René Ghosh, "Power density of the evanescent field in the vicinity of a tapered fiber," J. Opt. Soc. Am. A 16, pp. 1992-1996, 1999.
[71] L. C. Ozcan, V. Treanton, F. Guay, and R. Kashyap, “Highly symmetric optical fiber tapers fabricated with a CO2 laser,” Photon. Technol. Lett. 19, pp. 656–658, 2007.
[72] Oh, S. T., Han, W. T., Paek, U. C. and Chung, Y., Azimuthally symmetric long-period fiber gratings fabricated with CO2 laser. Microw. Opt. Technol. Lett., 41, pp. 188–190, 2004.
[73] Jonathan M. Ward, Danny G. O’Shea, Brian J. Shortt, Michael J. Morrissey, Kieran Deasy, and Síle G. Nic Chormaic, “Heat-and-pull rig for fiber taper fabrication,” Rev. Sci. Instrum. 77, 083105, 2006.
[74] James N. McMullin, "The ABCD matrix in graded index tapers used for beam expansion and compression," Appl. Opt. 28, pp. 1298-1304, 1989.
[75] Cen Xia, Neng Bai, Ibrahim Ozdur, Xiang Zhou, and Guifang Li, "Supermodes for optical transmission," Opt. Express 19, pp. 16653-16664, 2011.

- 81 -
[76] Haoshuo Chen, Nicolas K. Fontaine, Roland Ryf, Binbin Guan, S. J. Ben Yoo, and Ton (A. M. J.) Koonen, "Design Constraints of Photonic-Lantern Spatial Multiplexer Based on Laser-Inscribed 3-D Waveguide Technology," J. Lightwave Technol. 33, pp. 1147-1154, 2015.
[77] P. N. Moar, S. T. Huntington, J. Katsifolis, L. W. Cahill, A. Roberts and K. A. Nugent, “Fabrication, modeling, and direct evanescent field measurement of tapered optical fiber sensors,” J. Appl. Phys. 85, 3395, 1999.
[78] Sergio G. Leon-Saval, Alexander Argyros, and Joss Bland-Hawthorn, "Photonic lanterns: a study of light propagation in multimode to single-mode converters," Opt. Express 18, pp. 8430-8439, 2010.
[79] S. G. Leon-Saval, T. A. Birks, J. Bland-Hawthorn, and M. Englund, "Multimode fiber devices with single-mode performance," Opt. Lett. 30, pp. 2545-2547, 2005.
[80] Sergio G. Leon-Saval, Christopher H. Betters, and Joss Bland-Hawthorn, “The Photonic TIGER: a multicore fiber-fed spectrograph,” Proc. SPIE 8450, Modern Technologies in Space- and Ground-based Telescopes and Instrumentation II, 84501K, 2012.
[81] Danny Noordegraaf, Peter M. W. Skovgaard, Martin D. Nielsen, and Joss Bland-Hawthorn, "Efficient multi-mode to single-mode coupling in a photonic lantern," Opt. Express 17, pp. 1988-1994, 2009.
[82] Hai-Jiao Yu, Qi Yan, Zong-Jun Huang, He Tian, Yu Jiang, Yong-Jun Liu, Jian-Zhong Zhang and Wei-Min Sun, “Photonic lantern with multimode fibers embedded,” Research in Astronomy and Astrophysics, Vol. 14 No. 8, pp. 1046–1054, 2014.
[83] S. Yerolatsitis, I. Gris-Sánchez, and T. A. Birks, "Adiabatically-tapered fiber mode multiplexers," Opt. Express 22, pp. 608-617, 2014.
[84] R. Ryf, N. K. Fontaine, and R.-J. Essiambre, “Spot-Based Mode Couplers for Mode-Multiplexed Transmission in Few-Mode Fiber,” IEEE Photon. Technol. Lett. 24(21), pp. 1973–1976, 2012.
[85] Nicolas K. Fontaine, Roland Ryf, Joss Bland-Hawthorn, and Sergio G. Leon-Saval, "Geometric requirements for photonic lanterns in space division multiplexing," Opt. Express 20, pp. 27123-27132, 2012.
[86] Sergio G. Leon-Saval, Nicolas K. Fontaine, Joel R. Salazar-Gil, Burcu Ercan, Roland Ryf, and Joss Bland-Hawthorn, "Mode-selective photonic lanterns for space-division multiplexing," Opt. Express 22, pp. 1036-1044, 2014.
[87] N. K. Fontaine, S. G. Leon-Saval, R. Ryf, J. R. Salazar-Gil, B. Ercan, and J. Bland-Hawthorn, “Mode-Selective Dissimilar Fiber Photonic-Lantern Spatial Multiplexers for Few-Mode Fiber,” in 39th European Conference and Exposition on Optical Communications, OSA Technical Digest (CD) (Optical Society of America), paper PD1.C.3, 2013.
[88] A. M. Velazquez-Benitez, J. C. Alvarado, G. Lopez-Galmiche, J. E. Antonio-Lopez, J. Hernández-Cordero, J. Sanchez-Mondragon, P. Sillard, C. M. Okonkwo, and R. Amezcua-Correa, "Six mode selective fiber optic spatial multiplexer," Opt. Lett. 40, pp. 1663-1666, 2015.
[89] Bin Huang, Nicolas K. Fontaine, Roland Ryf, Binbin Guan, Sergio G. Leon-Saval, R. Shubochkin, Y. Sun, R. Lingle, and Guifang Li, "All-fibre mode-group-selective photonic lantern using graded-index multimode fibres," Opt. Express 23, pp. 224-234, 2015.
[90] (Oct., 2016). LZM-100 LAZERMaster™ Laser Splicing System [Online]. https://www.aflglobal.com/Products/Fusion-Splicing/Specialty-Fusion-Splicing-Equipment/Splicers/LAZERMaster-LZM-100-Laser-Splicing-System.aspx
[91] William Klimowych, “Annular Heating of Optical Fiber with a CO2 Laser Using Reflective Axicon Elements,” White Paper, AFL, 2014.
[92] A. Velázquez-Benítez, J. Antonio-López, J. Alvarado-Zacarías, G. Lopez-Galmiche, P. Sillard, D. van Ras, et al., "Scaling the Fabrication of Higher Order Photonic Lanterns Using Microstructured Preforms," European Conference on Optical Communication (ECOC), Valencia, Spain, paper Tu.3.3.2, 2015.

- 82 -
[93] J. Bland-Hawthorn, S.C. Ellis, S.G. Leon-Saval, R. Haynes, M.M. Roth, H.-G. Löhmannsröben, A.J. Horton, J.-G. Cuby, T.A. Birks, J.S. Lawrence, P. Gillingham, S.D. Ryder & C. Trinh, "A complex multi-notch astronomical filter to suppress the bright infrared sky," Nature Communications 2, Article number:581, 2011.
[94] Robert Olshansky, "Mode Coupling Effects in Graded-Index Optical Fibres," Appl. Opt. 14, pp. 935-945, 1975.
[95] P. Sillard, M. Astruc, D. Boivin, H. Maerten, and L. Provost, "Few-Mode Fiber for Uncoupled Mode-Division Multiplexing Transmissions," in 37th European Conference and Exposition on Optical Communications, OSA Technical Digest (CD) (Optical Society of America), paper Tu.5.LeCervin.7, 2011.
[96] P. Sillard, "Few-Mode Fibers for Space Division Multiplexing," in Optical Fiber Communication Conference, OSA Technical Digest (online) (Optical Society of America), paper Th1J.1, 2016.
[97] Amy Van Newkirk, J. E. Antonio-Lopez, Amado Velazquez-Benitez, Jacques Albert, Rodrigo Amezcua-Correa, and Axel Schülzgen, "Bending sensor combining multicore fiber with a mode-selective photonic lantern," Opt. Lett. 40, pp. 5188-5191, 2015.
[98] Yi Weng, Ezra Ip, Zhongqi Pan, and Ting Wang, “Advanced Spatial-Division Multiplexed Measurement Systems Propositions—From Telecommunication to Sensing Applications: A Review,” Sensors, Vol. 16, Iss. 9, p. 1387, 2016.
[99] Keang-Po Ho and Joseph M. Kahn, "Mode-dependent loss and gain: statistics and effect on mode-division multiplexing," Opt. Express 19, pp. 16612-16635, 2011.
[100] N. K. Fontaine, R. Ryf, M. A. Mestre, B. Guan, X. Palou, S. Randel, Y. Sun, L. Gruner-Nielsen, R. V. Jensen, and R. Lingle, "Characterization of Space-Division Multiplexing Systems using a Swept-Wavelength Interferometer," in Optical Fiber Communication Conference/National Fiber Optic Engineers Conference 2013, OSA Technical Digest (online) (Optical Society of America), paper OW1K.2, 2013.
[101] Joel Carpenter, Benjamin J. Eggleton, and Jochen Schröder, "110x110 optical mode transfer matrix inversion," Opt. Express 22, pp. 96-101, 2014.
[102] Raphael Dahan, Leopoldo L. Martin, and Tal Carmon, "Droplet optomechanics," Optica 3, pp. 175-178, 2016.
[103] Bruce A. Block, Todd R. Younkin, Paul S. Davids, Miriam R. Reshotko, Peter Chang, Brent M. Polishak, Su Huang, Jingdong Luo, and Alex K. Y. Jen, "Electro-optic polymer cladding ring resonator modulators," Opt. Express 16, pp. 18326-18333, 2008.
[104] Andrea L. Martin, Deniz K. Armani, Lan Yang, and Kerry J. Vahala, "Replica-molded high-Q polymer microresonators," Opt. Lett. 29, pp. 533-535, 2004.
[105] Ahmed Akelah and A. Moet, “Functionalized Polymers and their Applications,” Springer Netherlands, 1990.
[106] Kim, H., Kim, Y. and Chang, J. Y., “Polymers for Luminescent Sensing Applications,” Macromol. Chem. Phys., pp. 215, 1274–1285, 2014.
[107] Reinher Pimentel-Domínguez, Amado M. Velázquez-Benítez, J. Rodrigo Vélez-Cordero, Mathieu Hautefeuille, Francisco Sánchez-Arévalo, and Juan Hernández-Cordero, “Photothermal Effects and Applications of Polydimethylsiloxane Membranes with Carbon Nanoparticles,” Polymers 8(4), 2016.
[108] Priimagi, A. and Shevchenko, A., “Azopolymer-based micro- and nanopatterning for photonic applications,” Journal of Polymer Science Part B: Polymer Physics, 52, pp. 163–182, 2014.
[109] M. Smietana, M. L. Korwin-Pawlowski, W. J. Bock, G. R. Pickrell, and J. Szmidt, “Refractive index sensing of fiber optic long-period grating structures coated with a plasma deposited diamond-like carbon thin film,” Meas. Sci. Technol., Vol. 19, No. 8, p. 085301, 2008.

- 83 -
[110] L. Cheng-Ling, “Spectral analysis of waveguide tapered microfiber with an ultrathin metal coating,” Opt. Exp., Vol. 18, No. 14, pp. 14768–14777, 2010.
[111] M. A. Butler and D. S. Ginley, “Hydrogen sensing with palladium coated optical fibers,” J. Appl. Phys., Vol. 64, No. 7, pp. 3706–3712, 1988.
[112] L. E. Scriven, “Physics and applications of dip coating and spin coating,” Mater. Res. Soc. Symp. Proc., Vol. 121, pp. 717–729, 1988.
[113] C. R. Zamarreño, P. Sanchez, M. Hernaez, I. Del Villar, C. Fernandez-Valdivielso, I. R. Matias, and F. J. Arregui, “Sensing properties of indium oxide coated optical fiber devices based on lossy mode resonances,” IEEE Sensors J., Vol. 12, No. 1, pp. 151–155, 2012.
[114] V. A. Márquez-Cruz and J. A. Hernández-Cordero, “Fiber optic Fabry–Perot sensor for surface tension analysis,” Opt. Exp., Vol. 22, No. 3, pp. 3028–3038, 2014.
[115] S.-M. Chuo and L. A. Wang, “Propagation loss, degradation and protective coating of long drawn microfibers,” Opt. Commun., vol. 284, no. 12, pp. 2825–2828, 2011.
[116] S. R. Schmid and A. F. Toussaint, “Optical fiber coatings,” Specialty Optic Fibers Handbook, A. Mendez and T. F. Morse, Eds. Amsterdam, The Netherlands: Elsevier, pp. 95–122, 2007.
[117] Amado M. Velázquez-Benítez, Moisés Reyes-Medrano, J. Rodrigo Vélez-Cordero, and Juan Hernández-Cordero, "Controlled Deposition of Polymer Coatings on Cylindrical Photonic Devices," J. Lightwave Technol. 33, pp. 176-182, 2015.
[118] G. Kakarantzas, S. G. Leon-Saval, T. A. Birks, and P. St. J. Russell, “Low-loss deposition of sol gel-derived silica films on tapered fibers,” Opt. Lett., Vol. 29, No. 7, pp. 694–696, 2004.
[119] Z. Y. Xu, Y. H. Li, and L. J. Wang, “A versatile technique to functionalize optical microfibers via modified sol-gel dip-coating method,” Opt. Lett., Vol. 39, No. 1, pp. 34–36, 2014.
[120] Bogaerts, W., De Heyn, P., Van Vaerenbergh, T., De Vos, K., Kumar Selvaraja, S., Claes, T., Dumon, P., Bienstman, P., Van Thourhout, D. and Baets, R, “Silicon microring resonators,” Laser & Photon. Rev., 6, pp. 47–73,2012.
[121] Kristopher J. Rowland, Alexandre François, Peter Hoffmann, and Tanya M. Monro, "Fluorescent polymer coated capillaries as optofluidic refractometric sensors," Opt. Express 21, pp. 11492-11505, 2013.
[122] A. D. Ryck and D. Quéré, “Inertial coating of a fibre,” J. Fluid Mech., Vol. 311, pp. 219–237, 1996.
[123] D. Quéré, “Fluid coating on a fiber,” Annu. Rev. Fluid Mech., Vol. 31, pp. 347–384, 1999.
[124] D. A. White and J. A. Tallmadge, “A theory of withdrawal of cylinders from liquid baths,” AIChE J., Vol. 12, no. 2, pp. 333–339, 1966.
[125] H. Ma, A. K.-Y. Jen, and L. R. Dalton, “Polymer-based optical waveguides: Materials, processing, and devices,” Adv. Mater., vol. 14, pp. 1339–1365, 2002.
[126] L. Rayleigh, “On the instability of jets,” Proc. London Math. Soc., vol. 10, pp. 4–13, 1878.
[127] B. Magny, S. Pelletier, G. Albrighton, and G. Eisele, “Importance of monomer interfacial tension for UV curable Litho Inks performance,” presented at the Rad Tech Conf., Indianapolis, IN, USA, 2002.
[128] (Oct., 2016). Sylgard184 Silicone Elastomer: Product Information-Electronics, Dow Corning Co., USA. [Online]. Available: http://www.dowcorning.com/DataFiles/090276fe80190b08.pdf
[129] S.Wu, “Calculation of interfacial tension in polymer systems,” J. Polymer. Sci. C, vol. 34, no. 1, pp. 19–30, 1971.
[130] Daniel T. Cassidy, Derwyn C. Johnson, and Kenneth O. Hill, "Wavelength-dependent transmission of monomode optical fiber tapers," Appl. Opt. 24, pp. 945-950, 1985.

- 84 -
[131] R. J. Black, S. Lacroix, F. Gonthier and J. D. Love, “Tapered single-mode fibres and devices—Part 2: Experimental and theoretical quantification,” IEE Proc. J. Optelectron., vol. 138, no. 5, pp. 355–364, 1991.
[132] R. Zhao and C. W. Macosko, “Slip at polymer–polymer interfaces: Rheological measurements on coextruded multilayers,” J. Rheol., Vol. 46, pp. 145–167, 2002.
[133] L. Ying-Chih, L. Yen-Ching, and W. Hsien-Hung, “Drastic changes in interfacial hydrodynamics due to wall slippage: Slip-intensified film thinning, drop spreading, and capillary instability,” Phys. Rev. Lett., Vol. 111, No. 13, p. 136001, 2013.
[134] J. R. Vélez-Cordero, A. M. Velázquez-Benítez, and J. Hernández-Cordero, “Thermocapillary flow in glass tubes coated with photoresponsive layers,” Langmuir, Vol. 30, No. 18, pp. 5326–5336, 2014.
[135] Holger Schmidt and Aaron R. Hawkins, “The photonic integration of non-solid media using optofluidics,” Nature Photonics 5, pp. 598–604, 2011.
[136] Chantal Paquet, Eugenia Kumacheva, “Nanostructured polymers for photonics,” Materials today, Volume 11, Issue 4, pp 48–56, 2008.
[137] Sebastian Valouch, Heinrich Sieber, Siegfried Kettlitz, Carsten Eschenbaum, Uwe Hollenbach, and Uli Lemmer, "Direct fabrication of PDMS waveguides via low-cost DUV irradiation for optical sensing," Opt. Express 20, pp. 28855-28861, 2012.
[138] Amado M. Velázquez-Benítez and Juan Hernández-Cordero, "Optically Driven All-Fiber Polarization Rotator," J. Lightwave Technol. 29, pp. 1671-1676, 2011.
[139] C. R. Mendonça, L. Misoguti, A. A. Andrade, S. B. Yamaki, V.D. Dias, T. D. Z. Atvars, O. N. Oliveira Jr, “Photoinduced birefringence in di-azo compounds in polystyrene and poly(methyl methacrylate) guest–host systems,” Optical Materials, Vol. 30, No. 2, , pp. 216–221, 2007.
[140] Govind P. Agrawal, "Nonlinear Fiber Optics," Academic Press, 3rd Ed., 2001.
[141] Huang, M. and Meng, F., “Synthesis of Yb3+/Er3+ co-dopants sodium yttrium fluoride up-conversion fluorescence materials,” Luminescence, 20, pp. 276–278, 2005.
[142] Anna Boleininger, Thomas Lake, Sophia Hami and Claire Vallance, “Whispering Gallery Modes in Standard Optical Fibres for Fibre Profiling Measurements and Sensing of Unlabelled Chemical Species,” Sensors 9, pp. 1765-1781, 2009.
[143] D. Jandura, D. Pudis, S. Berezina, “Photonic devices prepared by embossing in PDMS,” Applied Surface Science, 2016.

- 85 -
APPENDIX A: PDMS COMPOSITES
The method listed here presents the fabrication of functional polymers using
polydimethylsiloxane (PDMS) as the host matrix for different materials. PDMS is a thermally curable
elastomer comprised by two materials: a base polymer which is silicone oil, and a curing agent that
generates a cross-linking effect. Functional polymer composites preparation was fabricated using
Dow Corning Sylgard 184 PDMS. Incorporation of additional compounds into PDMS involves the use
of chloroform (CHCl3), aiming only at reducing the viscosity of the silicone oil of the PDMS. This
approach generates a uniform distribution of the compound inside the silicone oil, yielding a material
with homogeneous properties and avoiding further modification of the materials. The fabrication
process includes the following steps:
The required base material (silicone oil) is weighted inside of a glass beaker.
The desired compound to be incorporated is added in a given concentration in weight
compared to the total PDMS amount, and simply poured into the beaker.
Chloroform is added into the beaker in a proportion of 0.75 mL per gram of PDMS in order to
lower the viscosity and resulting in a liquid solution which allows the mixture of the PDMS
and the compound.
The materials are mixed to by means of using a magnetic bar activated by a hot plate with
magnetic stirrer, while heated at 150 °C until full evaporation of the CHCl3. After CHCl3
complete evaporation, the resulting composite is left to cold down at room temperature.
The curing agent is added with a given ratio compared to the base material and both parts
are mixed by hand during two minutes.
Air captured during the mixing process is removed thru a degassing process.
The PDMS+compound mixture is deposited into the containers of the coating system and the
coating process is executed.
Solidification of the composites is achieved upon heating at 80 °C during 2 hours.

- 86 -
APPENDIX B: PUBLICATIONS
REFEREED JOURNALS
G. Lopez-Galmiche, Z. Sanjabi Eznaveh, J. E. Antonio-Lopez, A. M. Velazquez Benitez, J. Rodriguez
Asomoza, J. J. Sanchez Mondragon, C. Gonnet, P. Sillard, G. Li, A. Schülzgen, C. M. Okonkwo, and R.
Amezcua Correa, Few-mode erbium-doped fiber amplifier with photonic lantern for pump
spatial mode control, Opt. Lett. 41, pp. 2588-2591, 2016. https://doi.org/10.1364/OL.41.002588
Reinher Pimentel-Domínguez, Amado M. Velázquez-Benítez, J. Rodrigo Vélez-Cordero, Mathieu
Hautefeuille, Francisco Sánchez-Arévalo, and Juan Hernández-Cordero, Photothermal Effects and
Applications of Polydimethylsiloxane Membranes with Carbon Nanoparticles, Polymers, 8(4),
84, 2016. DOI:10.3390/polym8040084
He Wen, Cen Xia, Amado M. Velázquez-Benítez, Naresh Chand, Jose Enrique Antonio-Lopez, Bin Huang,
Huiyuan Liu, Hongjun Zheng, Pierre Sillard, Xiang Liu, Frank Effenberger, Rodrigo Amezcua-Correa,
and Guifang Li, First Demonstration of Six-Mode PON Achieving a Record Gain of 4 dB in
Upstream Transmission Loss Budget, J. Lightwave Technol. 34, pp. 1990-1996, 2016.
http://dx.doi.org/10.1109/JLT.2015.2503121
Pierre Sillard, Denis Molin, Marianne Bigot-Astruc, Koen De Jongh, Frank Achten, Amado M.
Velázquez-Benítez, Rodrigo Amezcua-Correa, and Chigo M. Okonkwo, Low-Differential-Mode-
Group-Delay 9-LP-Mode Fiber, J. Lightwave Technol. 34, pp. 425-430, 2016.
http://dx.doi.org/10.1109/JLT.2015.2463715
Juan Montoya, Chris Aleshire, Christopher Hwang, Nicolas K. Fontaine, Amado Velázquez-Benítez,
Dale H. Martz, T.Y. Fan, and Dan Ripin, Photonic lantern adaptive spatial mode control in LMA
fiber amplifiers, Opt. Express 24, pp. 3405-3413, 2016. https://doi.org/10.1364/OE.24.003405
Amy Van Newkirk, J. E. Antonio-Lopez, Amado Velazquez-Benitez, Jacques Albert, Rodrigo Amezcua-
Correa, and Axel Schülzgen, Bending sensor combining multicore fiber with a mode-selective
photonic lantern, Opt. Lett. 40, pp. 5188-5191, 2015. https://doi.org/10.1364/OL.40.005188
A. M. Velazquez-Benitez, J. C. Alvarado, G. Lopez-Galmiche, J. E. Antonio-Lopez, J. Hernández-Cordero,
J. Sanchez-Mondragon, P. Sillard, C. M. Okonkwo, and R. Amezcua-Correa, Six mode selective fiber
optic spatial multiplexer, Opt. Lett. 40, pp. 1663-1666, 2015.
https://doi.org/10.1364/OL.40.001663
John van Weerdenburg, Amado Velázquez-Benitez, Roy van Uden, Pierre Sillard, Denis Molin, Adrian
Amezcua-Correa, Enrique Antonio-Lopez, Maxim Kuschnerov, Frans Huijskens, Hugo de Waardt, Ton
Koonen, Rodrigo Amezcua-Correa, and Chigo Okonkwo, 10 Spatial mode transmission using low

- 87 -
differential mode delay 6-LP fiber using all-fiber photonic lanterns, Opt. Express 23, pp. 24759-
24769, 2015. https://doi.org/10.1364/OE.23.024759
Amado M. Velázquez Benítez, Moisés Reyes-Medrano, J. Rodrigo Velez-Cordero, Juan Hernandez-
Cordero, Controlled Deposition of Polymer Coatings on Cylindrical Photonic Devices, IEEE
Journal of Lightwave Technology, 33, pp. 176-182, 2015.
http://dx.doi.org/10.1109/JLT.2014.2377173
Cen Xia, Naresh Chand, A. M. Velázquez-Benítez, Zhiqun Yang, Xiang Liu,1 Jose Enrique Antonio-Lopez,
He Wen, Benyuan Zhu, Ningbo Zhao, Frank Effenberger, Rodrigo Amezcua-Correa, and Guifang Li,
Time-division-multiplexed few-mode passive optical network, Opt. Express 23, pp. 1151-1158,
2015. https://doi.org/10.1364/OE.23.001151
CONFERENCE ARTICLES
A. M. Velazquez-Benitez, M. S. Cano-Velazquez, and J. Hernandez-Cordero, Fiber Coupled Optically
Tunable Polymer/Glass Microring Resonators, in Latin America Optics and Photonics Conference,
(Optical Society of America, 2016), paper LTu5C.5. https://doi.org/10.1364/LAOP.2016.LTu5C.5
N. K. Fontaine, B. Huang, Z. Sanjabi Eznaveh, H. Chen, C. Jin, B. Ercan, A. Velázquez-Benítez, S. H. Chang,
R. Ryf, A. Schülzgen, J. Carlos Alvarado, P. Sillard, C. Gonnet, E. Antonio-Lopez, and R. Amezcua Correa,
Multi-mode Optical Fiber Amplifier supporting over 10 Spatial Modes, in Optical Fiber
Communication Conference Postdeadline Papers, OSA Technical Digest (online) (Optical Society of
America, 2016), paper Th5A.4. https://doi.org/10.1364/OFC.2016.Th5A.4
H. Chen, R. Ryf, N. K. Fontaine, A. M. Velázquez-Benítez, J. Antonio-López, C. Jin, B. Huang, M. Bigot,
dmolin, F. Achten, P. Sillard, and R. Amezcua Correa, High Spectral Efficiency Mode-Multiplexed
Transmission over 87-km 10-Mode Fiber, in Optical Fiber Communication Conference, OSA
Technical Digest (online) (Optical Society of America, 2016), paper Th4C.2.
https://doi.org/10.1364/OFC.2016.Th4C.2
J. van Weerdenburg, A. M. Velázquez-Benítez, R. G. H. v. Uden, E. Antonio-Lopez, P. Sillard, D. Molin, M.
Bigot, A. Amezcua-Correa, F. Huijskens, F. Achten, H. de Waardt, T. Koonen, R. Amezcua Correa, and
C. M. Okonkwo, 10 Spatial Mode Transmission over 40km 50μm Core Diameter Multimode
Fiber, in Optical Fiber Communication Conference, OSA Technical Digest (online) (Optical Society of
America, 2016), paper Th4C.3. https://doi.org/10.1364/OFC.2016.Th4C.3
D. Yu, J. v. Weerdenburg, E. Silekens, R. G. H. v. Uden, M. Tang, D. Liu, A. M. Velazquez-Benitez, P. Sillard,
D. Molin, M. Bigot, R. Amezcua Correa, H. de Waardt, T. Koonen, S. Fu, and C. M. Okonkwo, Trellis
Coded Modulation Transmission over 40km 6-LP Mode Fiber, in Optical Fiber Communication
Conference, OSA Technical Digest (online) (Optical Society of America, 2016), paper Th4C.5.
https://doi.org/10.1364/OFC.2016.Th4C.5

- 88 -
R. Ryf, H. Chen, N. K. Fontaine, A. M. Velázquez-Benítez, José Antonio-López, C. Jin, B. Huang, M. Bigot-
Astruc, D. Molin, F. Achten, P. Sillard, and R. Amezcua-Correa, 10-Mode mode-multiplexed
transmission over 125-km single-span multimode fiber, in European Conference on Optical
Communication (ECOC), 2015, 2015, paper PDP.3.3.
http://dx.doi.org/10.1109/ECOC.2015.7341687
He Wen, Hongjun Zheng ; Qi Mo, A. M. Velázquez-Benítez, Cen Xia, Bing Huang, Huiyuan Liu, Huang
Yu, Jose Enrique Antonio Lopez, Rodrigo Amezcua Correa, and Guifang Li, Analog fiber-optic links
using high-order fiber modes, in European Conference on Optical Communication (ECOC), 2015,
paper ID: 0269. http://dx.doi.org/10.1109/ECOC.2015.7341821
J. J. A van Weerdenburg, A. M. Velazquez-Benitez, R. G. H. van Uden, P. Sillard, D. Molin, A. Amezcua-
Correa, J. E. Antonio-Lopez, M. Kuschnerov, F. M. Huijskens, H. de Waardt, A. M. J. Koonen, R. Amezcua-
Correa, and C. M. Okonkwo, 10 Spatial mode transmission over low differential mode group
delay fibre employing all-fibre photonic lanterns, in European Conference on Optical
Communication (ECOC), 2015, paper Th.1.2.5. http://dx.doi.org/10.1109/ECOC.2015.7341841
A. M. Velázquez-Benítez, J. E. Antonio-López, J. C. Alvarado-Zacarías, G. Lopez-Galmiche, P. Sillard, D.
Van Ras, C. Okonkwo, H. Chen, R. Ryf, N. K. Fontaine, and R. Amezcua-Correa, Scaling the fabrication
of higher order photonic lanterns using microstructured preforms, in European Conference on
Optical Communication (ECOC), 2015, paper Tu.1.5.2.
http://dx.doi.org/10.1109/ECOC.2015.7341939
G. López-Galmiche, Z. Sanjabi Eznaveh, L. A. Herrera Piad, A. M. Velazquez-Benitez, J. Rodriguez-
Asomoza, E. Antonio-Lopez, J. J. Sanchez-Mondragon, C. Gonnet, P. Sillard, G. Li, A. Schülzgen, C.
Okonkwo, and R. Amezcua-Correa, Six Mode Erbium-doped Fiber Amplifier Using Mode Selective
Photonic Lantern, in Asia Communications and Photonics Conference 2015, C. Lu, J. Luo, Y. Ji, K.
Kitayama, H. Tam, K. Xu, P. Ghiggino, and N. Wada, eds., OSA Technical Digest (online) (Optical Society
of America, 2015), paper AM2B.5. https://doi.org/10.1364/ACPC.2015.AM2B.5
A. Van Newkirk, A. M. Velázquez-Benítez, J. E. Antonio-Lopez, J. Albert, R. Amezcua Correa, and A.
Schulzgen, 3D Bending Sensor Combining Multicore Fiber with a Mode-Selective Photonic
Lantern, in Workshop on Specialty Optical Fibers and Their Applications, OSA Technical Digest
(online) (Optical Society of America, 2015), paper WT4A.6.
https://doi.org/10.1364/WSOF.2015.WT4A.6
Nicolas K. Fontaine, Roland Ryf ; Haoshuo Chen, Amado Velazquez Benitez, J. E. Antonio Lopez, R.
Amezcua Correa, Binbin Guan, Burcu Ercan, Ryan P. Scott, S. J. Ben Yoo, Lars Grüner-Nielsen, Yi Sun,
Robert J. Lingle, 30×30 MIMO transmission over 15 spatial modes, in Optical Fiber
Communication Conference Postdeadline Papers, OSA Technical Digest (online) (Optical Society of
America, 2015), paper Th5C.1. https://doi.org/10.1364/OFC.2015.Th5C.1
A. M. Velazquez-Benitez, J. C. Alvarado-Zacarias, G. Lopez-Galmiche, E. Antonio-Lopez, A. Schülzgen,
D. Van Ras, P. Sillard, C. M. Okonkwo, and R. Amezcua-Correa, Six Spatial Modes Photonic Lanterns,

- 89 -
in Optical Fiber Communication Conference, OSA Technical Digest (online) (Optical Society of
America, 2015), paper W3B.3. https://doi.org/10.1364/OFC.2015.W3B.3
Mildred Cano-Velázquez, Amado Velázquez-Benítez, Rodrigo Vélez-Cordero, and Juan Hernandez-
Cordero, Functional Polymer Coatings for Photonic Devices, Latin America Optics and Photonics
Conference (LAOP), Cancun Mexico, LTu3D, 2014. https://doi.org/10.1364/LAOP.2014.LTu3D.3
Cen Xia, Naresh Chand, A. M. Velázquez-Benítez, Xiang Liu, Jose Enrique Antonio Lopez, He Wen,
Benyuan Zhu, Frank Effenberger, Rodrigo Amezcua-Correa, and Guifang Li, Demonstration of
World’s First Few-Mode GPON, European Conference on Optical Communication (ECOC), Cannes,
France, PD.1.5, 2014. http://dx.doi.org/10.1109/ECOC.2014.6964260