tesi piovani - open research online
TRANSCRIPT
Open Research OnlineThe Open University’s repository of research publicationsand other research outputs
Determinants Of Drug Utilisation During ChildhoodThesisHow to cite:
Piovani, Daniele (2018). Determinants Of Drug Utilisation During Childhood. PhD thesis The Open University.
For guidance on citations see FAQs.
c© 2017 The Author
https://creativecommons.org/licenses/by-nc-nd/4.0/
Version: Version of Record
Link(s) to article on publisher’s website:http://dx.doi.org/doi:10.21954/ou.ro.0000d712
Copyright and Moral Rights for the articles on this site are retained by the individual authors and/or other copyrightowners. For more information on Open Research Online’s data policy on reuse of materials please consult the policiespage.
oro.open.ac.uk

DETERMINANTS OF DRUG UTILISATION DURING
CHILDHOOD
Daniele Piovani, PharmD
IRCCS - Istituto di Ricerche Farmacologiche “Mario Negri”, Milan, Italy
in collaboration with the Open University, Milton Keynes, UK
Thesis submitted for the Degree of Doctor of Philosophy
Faculty of Health and Social Care
Discipline of Pharmacoepidemiology
September 2017

2

3
ABSTRACT
Paediatric pharmacology is a neglected area in terms of rational use of drugs. Wide
differences have been observed in children’s exposure to drugs between and within
countries and regions. The aim of the current thesis is to investigate the determinants of
drug prescription in paediatrics. Pharmacoepidemiology and the use of administrative
databases can be a useful tool for this scope.
Data collected in regional and multiregional administrative prescription databases were
analysed. Prevalence data by sex and age were calculated by dividing the number of drug
users by the total number of male and female residents in each age group. Univariable and
multivariable analyses were performed with the aim to identify the determinants of drug
prescriptions.
The studies showed quantitative and qualitative differences in drug prescription to children
and adolescents among Italian regions and within regions. The prescription of a great
number of different, redundant, active substances, even among experienced paediatricians,
was found. A North-South trend was found in antiasthmatic and antibiotic prevalence, with
an important association with average income at the area level. A confirmation of the high
prevalence of these drugs and poor qualitative profile was also found.
Large heterogeneity was found in psychotropic drug prevalence among different Italian
regions. Psychotropic drugs were scantly prescribed and some of the most used drugs were
prescribed off-label. The analyses of the prescription of generic antibiotics showed that
generic formulations are scantly prescribed by Italian paediatricians, and the lowest
prescription rate of generic drugs was found in paediatricians who prescribe more
antibiotics. Some quality indicators for antibiotic prescribing were developed at the
paediatrician level. The youngest paediatricians and those who were not exposed to
educational interventions showed a significantly worse quality of prescribing. The thesis
provide some useful data for policy makers in order to improve the rational drug use in
children.

4
ACKNOWLEDGEMENTS
I would first of all like to thank Maurizio Bonati for his guidance throughout the duration of
this project. I would like to thank Antonio Clavenna for helping me all this way, and for his
patience with me. I would also like to thank James McLay for his assistance and precious
suggestions. Thanks to Laura Reale for her advices concerning the topic of paediatric
mental health.
Thanks to Massimo Cartabia and Rita Campi for helping me with data extraction and for
their assistance in the statistical analyses. I would like also to acknowledge Chiara
Pandolfini for language editing, and Maria Grazia Calati of the secretarial office for the
organisation and helping me in collecting the raw data in some studies.
I would like to thank the Regional Health Ministry of the Lombardy Region for funding part
of the project (Epidemiologia del Farmaco, EPIFARM), and all the donors that contributed in
founding my training.
Finally, I would like to thank Prof. Silvio Garattini, director of the IRCCS – Istituto di Ricerche
Farmacologiche “Mario Negri”, for giving me the opportunity to pursue this PhD.
5
TABLE OF CONTENTS
Abstract 3
Acknowledgements 4
Table of contents 5
List of tables and figures 11
Publications and presentations related to this thesis 14
List of abbreviations 16
I. Introduction 17
1. Background 18
2. Previous drug utilisation studies at our laboratory 20
a. Studies concerning any drug 20
b. Studies concerning antibiotics 21
c. Studies concerning antiasthmatics 21
d. Studies concerning psychotropic drugs 22
3. Summary of the thesis 23
II. Aims 25
III. Methods 27
A. Pharmacoepidemiology 28
B. Databases for healthcare research 28
C. The Italian NHS 29
D. The Lombardy Region 30
E. Healthcare databases 31
1. Reimbursed prescription database 31
2. Hospital discharge form database 32

6
3. Specialist visits database 32
F. Strength and limitations of these databases and available data 33
G. Synopsis of the characteristics of the studies 34
H. Identification of drug prescriptions and patients 34
I. Definitions and endpoints 35
L. Statistical analysis 35
IV. Review of the literature 37
A. Drug use or prescription in parents and offsprings: a review of 38
the literature
1. Introduction 38
2. Search strategy 38
3. Data extraction 41
4. Results 41
a. Characteristics of studies 41
b. The association between child and parents 45
drug prescription or use
5. Discussion 48
6. Conclusions 50
V. Determinants of drug prescribing: drug utilisation studies in paediatrics 52
A. Antibiotic and anti-asthmatic drug prescriptions in Italy: geographic 53
patterns and socio-economic determinants at the district level
1. Introduction 53
2. Methods 54
a. Data source 54

7
b. Measures 55
3. Results 57
a. Regional prescription profile 57
b. Prescription profile at the district level 58
c. Determinants 60
4. Discussion 62
a. Strengths and weaknesses 65
5. Conclusions 65
B. A multiregional study about psychotropic medicine prescriptions 67
1. Introduction 67
2. Methods 69
a. Data source 69
b. Data analysis 70
3. Results 72
a. Overall study population 72
b. Regional profile 75
c. Temporal trend 77
4. Discussion 79
5. Conclusions 86
VI. Quality of drug prescribing in paediatrics 87
A. Review of Italian primary care paediatricians identifies 38 88
commonly prescribed drugs for children
1. Introduction 88
2. Methods 89

8
a. Data source 89
3. Results 90
a. Prescriptions recommended by the specialist 93
b. List of commonly prescribed drugs 94
4. Discussion 95
5. Conclusions 98
B. Generic antibiotic prescribing in paediatrics 99
1. Introduction 99
2. Methods 98
a. Data source 98
b. Study population 100
c. Measures and analysis 101
3. Results 101
a. Prevalence and determinants 103
4. Discussion 104
5. Conclusions 106
C. Comparing recurrent antibiotic prescriptions in children treated 107
with a brand name or a generic formulation.
1. Introduction 107
2. Methods 108
a. The reference price system 108
b. Data source 109
c. Therapy switch 110
d. Generic/brand name 110

9
e. Hospital admissions 110
f. Statistical analysis 111
3. Results 111
a. Therapy switch 112
b. Generic/Brand name 114
c. Hospital Admission 116
4. Discussion 118
5. Strengths and Limits 120
6. Conclusions 121
D. Assessing the quality of paediatric antibiotic prescribing by
community paediatricians: a database analysis of prescribing in
Lombardy 123
1. Introduction 123
2. Methods 124
a. Data source 124
b. Index prescription 124
c. Inclusion criteria 124
d. Exclusion criteria 124
e. Measures 125
f. Data analyses 125
g. Quality indicators 125
3. Results 127
a. Prescription profile 127
b. Paediatricians 128
10
4. Discussion 132
5. Conclusions 136
VII. Overall discussion and conclusions 137
A. Summary 138
B. Determinants and relevance 138
C. Possible priority interventions 139
D. Future perspectives 141
VIII. References 142
11
LIST OF TABLES AND FIGURES
Figure 1 - Lombardy Region’s geographical location and administrative organisation 30
Table 1 - Characteristics of the pharmacoepidemiologic studies presented in the thesis 34
Figure 2 – Study selection 41
Table 2 – Characteristics of the studies 42
Table 3 - Summary of the main outcomes of the studies 43
Table 4 - Average district prevalence (%) and anova test on the prevalence 57
grouped by region
Figure 3 - Choropleth map of the standardised prevalence ratio (SPR) at the district 59
level for antibiotics and anti-asthmatics.
Table 5 – Analysis of the correlation between antibiotic and anti-asthmatic 61
prevalence versus average annual income per resident at the district level
Table 6 - Correlation between prevalence rate of antibiotic and anti-asthmatic drugs 61
vs other determinants at the district level
Table 7 - Number of youths 0–17 years old, number of LHUs, average prevalence 72
of prescription, prescription and hospital admission rate percentage by region
Figure 4 - Prevalence by age and gender of overall psychotropic drugs (A), 73
antidepressants (B), antipsychotics (C), and ADHD medications (D).
Table 8 - The prevalence per 10.000 resident youths of the ten most prescribed 75
psychotropic drugs in 2011 by age group.
Figure 5 - Choropleth map of the participating regions and LHUs 76
Table 9 - Prevalence and incidence of psychotropic medicine prescriptions in 78
youths <18 years, 2006 to 2011
Table 10 - Prevalence of antidepressants, antipsychotics, and ADHD 80
medications observed in ≤ 18 years old in western countries in the last ten years.
Table 11 – List of medicines prescribed by ≥ 50% of FPs and 91
percentage of prescriptions

12
Table 12 – Distribution of active substances among therapeutic subgroups 92
ordered by percentage of prescribers.
Table 13 – List of shared medicines identified by the predefined criteria. 94
Therapeutic subgroups are ordered by number of packages.
Table 14 – Data concerning the four most prescribed antibiotics with expired patent 103
in terms of generic drug prescription
Table 15 - Comparison of the proportion of generic prescriptions among different 104
groups of paediatricians in respect to quantity of antibiotics prescribed
Table 16 - Number of prescriptions of the most used active substances and 113
percentage of their recurrences (including therapy switches).
Table 17 – Number and percentage of recurrent prescriptions among children 115
receiving a generic or brand name formulation of the four antibiotics considered.
Table 18 – Number and percentage of hospital admissions among children 117
receiving a generic or brand name formulation of the four antibiotics considered.
Table 19 – Percentage distribution of children at the index prescription by active 128
substance and age strata
Table 20 - Distribution of two quality indicators among the FPs ordered 129
by type of prescriber
Figure 6 - Distribution of the FPs that prescribed amoxicillin alone at 128
the index prescription to at least 50% of their patients included in the study
(A indicator), and of the percentage of FPs that prescribed exclusively
non-penicillin antibiotics in different infection episodes to more than 10% of
their patients included in the study (B indicator).
Table 21 – FPs characteristics and their association with reaching the target 129
for both the A and B quality indicators (adequate quality).
Table 22 – Logistic multivariable regression model for the likelihood of each 130
FP of reaching the target for both the A and B quality indicators

13

14
PUBLICATIONS AND PRESENTATIONS RELATED TO THIS THESIS
Published Papers:
Piovani D, Clavenna A, Cartabia M, Bonati M. Antibiotic and anti-asthmatic drug
prescriptions in Italy: geographic patterns and socio-economic determinants at the
district level. Eur J Clin Pharmacol. 2014; 70:331-7.
Piovani D, Clavenna A, Cartabia M, Bonati M. Psychotropic medicine prescriptions
in Italian youths: a multiregional study. Eur Child Adolesc Psychiatry. 2016; 25:235-
45.
Piovani D, Clavenna A, Bonati M; PeFAB group. Review of Italian primary care
paediatricians identifies 38 commonly prescribed drugs for children. Acta Paediatr.
2014; 103:e532-7. doi: 10.1111/apa.12783.
Piovani D, Clavenna A, Cartabia M, Bortolotti A, Fortino I, Merlino L, Bonati M.
Comparing recurrent antibiotic prescriptions in children treated with a brand name
or a generic formulation. Pharmacoepidemiol Drug Saf. 2015; 24:121-8.
Piovani D, Clavenna A, Cartabia M, Bortolotti A, Fortino I, Merlino L, Bonati M.
Assessing the quality of paediatric antibiotic prescribing by community
paediatricians: a database analysis of prescribing in Lombardy. BMJ Paediatrics
Open 2017; 1:e000169. doi: 10.1136/bmjpo-2017-000169
Published Abstracts:
Drug prescription profile and perinatal determinants during the first year of life.
Arch Dis Child 2016;101:e1 doi: 10.1136/archdischild-2015-310148.3 15° Biannual
Congress of the European Society for Developmental Perinatal Paediatric
Pharmacology (ESDPPP), Belgrade, Serbia, 23-26 June 2015.
Oral presentations:

15
Psychotropic drug prescriptions in Italian children and adolescents: a multiregional
study. Italian Association of Epidemiology (AIE), XXXVIII congress, Naples, Italy, 5-7
November 2014.
Poster Presentations:
Comparing recurrent antibiotic prescriptions in children treated with a
brand name or a generic formulation, EuroDurg 2014 - Groningen, The Netherlands
– 27-29 August 2014.
Drug prescription and perinatal determinants during the first year of life. 15°
Biannual Congress of the European Society for Developmental Perinatal Paediatric
Pharmacology (ESDPPP), Belgrade, Serbia, 23-26 June 2015.

16
LIST OF ABBREVIATIONS
ADHD Attention Deficit Hyperactivity Disorder
ASST Azienda Socio-Sanitaria Territoriale (social health territorial unit)
ATS Azienda di Tutela della Salute (health protection territorial agency)
AUC Area Under Curve
CV Coefficient of variation
EMA European Medicines Agency
EMLC Essential Medicines List for Children
FP Family Paediatrician
GP General Practitioner
ICD-9 International Classification of Diseases, 9th Revision
INN International Non-proprietary Name
LHU Local Health Unit
NICE National Institute for health and Care Excellence
NHS National Health Service
NPF National Pharmaceutical Formulary
RADT Rapid Antigen Detection Test
RCT Randomised Controlled Trial
RTI Respiratory tract infections
SD Standard Deviation
SSRI Selective Serotonin Re-uptake Inhibitors
URTI Upper respiratory tract infections

17
I. Introduction
18
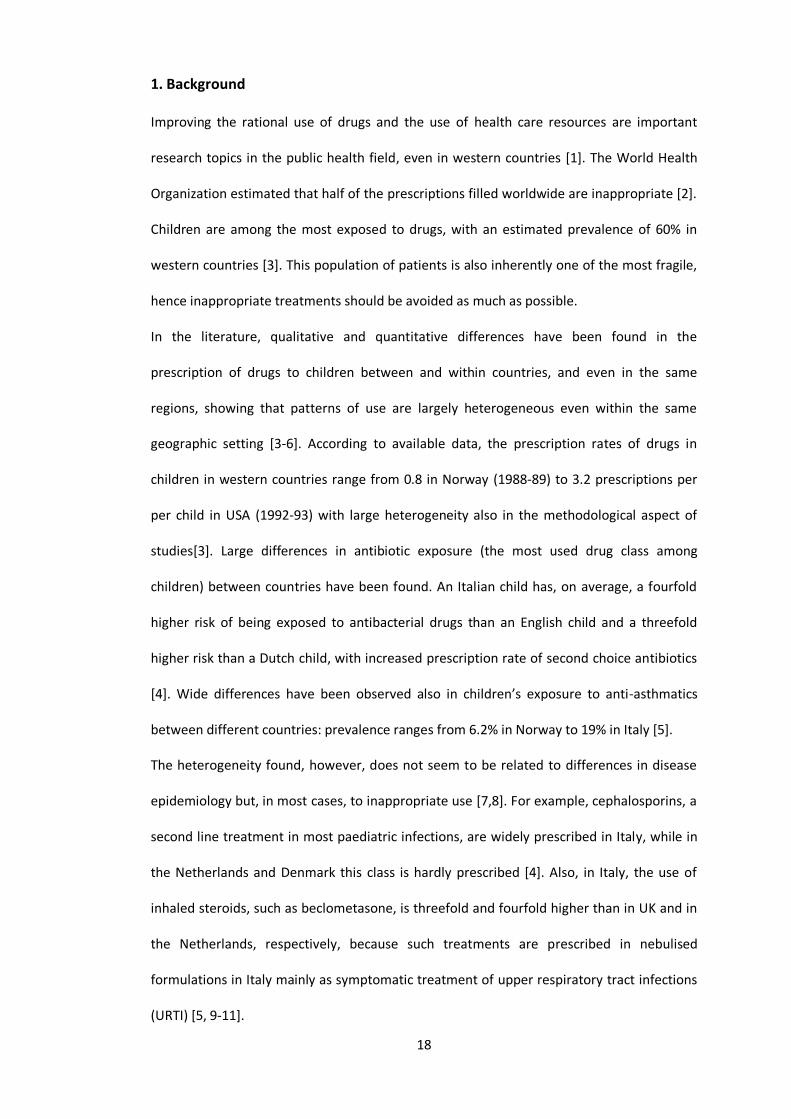
1. Background
Improving the rational use of drugs and the use of health care resources are important
research topics in the public health field, even in western countries [1]. The World Health
Organization estimated that half of the prescriptions filled worldwide are inappropriate [2].
Children are among the most exposed to drugs, with an estimated prevalence of 60% in
western countries [3]. This population of patients is also inherently one of the most fragile,
hence inappropriate treatments should be avoided as much as possible.
In the literature, qualitative and quantitative differences have been found in the
prescription of drugs to children between and within countries, and even in the same
regions, showing that patterns of use are largely heterogeneous even within the same
geographic setting [3-6]. According to available data, the prescription rates of drugs in
children in western countries range from 0.8 in Norway (1988-89) to 3.2 prescriptions per
per child in USA (1992-93) with large heterogeneity also in the methodological aspect of
studies[3]. Large differences in antibiotic exposure (the most used drug class among
children) between countries have been found. An Italian child has, on average, a fourfold
higher risk of being exposed to antibacterial drugs than an English child and a threefold
higher risk than a Dutch child, with increased prescription rate of second choice antibiotics
[4]. Wide differences have been observed also in children’s exposure to anti-asthmatics
between different countries: prevalence ranges from 6.2% in Norway to 19% in Italy [5].
The heterogeneity found, however, does not seem to be related to differences in disease
epidemiology but, in most cases, to inappropriate use [7,8]. For example, cephalosporins, a
second line treatment in most paediatric infections, are widely prescribed in Italy, while in
the Netherlands and Denmark this class is hardly prescribed [4]. Also, in Italy, the use of
inhaled steroids, such as beclometasone, is threefold and fourfold higher than in UK and in
the Netherlands, respectively, because such treatments are prescribed in nebulised
formulations in Italy mainly as symptomatic treatment of upper respiratory tract infections
(URTI) [5, 9-11].

19
The determinants of inappropriate use or over-prescription are many and complex. Some
have been studied in depth, such as the FP’s attitude to prescription [12]. The most
important factors linked to the family paediatricians’ (FP) over-prescription are diagnostic
uncertainty and perceived parental expectations of a prescription [13]. The existing
healthcare system and patient- or parent-related sociocultural and economic determinants
may also, however, be responsible for geographic differences in prescription profiles [14].
These associations have been described, but have been studied to a limited extent. For
example, there is recent evidence that children receiving a high quantity of antibiotics
belong to families that use more drugs in general [15]. Another study found that children
receiving a psychotropic drug had a higher chance of having a family member with a
psychiatric disorder [16]. There is evidence that children receiving hypnotic prescriptions
were more likely to have mothers who receive hypnotic prescriptions themselves,
implicating that mothers were able to somehow influence the prescribing process [17]. It is
not, however, understood how the socio-cultural and health status of the families can
influence drug use in children.
The use of healthcare databases to conduct retrospective studies is an important research
tool concerning drug and health resources use. In fact data linkage of healthcare databases
permits the assessment of large populations, it is flexible in design, has high speed of use,
and avoid issues such as selection biases that are typical of other investigation tools like
surveys or non-randomized ad hoc studies [18]. The use of real world-data that are
routinely collected during the course of health care delivery can be a cost saver in respect
to large RCTs for answering relevant epidemiological questions [19]. The important
limitations of the healthcare databases available for use in this thesis will be discussed in
the Methods section.

20
2. Previous drug utilisation studies at our laboratory
In the past years the Laboratory for Mother and Child Health have produced a number of
studies concerning drug utilisation, including reviews of the literature, and studies on the
rational use of drugs in paediatrics. In this section I will summarize some of the main
findings that are relevant to this thesis.
a. Studies concerning any drug
A review of the literature found that the prevalence of any kind of drugs in paediatrics
ranged between 51% in Denmark to 70% in Greenland and the prescription rate ranged
from 0.8 in Norway to 3.2 prescriptions per person in the United States [3]. The review also
found large heterogeneity in the methodological quality and outcomes reported.
A study investigated the drug prescription profile in the Lombardy Region and found a
prevalence ranging between 38.4 and 54.8%. Drug prevalence was not correlated to
hospitalization rate in the paediatric population. Being younger (1-5 years old), and living in
the eastern part of the region were the factors associated with the highest risk of drug
exposure [20].
A more recent study investigated the prevalence of drug prescription in three Italian
regions finding large differences among Local Health Units – LHUs - (ranging from 43.1% to
70.0%), with an increased chance to receive a prescription in the South of the country [8].
Finally, a study investigated the differences in prescribing between GPs and FPs finding that
children cared for by GPs had an higher chance to receive any drugs compared to those
cared for by FPs [21].

21
b. Studies concerning antibiotics
A review of the literature found quantitative and qualitative differences in the antibiotic
prescription profile between and within countries. Moreover, differences were found also
at the local level and between prescribers. In general, second-choice antibiotic drugs were
more commonly prescribed in settings characterised by a high prevalence of antibiotic
prescription [4].
A study on seven Italian regions found that prevalence ranged from 42.6% to 62.1% among
regions, and at the LHU level they ranged from 35.6% to 68.5%. There was a trend
indicating that in southern regions antibiotics were more frequently prescribed than in the
northern and central regions. Overall, penicillin covered 53.1% of antibiotic prescriptions,
with differences between regions ranging from 39.2% to 62.5% with a North-South trend
[6].
Another study on the Lombardy Region (the region with the highest population density in
Italy, accounting for 1/6 of the Italian population) compared the prescription profile of a
group of FPs that has been involved in initiatives concerning care for years with that of the
others FPs in the region [22]. The study found a better qualitative profile in the FPs involved
in educational initiatives. The study also found that by improving prescribing
appropriateness (i.e. by increasing amoxicillin prescription), it would have been possible to
reduce the expenditure associated with antibiotic prescriptions to outpatient children by
about one-fifth [22].
c. Studies concerning antiasthmatics
A review of the literature found that the overall prevalence of antiasthmatics was 13.3%,
and wide differences were found between countries, ranging from 6.2% in The Netherlands

22
to 19.0% in Italy [5]. The review found an heterogeneous quality of the studies in respect to
the outcome measures reported [5].
A study on an Italian LHU found a prevalence of 12%, with high proportion of users being
occasional (58%). The study found that the prevalence of anti-asthmatic prescription was
much higher than prevalence of disease, indicating that anti-asthmatics were over-
prescribed. High use of nebulized steroids, mainly prescribed only once in a year, was
found, supporting the hypothesis that they were prescribed not for asthma but as a
symptomatic treatment of URTIs [23]. The study recently prompted a RCT on the
effectiveness of nebulised beclomethasone in preventing viral wheezing [24]. The study
showed that nebulised beclomethasone is not effective in preventing recurrence of viral
wheezing, nor in reducing symptoms of respiratory tract infections, showing that its use for
these indications is not evidence-based [24].
Most of the antiasthmatics prescribed in Italy are not used for asthma but for the
treatment of symptoms of common URTI without rodust evidence of efficacy. Thus, a
method of assessing asthma prevalence in a children population starting from prescription
data was validated in a more recent study, by considering only pressurised formulations of
antiasthmatics [25].
d. Studies concerning psychotropic drugs
A review of the literature found an increase in psychotropic drugs among paediatric
patients in different countries in the past decade [26]. This increase was especially evident
for stimulants and selective serotonin reuptake inhibitors. The analysis of the
epidemiological data suggested that the risk of inappropriate use or abuse of these drugs
was high [26].

23
A study conducted in a LHU of the Veneto Region showed that the prevalence of
prescription of psychotropic drugs was low in the 2004-2008 period compared to other
countries, and the incidence slightly increased from 7.0 in 2005 to 8.3 per 10,000 children in
2008 [16]. Despite the low prevalence, most children receiving a pharmacological
treatment were not cared for by child and adolescent psychiatric services [16].
A successive study in the Lombardy Region found that 59,987 youths (37.1‰) attended a
child and adolescent neuropsychiatry service at least once, but only 2,761 (1.7 ‰) received
a pharmacological treatment, confirming the low use of psychotropic drugs compared to
other countries [27]. Also in this study 57% of the youths who received a pharmacological
treatment did not attend a child neuropsychiatry service [27].
3. Summary of the thesis
This thesis is an attempt to evaluate the determinants of drug prescription in children in
more detail.
For doing so, the first part of the thesis is aimed at exploring the literature concerning the
association between parents and child drug prescription and/or use. The aim of this review
was to focus on a neglected area in terms of determinants of drug use, and this is an area
that is potentially important but that was not investigated before in my laboratory. A
systematic review of the literature was performed with the aim to collect the studies and
the results of epidemiological studies that used administrative databases that evaluated the
association between drug use or prescription in parents and their offspring.
The rest of the thesis focuses on studies performed using administrative databases. The
first part focuses on some determinants of antibiotic, antiasthmatics, and psychotropic
medicine prescriptions in large multiregional studies, which involved up to half of the
children and adolescents Italian population, and are quite representative of the different

24
socio-cultural and geographical heterogeneity. In this first part the determinants of the
prevalence of prescription of this drug classes was evaluated in respect to the geographical
and income factors.
In the last part of the thesis an evaluation on the quality of drug prescription and on the
associated determinants, was performed with three studies. The first study was performed
in collaboration with a group of experienced FPs involved in educational activities since
2004. We collected information about the overall drug prescribed by this group in two
consecutive months, and estimated a list of the most commonly prescribed “essential”
drugs in the context of daily clinical practice in Italy. The other three studies employed the
Lombardy Region administrative databases, the first study regarded the prescription of
generic and brand name formulations of antibiotic in the clinical practice. The high
prescribing paediatricians were found more likely to prescribe a brand name antibiotic than
the low prescribing colleagues.
In the second study proxy of safety and effectiveness were evaluated for the brand name
and generic antibiotic, finding no differences both in the rate of recurrent prescription
following a brand name versus generic prescription, and in the rate of hospital admissions.
Finally the last study evaluated the quality of FPs’ antibiotic prescriptions by testing two
newly identified indicators of quality of prescribing at the FP level. These indicators were
elaborated starting from the epidemiology of the infectious diseases and some
epidemiological data concerning the reasons for access to ambulatory care for the most
common bacterial RTI in the Lombardy Region. The determinants of the quality of antibiotic
prescribing was investigated in respect to a number of FP characteristics such as sex, age,
number of patients, geographical factor, being an high or low prescriber.

25
II. Aims

26
The main aims of the project were:
1. To evaluate the determinants of drug prescriptions in a large Italian out-patient
paediatric population by using administrative databases.
2. To compare the prescribing patterns in different settings, at different levels
(national, regional, local)
3. To monitor drug prescription patterns and the quality of therapies by evaluating
their adherence to international treatment guidelines
4. To estimate the quality of drug prescription in different settings, and in respect to
different topics, including the prescription of generic antibiotics versus brand name
drugs.

27
III. Methods

28
A. Pharmacoepidemiology
Pharmacoepidemiology is defined as the study of the use and effects/side-effects of drugs
in large numbers of people with the purpose of supporting the rational and cost-effective
use of drugs in the population and thereby improving health outcomes [28].
Pharmacoepidemiology is strictly associated with large health care databases, and big data
are often used to address research questions within pharmacoepidemiology. In fact this
disclipline was born in 1960s togheter with the availability of large healthcare databases.
Pharmacoepidemiology, with appropriate methodologies, can be a useful tool for
improving the effectiveness and efficiency of healthcare interventions [28,29]. Such
improvements may be of particular relevance in the paediatric population, since limited
information on the safety and efficacy of drugs used in paediatrics still exists, despite the
regulatory effort at the European and global levels [30-33]. Drug utilization studies in
children may be used to identify the major therapeutic problems in this population.
Moreover, although rational drug therapy is important for all individuals being treated with
drugs, it is of paramount importance for children.
B. Databases for healthcare research
While administrative data are not designed for research, have limitations, are often difficult
to access, and the linkage required between certain databases may be unfeasible, yet they
retain a great research potential. The Administrative Data Taskforce identified the following
items of value associated with the use of administrative data [34,35]:
- The data already exist. There are no additional data collection costs associated with
research use;
- The data are typically large datasets, permitting more detailed research to be
undertaken then would otherwise be the case;
- The data records a process, which can be documented and understood;

29
- Linkage between data relating to different time periods can create longitudinal
resources; and
- Linkage to other data sources (e.g. surveys) can enhance these resources.
Additionally health databases can provide data on diagnosed diseases through hospital
admission and surgical procedures codes. The information on prescribed drugs, with
appropriate techniques and integrations, can be used to estimate the prevalence of certain
diseases, also in the outpatients [36].
C. The Italian NHS
Italian healthcare is provided free or at a nominal charge through a network of 20 Regions
and 101 LHUs (on 7 March 2017). Every Italian resident is registered with a family
(paediatric or general) practitioner. Children are assigned to a FP until they are 6 years old;
afterwards, the parents can choose to register a child with a GP. At 14 years old all
adolescents are assigned to a GP. In Italy a national formulary is available, in which drugs
are categorised into three classes: class A includes essential drugs that patients do not have
to pay for, class C contains drugs not covered by the NHS, class H contains drugs
administered only to inpatients that are fully reimbursed, and OTC drugs. Italian
outpatients receive class A prescriptions from FPs, GPs, or other specialists and then get the
medicines free of charge from retail pharmacies. Outpatients receiving prescriptions in
community pharmacies and get the medicines free of charge through their GP
prescriptions, or their FP prescriptions if they are children. Each local pharmacy provides
these prescriptions to the Regional Health Authority to get reimbursed. The majority of
drugs marketed for serious conditions are fully or partly reimbursed with only a few
exceptions.
A class A drug need to be prescribed by a GP or FP using a dedicated form to be reimbursed
by the NHS. A specialist such as a neurologist or otorhinolaryngologist, does not necessarily
use the NHS form when prescribing reimbursable class A drugs. Moreover, the NHS form

30
cannot be used for private visits. After a visit by a specialist, parents therefore go to their FP
to obtain reimbursable prescriptions.
D. The Lombardy Region
The Lombardy Region is a large Italian region in the North of the country accounting for 1/6
of the Italian population, with a total of 1,676,730 (2017) resident children and adolescents.
The region was composed of 15 LHUs and 95 healthcare districts until the reorganisation in
2016, when the LHUs were reduced to 8 (called ATS), and the healthcare districts to 27
(called ASST), figure 1. The region is among the most wealthy in Italy, and it has an
heterogenous geography, with a large plain area in the central and southern part, and
mountains in the northern part. The region is very densly abitated and mostly composed of
urban areas, with few rural areas.
Almost all the studies presented in this thesis used the old administrative organisation, only
the last study at chapter VI.D used the new one.

31
Figure 1 - Lombardy Region’s geographical location and administrative organisation
E. Healthcare databases
1. Reimbursed prescription database
The database contains reimbursable prescriptions (class A) routinely acquired for
administrative and reimbursement reasons in the Lombardy Region. The database stores all
community (i.e. outside hospital) prescriptions issued to individuals living in Lombardy
Region. Within this system, a unique patient code prevents double counting of individuals
who have been prescribed drugs by more than one physician. Each prescription is
associated with a unique code identifying the medicine prescribed (including dosage and
formulation). Other information available are: the prescription date, the number of boxes
prescribed, and the prescriber and his/her characteristics.

32
2. Hospital discharge form database
Besides prescription data, this database contains the hospital admissions of patients
classified according to the ICD-9 system [37]. The relevant information available are
concerning the patients’ vital statistics (age, sex, and address of residence); characteristics
of the hospital stay (institute, ward and unit, type of admission, length of stay, priority) and
clinical characteristics (primary diagnosis, other secondary diagnoses, diagnostic and
therapeutic procedures, date of admission, discharge, or in-hospital death). Drugs
administered during the hospital stay are not included in this database. Secondary
diagnoses are up to to five co-existing conditions that may or may not be pre-existent.
3. Specialist visits database
Information about the outpatient specialist visits, in particular prescriptions for diagnostic
tests, specialist visits, and rehabilitation performed in outpatient ambulatories are recorded
for each resident patient.
Since these three databases share the same unique patient identifier - through the Patient
Record Database (which contains each patient’s vital statistics) - prescriptions, hospital
admissions and specialist visits can be linked straightforwardly. The three databases are
provided to our laboratory (Laboratory for Mother and Child Health) within the EPIFARM
project, a pharmacoepidemiological project running since 2003 in agreement with the
Regional Health Ministry of the Lombardy Region Data are available for these databases
since 2000. The quality and accuracy of data is routinely checked and validated each year
ensuring high standards, in particular more than 99% of the patients’ records were able to
be linked among the three databases in 2011 Anonymity of each patient is granted by a
third party society, that is not involved in any way in the analyses of the data, and that
provide the laboratory with the data already encrypted within the unique patient identifier.

33
The other regions participating in the studies A and B, chapter V have a very similar
structure of regional databases.
F. Strength and limitations of these databases and available data
The main advantage of monitoring the prescriptions dispensed by all the physicians to an
entire population in a specific region. Because of the universal coverage of Italian NHS,
there are not bias for the exclusion of children with different familiar socio-economic
status, or concerning the prescription of more costly drugs, like it is the case in other
countries. Moreover, data are available for a long time period, and this allow longitudinal
studies in paediatric patients.
The main limits are that private practice physicians, over-the-counter drugs, and drugs not
reimbursed by the NHS are not included. However private practice drug prescription are
quite limited. Among the most important paediatric drugs that are not recorded in the
database there are paracetamol, ibuprofen, antiemetic drugs and most dermatologic drugs.
Other limitations are that the therapeutic indication is lacking, and that it is not possible to
know if the patient actually took the drug. Moreover, information concerning the socio-
economic status or the educational level of the individuals are not available. In order to
overcome this issue, in some of the studies, average annual income at the area level was
used as a proxy to the socio-economic status of individuals and families.
In large databases very small differences between groups can result in statistically
significant differences which are not clinically meaningful. Also, even if data quality is
routinely checked in terms of matching among different databases, there are possible
missings or incomplete data in some of the variables which need to be checked for each
study. The eventual exclusion of some of the patients for missing variables needs to be
evaluated in order to check if a selection bias is likely to occur for each study.
34
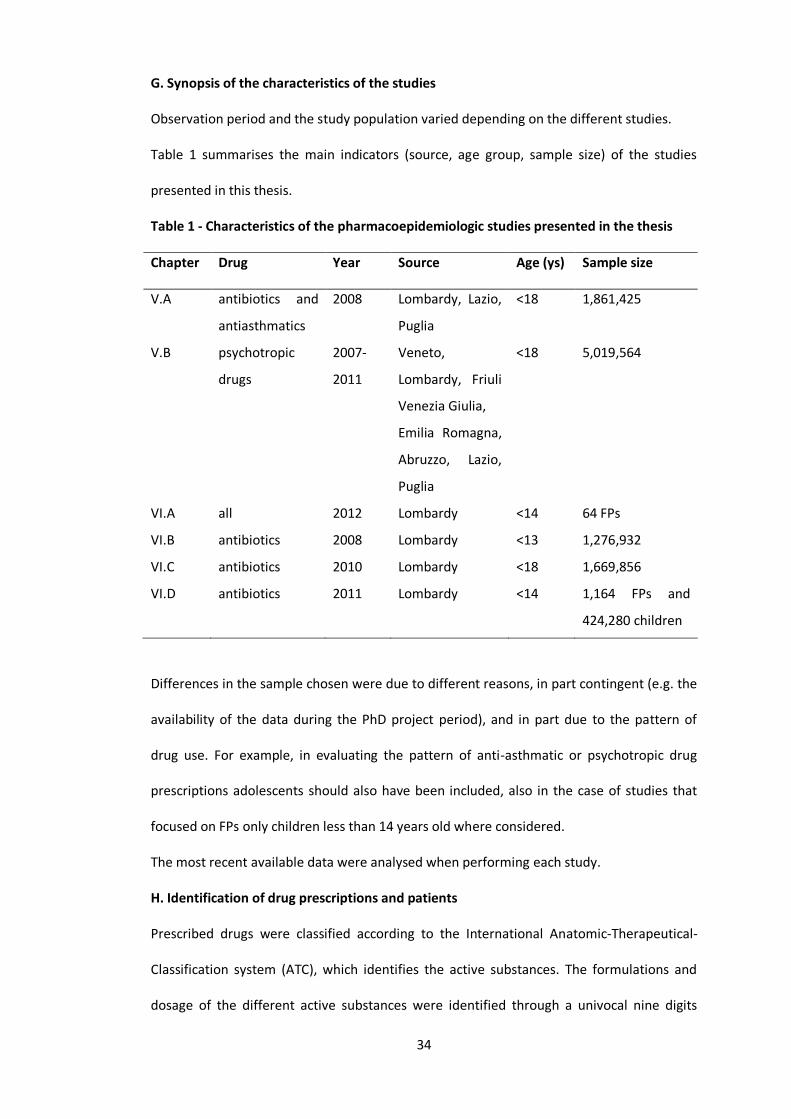
G. Synopsis of the characteristics of the studies
Observation period and the study population varied depending on the different studies.
Table 1 summarises the main indicators (source, age group, sample size) of the studies
presented in this thesis.
Table 1 - Characteristics of the pharmacoepidemiologic studies presented in the thesis
Chapter Drug Year Source Age (ys) Sample size
V.A antibiotics and
antiasthmatics
2008 Lombardy, Lazio,
Puglia
<18 1,861,425
V.B psychotropic
drugs
2007-
2011
Veneto,
Lombardy, Friuli
Venezia Giulia,
Emilia Romagna,
Abruzzo, Lazio,
Puglia
<18 5,019,564
VI.A all 2012 Lombardy <14 64 FPs
VI.B antibiotics 2008 Lombardy <13 1,276,932
VI.C antibiotics 2010 Lombardy <18 1,669,856
VI.D antibiotics 2011 Lombardy <14 1,164 FPs and
424,280 children
Differences in the sample chosen were due to different reasons, in part contingent (e.g. the
availability of the data during the PhD project period), and in part due to the pattern of
drug use. For example, in evaluating the pattern of anti-asthmatic or psychotropic drug
prescriptions adolescents should also have been included, also in the case of studies that
focused on FPs only children less than 14 years old where considered.
The most recent available data were analysed when performing each study.
H. Identification of drug prescriptions and patients
Prescribed drugs were classified according to the International Anatomic-Therapeutical-
Classification system (ATC), which identifies the active substances. The formulations and
dosage of the different active substances were identified through a univocal nine digits
35
code (MINSAN code). Patients were identified by using the anonymous patient identifier
previously described, which prevents double counting of individuals who have been
prescribed drugs by more than one physician
I. Definitions and endpoints
Proportion: the ratio of a specific quantity to the whole. Can be expressed as a percentage
(i.e. the proportion of patients treated with a drug on the overall sample)
Ratio: a relationship between two quantities indicating how many times the first contains
the second
Rate: the ratio between two related quantities (speed is a rate i.e number of meters per
seconds), in epidemiology for example the number of prescriptions per year is a rate, and it
is usually expressed per patient or per 100, 1000 patients.
When referring to prevalence in this thesis the measure to be considered is period
prevalence (annual prevalence), calculated by sex and age by dividing the number of drug
users by the total number of male and female residents in each age group. A person
receiving at least one drug in a year is defined drug user. Point prevalence is the proportion
of persons with a particular attribute on a particular date, and will not be used in this
thesis. Incidence is defined as the proportion of persons receiving a prescription (new
cases) in a certain period of time (usually at least one year) considering the population
initially at risk. In order to evaluate pharmaceutical consumption, the number of packages
of medications (cartons) was used as an indicator of the whole drug exposure during the
considered period. In fact, it can be related to the same medicine prescribed repeatedly or
to different medicines. The rate of hospitalisation was estimated considering hospital
discharge forms, by dividing the number of patients <18 years old hospitalised at least once
during the observation period by the total number of residents < 18 years old.
L. Statistical analyses
Arithmetic mean and standard deviation or, when appropriate, medians and interquartile
ranges, was used to summarise continuous variables, and the t test and Wilcoxon signed-
36
rank tests to make comparisons among two samples. χ2 and χ2 for trend were used as
appropriate for univariable comparisons of dichotomous data. Multivariable logistic
regression was used in order to estimate risk factors increasing the probability of a given
outcome.
More details concerning the statistical analyses are provided in each chapter. The results of
the statistical analysis are reported in this manner: test used; degree of freedom (d.f.); p-
value.
Statistical analysis was performed using SAS software, version 9.2 to 9.5, and the
cartographic representations and spatial analyses with ArcMap 10.5.
A P value < 0.05 was considered statistically significant.

37
IV. Review of the literature

38
A. Drug use or prescription in parents and offsprings: a review of the literature
1. Introduction
A study on 50 families in 1980 published on the BMJ showed that children of mothers
classed as high psychotropic users received twice as many antibiotics as the children of the
mothers who had received no psychotropic medication [38].
A few recent studies showed that one of the possible determinants of drug prescription in
children may be the amounts of drug used within his or her family [15,17]. A study in our
laboratory previously showed that a child receiving a psychotropic drug had an higher
chance of having a family member with a psychiatric disorder [16], indicating that
prevalence of severe psychiatric disorders may be higher among youths whose parents
have these disorders. Nevertheless, one of the two studies showed that a number of
different drug classes were more used in parents of children receiving more antibiotics,
without an apparent reason [15]. The authors hypothesised that, besides an inherited
higher chance of developing a disease, parents' medicine use may influence that of children
medicine prescription or use in other ways.
In order to verify if other studies found that parent’s medicine use may influence that of
children, and which type of drugs have been studied, I performed a systematic review of
the pharmacoepidemiologic studies that investigated this topic.
2. Search strategy
A bibliographic search was performed in the MEDLINE (1966 - August 2017) and EMBASE
(1966 - August 2017) databases. The search strategy included studies that investigated and
quantified the association between offsprings and parental drug utilisation/prescription. In
particular pharmacoepidemiological and epidemiological studies, including case-control,
retrospective, longitudinal, prospective, and cross-sectional studies were included. The
39
search was limited to studies published before the 01/09/2017, to the mesh term
“humans”, and published in English language.
The base search performed contained the following mesh terms and keywords in the title
and abstract:
(drug utilization[Mesh] OR drug utilization[tiab] OR drug prescriptions[Mesh] OR drug
prescription*[tiab] OR self medication[Mesh] OR self medication[tiab] OR medicin*[tiab])
AND (child[Mesh] OR children[tiab] OR infant[Mesh] OR infant*[tiab] OR newborn[Mesh]
OR newborn*[tiab] OR adolescent[Mesh] OR adolescent*[tiab] OR pediatrics[Mesh] OR
pediatric*[tiab] OR childhood[tiab])
This strategy found 40,674 results in pubmed and 55,329 results in Embase.The search
strategy was further restricted to those studies including maternal or parental informations
and to epidemiological observational type of studies. The following mesh and keywords in
the title and abstract were employed:
(mother*[tiab] OR mothers[Mesh] OR father*[tiab] OR maternal[tiab] OR paternal[tiab] OR
parents[Mesh] OR parent[tiab] OR parents[tiab]) AND (epidemiologic studies[Mesh] OR
epidemiologic[tiab] OR pharmacoepidemiology[Mesh] OR pharmacoepidemiolog*[tiab] OR
pharmaco-epidemiolog*[tiab] OR case-control[tiab] OR retrospective[tiab] OR cohort[tiab]
OR longitudinal[tiab] OR prospective[tiab] OR cross-sectional[tiab]).
After this step 1620 studies were retrieved in Pubmed and 2844 in Embase. Since the
search strategy was very broad we excluded the following category of studies by using
relevant mesh terms and key words:
- editorials, commentaries, case reports, guidelines and lectures;
- studies about congenital abnormalities and birth defects;
- studies about illicit substance abuse, addictive behaviour and other substance-
related disorders;

40
- studies about the vertical transmission of infectious diseases and mother-to-
child transmission of other diseases;
- studies about inpatients, conducted in hospitals, in intensive care unit or
concerning surgical procedures;
- studies concerning alternative or traditional medicine or complementary
therapies;
In order to restrict the search to those studies that investigated an association between the
variables studied, we further refined the search by using the following key words as free
text in the articles' titles and abstracts: association*, associated, relation*, prediction*,
correlation*, determinant*, factor*, comparison*, compare*, influence*. After the
bibliographic search a total of 150 studies were found in Medline database, and 228 studies
were found in the Embase database. A total of 33 studies were duplicates, thus the number
of unique studies retrieved was 345. The titles and abstracts of the studies retrieved were
read, and a total of 7 relevant studies were identified. The full text of the selected studies
was screened, and a manual search of bibliographies was also conducted to identify
additional pertinent studies. The only 1980 study on 50 families was excluded in order to
have a more homogeneous sample of studies in respect to sample size and year of
publication. Finally, six studies were included in the review, Figure 2. The PRISMA guideline
was partially followed for this study, besides the fact that an appropriate checklist was not
found for this kind of studies.
All the references have been collected and analysed using the software Reference
Manager, version 11 (Institute for Scientific Information, Berkeley, California).

41
Figure 2 – Study selection
Embase Medline
228 150
378
Duplicate studies 33
345
After title and abstract screening 338
were not relevant
7
The 1980 study on 50 families
was excluded
6
3. Data extraction
The following data were extracted and tabulated from each study: type of study (e.g.
retrospective, prospective, survey, etc..), number of subjects included, age of children,
which drug class was investigated, the statistical methods, topic of the study (relevant to
the review), the quantification of the outcome of interest. The included studies were too
heterogeneous to permit meta-analysis. Therefore, we qualitatively synthetized the results
according to endopoints of interest.
4. Results
a. Characteristics of studies
Out of 345 studies initially identified six studies were selected. Five out of six studies were
from North-Europe (two from Norway, one from Denmark, Finland, The Netherlands) and

42
one study was from Brazil. Three study were surveys (two cross-sectional and one part of a
prospective study), and three were retrospective cohort studies using prescription and visit
databases as data sources. All the included studies were published after 2010. The total
sample size ranged from 131 to 97.574. The studies included children from widely different
age ranges, Table 2 (ordered by the class of drugs investigated, starting from the studies
investigating all drug classes).
Table 2 – Characteristics of the studies
Author Year Type of study Country Number
of
subjects
Age Topic of interest Significant
association
found
De Jong 2012 Retrospectic
cohort
(database)
The
Netherlands
6,731 ≤5 Parental chronic
prescription of drugs (at
least three times per
year), and recurrent
antibiotic prescription vs
no use of antibiotics (until
five years old) in the
children
Yes, but not
with all the
drug classes
studied
Hameen
-Anttila
2010 Survey Finland 4,121 <12 Parental use of any drug
(prescribed and OTC) and
use of any drug in
children
Yes
Log 2013 Retrospectic
cohort
(database)
Norway 97,574 15-16 Repeated opioid and
analgesic prescriptions in
mothers and adolescents
Yes
Jensen 2014 Survey Denmark 131 6-11 Maternal recurrent
(monthly) use of
analgesics and children
use of analgesics and/or
paracetamol (within 3
months)
Yes. Not for
paracetamol
Bertoldi 2010 Prospectic
cohort
(survey)
Brazil 4,452 11-12 Maternal use of hypnotics
and/or sedatives (month
before the survey), and
use of any drug in
adolescents in previous
15 days.
Yes
Holdo 2013 Retrospectic
cohort
(database)
Norway 59,325 ≤ 3 Parental use of hypnotics
(1 year before pregnancy)
and children chance to
receive alimemazine (0-3
years old)
Yes
43
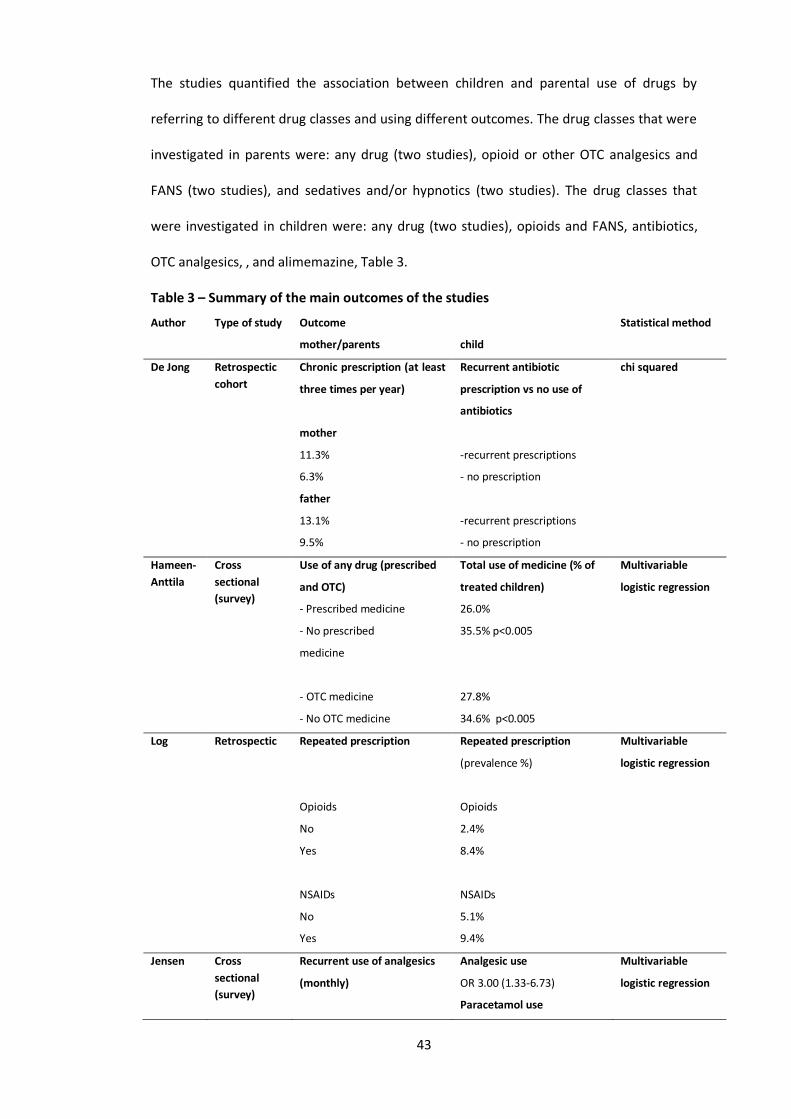
The studies quantified the association between children and parental use of drugs by
referring to different drug classes and using different outcomes. The drug classes that were
investigated in parents were: any drug (two studies), opioid or other OTC analgesics and
FANS (two studies), and sedatives and/or hypnotics (two studies). The drug classes that
were investigated in children were: any drug (two studies), opioids and FANS, antibiotics,
OTC analgesics, , and alimemazine, Table 3.
Table 3 – Summary of the main outcomes of the studies
Author Type of study Outcome Statistical method
mother/parents child
De Jong Retrospectic
cohort
Chronic prescription (at least
three times per year)
mother
11.3%
6.3%
father
13.1%
9.5%
Recurrent antibiotic
prescription vs no use of
antibiotics
-recurrent prescriptions
- no prescription
-recurrent prescriptions
- no prescription
chi squared
Hameen-
Anttila
Cross
sectional
(survey)
Use of any drug (prescribed
and OTC)
- Prescribed medicine
- No prescribed
medicine
- OTC medicine
- No OTC medicine
Total use of medicine (% of
treated children)
26.0%
35.5% p<0.005
27.8%
34.6% p<0.005
Multivariable
logistic regression
Log Retrospectic Repeated prescription
Opioids
No
Yes
NSAIDs
No
Yes
Repeated prescription
(prevalence %)
Opioids
2.4%
8.4%
NSAIDs
5.1%
9.4%
Multivariable
logistic regression
Jensen Cross
sectional
(survey)
Recurrent use of analgesics
(monthly)
Analgesic use
OR 3.00 (1.33-6.73)
Paracetamol use
Multivariable
logistic regression

44
OR 2.54 (0.93-6.92)
Bertoldi Prospectic
cohort
(survey)
Use of hypnotics and/or
sedatives (month before the
survey)
No use
At least one hypnotic or
sedative
Both
Use of any drug (prevalence)
29.4%
38.6%
41.1%
Multivariable
Poisson regression
Holdo Retrospectic
cohort
Past use of hypnotics (1 year
before pregnancy)
Mother, benzodiazepine
Father, benzodiazepine
Mother, hypnotics
Father, hypnotics
Number of hypnotic
prescriptions
None
1
2+
Chance to receive
alimemazine
OR 3.0 (1.4-6.7)
OR 3.1 (1.5-6.5)
OR 2.2 (1.7-2.9)
OR 1.6 (1.1-2.2)
OR = 1
OR = 1.9 (1.4-2.5)
OR = 2.5 (1.8-3.4)
Multivariable
logistic regression
Concerning the statistical methods five studies used multivariable regression analyses (four
studies logistic regression, and one study Poisson regression), while one study used
univariable analysis methods (chi-squared, odd ratios or relative risks). Three studies
reported the outcome of interest in both parents, and three studies reported only maternal
drug prescription or use. An estimation of the main outcome related to the amount of drug
used or prescribed was made in two studies. Two studies investigated recurrent or chronic
drug use or prescription.

45
b. The association between child and parents drug prescription or use
Almost all of the studies retrieved registered a significant association between the children
drug prescription or use, and that of their parents (mother only, or both parents), Table 2.
The study by de Jong et al. [15] investigated the association between the prescription of
any drugs in parents, and antibiotic prescription in children. The authors showed that
mothers whose children recurrently received antibiotic prescriptions, received at least
three prescriptions each year of any drug in 11.3% of cases, while mothers whose children
received no antibiotic until 5 years of age received at least three prescriptions each year in
6.3% of cases (p<0.001). A similar association was observed in fathers (13.1 vs 9.5%;
p<0.001). This study did not use any multivariable regression technique, however it was the
only study that reported the association by drug class separately for mother and father, and
the association for each drug class. Of the 16 drug classes investigated, three resulted in a
significant association in both parents: NSAIDs, antacids, drugs for obstructive airway
diseases. In particular mothers whose children recurrently received antibiotic prescriptions
had a relative risk of receiving NSAIDs 4.7 (2.6-8.6) times higher than those mothers whose
children received no antibiotic. The relative risk for father was lower (1.9; 95% CI 1.0-3.5).
The relative risks for antacids and drugs for obstructive airway diseases were respectively
2.2 (1.1-4.6) and 2.5 (1.6-3.8) for mothers; and 1.8 (1.2-2.7) and 1.6 (1.0-2.4) for fathers.
The relative risk was increased only in mothers concerning the prescription of
antihistamines 3.8 (1.8-8.0), hypnotics and sedatives 3.4 (1.1-10.5), analgesics 3.3 (1.8-6.2),
anxiolytics 2.4 (1.3-4.6), and antidepressants 1.6 (1.1-2.4). The relative risk was increased
only in fathers, but not in mothers, concerning cardiovascular drugs 1.6 (1.0-2.5). A
significant association was not observed for drug classes such as dermatological steroids,
antipsoriatics, laxatives, drugs for diabetes, antiepileptics, antipsychotics, and
psychostimulants.

46
Concerning the use or prescription of any drug, only the study from Hameen-Anttila et al.
[39] investigated this topic at the same time in parents and children by using univariable
and multivariable analysis. In this study children whose parents currently used at least a
prescribed medicine were significantly (χ2; p<0.005) more exposed to a medicine
themselves (35.5%) than children whose parents did not (26.0%). Similar results were
observed for OTC medicine. The authors also used a logistic regression multivariable
analysis adjusting for sex, age, health status, symptoms experienced, illnesses diagnosed by
physician, obtaining that children whose parents currently used at least a prescribed or an
OTC medicine had a higher chance (respectively OR 1.43; 1.21-1.70, and OR 1.20; 1.01-1.44)
to receive a prescribed medicine than children whose parents did not.
Two studies investigated analgesic/NSAIDs use or prescription. Jensen et al investigated
maternal recurrent (monthly) use of analgesics and children use of analgesics and/or
paracetamol (within 3 months) [40]. The study design was a cross-sectional survey, and
they used a multivariable logistic regression to assess the strength of the associations by
adjusting for a number of covariates such as child pain, mother self-rated health, mother
chronic pains, mother use of analgesics, mother chronic disease and general background
information (sex, age, household income, etc..). The chance of the children being treated in
the last three months with analgesics was 3.0 (1.3–6.7) times higher if the mother used
monthly an analgesic, while the association was found not significant if the analysis was
restricted only to paracetamol use (OR 2.5; 95% CI 0.9–6.9). Log et al investigated repeated
opioid and analgesic prescriptions in mothers and adolescents through a retrospectic
cohort database study [41]. This study had a large sample size (about 100,000 individuals)
and used multivariable logistic regression adjusting for mother’s socioeconomic
characteristics and offspring gender. The percentage of repeated prescription opioid users
was higher among adolescents whose mother was repeatedly prescribed opioids (8.4 %)
than among those whose mother was not repeatedly prescribed opioids (2.4 %). A similar
proportion (9.4% vs 5.1%) was observed for the prescription of NSAIDs. The results of the
47
multivariable analysis showed an adjusted OR of 3.1 (2.7-3.6) for opioids, and 1.8 (1.7-2.0)
for NSAIDs.
Two studies investigated hypnotics use.
The study of Bertoldi et al. [42] was a survey investigating maternal use of hypnotics and/or
sedatives in the month before the survey, and use of any drug in their children in the
previous two weeks. The study used a multivariable Poisson regression analysis by using the
chance to receive a drug as the outcome measure. The percentage of children receiving a
drug was 29.4% in children whose mother did not use hypnotics nor sedatives, 38.6% in
children whose mother used either one hypnotic or sedative, and 41.1% in children whose
mother used both. The final results of the multivariable model indicated an higher chance
to receive a drug for children whose mother used either one hypnotic or sedative (OR 1.24;
95% CI 1.06-1.45), or used both (1.40; 95% CI 1.21-1.62). The model was adjusted for
variables such as: gender, household assets index, lifestyle, health status, education,
complication in pregnancy.
Holdo et al. investigated the association between parental prescription of hypnotics (1 year
before pregnancy) and children chance to receive alimemazine (0-3 years old) [17]. The
authors quantified the risk for mother and father separately, and for benzodiazepine and
non-benzodiazepine hypnotics by using a logistic multivariable regression model. The
model was adjusted for mothers’ use of antidepressants, mothers’ smoking for both
genders and mothers’ parity for boys. Children whose mothers used benzodiazepine
hypnotics were 3.0 (1.4-6.7) times more likely to be prescribed alimemazine than children
of mothers who did not. Similar findings were found for fathers (OR 3.1; 95% CI 1.5-6.5).
The same association was investigated for non-benzodiazepine hypnotics and the ORs were
2.2 (1.7-2.9) for mothers, and 1.6 (1.1-2.2) for fathers. The association increased at
increasing number of hypnotics prescriptions received: OR 1.9 (1.4-2.5) for male children
(for females OR 1.7; 95% CI 1.2 to 2.4) whose mother or father received one hypnotic
prescription (compared to no prescriptions of hypnotic), and OR 2.5 (1.8-3.4) for male
48
children (for females OR 1.7; 95% CI 1.1 to 2.6) whose mother or father received two or
more prescriptions.
5. Discussion
The review of the literature showed that the association between offspring and parental
drug prescription or use is not widely studied, in fact, only six recent study were found. The
first study concerning this topic appeared in 1980 on the BMJ and was a very simple
retrospective study, not adjusting for maternal factors or child characteristics [38]. All the
other studies were published in recent years. The six studies were retrospective cohort or
surveys and most of them were from the northern Europe.
The meta-analysis of the data found was not possible because the included studies were
too heterogeneous in respect to methodology, outcome measures, aims and characteristics
of the study population. From the qualitative point of view the review showed that there
was an association between drug use in children and their parents, and also that maternal
use of hypnotics and sedatives was higher if their child previously used any drug. Besides
the overall drug use or prescription, other studies investigated antibiotic drug use in
children as an outcome, finding an association with overall drug use in parents, and another
study found an increased psychotropic drug use.
The association between child antibiotic use and parental drug use by classes in the study
by de Jong et al. showed interesting data, partially confirmed by other studies. There was
an higher use of antibiotics and antiasthmatics in parents of children receiving antibiotics,
compared to those who did not receive any antibiotic before 5 years old. This fact could be
interpreted as an increased susceptibility to infection that is inherited by children, and
conversely, lead to an increased use of antibiotic. Also anti-asthma prescriptions has been
related to antibiotic prescriptions [43]. However the study showed that parental use of
antacids, analgesics, NSAIDs, antidepressant and anxiolitics was associated with child use of

49
antibiotics, while, for example, laxatives, diabetes, antiepileptic drugs and antipsychotics
were not. These drugs’ indications share a common feature: they are all related to stress
and anxiety [15]. These data suggest that the association between parental use of different
drug classes and the use of antibiotics in children may be explained by the fact that these
families are more prone to use medications and, often, to use them earlier. As suggested by
other authors, antibiotic prescription is more common in families with a lower socio-
economic profile, greater concerns about infectious diseases, and increased stress of
fathers [30,31,44-47]. However the scenario is quite complex and this may be true for
antibiotics, but not for other drugs. For example other authors suggested that OTC drugs
are administered more to their children by mothers with more education and higher
household incomes, even if this was not confirmed by the study of Hämeen-Anttila that
showed no effect of these variables [39,48,49].
The higher maternal psychotropic drug use related to the overall child drug use was first
seen in the study by Howie and colleagues in 1980. This study and the one by de Jong et al.
share the fact that they did not adjust for socioeconomic and other potentially relevant
parental variables because such data were not available. The studies from Hämeen-Anttila
and Bertoldi and colleagues adjusted for parental background information and, while they
were different in terms of design and aims, both studies showed that the chance to receive
any drug or hypnotics was increased in mothers of children receiving more drug
prescriptions. Compared to studies that did not adjust for family background information
these two studies obtained much less strong results, yet still significant, in terms of odds
ratios.
The paternal information was reported only in two out of seven studies. Usually the
association with paternal drug exposure was less convincing than the association observed
in mothers. This may be because mothers are usually more involved with the care of the
children, and may have more opportunity to discuss prescription for their children.

50
Besides the different aims and methodologies of the included studies, an important
limitation was the hugely variable sample size among them. The lack of statistical power
was an important limitation of some of the studies, and it hindered the possibility to show
differences and associations in the chance of drug exposure in subgroups. It is the case of
the study by de Jong at al. In fact the number of individuals receiving different drug classes
ranged from 1 to 76, leading to very large confidence intervals. This fact prevented to reach
the significance for some of the drug classes analysed. Also other studies had few overall
individuals included, like the study by Jensen and colleagues. In particular this study was
underpowered to show a significant difference in the child chance of being treated with
paracetamol when the mother used monthly an analgesic, even if the effect size was quite
large (OR=2.5). Another limitation of these studies is the lack of data concerning the
physician that is prescribing drugs, which is absent in all the studies retrieved. Some
physicians prescribe medication more easily than others, and their influence is important in
determining drug prescription in mothers and their children, especially if the physician is
the same, which may be often the case in many countries.
6. Conclusions
The different outcome measures, methodology, and information available used in the
studies retrieved lead to very difficult comparison among the results, and, in turn, to
difficult conclusions. There is indeed evidence of an association between maternal drug use
or prescription in general and children drug use of prescription. The strength of association
is higher for mothers drug use more than it is for fathers, and it is higher for prescription
drugs other than OTC drugs, even if only a minority of studies looked at these outcomes.
Overall the studies looked at different endpoints and, thus, the association found for many
drug classes has been investigated only by one or a few studies. From some of the studies
the hypothesis of an increased susceptibility to infection that could be inherited by
children, and conversely, lead to an increased use of antibiotic seems possible. However
51
there are also indication that mainly the kind of drugs that are related to stress and anxiety
are related to drug use in the offspring, and this could means that some families are more
prone to use medications and, often, to use them earlier.
A study on this topic was not possible to conduct in this PhD thesis because a deterministic
link between mother and child was not possible with these databases. There is a need for
more studies looking at the association between child and parental drug use or prescription
since there is not a standardised methodology to conduct such studies, there are a number
of possible endpoints of interests, and the sample size is often non-sufficiently large. Finally
there is a need for more studies that includes information about cultural, behavioural and
socio-economic backgrounds, since the literature shows that these variables may be among
the most important factors influencing drug use in the family.
52
V. Determinants of drug prescribing: drug utilisation studies in
paediatrics
A. Antibiotic and anti-asthmatic drug prescriptions in Italy: geographic patterns
and socio-economic determinants at the district level
1. Introduction
The prevalence of drug prescription in Italian children is among the highest in Europe and
the most frequently prescribed classes are antibiotics and anti-asthmatics [50].

53
As already described, large qualitative and quantitative differences in antibiotic exposure
between countries have been found [4]. Wide differences have also been observed in
children’s exposure to anti-asthmatics between different countries: prevalence (percentage
of children receiving at least one prescription in a year) ranges from 6.2% in Norway to 19%
in Italy [5]. ß2-mimetics and inhaled steroids are the most frequently prescribed anti-
asthmatics in Italy and their use is, respectively, threefold and fourfold higher than in UK
and in the Netherlands [9]. In Italy the prevalence of anti-asthmatic drugs is much higher
than prevalence of disease, indicating that anti-asthmatics are over-prescribed [9,23].
In Italy the prevalence rate for all drugs prescribed to children and adolescents is 57.3% in
the North, while it is 68.3% in the South [50]. The prescription profile of antibiotics has
been extensively described at the regional level. The highest prevalence rate is found in
southern regions and differences at the LHU level range from 35.6% to 68.5% [6]. Under use
of recommended drugs, such as amoxicillin, is an issue, especially in the southern part of
the country, with an excessive exposure to second choice treatment (i.e. oral and
parenteral cephalosporins) [6]. Notable differences have been demonstrated also within
regions, as is the case in the Lombardy Region, where the prevalence rate for all drugs
ranged from 38.4% in Milano’s LHU to 54.8% in Brescia’s LHU in 2006 [20]. The anti-
asthmatic prescription patterns within Italy have not been investigated in depth, however,
it is known that beclometasone (which is often related to inappropriate or unlicensed use in
Italian children) is the most used anti-asthmatic drug and is most used in the South [8,51].
In this context a comparison between the two most used drug classes (that are
characterised by high inappropriateness of use in Italy) at a district level was made. Three
prominent regions were included: Lombardy, Lazio, and Puglia. The aim of this study was to
evaluate the antibiotic and anti-asthmatic drug prevalence rate at the district level as well
as the influence of territorial setting, including a few socio-economic determinants, on an
Italian child and adolescent outpatient population.

54
2. Methods
a. Data source
Data sources were regional databases routinely updated for administrative and
reimbursement reasons. The databases stored all community prescriptions reimbursed by
the NHS. The study population was composed of 3,301,096 children and adolescents <18
years old (32.5% of the population <18 years old), living in three large Italian regions:
Lombardy (1,616,268 resident children), Lazio (926,015) and Puglia (758,813), from North
to South. The observation period was from 1 January to 31 December 2008 for all regions.
Overall, 193 healthcare districts (45 in Puglia, 55 in Lazio and 95 in Lombardy Region),
participated in the study. The cities of Rome and Milan were considered as a whole and not
as “composed by districts”, because data on such aggregation level were not available. Two
of 95 districts from Lombardy Region were excluded from the analyses because their
paediatric population size was under the first percentile of the distribution of the
population by district. The average number of resident children/adolescents in each district
was 16,932 (ranging from 16,237 in Lazio to 17,375 in Lombardy Region).
All drugs were classified according to the ATC system (Anatomical Therapeutic Chemical
classification system). In this study antibiotics were considered as every drug belonging to
the J01 sub-group and anti-asthmatic as to every drug belonging to the R03 sub-group.
b. Measures
In order to describe the prescription profile the prevalence rate for antibiotics and anti-
asthmatics was calculated at the district level. The prevalence rate was the number of
individuals who received at least one prescription in one year, divided by the number of
children/adolescents.
55
The all-cause hospitalisation rate and hospitalisation rate for asthma as primary or
secondary diagnosis were calculated by district, expressed as the number of patients
admitted to the hospital at least once in one year (ordinary admissions) divided by 1000
resident children/adolescents. Data were retrieved from hospital discharge records, which
include information on primary diagnoses and up to five co-existing conditions such as
secondary diagnoses, procedures performed, date of admission, discharge, and in-hospital
death. Asthma diagnoses were classified according to ICD9 (International Statistical
Classification of Diseases and Related Health Problems) code 493. The number of FPs per
1000 resident children under 12 years old was calculated by district.
Demographic distribution among the three age strata (0-5, 6-11 and 12-17 years old) was
heterogeneous across the districts, possibly influencing prevalence. In order to adjust
prevalence by age a standardisation method was applied. A logistic regression analysis,
using the Lombardy Region database to evaluate the association between drug prescription
and age, was performed [20]. The adjusted odds ratios (see the previous reference for
details) were used as “weight” in the standardisation and were calculated for three age-
strata: ≤5years old (OR=1.77), 6 to 11 years old (OR=1), and 12 to 17 years old (OR=0.70).
By using the age-specific weight and prevalence, the age-corrected prevalence for each
district for antibiotic and anti-asthmatic drugs were obtained [52,53]. All data analyses
were performed using the age-corrected prevalence.
An indirect standardisation method was also applied to prevalence for antibiotics and anti-
asthmatics in all districts in order to calculate the standardised prevalence ratio (SPR). The
indirect standardisation uses age-specific prevalence from the overall population to derive
the numbers of expected cases in the region’s population (i.e. district). SPR indicates
whether the prevalence rate observed at a district level is significantly higher or lower than
what wouyld have been observed in the standard population. Confidence intervals were
calculated with a shortcut method [54]. Districts with a SPR that is significantly lower than 1
56
will be referred to as “lower than expected” and those having a SPR significantly higher
than one as “higher than expected”.
SPR= Tobs/ Texp= Tobs/[Sum age groups (PasNas)]
SPR = Standardised prevalence ratio
Tobs = number of treated children (district).
Texp= number of expected treated children (district)
Pas = age-specific prevalence rate (standard population).
Nas = number of people in the age-specific group (district).
A choropleth map of SPR for antibiotics and anti-asthmatics was elaborated at the district
level [12]. The map was created using the software Arcmap 10.1.
The non-parametric Spearman test was used to evaluate the correlation between antibiotic
and anti-asthmatic prevalence and some determinants including: average annual income
per inhabitant, latitude, number of FPs per 1000 resident children, and hospitalisation rate
for all causes and for asthma.
The ANOVA test and the Bonferroni post-hoc test were used to compare the prevalence
rate by districts in the three regions. The chance of receiving an antibiotic or anti-asthmatic
prescription for children resident in districts with a lower average annual income per
inhabitants (lowest quintile) versus a higher average annual income (highest quintile) was
calculated. The coefficient of variation (CV) was used to assess the variability of district
prevalence among LHUs.
3. Results
a. Regional prescription profile

57
During 2008, 1,861,425 children and adolescents (56.4% of the study population) received
at least one drug prescription. Antibiotic prevalence rate was, on average, 47.9%, ranging
from 44.1% in the Lombardy Region to 57.5% in the Puglia Region.
Table 4 – Average district prevalence (%) and anova test on the prevalence rates grouped
by region
antibiotic drug prevalence (%) anti-asthmatic drug prevalence (%)
range mean ± sd range mean ± sd
Lombardy (95) 34.0-55.1 44.1 ± 4.1 11.7-26.0 17.8 ± 3.3
Lazio (55) 35.6-66.7 49.8 ± 6.7 17.3-32.4 25.1 ± 3.6
Puglia (45) 48.0-67.9 57.5 ± 4.9 17.4-35.5 26.5 ± 4.6
ANOVA test F= 105.26 p< 0.0001 F=112.30 p< 0.0001
Anti-asthmatic prevalence was, on average, 21.4%, ranging from 16.9% in Lombardy to
27.0% in Puglia. The male/female odds ratio for prevalence for antibiotics was, on average,
1.05 (95% CI 1.05-1.06), with no significant differences between regions, while for anti-
asthmatics it was 1.21 (1.20-1.21) with a slightly higher ratio in Lombardy (1.24; CI 1.23-
1.25) compared to Lazio and Puglia (1.18; CI 1.17-1.19).
b. Prescription profile at the district level
The age-corrected prevalence for all drugs ranged from 41.0% to 74.7%, from 34.0% to
67.9% for antibiotics and from 11.7% to 35.6% for anti-asthmatics. The age-corrected and
crude prevalence differed significantly only in a few districts that had a small population
size. The ANOVA and Bonferroni tests showed a significant difference in the prevalence of
antibiotic and anti-asthmatic drugs in districts across the three regions (Table 4; p<0.001),

58
with the exception of anti-asthmatic prevalence in Lazio and Puglia (p=0.19). Prevalence
was much lower in Lombardy Region compared to the other two regions, considering both
antibiotics and antiasthmatics.
SPR ranged from 0.70 to 1.44 for antibiotic drugs and from 0.54 to 1.72 for anti-asthmatic
drugs, Figure 3. In Lombardy 69% of the districts (66/93) had a SPR lower than expected for
both anti-asthmatics and antibiotics. On the contrary, in Puglia, no district had a SPR lower
than expected and in 82% of them (37/45) the SPR was higher than expected. Only a few
districts in Puglia had an antibiotic and antiasthmatic prevalence comparable to those in
Lombardy Region. Large differences were observed in the variability of district prevalence
within each LHU: CV ranged from 0.01 to 0.15 for antibiotics and from 0.03 to 0.22 for anti-
asthmatics.
The median average annual income per inhabitant was 7,187 € (interquartile range, IQR =
6,440-8,262 €) in the high-prevalence districts (districts having both antibiotic and anti-
asthmatic drug prevalence over the mean plus one SD), while it was 15,360 € (IQR = 13,358-
16,837 €) in the low-prevalence districts (prevalence under the mean minus one SD).
Figure 3 - Choropleth map of the standardised prevalence ratio (SPR) at the district level
for antibiotics and anti-asthmatics. The SPR indicates whether the prevalence observed in
each district is significantly higher (SPR>1) or lower (SPR<1) than expected by using a
standard population as a reference (the overall study population).

59
c. Determinants

60
The Spearman test scored a significant positive correlation between antibiotic and anti-
asthmatic prevalence at the district level (rS = 0.77; p< 0.001). The within-region correlation
was significant, but less strong, especially in Lombardy (rS = 0.57; p< 0.001) and Puglia (rS =
0.50; p< 0.001).
There was a significant inverse correlation between average annual income per resident
and both the prevalence of antibiotics (rS = -0.77 p<0.001) and anti-asthmatics (rS = -0.73
p<0.001). Children resident in districts in the lowest quintile of annual income per resident
had a higher chance (highest vs lowest quintile) of receiving an antibiotic (OR 1.75, 95% CI
1.74-1.77) or anti-asthmatic drug (OR 1.56, 95% CI 1.55-1.57), Table 5.
The correlations between prevalence of antibiotic and anti-asthmatic drugs toward other
determinants are reported in Table 6. Latitude was inversely correlated with antibiotic and
antiasthmatic prevalence. There was not a correlation between hospitalisation for asthma
and antiasthmatics prevalence. The number of FPs per 1000 inhabitants was not relevantly
correlated with prevalence.
Table 5 – Analysis of the correlation between antibiotic (J01) and anti-asthmatic (R03)
prevalence versus average annual income per resident at the district level, numbers in
brackets are confidence intervals.
prevalence average annual income at the area level

61
overall lowest vs highest quintile
rS OR
Lombardy
antibiotics -0.27 1.23 (1.22-1.24)
anti-asthmatics -0.46 1.25 (1.24-1.27)
Lazio
antibiotics -0.55 1.31 (1.30-1.33)
anti-asthmatics -0.38 1.16 (1.15-1.18)
Puglia
antibiotics -0.34 1.29 (1.27-1.30)
anti-asthmatics -0.02* 1.03 (1.02-1.05)
Total
antibiotics -0.77 1.75 (1.74-1.77)
anti-asthmatics -0.73 1.56 (1.55-1.57)
*non-significant p-value (>0.05)
Table 6 – Correlation between prevalence of antibiotic and anti-asthmatic drugs vs other
determinants at the district level
prevalence vs: rS p-value
Latitude (South to North)
antibiotics -0.71 <0.001
anti-asthmatics -0.72 <0.001
Hospital admission rate
antibiotics* 0.33 <0.001
anti-asthmatics° 0.03 0.65
FPs per 1000 inhabitants
antibiotics -0.19 0.01
anti-asthmatics -0.02 0.80
*all cause hospitalisation rate
° hospitalisation rate for asthma
4. Discussion
62
This is the first Italian study evaluating antibiotic and anti-asthmatic prescriptions at the
district level in three large Italian regions. The result concerning antibiotics was similar to
what was observed, at the LHU level, in a previous study [6], although prevalence rate
ranges at the district level were wider than those found in the previous study (e.g. in
Lombardy the range was 34.0-55.1% at the district level, while it was 36.3-50.6% at the LHU
level). In particular, this study underlines the fact that, even in settings characterised by low
prevalence (i.e. Lombardy), there are districts with a higher prevalence than expected and
that variability is often very high even among districts within the same LHU. The use of anti-
asthmatics was found to be higher than in a previous study in children (same age group) in
the North [23], while it was similar to what was observed in another Italian paediatric
population [55].
The current study shows that the use of anti-asthmatics, as well as antibiotics, is higher in
the South and that there is a correlation between anti-asthmatic and antibiotic use at the
district level. In particular, the SPR (for both antibiotics and anti-asthmatics) increases from
North to South. Another study already showed that Italian children living in the South have
a greater chance of receiving a prescription of any drug compared to their counterparts
living in the rest of the country [8]. Since antibiotics and anti-asthmatics are the most
commonly prescribed drugs in Italy this finding is in part expected and may mean that the
geographical differences observed may not be linked to a particular class of drugs, but to
other, independent factors.
The association between asthma and antibiotic use in children has already been shown in
the literature [56-58]. The relationship between anti-asthmatic and antibiotics prescription,
however, is a quite different phenomenon. In fact, particularly in Italy, anti-asthmatic drug
consumption in an outpatient setting is not a good disease indicator, since the
inappropriate use of this drug class is very high [9]. The unreliability of anti-asthmatic
consumption as a disease indicator in this setting is evident if one looks at its association

63
with hospitalisations for asthma: they are unrelated. For this reason the correlation among
the use of these two drug classes probably is thought to be due to a generalised
inappropriate use of drugs and not to the asthma-antibiotic use link.
Concerning income, children living in low income districts have a higher chance of receiving
a prescription of an antibiotic or an anti-asthmatic. This trend persists within regions/areas
characterised by different prescribing volumes. The finding that there is a twofold absolute
difference in the average annual income per inhabitant between the high and the low
prevalence districts is striking. Similar findings have been recently found in Germany [59]
and in Switzerland as well [60]. In these countries, as in Italy, the cost of antibiotic and anti-
asthmatic drugs is, at least partially, reimbursed. In these cases, given the methodology
used, the confounding role of out of pocket drug use cannot be excluded [8].
Concerning latitude, the prevalence is higher in southern Italy, but this is not true in
Germany, where antibiotic use is higher near the upper-western border and the far north.
The inverse correlation between latitude and antibiotic/anti-asthmatic drug prescription is
valid in Italy, where the North-South socio-economic polarisation is well known, but not
necessarily in other countries. Another study on antibiotic prescriptions found that in
Lombardy there is a West-East geographic trend more than a North-South one [12]. In this
study, latitude and average annual income were both related to prevalence of antibiotics
and anti-asthmatics (the two indicators are co-llinear) but the hypothesis is that income is a
more relevant variable, because, when looking at prescriptions within regions of different
income levels, a similar, even if weaker, association persists.
A plethora of other factors possibly associated with drug prescription to children (mainly
antibiotics) have been considered in a number of international and Italian studies
[13,14,61-65]. Education and income level are factors known to indirectly affect individual
health. Various studies agree in demonstrating that poor and less educated people have

64
inadequate access both to primary prevention and to early diagnosis [66]. These facts could
also reflect a lower quality of children’s healthcare. A lower educational level could also
affect the understanding of the therapy’s importance and, indirectly, how much the
prescriber perceives the parental expectation of a prescription, the latter of which is a
known factor influencing the physician’s decision [13]. It has been demonstrated that
parents of children receiving many antibiotics use more medicines themselves [15]. These
data reinforce the hypothesis that area income deprivation is only a proxy of other linked
deprivations, which are probably more relevant or more directly affect the amount of
prescriptions in children. In particular educational deprivation, which is very often related
to income deprivation [67], may have, at least in part, a causal role in the amount of
medicines prescribed to children. The role of the prescriber is also particularly important: in
Lombardy, in the highest prevalence areas, a higher number of FPs classified as high
prescribers was found [12].
Ultimately, the current study shows that prescribing distribution at a micro-level is
associated with socio-economic inequalities, even if the Italian NHS fully reimburses
antibiotics and anti-asthmatics. A recent study in the same setting (Lombardy Region)
showed that a local educational intervention on FPs was able to improve the prescription
profile [22]. If education (of families and physicians) is one of the most important factors
affecting prescribing, policy makers should take into account the differences highlighted in
order to plan educational interventions to reduce prescription and implement a more
rational drug use.
Finally, as a methodological issue, this study underlines the importance of the evaluation of
epidemiological outcomes also in small census areas. The prescription profile of a region
cannot be representative of the national pattern. On the other hand, the profiles observed
at the national and regional levels are not applicable at the district level. From this point of
65
view, the local context influences drug prescriptions and its role should be investigated as
part of the monitoring of drug utilisation.
a. Strengths and weaknesses
This study is able to provide more robust data on the association between income and
prescription of reimbursed drugs to children by including an analysis of data at the district
level. The entire child/adolescent population of three regions, representative of different
geographical and economic settings, was included, avoiding selection bias (e.g. different
social or educational backgrounds). The prevalence by age, which is the most important
factor associated with a higher drug prescription in children, was standardised in this study.
However, some limitations must be considered.
Since reimbursement data were analysed, it was not possible to ascertain adherence to
prescribed treatments. This is a limitation because other studies on adult patients reported
low adherence rates in primary care [68], even if in paediatric patients the phenomenon
may be limited. The use of aggregated data precluded the application of more appropriate
statistical methods such as logistic regression analysis. Furthermore, data on out of pocket
drug use was not available for antibiotics and anti-asthmatics (although they are fully
reimbursed). Out of pocket drug use could potentially bias the relationship between higher
anti-asthmatic and antibiotic drug consumption and lower income as described elsewhere
[8]. However, it is likely that the phenomenon is limited for reimbursed drugs.
5. Conclusions
The current study highlights anti-asthmatic and antibiotic prescription differences at the
district level showing wide local differences and specificities that were not demonstrable in
other studies. Anti-asthmatic and antibiotic drug prescribing are related and their use is
higher in the South of Italy. The data confirm the presence of an inverse association
between annual income and the prevalence of antibiotic and anti-asthmatic drugs also at

66
the district level. Local socio-economic inequities can concur in prescribing distribution and
must be considered when planning educational interventions to reduce prescription and
increase rational drug use.
B. A multiregional study about psychotropic medicine prescriptions
67
1. Introduction
Paediatric psychopharmacology has developed rapidly over the last few decades. Large
randomised clinical trials focused on the treatment of a spectrum of psychiatric illnesses -
such as ADHD [69], bipolar mania[70], behavioural problems associated with autism [71],
and depressive [72] and anxiety disorders [73] – have been published, and the emphasis on
pharmacological treatments has grown considerably.
As an increasing number of young patients began to receive psychotropic drugs, attention
to the safety profile of such drugs in paediatric patients increased. In 2004 the US Food and
Drug Administration (FDA) issued a safety warning – the so called “black box” warning -
about the twofold higher risk of suicidal behaviour in adolescents receiving antidepressants
[74]. Other important safety issues emerged, such as the increasing awareness of adverse
metabolic effects of second-generation antipsychotic medicines [75], and the abusive
potential of psychostimulants [76,77]. Since then, paediatric psychopharmacology has
become an increasingly relevant component of youths’ healthcare, and several drug
utilization studies have been performed with the aim to evaluate psychotropic drug use and
prescribing.
Large variations were found in the psychotropic prevalence among youths worldwide [26,
78-85]. Prevalence in Italy is lower (about 3‰)[78] than in Europe and in the US (up to over
6%)[26,79]. The same general trend is noticeable in the different classes of psychotropic
medications. For example, the prevalence of antidepressants ranges from over 2% in US
[79] and 1.7% in Denmark [80] to 2.4‰ in Italy [78]. Concerning drugs used for ADHD the
prevalence ranges from 2 to 4% in the US and Iceland, and from 1 to 2% in Australia,
Canada, Israel, and the Netherlands [81-85]. A similar trend was observed for
antipsychotics: they are rarely prescribed in Italy (0.7 ‰) [78], while their prevalence is
about 1% in the US [79].
Large differences between countries are also present in terms of policy and resources for
care and services for paediatric mental health. Only 1 in every 4 cases has access to services

68
in high income countries [86], while in low and middle income countries the rate can be 20
times lower [87]. These factors, together with many others, contribute to the wide gap
observed in treatments worldwide, where in some countries (especially in Europe) children
are more likely to be pharmacologically undertreated with respect to their clinical needs,
while in the US, where such drugs are overprescribed, the opposite is true [88,89]. There is
also evidence that the chance of receiving an antidepressant may vary within the same
country [90], where policy and organization of services are expected to be more
homogenous. In this context it is essential to monitor psychotropic drug use in youths.
Data on paediatric psychotropic medication prescription and use in Italy are sparse and not
updated [27,78,91]. In fact, the only two studies published in the last five years reported
data of a single region or LHU [27,91], and the only study representative of the Italian
paediatric population reported 2004 data [78]. Data concerning the psychotropic drug
prescription in the general population showed that there are differences in the amount of
prescriptions filled at the regional level, and this could reflect differences in the prevalence
of psychiatric disorders, and also in the access to psychiatric services [92]. Since a
continuous monitoring and surveillance on paediatric psychotropic drug prescription is
essential, we analysed the prescription of psychotropic drugs from 2006 to 2011. In order
to assess for the first time differences among regions, we included seven Italian regions
belonging to different geographical areas, providing a large - half of the paediatric
population - and representative sample of the Italian child and adolescent population. Since
there could be differences in the epidemiology of psychiatric disorders, we also collected
the hospital admission rates at the regional level as a proxy of severe psychiatric illness in
order to compare them to the prevalence of psychotropic drugs.
2. Methods
a. Data source
69
Data sources were regional databases routinely updated for administrative and
reimbursement reasons. The databases store all outpatient (i.e. outside the hospital)
prescriptions reimbursed by the NHS.
In November 2013, Italian researchers who were part of the ENCePP® (European Network
of Centres for Pharmacoepidemiology and Pharmacovigilance) network [93] were asked to
participate in the study.
Seven of the eleven regions contacted participated in the study: Veneto, Lombardy, Friuli
Venezia Giulia, Emilia Romagna, Abruzzo, Lazio and Puglia (69 LHUs). The centres involved
have a long-standing experience in pharmacoepidemiological studies, and in the analysis of
health administrative databases. Each researcher provided the prescription data concerning
psychotropic drug prescriptions for the paediatric outpatient population (<18 years old) in
his own region, through an agreement with the Regional Ministry of Health. For the Veneto
Region data were provided for 15/22 LHUs (597,596 children and adolescents, 77% of the
regional population), which were those included in the CINECA consortium, a National
Interuniversity Consortium constituted with the purpose of providing a friendly and
efficient database that collects and monitors the GPs’ prescriptions [78]. All regions
provided data from 2006 to 2011. For the Abruzzo Region, data for years 2010-2011 were
provided.
The study population in 2011 was composed of 5,019,564 youths less than 18 years of age
living in the regions participating, representing 50.2% of the Italian population of this age.
The regions were representative of different geographic areas: North of Italy (Friuli Venezia
Giulia, Lombardy, Emilia Romagna and Veneto, 71.2% or the North population), Centre
(Lazio, 49.9%), and South (Puglia and Abruzzo, 36.5%). The seven regions had different
economic backgrounds. In particular the mean annual income per resident in 2011 in Italy
was 12,159 €, and ranged from 8,382€ (Puglia) to 15,502€ (Lombardy), source: Italian
ministry of Economy and Financial Affairs.
Aggregated, anonymous data were provided so ethical approval was not required.

70
Psychotropic drugs were defined according to the World Health Organization categories
and comprised the following subgroups of the Anatomic Therapeutic Chemical (ATC)
classification system: antipsychotics (N05A), antidepressants (N06A) and centrally acting
sympathomimetics (ADHD medications, N06BA). Anticonvulsants (N03 subgroup) were
excluded because in children they are mainly used to treat epilepsy, while anxiolytics,
sedatives, and hypnotics were excluded because they are not reimbursed by the Italian
NHS, and thus not retrieved in the database, as stated above.
Data concerning hospital admissions for psychiatric diagnoses were also collected at the
regional level as a proxy of severe psychiatric illness in order to compare them to the
prevalence of psychotropic drugs. To this purpose, the following ICD-9 codes were
considered: 290 to 319.
b. Data analysis
For 2011 the following outcome measures were calculated by age and gender for the
overall sample and for each region:
- Prevalence of current users, defined as the number of individuals who received at
least one psychotropic drug prescription per 1,000 youths;
- Incidence of new users, defined as the number of people who received a
psychotropic drug prescription for the first time (did not receive it during the
previous year) per 1,000 youths;
- prescription rate, defined as the number of prescriptions per youth treated with at
least one psychotropic drug in one year;
- hospital admission rate, defined as the number of resident youths admitted to
hospital due to any psychiatric illness at least once in one year per 1,000 youths.
For the 10 most prescribed psychotropic drugs in 2011 the prevalence was calculated for
the following age strata: 0-5, 6-11, and 12-17 years old. Furthermore, the percentage of

71
treated youths (number of children and adolescents who received at least one prescription
of a certain drug, divided by the number of children that received any psychotropic drug
prescription during one year) was calculated for each active substance.
For 2011 the main indicators (not stratified by age and gender) at the LHU level were
retrieved. A choropleth map of prevalence at the LHU level was created using the software
Arcmap version 10.1. The prevalence values were categorised into three classes calculated
on the basis of the mean±1 sd.
The temporal utilization trend of psychotropic drugs in youths in the period 2006–2011 was
analysed. Prevalence, incidence, prescription, and hospital admission rates were calculated
for all psychotropic drugs and for antipsychotics, antidepressants, and ADHD medications
separately. The 5-year cumulative incidence of psychotropic medications was calculated for
the 2007-2011 period.
The coefficient of variation (CV) was used to assess the variability in prevalence reported by
LHUs among regions. The Welch’s ANOVA and the Tukey post-hoc tests were used to
compare the prevalence reported by LHUs in the included regions. The chi-squared for
linear trend (χ2 trend) test was used to investigate the presence of a trend in the
prevalence of psychotropic, antidepressant, antipsychotic and ADHD medications over the
years in the whole population studied and in each region. The area under the prevalence–
time curve (AUC) was calculated according to the linear trapezoidal rule for the intervals: 0-
5, 6-11, 12-17 years in respect to gender. The Pearson test was used to investigate the
correlation between prevalence and prescription, hospital admission rates, latitude,
longitude and average annual income at the LHU level. A p-value <0.05 was considered
statistically significant. Statistical analysis was performed using SAS software, version 9.2
(SAS, Cary, NC, USA).
3. Results
a. Overall study population
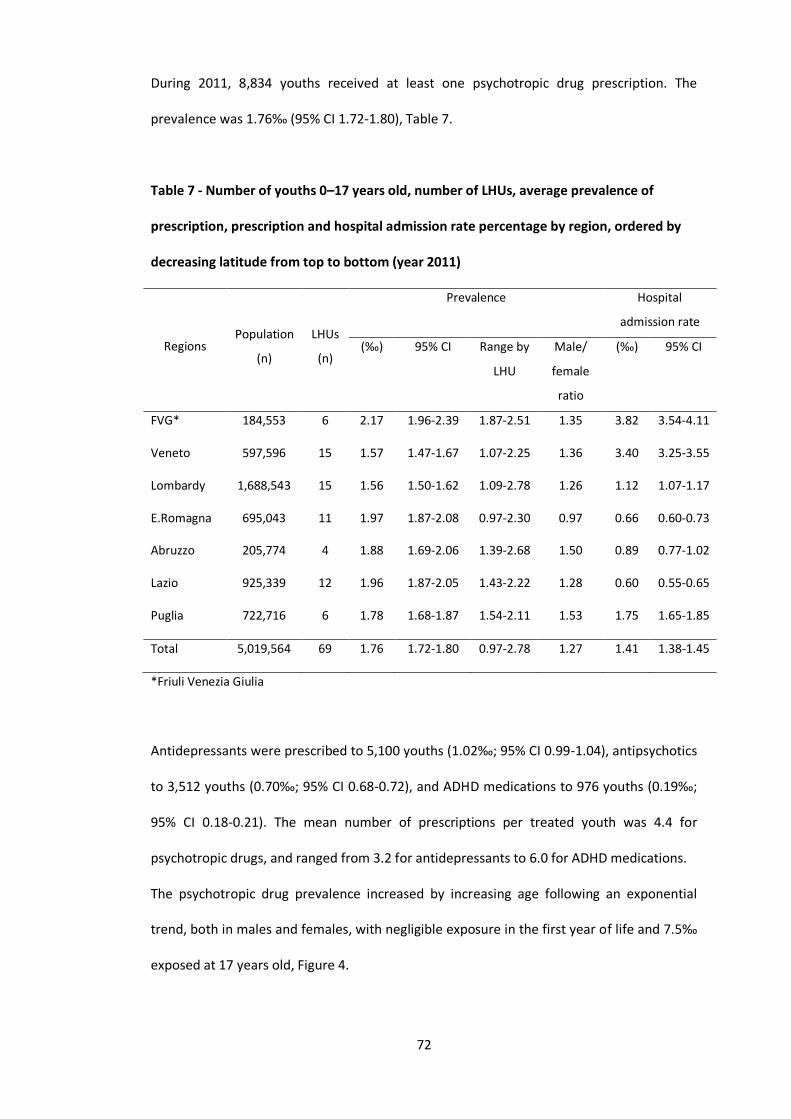
72
During 2011, 8,834 youths received at least one psychotropic drug prescription. The
prevalence was 1.76‰ (95% CI 1.72-1.80), Table 7.
Table 7 - Number of youths 0–17 years old, number of LHUs, average prevalence of
prescription, prescription and hospital admission rate percentage by region, ordered by
decreasing latitude from top to bottom (year 2011)
Regions Population
(n)
LHUs
(n)
Prevalence Hospital
admission rate
(‰) 95% CI Range by
LHU
Male/
female
ratio
(‰) 95% CI
FVG* 184,553 6 2.17 1.96-2.39 1.87-2.51 1.35 3.82 3.54-4.11
Veneto 597,596 15 1.57 1.47-1.67 1.07-2.25 1.36 3.40 3.25-3.55
Lombardy 1,688,543 15 1.56 1.50-1.62 1.09-2.78 1.26 1.12 1.07-1.17
E.Romagna 695,043 11 1.97 1.87-2.08 0.97-2.30 0.97 0.66 0.60-0.73
Abruzzo 205,774 4 1.88 1.69-2.06 1.39-2.68 1.50 0.89 0.77-1.02
Lazio 925,339 12 1.96 1.87-2.05 1.43-2.22 1.28 0.60 0.55-0.65
Puglia 722,716 6 1.78 1.68-1.87 1.54-2.11 1.53 1.75 1.65-1.85
Total 5,019,564 69 1.76 1.72-1.80 0.97-2.78 1.27 1.41 1.38-1.45
*Friuli Venezia Giulia
Antidepressants were prescribed to 5,100 youths (1.02‰; 95% CI 0.99-1.04), antipsychotics
to 3,512 youths (0.70‰; 95% CI 0.68-0.72), and ADHD medications to 976 youths (0.19‰;
95% CI 0.18-0.21). The mean number of prescriptions per treated youth was 4.4 for
psychotropic drugs, and ranged from 3.2 for antidepressants to 6.0 for ADHD medications.
The psychotropic drug prevalence increased by increasing age following an exponential
trend, both in males and females, with negligible exposure in the first year of life and 7.5‰
exposed at 17 years old, Figure 4.

73
Figure 4 – Prevalence (per 1,000) by age and gender (Male: Female: ) of overall
psychotropic drugs (A), antidepressants (B), antipsychotics (C), and ADHD medications
(D).
While antidepressants were the most prescribed psychotropic drug class in the overall
population and in females (AUCN06A/all psychotropic drugs = 0.76), antipsychotics were the most
prescribed psychotropic drugs in males (AUCN05A/all psychotropic drugs = 0.48). The prevalence of
psychotropic medications was similar for males and females up to 5 years old, was higher
in males in the 5-15 year range, and was higher in females afterward. Males were more
exposed to psychotropic drugs than females (AUC0–17 male/female = 1.23), particularly in
the school age (AUC6–11 male/female= 2.52). The disproportion was particularly evident for
ADHD medications (AUC0–17 male/female = 5.06) and antipsychotics (AUC0–17 male/female =
2.16). Females were more exposed to antidepressants than males (AUC0–17 male/female =
0.74). With antidepressants, the trend by gender and age was very similar that of
psychotropic drugs, and began to increase in pre-adolescents, with females receiving more
antidepressants than boys after 15 years of age (fig.4). The prevalence of antipsychotics

74
began to increase in school-aged children, with males being more exposed than females at
any age. For ADHD medications the highest prevalence was in nine year old children,
particularly males, while the female prevalence was negligible at any age (fig.4).
The incidence of psychotropic drug prescriptions was 1.03‰ (95% CI 1.00-1.06), with no
significant differences between males and females (AUC0–17 male/female = 1.02; 95% CI
1.00-1.05). The incidence of antidepressants was 0.69‰ (95% CI 0.67-0.72), while that of
antipsychotics was 0.32‰ (95% CI 0.31-0.34), and that of ADHD medications 0.08‰ (95%
CI 0.07-0.09). The 5-year cumulative incidence of psychotropic medications in the 2007-
2011 period was 4.29‰, with a total of 26,142 incident cases.
The hospital admission rate was 1.41‰ (95% CI 1.38-1.45). In 2011, a total of 20 different
drugs were among the list of the ten most prescribed psychotropic drugs in the
participating regions, Table 8. The most prescribed psychotropic drug was risperidone
(20.6% of children treated with psychotropic drugs), followed by sertraline (18,0%), and
methylphenidate (7.1%).
Table 8 - The prevalence per 10.000 resident youths of the ten most prescribed
psychotropic drugs in 2011 by age group. Drugs not approved for use in each age group
are reported in italic.

75
0-5 6-11 12-17
Drug * Drug * Drug *
Trazodone 0.310 Risperidone 3.31 Sertraline 8.77
Risperidone 0.240 Methylphenidate 2.12 Risperidone 7.70
Escitalopram 0.181 Sertraline 1.01 Fluoxetine 3.37
Citalopram 0.158 Atomoxetine 0.63 Paroxetine 3.30
Sertraline 0.135 Periciazine 0.36 Escitalopram 2.26
Venlafaxine 0.111 Pimozide 0.36 Aripiprazole 2.24
Duloxetine 0.100 Amitriptiline 0.34 Citalopram 1.78
Paroxetine 0.082 Aripiprazole 0.23 Methylphenidate 1.57
Periciazine 0.053 Haloperidol 0.20 Olanzapine 1.17
Quetiapine 0.041 Chlorpromazine 0.18 Atomoxetine 0.66
* x 10,000
b. Regional profile
During 2011, the prevalence of psychotropic drugs ranged from 1.56‰ (95% CI 1.50-1.62)
in the Lombardy Region to 2.17‰ (95% CI 1.96-2.39) in the Friuli Venezia Giulia Region,
Table 7. At the LHU level the prevalence ranged from 0.97 to 2.78‰, Table 7, Figure 5. The
CV of regional prevalence ranged from 0.13 in the Friuli Venezia Giulia Region to 0.29 in the
Abruzzo Region. The number of prescriptions per youth ranged from 3.87 in Emilia
Romagna, to 5.36 in Abruzzo. The incidence was more homogenous and ranged from
0.86‰ (95% CI 0.78-0.93) in the Veneto Region, to 1.27‰ (95% CI 1.20-1.35) in the Lazio
Region. The hospital admission rates ranged from 0.60‰ in Lazio (95% CI 0.55-0.65) to
3.83‰ (95% CI 3.54-4.11) in Friuli Venezia Giulia.
Figure 5 – Choropleth map of the participating regions and LHUs. The values of
prevalence were categorized into three classes calculated on the basis of the mean±1 sd
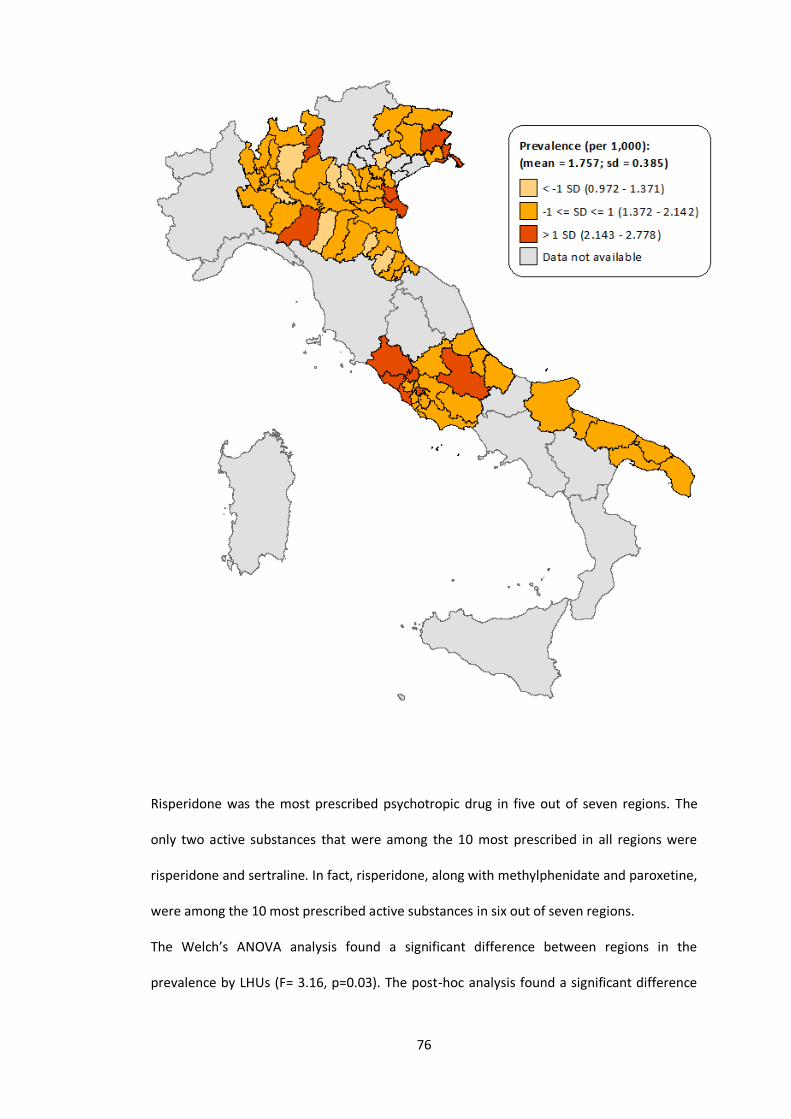
76
Risperidone was the most prescribed psychotropic drug in five out of seven regions. The
only two active substances that were among the 10 most prescribed in all regions were
risperidone and sertraline. In fact, risperidone, along with methylphenidate and paroxetine,
were among the 10 most prescribed active substances in six out of seven regions.
The Welch’s ANOVA analysis found a significant difference between regions in the
prevalence by LHUs (F= 3.16, p=0.03). The post-hoc analysis found a significant difference

77
between the prevalence of Friuli Venezia Giulia and Emilia Romagna regions (mean
difference= 0.57‰; 95% CI 0.01-1.12). There was no significant correlation between
prevalence and prescription rates (RP=0.05; p=0.66), latitude (RP=-0.10; p=0.42), longitude
(RP=0.17; p=0.16), average annual income (RP=0.10; p=0.42) or hospital admission rates
(RP=0.21; p=0.08).
c. Temporal trend
The overall prevalence of psychotropic drug prescription from 2006 to 2011 was stable, and
no significant trend was found (χ2t= 0.001 p=0.97). There was a slight increase in
antipsychotic prevalence (χ2t= 32.4; p<0.001) from 0.60 to 0.69‰, and a decrease in
antidepressants prevalence (χ2t= 187; p<0.001) from 1.26 to 1.02‰. An increase was
observed in ADHD medication prevalence (χ2t= 1065; p<0.001), from 0.01 to 0.19‰, Table
9.

78
The incidence of new psychotropic drug users decreased from 2006 to 2011 (χ2t=60,3
p<0,001) from 1.15 to 1.03‰. The same trends were observed in the incidence of new
Tab
le 9
- P
reva
len
ce a
nd
inci
den
ce o
f p
sych
otr
op
ic m
ed
icin
e p
resc
rip
tio
ns
in y
ou
ths
<18
yea
rs, 2
00
6 t
o 2
01
1
20
06
N=4
,569
,190
2007
N=4
,64
1,8
57
2008
N=4
,68
8,0
05
2009
N=4
,75
2,1
54
2010
N=4
,99
1,4
96
20
11
N =
5,0
19
,56
4
p-v
alu
e
An
tip
sych
oti
cs
Pre
vale
nce
0.
60
0.62
0.
65
0.65
0.
65
0.6
9 <0
.001
Inci
den
ce
0.28
0
.32
0
.31
0
.31
0
.30
0
.32
0.0
4
An
tid
epre
ssan
ts
Pre
vale
nce
1.
26
1.2
2
1.1
4
1.1
6
1.0
3
1.0
2 <0
.00
1
Inci
den
ce
0.92
0
.89
0
.81
0
.84
0
.72
0
.70
<0.0
01
AD
HD
med
icat
ion
s
Pre
vale
nce
0.
01
0.0
4
0.1
1
0.1
4
0.1
6
0.1
9 <0
.00
1
Inci
den
ce
0.00
0
.03
0
.08
0
.06
0
.06
0
.08
<0.0
01
An
y p
sych
otr
op
ic
Pre
vale
nce
1.
74
1.7
4
1.7
6
1.8
1
1.7
0
1.7
5 0
.97
Inci
den
ce
1.15
1
.18
1
.14
1
.15
1
.02
1
.03
<0.0
01
Val
ues
are
exp
ress
ed a
s p
er 1
,000
ch
ildre
n; (
nu
mb
er o
f ch
ildre
n).

79
users considering antidepressants, while an increase was observed in antipsychotics and
drugs for ADHD.
There was a significantly increasing trend in psychotropic drug prevalence in Friuli Venezia
Giulia, from 1.68 to 2.17‰, and Veneto, from 1.30 to 1.57‰ (respectively χ2t= 14.3 and
χ2t=31.6; p<0.001), while a slightly decreasing trend was present in Emilia Romagna (χ2
t=
5.27 p=0.021) with the prevalence shifting from 2.16 to 1.98‰. The prevalence observed in
the other regions did not show significant trends.
The hospital admission rate decreased slightly (χ2t= 5.30 p=0.02) from 1.49 in 2006 to 1.44
in 2011.
4. Discussion
This is the largest pharmacoepidemiological study evaluating psychotropic drug
prescription in the Italian paediatric population, including multiple regions and covering
half of the Italian population of this age.
Considering the 2011 data, the overall prevalence found was very low compared to those
from epidemiological studies in most other countries [26,79,81,82,90,94-107]. In particular,
prevalence of prescription of stimulants in Italy were much lower than that of other regions
of the world. Stimulants were prescribed to 0.19/1000 children less than 18 years in Italy,
and to 42/1000 children in the United States who were commercially insured. Prevalence of
prescription of other medications in other countries to children (<18 years) is shown in
Table 10.

80
Table 10 - Prevalence (‰) of antidepressants (AD drugs), antipsychotics (AP drugs), and ADHD
medications observed in ≤ 18 years old in western countries in the last ten years. Data concerning
Italian children are reported in bold characters.
Country AD drugs AP drugs ADHD drugs
USA 27-38 (New England 2007-2010)1
16 (Mid-Atlantic states, Medicaid, 2012)
7-26 (2007-2010)1
49.5 (2008) 30.5 (2013)
42-77 (2007-2010)1
UK 11 (2012) 4.9 (2015)3
0.77 (2005) 9.2 (2008)2 7.4 (2008)4
5.11 (2013)5
Germany 4.8 (2012) 2 (2012) 2.1 (2011)
3.2 (2012) 3.1 (2012) 2.6 (2011)
19.1 (2012)
The Netherlands 2.0 (2005) 6 (2012)
6.8 (2005) 21 (2007)6
France 3 (2010) 3 (2010) 4.9(2013)7
2 (2010)
Denmark 2.67 (2010) 10 (2012)
2.05 (2010) 7.29 (2010) 10 (2008-2012) 6
Iceland n.a. n.a. 12.5 (2007) 33 (2008-2012) 6
Finland 5.93 (2005) n.a. 1.2 (2007) 5 (2008-2012) 6
Sweden n.a. n.a. 2.5 (2007) 12 (2008-2012) 6
Norway 7.0 (2010) 5.9 (2014)
1.9 (2014) 4.7 (2007) 14.8 (2014) 14 (2008-2012) 6
Canada 15.4 (2007) 7.4 (2008) 21 (2007) 38 (2011) 7
Ireland 2.61 (2008)5 n.a. 8.63 (2011) 1
Japan 4.2 (2008-2010) 8.0 (2008-2010) 3.0 (2008-2010) 5
Israel n.a.
n.a. 49 (2011) 6
Italy 1.02 (2011) 0.70 (2011) 0.19 (2011) 1 prevalence for commercially-insured patients (lower value) and Medicaid-insured patients (higher value) 2 6-12 years old 3 3-17 years old 4 13-17 years old 50-15 years old 6 6-17 years old 7 1-24 years old

81
Several reasons for the different prevalence of psychotropic prescriptions between
countries have been proposed in the literature, the most common of which are differences
in policy, regulation, and access to mental health services [88,89]. Other important factors
are cultural (i.e. perceived misuse of psychotropic medication in youths, possible adverse
effects, etc..), but also include the role of non-pharmaceutical alternatives, and, ultimately,
the uncertainty of indications (i.e. difficulty in deciding where to place cut-offs for the
prescription of a drug) [89]. The observed, quite homogeneous and limited, prescription of
psychotropic medications could be due to a generalised concern about psychotropic
medications in children, at least in Italian parents [88]. For the same reasons, non-
pharmacological treatments might be preferred in Italy, where drug therapy is reserved
only to a small fraction of the children attending mental care services [27]. On the other
hand, a study conducted in the Lombardy Region, showed that the majority of adolescents
receiving antidepressant drugs were not followed by a child and adolescent psychiatrist,
and this is clearly alarming [27].
A previous multiregional study that used a different database and sample population
already analysed psychotropic drug prescriptions in Italian youths, in the 1998-2004 period
[78]. By merging data from the two studies the prevalence of psychotropic medications was
found to increase in 2001 and reach 3.08‰ in 2002 [78], to then decrease to 1.76‰ in
2006, and to afterward remain quite stable. After the statement about the increased risk of
suicidal in adolescents receiving SSRIs, the amount of psychotropic drugs relevantly
decreased. The plateau trend observed in the years afterwards is different from what was
observed in other countries, where psychotropic prevalence, especially antidepressants,
started to climb again, this fact is discussed further later on [80,82,94,100-105]. Even if we
have no data to demonstrate this, we can speculate that the safety issue about SSRIs
further increased the suspiciousness about paediatric psychotropic drug treatment and
prevented the prevalence to reach the levels observed in the previous years like in other
countries.

82
The analysis of prevalence by age and gender shows different utilization patterns among
males and females, which somewhat reflect the differences in terms of prevalence of
mental diseases, with antipsychotics and ADHD medications prescribed more in males at all
ages, and antidepressants prescribed more in adolescent females. Although the amount of
psychotropic drug prescriptions in Italian children is limited, a majority is represented
essentially by antidepressant prescriptions for adolescent females.
Considering the single classes, there was a decreasing prevalence of antidepressants, and a
large increase in the prevalence of drugs used for ADHD. The reasons behind the large
increase in ADHD medications is that the marketing authorization of methylphenidate and
atomoxetine in Italy was granted in 2007. The prevalence in 2011, however, is still very low
compared to other countries [81-85,108]. The limited prescription of ADHD medications is
partly due to the fact that in Italy the prescription requires strict diagnostic assessment and
continuous monitoring [109,110]. Drugs can be prescribed by child psychiatrists with
expertise in ADHD treatment, after a standardised diagnostic process [109]. It is also
possible that the prevalence of ADHD might be lower than in other countries. In fact, in
recent studies the prevalence of ADHD ranged from 0.5% [110], considering only those
patients accessing child psychiatric services, to about 1% (surveys) [111,112]. Moreover,
Italian youths with ADHD tend to be treated more frequently with non-pharmacological
approaches, and, only in case of severe impairment, with a pharmacological treatment. A
recent survey estimated that about 1 in 4 children with diagnosed ADHD receives drug
therapy [109]. Furthermore, in Italy there are not external determinants that may increase
pressure on drug prescription such as school, or insurance, like in other countries.
Despite their decreasing prevalence, antidepressants are still the most prescribed class of
psychotropic medication, especially in adolescents. The negative trend observed could be
partly explained by the fact that in Europe the warning concerning the higher risk of suicidal
behaviour in adolescents treated with some SSRIs was issued in April 2005 [113], which was
the beginning of our observation period. Nevertheless, the observed data are in contrast

83
with what is shown in other European countries concerning antidepressant prescription in
youth. In fact, for example, in Denmark there was a linear increase in the prevalence from
1996 to 2010 [93], and in UK [114] and Germany [90] there was a decrease only in the years
around the 2002-2006 period (and was very marginal in Germany), after which prevalence
rose again. The overall prevalence observed in this study is twofold lower than that in
Denmark and UK in the same years, and about five fold lower than the prevalence observed
in Germany.
The most prescribed antidepressant was sertraline, which is approved for obsessive-
compulsive disorder in children older than 6 years of age. The data are different from
Germany, for example, where the most prescribed antidepressant in all age groups was
fluoxetine [90].
In comparison with recent studies showing large increases in the use of antipsychotics in
youths worldwide [93,115-118], a modest increase in the study period was observed.
Risperidone was the most prescribed antipsychotic, as well as the most prescribed
psychotropic medication in the overall population and in school-aged children. In Italy
risperidone is approved for conduct disorder, and is used mostly to treat autism related
symptoms, in particular aggressive behaviour.
Four out of the ten most prescribed psychotropic drugs were prescribed off-label by age:
three SSRIs (paroxetine, escitalopram, and citalopram) and one antipsychotic (olanzapine).
Besides these drugs, also pimozide and haloperidol are not approved in youths in Italy,
amitriptyline is approved for adolescents older than 12 years of age, and aripiprazole for
those older than 15. These drugs were, nevertheless, among the ten most prescribed in
school-aged children. Similar results in terms of off label use were observed in other
international studies [119-121].
When looking at the geographical distribution of psychotropic drug prescriptions no
clusters were identified. At the regional level, the most relevant difference was between
Friuli Venezia Giulia and the rest of the regions, and, when comparing the distribution of

84
prevalence at the LHU level by regions, only a tiny statistical difference was found. The
prevalence of psychotropic drug prescriptions did not correlate with latitude or longitude,
nor with annual income. On the contrary, a North-South trend and an inverse correlation
between prevalence and annual income was found in studies evaluating the pattern of
prescription of antibiotics and antiasthmatics [6,8].
In particular, when comparing the regional distribution of overall prevalence of drug
prescription observed in a previous study [122] with the prevalence of psychotropic
medicines no correlation is found. This fact suggests that psychotropic prescribing pattern
is different from that of others medicines prescribed in youths. It is likely that local
differences in cultural factors, prescribing attitude, and environmental setting play a less
important role in psychotropic drug prescription compared to other, more widely used,
drug classes. These facts strengthen the hypothesis of a more homogeneous, or differently
distributed, prescribing attitude concerning psychotropic drugs. Since in this study the
diagnoses corresponding to each prescription was not available, we compared the
psychotropic drug prevalence and hospital admission rates for psychiatric disorders at the
regional level in order to investigate a possible correlation. The correlation was not found,
hence we could deduce that the regional differences observed in the epidemiology of
severe psychiatric diseases alone may not explain the differences in drug prescriptions, but
other factors may play a role.
Looking at the distribution of active substances by region, it was quite unexpected that only
four active substances (risperidone, sertraline, methylphenidate, and paroxetine) are
among the ten most prescribed in six out of seven regions, and only risperidone and
sertraline are among the most prescribed in all the regions. This geographic variability in
the choice of psychotropic medicines is particularly evident for SSRIs, and is probably due to
prescriber attitude (e.g. medical specialty) and to local variability in the marketing of
different active substances. However previous studies showed that in Italy about 3 out of 4
antidepressant prescriptions to children and adolescents are filled by GPs without the

85
supervision of a child and adolescent psychiatrist [27,91]. It is, therefore, likely that GPs
prescribed to adolescents the same active substances they are used to prescribe in adults.
It is striking that paroxetine, which is not approved for use in youths, is among the most
prescribed active substances in six out of seven regions, while fluoxetine, which is approved
for major depressive disorder in children older than eight years of age, is not.
The major strength of this study is the fact that it is a large multiregional study, and that the
regions included were representative of different socio-demographic and geographic
settings, and covered about half of the Italian paediatric population. Some limitation must
be considered, however. We were able to include only seven regions and not the overall
paediatric Italian population, however we included a representative sample of regions
belonging to different geographic areas and with different socio-economic backgrounds. It
would be plausible to state that in our sample the South of Italy is a bit under-represented,
however the two regions included almost 40% of the overall South population.
Since we used drug prescription as a proxy of pharmacological treatment, it was not
possible to assess if the drug was actually consumed by patients, and this is a limitation.
However this limitation do not influence the results of the study, since its aim was to
monitor prescribing, and not consumption trends. Another possible limitation is the fact
that only reimbursed prescriptions were included, excluding out-of-pocket dispensation
and those filled by private practices. However, these phenomena are likely to be negligible
for reimbursed drugs. Anxiolytics, sedatives, and hypnotics were not retrieved in the
database used for this study, leading to an underestimate of the overall prevalence.
However, this class of drugs should not account for a large proportion of psychotropic drugs
in children, as shown in a recent Danish study [93]; the underestimate should therefore be
marginal. Nevertheless, the prevalence of each single class of psychotropic drugs is lower in
Italy than in other countries, as previously described. Information on the diagnosed
diseases for which a drug was prescribed was not available, and precluded any evaluation
of the appropriateness of prescribing. This is, however, an intrinsic limitation of most

86
pharmacoepidemiological studies using prescription databases. Some data were not
available concerning the Abruzzo Region, as described in the methods section, leading to
the exclusion of youths living in the Abruzzo Region for the temporal trend analyses.
5. Conclusions
In this large pharmacoepidemiological study including about half of the Italian youth
population, the prevalence of psychotropic drugs observed was substantially lower than in
other countries and remained stable during the observation period. No significant clusters
were found in the geographic distribution of psychotropic drug prescriptions, differently
from what was observed for other classes of medicines, showing a quite uniform, limited
prescription of psychotropic medications.

87
VI. Quality of drug prescribing in paediatrics
88
A. Review of Italian primary care paediatricians identifies 38 commonly prescribed
drugs for children
1. Introduction
Children are one of the patient populations most exposed to drugs [3]. Wide qualitative and
quantitative differences have been documented in the international literature, and within
countries and regions, that are most likely not due to differences in the epidemiology of
diseases [6,12,20]. A wide range of drugs is prescribed for Italian paediatric patients, but
there are only a limited number of active substances that are commonly prescribed by the
majority of FPs [123]. This is due to differences in prescribing attitudes and different
geographic and socio-cultural settings, as well as to the marketing of me-too drugs, which
are compounds with the same mechanism of action as an existing, approved chemical
entity. These drugs, in most cases, do not bring real advantages to patients when compared
to the standard treatments [124]. In developed countries the availability of a large amount
of active substances, often with overlapping indications, may lead to confusion and
difficulties in choosing the most suitable pharmacological treatment [125].
The World Health Organization (WHO) defines essential medicines as those needed in a
basic healthcare system. Such drugs should be able to fulfil essential medical needs and are
included in the EMLC by considering prevalence of diseases, efficacy, safety and cost
effectiveness [126,127]. The WHO estimated that, even with large differences among
countries, half of the prescriptions filled worldwide could be inappropriate [128]. It has
been demonstrated that clinicians often have to choose between a very large number of
drugs for a certain condition and that these complex decisions reduce the possibility of
making a rational choice and increase the risk of inappropriate prescriptions [129,130].
Prescribing based on a defined list of the best drugs available, excluding less effective and
more toxic drugs, could reduce the rates of inappropriate prescriptions [131]. However, the
EMLC represents a minimal list of drugs needed for priority conditions at the worldwide
89
level, and is thus not applicable to any specific country, since countries may have different
medical needs and priorities. An acknowledged formulary of drugs for children is still
unavailable at the European level and the most used paediatric formulary is the British
National Formulary for Children.
The aim of this observational study was to identify a list of drugs commonly prescribed by a
reference group of Italian FPs during their daily clinical practice. This group has been
involved in educational initiatives concerning care and appropriate prescribing for years.
2. Methods
a. Data source
The survey group comprised of 64 FPs, who worked in the northern part of the Lombardy
Region of Italy and each cared for a similar number of patients. The paediatricians were a
small group of paediatricians near Milan part of an Italian cultural association of
paediatricians called ACP known by our laboratory since a decade for their initiatives on
enforcing guidelines on the appropriateness of prescribing.
The period of observation was from 2 April to 1 June 2012. The participating FPs
systematically recorded, in electronic medical records, all the cartons of drugs prescribed in
the primary care clinic, indicating those recommended by a specialist (S).
The trade names of the drugs and the number of cartons prescribed were collected using
two different software programmes (Junior bit® and Infantia 2000®), which were those
commonly used by the FPs for electronic case reports. Drugs were subsequently classified
according to the Anatomical Therapeutic Chemical classification system, aggregated into
therapeutic subgroups and divided according to whether the cost was reimbursed: class A
drugs reimbursed by the NHS, class C drugs not reimbursed by the NHS and over-the-
counter (OTC) drugs.

90
The outcome measures were the number and percentage of cartons prescribed for each
active substance and therapeutic subgroup. For each active substance we calculated the
percentage of prescribers, defined as the percentage of FPs prescribing at least one carton
of the drug during the study period, and the percentage of prescriptions based on the
recommendation of a specialist.
When prescriptions were recorded on the INFANTIA 2000® software, it was possible to
distinguish between branded and generic drugs and to identify the formulation. Drug
formulations were divided into oral use, which comprised tablets, capsules, and oral
solution/suspensions, and rectal, topic, injectable and inhalator use.
Drugs included in the list of commonly prescribed drugs were those: 1) prescribed by 50%
or more of the FPs following their own clinical assessment; 2) for which ≥ 50% of cartons
were prescribed according to the recommendation of a specialist and prescribed by ≥ 25%
of FPs. Aggregated and anonymous data were provided and, therefore, ethical approval
was not required.
3. Results
A total of 381 active substances were prescribed and these were classified into 70
therapeutic subgroups. Of these, 183 were classified as class A, 107 as class C and 91 as
OTC. The 10 most prescribed active substances covered more than 60% of the cartons
(Table 11).

91
Table 11 – List of medicines prescribed by ≥ 50% of FPs and percentage of prescriptions
Active substance Prescriptions Prescribers
n. (%) n. (%)
amoxicillin 8.879 25.1 64 100.0
salbutamol 1.516 4.3 64 100.0
amoxicillin clavulanate 3.255 9.2 63 98.4
cetirizine 3.199 9.0 63 98.4
betamethasone 1.075 3.0 63 98.4
beclometasone 1.224 3.5 60 93.8
oral aciclovir 688 1.9 60 93.8
fluticasone 536 1.5 59 92.2
clarithromycin 653 1.8 57 89.1
azithromycin 770 2.2 54 84.4
budesonide 335 0.9 53 82.8
ophthalmic tobramycin 322 0.9 53 82.8
levocetirizine 464 1.3 52 81.3
valproic acid 624 1.8 49 76.6
cefixime 495 1.4 49 76.6
montelukast 322 0.9 49 76.6
ibuprofen 311 0.9 49 76.6
oxatomide 181 0.5 48 75.0
paracetamol 638 1.8 43 67.2
cefpodoxime 447 1.3 43 67.2
cefaclor 358 1.0 42 65.6
flunisolide 277 0.8 42 65.6
cholecalciferol 734 2.1 41 64.1
macrogol 135 0.4 41 64.1
mebendazole 111 0.3 40 62.5
desloratadine 192 0.5 38 59.4
prednisone 174 0.5 38 59.4
salmeterol combinations* 158 0.4 38 59.4
betamethasone+gentamycin derm. 146 0.4 36 56.3
ophthalmic ketotifen 133 0.4 36 56.3
paracetamol combinations † 72 0.2 35 54.7
mometasone 138 0.4 32 50.0
iron compounds (III) 85 0.2 32 50.0
other 6,734 19.0 / /
Total 35,381 100.0 / /
grey cells = non reimbursable drug * other drugs for obstructive airway diseases † excluding psycholeptics
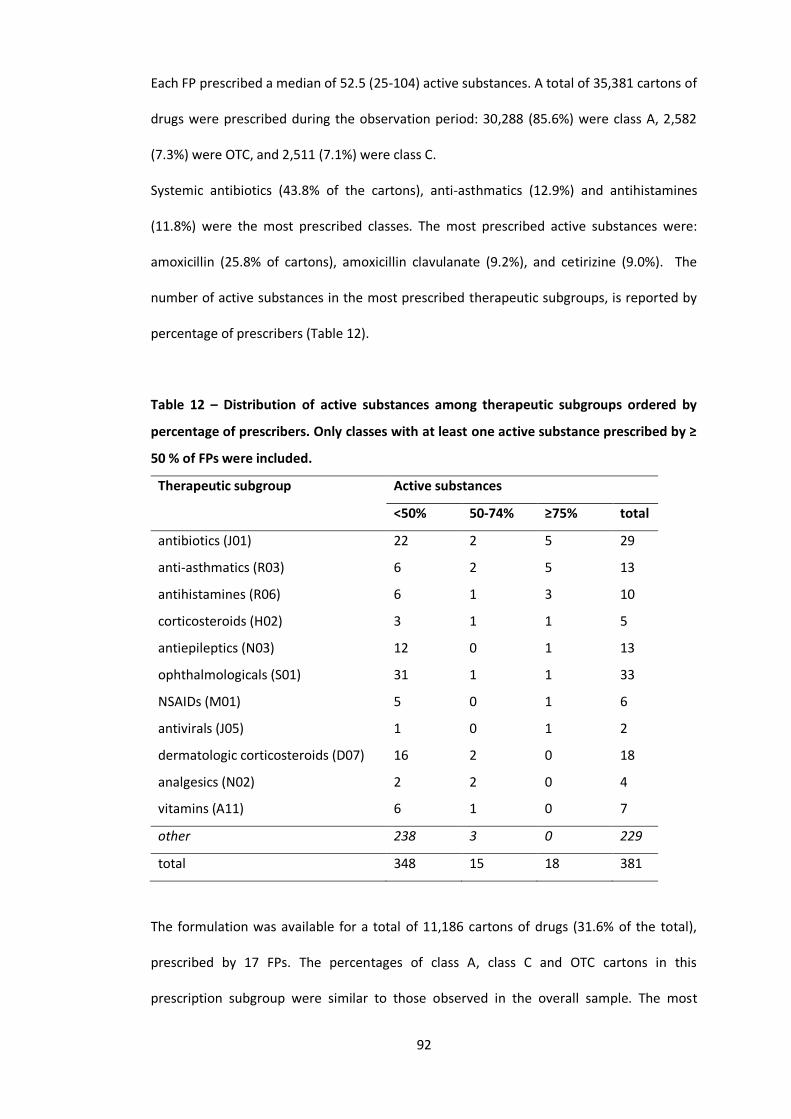
92
Each FP prescribed a median of 52.5 (25-104) active substances. A total of 35,381 cartons of
drugs were prescribed during the observation period: 30,288 (85.6%) were class A, 2,582
(7.3%) were OTC, and 2,511 (7.1%) were class C.
Systemic antibiotics (43.8% of the cartons), anti-asthmatics (12.9%) and antihistamines
(11.8%) were the most prescribed classes. The most prescribed active substances were:
amoxicillin (25.8% of cartons), amoxicillin clavulanate (9.2%), and cetirizine (9.0%). The
number of active substances in the most prescribed therapeutic subgroups, is reported by
percentage of prescribers (Table 12).
Table 12 – Distribution of active substances among therapeutic subgroups ordered by
percentage of prescribers. Only classes with at least one active substance prescribed by ≥
50 % of FPs were included.
Therapeutic subgroup Active substances
<50% 50-74% ≥75% total
antibiotics (J01) 22 2 5 29
anti-asthmatics (R03) 6 2 5 13
antihistamines (R06) 6 1 3 10
corticosteroids (H02) 3 1 1 5
antiepileptics (N03) 12 0 1 13
ophthalmologicals (S01) 31 1 1 33
NSAIDs (M01) 5 0 1 6
antivirals (J05) 1 0 1 2
dermatologic corticosteroids (D07) 16 2 0 18
analgesics (N02) 2 2 0 4
vitamins (A11) 6 1 0 7
other 238 3 0 229
total 348 15 18 381
The formulation was available for a total of 11,186 cartons of drugs (31.6% of the total),
prescribed by 17 FPs. The percentages of class A, class C and OTC cartons in this
prescription subgroup were similar to those observed in the overall sample. The most

93
prescribed cartons were oral formulations (76.6%). In particular, solutions/suspensions
accounted for 54.8%, tablets/capsules for 21.8%, inhalors for 12.1%, topical drugs for 6.4%,
injectable drugs for 4.0% and rectally administered drugs for 0.9%. When we looked at the
five most prescribed active substances, we found that the number of different medicinal
products prescribed ranged from three for betamethasone to 34 for amoxicillin clavulanate
and that only one out of three and five out of 34 of these formulations, respectively, were
prescribed by 50% or more of the FPs.
In total, 30% (3,361) of the cartons were generic. The rate of generic prescriptions for the
three most prescribed classes of drugs, was 54.0% for antibiotics, 25.5% for anti-histamines
and 2.4% for anti-asthmatics. Among the five most prescribed drugs, amoxicillin had the
highest rate of generic prescriptions (68.5%), followed by amoxicillin clavulanate (47.1%),
cetirizine (30.0%), and salbutamol (5.9%). There was a high variability of generic use among
FPs, ranging from 3.2% to 55.6% of cartons prescribed.
a. Prescriptions recommended by the specialist
During the study period, 57 (89.1%) of the FPs prescribed at least one drug recommended
by a specialist and a total of 175 active substances, belonging to 52 therapeutic subgroups,
were prescribed. Of these, 36 drugs were prescribed exclusively based on the
recommendation of specialists and the most commonly prescribed were: carbamazepine
(88 cartons), levocarnitine (12), and zonisamide (11).
The number of cartons recommended by specialists was 2,903 (8.2%) and the most
recommended classes were antiepileptics (75.5% of the cartons), pituitary and
hypothalamic hormones and analogues (62.4%), drugs used in diabetes (59.5%) and thyroid
therapy drugs (58.9%). Valproic acid (382 cartons) and somatropine (246) were the most
recommended active substances in terms of number of cartons prescribed.

94
b. List of commonly prescribed drugs
According to the defined criteria, a list of 38 commonly prescribed drugs belonging to 16
therapeutic subgroups and covering 83.1% of prescriptions was identified. Of these, 33
were prescribed by 50% or more of the FPs and five were mainly prescribed following the
recommendation of a specialist (Table 13).
Table 13 – List of shared medicines identified by the predefined criteria. Therapeutic
subgroups are ordered by number of packages.
Therapeutic subgroup Active substances
antibiotics amoxicillin, amoxicillin clavulanate, cefaclor, cefixime,
cefpodoxime, azithromycin, clarithromycin
anti-asthmatics salbutamol, salmeterol combinations, beclometasone,
budesonide, flunisolide, fluticasone, montelukast
antihistamines oxatomide, cetirizine, levocetirizine, desloratadine
corticosteroids betamethasone, prednisone
antiepileptics carbamazepine (R), valproic acid (R), levetiracetam (R)
ophthalmologics tobramycin, ketotifen
vitamins cholecalciferol
analgesics paracetamol, paracetamol combinations excluding
psycholeptics
antivirals aciclovir
dermatological corticosteroids mometasone, betamethasone and gentamicin
pituitary and hypothalamic
hormones and analogues
somatropine (R)
anti-inflammatories ibuprofen
antihelmintics mebendazole
drugs for constipation macrogol
drugs used in diabetes insulin* (R)
antianemics iron compounds (III)
thyroid theraphy levotiroxine (R)
* and analogs
(R) ≥ 50% of packages recommended by a specialist
95
4. Discussion
This observational study evaluated the profile of drugs prescribed during daily clinical
practice by a group of FPs, who has been involved in healthcare initiatives for a number of
years. Over 85% of the cartons prescribed were reimbursable. This data is different from a
previous study in the South of Italy that analysed a sample and found that more than 30%
were non-reimbursable drugs [132]. The current study shows that, despite the fact that
non-reimbursable drugs represented more than half of the active substances prescribed,
only seven of them were commonly prescribed in clinical practice and these were
paracetamol, ibuprofen, mometasone, betamethasone plus gentamycin, tobramycin,
ketotifen and macrogol. The high percentage of reimbursable prescriptions indicates that
the profile emerging from studies using administrative databases of reimbursed
prescriptions is quite representative of the overall prescribing practice [3,20].
This study highlighted that the diseases requiring more drug prescriptions following the
recommendation of a specialist were chronic illnesses, such as epilepsy, diabetes and a
number of endocrinological conditions. By using the same approach, on the basis of the
prescription profile, the diseases that were treated mainly by FPs were infections, asthma
and dermatological, gastroenterological and ophthalmological conditions. The list of the
therapeutic areas identified could be used to create a widely acknowledged formulary of
common paediatric drugs that reflects FPs’ practices.
The most prescribed active substances were antibiotics, anti-asthmatics and anti-
histamines, as observed in other pharmacoepidemiological studies in children [20,65,133].
A 1998 study on paediatric prescriptions in southern Italy showed similar results concerning
drug classes, with a higher average number of active substances prescribed by FPs [65].
Antibiotic prevalence was high compared to that of most of the other European countries,
but is similar to reports in the literature concerning Italian children [3,6,12,20,22,134].

96
Different medicinal products containing the same drug were used by FPs. The different
attitudes may be due to the specific preferences of the FP, the influence of marketing and
the different palatability of formulations [135].
The percentage of generic drugs observed in this study (30%) was low when compared with
those of other European countries (70%) [134], but higher than the percentage in a survey
on Italian FPs (13.5%)[136]. This is probably due to the fact that FPs involved in educational
initiatives may be more likely to prescribe generic drugs [22]. However, the data in the
current study showed that even in a small group of FPs the attitudes towards generic
prescribing differed widely, indicating that personal preferences exerted a strong influence.
By using the predefined criteria, we identified a total of 38 active substances necessary to
fulfil the most relevant clinical needs in the primary care paediatric setting. These data
confirm the fact that a relatively small number of drugs are used frequently. Of these drugs,
14 (37%) were included in the EMLC. The difference between our list and the EMLC list is
partly due to different health needs, priorities and settings, in other words local versus
global. For example, macrogol is the drug of choice recommended by the NICE, which
provides the UK NHS with advice on drugs [137], but it is excluded from the EMLC and
constipation is certainly not a priority condition in countries with scarce resources.
Besides the incidence and prevalence of diseases, other reasons for the differences
between the two lists may include high treatment costs, because treatments like
somatropine are unlikely to be affordable in low-income countries. In addition, regulatory
or marketing reasons may influence views on how essential drugs are. Betamethasone, for
example, was prescribed by 63 of the 64 FPs in our study but is not included in the EMLC.
The WHO, in fact, suggests that prednisolone should be the first choice oral corticosteroid.
International guidelines on the management of childhood asthma state that oral
corticosteroids should be used in acute exacerbations when there is a suboptimal response
to β2-agonists [138,139]. In Italy, however, this recommendation is often not followed and
these drugs are used mostly to improve symptoms of common URTI, even if there is no

97
evidence of efficacy [140]. Betamethasone has a very low cost in Italy and the formulation,
small dispersible tablets, means that it can be administered to very young children
Therefore, this drug is preferred to other oral corticosteroids for asthma and wheezing
therapy.
Among the 38 selected drugs, duplications observed in previous studies still persist [123].
The presence of four different inhalation corticosteroids (beclometasone, flunisolide,
budesonide and fluticasone) and two third-generation cephalosporins sharing the same
posology (cefixime and cefpodoxime) is unlikely to be due to different levels of efficacy.
Finally, the adoption of a European formulary of paediatric drugs would be helpful in
promoting a more rational and homogeneous use of drugs in children within countries
[141]. The rational use of drugs in children is an area of research that has not been
sufficiently studied and there is a need for interventions to improve it [1]. A formulary of
the most useful and effective medications for the most common paediatric diseases would
represent a concrete step towards implementing the rational use of drugs in children.
Our study has some limitations. It is possible that the list of drugs we identified is not
applicable to other FPs and geographic settings. In fact, the FPs had similar educational
levels and motivation and were thus not representative of a broader setting, such as a
regional or national one. Furthermore, since the role of the FP does not exist everywhere,
the results may not be applicable to other countries with different systems of paediatric
care, where GPs treat most children. The observation period lasted eight weeks and a
longer duration could have identified additional drugs. However, the results are quite
similar to observations from other paediatric studies [134]. Unfortunately, we were not
able to collect information concerning the drug dosages and the diseases diagnosed.
Nevertheless, by looking at the qualitative and quantitative prescription profile, the study
provides useful insight into the most prominent clinical needs observed in this paediatric
population.
98
5. Conclusions
In conclusion, this study allowed the identification of a list of drugs commonly prescribed by
a group of FPs involved in healthcare initiatives for many years. This shows that 38 drugs
would be sufficient to treat the most common childhood diseases in this sample of patients.
Identifying this list of commonly prescribed drugs by this group of experienced FPs could
provide a good starting point for creating a minimal paediatric formulary that addresses the
most common clinical needs in the primary care setting.

99
B. Generic antibiotic prescribing in paediatrics
1. Introduction
A generic drug is defined as a medicinal product that has the same qualitative and
quantitative composition in active substance and the same pharmaceutical form as the
originator. In Italy, when a medicinal specialty is not protected by patent anymore, generic
drugs are marketed with a 20 to 80% discount in price in respect to the originator. Thus, the
marketing of generic drugs causes significant savings to the NHS, because the new
reimbursed price correspond to that of the generic formulation. At the same time, the use
of generic drugs instead of the brand name alternatives may cause some savings also for
the citizens. In fact in Italy, if a generic exist for the drug that has been prescribed, the drug
is fully reimbursed by the NHS only if the patient is willing to buy the generic. If the patient
is willing to buy the brand name formulation of the drug, then a co-payment is due.
Generic drugs market is very large in the UK, Denmark, and Germany, representing about
70% of the cartons sold and about 30% of the expenditure, and generating 13 billion euros
of savings ( 35 billion euros if considering the entire EU-27)[142]. In USA these percentages
reached 80% in volume and 20% in expenditure, while in Italy generic drugs represent less
than 14% in volume, and 7% in expenditure (about 300 million euros) [143]. Despite some
improvements in the last few years, generic drugs prescribing continues to be limited in
Italy in respect to other European countries and USA [134]. This difference may be due to
differences in legislation, cultural factors, and prescribing attitudes.
Data concerning generic prescribing in paediatrics are scarce. One study conducted in the
USA in 2002 reported that in under 18 years old about 41% of the overall prescriptions
were generic drugs [144]. The percentage of generic drugs was higher in analgesics,
antiasthmatics, and antibiotics (almost 70% of the total). Nowadays, also in paediatrics, the
prescribing of generic drugs is scarce in Italy. A survey on 303 FPs in 2011 revealed that
about 29% of the participants believed that generics may contain a lower quantity of active

100
substance compared to the originator [137]. The lack of bioequivalence study in children,
different excipients, and palatability were indicated as the major issues of generic
formulations. The FPs included in this study treated with generic drugs less than 20% of
their patients [137]. An analysis of the prescription database of the Lombardy Region in
2005 estimated that 41% of children 6 to 13 years old treated with amoxicillin received at
least one generic formulation of this drug [145].
Antibiotics are the most prescribed drugs in children and adolescents, and they represents
54% of the out of hospital expenditure for drugs in Italy [3,4]. The aim of this study was to
evaluate generic antibiotics prescribing in paediatrics in the Lombardy Region, and to
investigate some of the possible determinants.
2. Methods
a. Data Source
The data source was the Lombardy Region’s database, which is routinely updated for
administrative and reimbursement reasons. The database stores all community (i.e. outside
hospital) prescriptions reimbursed by the NHS. Data were managed anonymously.
Prescribed drugs were classified according to the Anatomic Therapeutic Chemical (ATC)
classification system. Antibiotics were defined as all drugs belonging to the J01 ATC
subgroup. Medicines were considered generic if they were marketed with the INN of the
active substance.
b. Study population
The population included was composed of all children/adolescents <13 years old resident in
the Lombardy Region, (1,276,932 children/adolescents and 1253 FPs). 15 LHUs were
included in the study. The sample size of each LHU varied from 12,644 to 160,744 children.
The population was divided in three groups of age: <1 year old, 1-5 years old, and 6-13
years old.

101
c. Measures and analysis
- Prevalence, as the percentage of resident children with at least one prescription in one
year of observation;
- percentage of treated children, as the percentage of children with at least one
prescription of a certain active substance divided by the children treated with antibiotics;
The association between antibiotic prevalence and the percentage of children treated with
generic alternatives in the 15 LHUs was evaluated by using the non-parametric Spearman
rank correlation test.
With the aim to evaluate the FPs’ prescribing attitude in respect to generic drug
prescription, FPs were classified into low, mean, and high prescriber on the basis of the
number of antibiotic prescriptions per patient. A low prescriber showed a mean number of
antibiotic prescriptions per patient equal to y<x ̅-sd (lower than 0.72), a mean prescriber to
x ̅-sd<y<x ̅+sd (0.72 to 1.5), and high prescriber to y>x ̅+sd (higher than 1.5). The percentage
of generic antibiotic prescriptions was compared among the three groups of FPs through
the non-parametric Krusall-Wallis test, because the distribution of data was not normal,
and the ANOVA test could not be used appropriately. The Wilcoxon signed-rank test was
used to compared the generic prescription rate in the different groups of prescribers. The χ2
for trend was used in order to compare the percentage of children treated with a generic
formulation in the different age strata. A p-value < 0.05 was considered statistically
significant.
3. Results
In 2008, 74 antibiotics corresponding to 813 medicinal specialty were available in the NPF.
Of these, 339 tablets and capsules, 338 injectables, 136 suspensions for oral use were
retrieved. For 39 active substances, corresponding to 611 medicinal specialty, a generic
formulation was available. Cephalosporins (13 active substances), and penicillins (9 active
substances) were the most represented class.
102
During 2008, 62 different antibiotics were prescribed to 590,940 children (46%) for a total
of 1,337,236 prescriptions. Prevalence of antibiotic prescriptions was higher in boys than in
girls (52 vs 48%), and reached the maximum value in children 1 to 5 years old (62%),
decreasing to 39% in those 6 to 13 years old.
79% of the overall antibiotic prescriptions concerned antibiotic that had generic
formulations available on the market (i.e. the patent expired). Generic prescriptions were
37% of the antibiotic with expired patent, and 29% of the overall antibiotic prescriptions.
The most prescribed formulations were oral suspensions that represented 88% of the
antibiotic prescriptions. 86% (n = 509,825) of all the children treated with antibiotics
received at least one antibiotic with expired patent. The 47% of these children (n = 239,781)
received at least one generic antibiotic.
There were no gender differences in the prescription of generic antibiotics. The percentage
of prescription of generic antibiotics decreased at increasing age: from 47% of children less
than 1 years old, to 31% in those 6 to 13 years old (χ2t= 18.753; p < 0.001). The most
prescribed antibiotic was amoxicillin-clavulanate (40% of treated children), followed by
amoxicillin (22%), and clarithromycin (10%). The 10 most prescribed antibiotics represented
97% of all the prescriptions for antibiotic drugs. Six of the ten most prescribed active
substances had an expired patent: amoxicillin clavulanate, amoxicillin, clarithromycin,
cefaclor, ceftriaxone, and cefuroxime. For these antibiotics generic paediatric formulations
were available, with the exceptions of cefuroxime and ceftriaxone.
Table 14, shows the data concerning the four most prescribed antibiotics with expired
patent. The percentage of prescription of generic antibiotics was 37%, from a minimum of
6% (clarithromycin) to a maximum of 72% (amoxicillin).

103
Table 14 – Data concerning the four most prescribed antibiotics with expired patent in
terms of generic drug prescription
active
substance
prescriptio
ns*
(n)
patent
expiration
(year)
medicinal specialties*
(n)
generics
(%)
total B/G paediatric
formulations (B/G)
treated
childre
n
prescriptions
amoxi-
clavulanate
552,984 2006 10/65 6/6 31.5 26.7
amoxicillin 283,769 1996 7/40 1/6 71.9 71.5
clarithromycin 120,360 2008 12/22 6/6 7.4 6.3
cefaclor 84,889 2002 7/35 5/17 37.2 34.6
other 50,422 - 54/100 3/17 28.5 28.0
total 1,062,424 - 90/262 21/52 40.4 37.0
*Prescriptions concerning active substances with expired patent, B brand name formulation, G
generic name formulation
a. Prevalence and determinants
The prevalence of antibiotics varied from 37 to 52% in the 15 LHUs. The percentage of
prescription of generic antibiotic was the lowest in the Sondrio LHU (12%) and the highest
in Como LHU (48%). The percentage of children receiving generic amoxicillin followed the
same trend ranging from 25% in Sondrio LHU, to 83% in the Milano and Como LHUs. A
correlation between the antibiotic prevalence of prescription and the percentage of
children treated with generic antibiotics was not found at the LHU level (RS= 0.19; p= 0.49).
The proportion of generic drugs was higher in FPs prescribing less antibiotics to their
patients, Table 15. The generic antibiotic prescription rate was lower in high prescribing FPs
compared to the low prescribing FPs (z= 2.44; p= 0.015), and compared to the mean
prescribing FPs (z= 2.77; p= 0.005).

104
Table 15 – Comparison of the proportion of generic prescriptions among different groups
of paediatricians in respect to quantity of antibiotics prescribed
Prescriber N
Generic prescription (% proportion of children )
Range mean ± DS
Low 167 0.0 – 78.5 39.4 ± 20.3
Mean 842 1.5 – 88.3 39.1 ± 21.6
High 169 2.9 – 84.5 34.4 ± 22.8
Total 1,178 0.0 – 88.3 38.5 ± 21.6
p-value 1 0.015
1. Kruskall-Wallis test
4. Discussion
This study is the first comprehensive analysis of generic antibiotics in paediatrics in Italy on
a large pharmaceutical database. Despite being limited to the antibiotic class, the analysis is
quite representative of the prescribing profile, because these drugs are the most used
medicines in children. Furthermore there are a large number of available generic
formulations of antibiotic on the paediatric market, and, as confirmed by a survey [137],
antibiotics are the most commonly prescribed drugs as generics.
The antibiotic prescription profile observed in this study is similar to that previously
described in the Lombardy Region and in other Italian regions, and further confirm the
importance of the geographical determinant, and the higher prevalence in Italy compared
to other north European countries [3,4,6]. The reasons for this difference are multiple:
socio-cultural, economic, in the organisation of health systems, and in the physicians’
prescribing attitude.
Generic antibiotic were scantly prescribed in this analysis. Despite the fact that for 6 out of
10 of the most prescribed antibiotics in children generic drugs were available on the
market, only 37% of the prescriptions were represented by generic antibiotics, with wide
differences among geographic areas and FPs. It is remarkable that only for amoxicillin the
105
generic formulations were prescribed more than the brand name ones. For amoxicillin-
clavulanate, the most prescribed drug in Italy in children, generic prescriptions represented
only 27% of the total, while in the case of clarithromycin the proportion of generic
formulations prescribed was negligible (6%). These differences may be due only in part to
the scarce availability of generic paediatric formulations, or to the period immediately after
the patent expiration. In the case of clarithromycin, the patent expired in 2008, and this
could explain the very low prescription rate of generic formulation of this drug.
Nevertheless the very low prescription rate of generic formulations of cefaclor is not
justifiable neither by patent expiration nor by the lack of availability of paediatric
formulations. In fact cefaclor patent expired in 2003 in Italy, and 17 generic paediatric
formulations were available.
The proportion of children receiving a generic formulation of antibiotics decreased with
increasing age. This was probably due to the fact that amoxicillin, the antibiotic most
prescribed as generic formulations, is the most prescribed antibiotic especially in the
youngest children, due to the epidemiology of acute otitis media. The prescription rate of
generic amoxicillin increased compared to 2005 in a similar population, from 41 to 72% [4].
This is encouraging and it confirms a trend in a more favourable prescribing attitude
towards generic antibiotics in FPs. However, wide differences at the local level exist
regarding the generic prescription rates, with a fourfold difference between the LHU with
the lowest and the highest values. These differences are not associated with the qualitative
profile of antibiotic prescriptions, since they persist also when considering only amoxicillin
alone. Moreover, a correlation between antibiotic prevalence and the prescription rate of
generic formulations was not found. This result seems to indicate that not necessarily the
more “virtuous” LHUs in terms of low prevalence of antibiotic prescribed more generic
formulations. In this regard the Sondrio LHU is emblematic: even being a geographic area
that has a low prevalence of antibiotic prescription, the prescription of generic antibiotic is
rare.
106
High prescribers were more likely to prescribe less generic antibiotics compared to low
prescribers. Most likely this was due to qualitative differences in the prescription profile
since amoxicillin has the highest prescription rate of generic formulations and other second
choice antibiotics like cefaclor and clarithromycin are rarely prescribed as generic
formulations.
5. Conclusions
The differences among different settings and physicians highlighted the need for
educational interventions for prescribers and citizens concerning the use of generic
medicines. In order to be effective these interventions should be part of a more broad task
of improving rational use of drugs in paediatrics. Furthermore these interventions should
be undertaken at the local level, especially where generic drug prescriptions is still rare.

107
C. Comparing recurrent antibiotic prescriptions in children treated with a brand
name or a generic formulation
1. Introduction
According to the EMA a generic drug is a medicinal product having the same qualitative and
quantitative composition in active substances and the same pharmaceutical form as the
reference medicinal product, and whose bioequivalence with the reference medicinal
product has been demonstrated to be within acceptable predefined limits [146]. Such limits
are represented by the AUC and AUCinfinity values ranging from less than 20% to more than
25% of the brand name drug values (CI 90% 0.8–1.25). A study on food interaction must be
performed for oral drugs, as well as a study on palatability if there is a paediatric indication
[146]. Such studies allow the marketing authorisation for the generic product.
Concerning the effectiveness of generic drugs, scepticism has arisen from both the
consideration that the efficacy of generic drugs does not need to be proven in order for
them to be authorised, and from unproven anecdotal reports of non-effectiveness
[147,148]. One of the drug classes receiving attention due to such anecdotal reports, often
fostered by marketing campaigns organised by brand name drug producers, is antibiotics.
Antibiotics are the most used drug class in children, thus effectiveness is very relevant in
this population of patients. In fact, generic antibiotics are less costly than the trade-name
products and their increased use generates significant savings for both the patients and
prescribers, without compromising therapeutic benefits [22,149].
A number of post marketing studies have looked at bioavailability of generic antibiotics
compared with the originators, showing generally favourable results [150-155]. Only a few
studies reported that generic tablets are sometimes not comparable in vitro to the
originator product [150] or do not reach bioequivalence [151]. Failing to demonstrate
bioequivalence because the confidence interval is slightly larger than allowed, however,

108
does not demonstrate lack of clinical effectiveness [152]. Moreover, most post-marketing
studies demonstrated bioequivalence in clinical trials [153-155].
Concerning clinical effectiveness, post-marketing clinical trials are scarce, but showed no
difference in clinical outcomes when comparing generic and brand name antibiotics
[155,156].
Different paediatric formulations of antibiotics can have a substantially worse palatability
profile, thus decreasing children’s adherence and possibly increasing therapy failure rates
[136,157]. Nevertheless, a clinical trial study failed to show significant differences in the
compliance to oral suspension antibiotics when a brand name or a generic was given [158].
In this context, the aim of this study was to investigate the rate of recurrent prescriptions
and hospital admissions as proxy of therapeutic failure in outpatient children receiving a
generic/brand name antibiotic prescription by using a pharmacoepidemiological approach.
The main goal of the study was to indirectly compare the clinical effectiveness of brand
name and generic formulations of the same active substance in the real setting by using
prescription data routinely collected for administrative reasons.
2. Methods
a. The reference price system
In Italy, the RPS was implemented in 2001. Under the RPS, the NHS reimburses the lowest
price among the prices of off-patent pharmaceuticals with equal composition in active
ingredients, with the same pharmaceutical form, method of administration, number of
units and dosage. If patients refuse the substitution of a medicine with a generic
alternative, the difference is paid by patients.

109
b. Data source
The data source was the Lombardy Region’s database, which is routinely updated for
administrative and reimbursement reasons. The database stores all community (i.e. outside
hospital) prescriptions reimbursed by the NHS. Data were managed anonymously.
Prescribed drugs were classified according to the Anatomic Therapeutic Chemical (ATC)
classification system. Antibiotics were defined as all drugs belonging to the J01 ATC
subgroup.
The population included was composed of all children/adolescents <18 years old resident in
the Lombardy Region, a large Italian region located in the North of the country (1,669,856
children/adolescents in 2010). The chosen observation period was from 1 February to 30
April 2010.
Prescriptions were subsequently divided into index and recurrent prescriptions.
An index prescription of an antibiotic was defined as any antibiotic prescription that
occurred during the observational period not preceded by a prescription in the previous 28
days (for a single child). A recurrent prescription was defined as an antibiotic prescription
occurring from 1 to 28 days after an index prescription (for a single child). The month of
May was considered a post-observational period during which only recurrent prescriptions
were considered (included if a child received an antibiotic prescription in the previous 28
days). Children receiving more than four prescriptions during the observational period were
excluded since they were more likely suffering from a chronic illness. Since a sufficient
amount of children treated with a generic antibiotic was needed to compare recurrent
prescription in the generic vs brand name groups of children, only prescription of the 4
antibiotic with a paediatric generic formulation available since at least two years were
considered for the analyses (amoxicillin, amoxicillin clavulanate, cefaclor, and
clarithromycin).

110
c. Therapy switch
In order to characterise the recurrent prescriptions, for each active substance and for both
generic and brand name formulations, the percentage of therapy switch was calculated in
terms of: percentage of different classes and active substances prescribed during the
recurrence and percentage of brand name vs generic drug prescription.
d. Generic/brand name
In this study medicines were considered generic if they were marketed with the INN of the
active substance. In order to evaluate the rate of recurrent prescriptions associated with
the use of generic/brand name formulations, a list of the most used antibiotics with generic
formulations was identified. Only antibiotics with paediatric generic formulations that had
been marketed for more than two years were selected (for which a consolidated use is
likely): amoxicillin, amoxicillin clavulanate, clarithromycin, and cefaclor. For each active
substance, for both generic and brand name formulations, and for each age strata, the
percentage of recurrent prescriptions was calculated.
e. Hospital admissions
In order to test if a generic or a brand name drug was prescribed, data concerning hospital
admission were linked with the index prescription occurring in the observational period in
the same patient. To test this hypothesis, data from hospital discharge records, including
information on primary diagnoses and up to five coexisting conditions, procedures
performed and dates of admission and discharge, were retrieved. The diagnoses were
categorised according to ICD9 (International Statistical Classification of Diseases and
Related Health Problems). Only primary diagnoses were considered. Hospital admissions
occurring in the first week of life were excluded and/or those corresponding to the
following diagnoses: tumors (ICD9 from 140 to 239), epilepsy (343-345), appendicitis (540-

111
543), hernia of abdominal cavity (550-553), complications of pregnancy, childbirth, and the
puerperium (630-677), congenital anomalies (740-759), conditions originating in the
perinatal period (760-779), and injury and poisoning (800-999). Children/adolescents
having more than four hospital admissions in the considered period were excluded. For
each active substance, for both generic and brand name formulations, and for each age
strata, the percentage of patients with a hospital admission within 28 days following a
prescription was calculated. Only children with at maximum 4 antibiotic prescriptions and 4
hospital admissions in the 6 months period were considered for this analyses, because it
was very complicated to evaluate the different time-windows between more than 8 events
in 6 months per each child.
f. Statistical analysis
Children/adolescents were divided into three age strata: 0-5, 6-11, and 12-17 years old.
χ2 was used to compare the two main outcomes (percentage of recurrent prescriptions and
rate of hospital admission) in each age strata in children receiving brand name and generic
prescriptions. The Cochran–Mantel–Haenszel test was used to compare the main outcomes
in children receiving brand name or generic prescriptions, taking into account the different
distribution of events in the three age strata. Statistical analysis was performed using SAS
software, version 9.2 (SAS, Cary, NC, USA).
3. Results
In 2010 702,673 children/adolescents (42.1% of the total) received 1,248,570 antibiotic
prescriptions. During the observational period a total of 329,123 children/adolescents
received 494,496 antibiotic prescriptions (42.0% of the annual prescriptions). The chosen
period was representative of the whole antibiotic prescription profile registered during
2010. Of these children 5,246 were excluded because they received more than four
prescriptions.

112
Amoxicillin clavulanate, amoxicillin, clarithromycin, cefaclor, azithromycin and cefixime
were the most used antibiotics and covered 87% of the prescriptions. A total of 271,697
children (82.6% of the total) received at least one prescription of the four antibiotics having
paediatric generic formulations, for a total of 381,720 prescriptions. Amoxicillin clavulanate
was the most prescribed antibiotic covering 54.8% of these prescriptions, followed by
amoxicillin (25.4%), clarithromycin (12.6%), and cefaclor (6.2%). The overall percentage of
generic prescriptions was: 70.4% for amoxicillin, 40.5% for amoxicillin clavulanate, 35.0%
for cefaclor, and 16.3% for clarithromycin.
a. Therapy switch
Considering the three most used classes of antibiotics, a therapy switch occurred in 38.1%
of cases in which the index prescription involved a penicillin, in 55.5% of cases involving a
cephalosporin, and in 57.5% involving macrolides. The percentage of therapy switches per
active substance was lowest for amoxicillin clavulanate (46.7%) and highest for cefixime
(72.1%). The most common recurrent prescriptions involved the same drug prescribed in
the index prescription for all the active substances considered.

113
R
1
I2
amo
xicl
av*
(%)
amo
xici
llin
(%)
clar
ith
rom
ycin
(%)
cefa
clo
r
(%)
azit
hro
myi
cin
(%)
cefi
xim
e
(%)
oth
er
(%)
amo
xicl
av*
(248
39)
53.3
6
.2
11
.4
4.6
7
.9
4.5
1
2.1
amo
xici
llin
(124
40)
25.9
4
0.7
1
0.3
5
.5
6.2
3
.7
7.7
clar
ith
rom
ycin
(557
9)
30.2
8
.3
34
.8
3.7
6
.8
4.4
1
1.8
cefa
clo
r
(312
5)
23.9
7
.4
9.1
3
9.6
9
.1
3.7
7
.2
azit
hro
myc
in
(356
8)
28.6
7
.7
9.0
3
.9
34
.9
5.2
1
0.7
cefi
xim
e
(260
5)
28.6
7
.2
11
.7
1.6
1
0.4
2
9.7
1
0.8
Tab
le 1
6 –
Nu
mb
er o
f p
resc
rip
tio
ns
of
the
mo
st u
sed
act
ive
su
bst
an
ces
and
per
cen
tage
of
thei
r re
curr
ence
s (i
ncl
ud
ing
ther
apy
swit
ches
). T
he
nu
mb
ers
in p
are
nth
ese
s in
dic
ate
th
e n
um
be
r o
f in
dex
pre
scri
pti
on
s.
1 re
curr
ent
pre
scri
pti
on
s 2
ind
ex p
resc
rip
tio
ns
* am
oxi
cilli
n c
lavu
lan
ate

114
When a therapy switch occurred, amoxicillin clavulanate was the most used active
substance in the recurrent prescription, Table 16.
The analysis on generic/brand name formulations concerned amoxicillin clavulanate,
amoxicillin, clarithromycin and cefaclor, since for these drugs paediatric generic
formulations had been available for at least two years, suggesting a consolidated use.
During recurrent prescriptions the percentage of generic formulations used was
substantially the same as that observed in the overall prescription sample. In cases in which
a generic antibiotic was prescribed as the index prescription, a generic antibiotic was
prescribed again in about half of the cases, ranging from 47.0% (clarithromycin) to 57.4%
(cefaclor). When the same active substance was prescribed during a recurrence, there was
a high percentage of same-type index-recurrent prescriptions (generic-generic and brand
name- brand name). For generics the percentages ranged from 65.9% for clarithromycin to
93.6% for amoxicillin, and for brand names they ranged from 86.7% for amoxicillin to 96.2%
for clarithromycin).
b. Generic/Brand name
The number and percentage of recurrent prescriptions for each of the four active
substances, and for generic vs brand name formulations, is reported in Table 17.
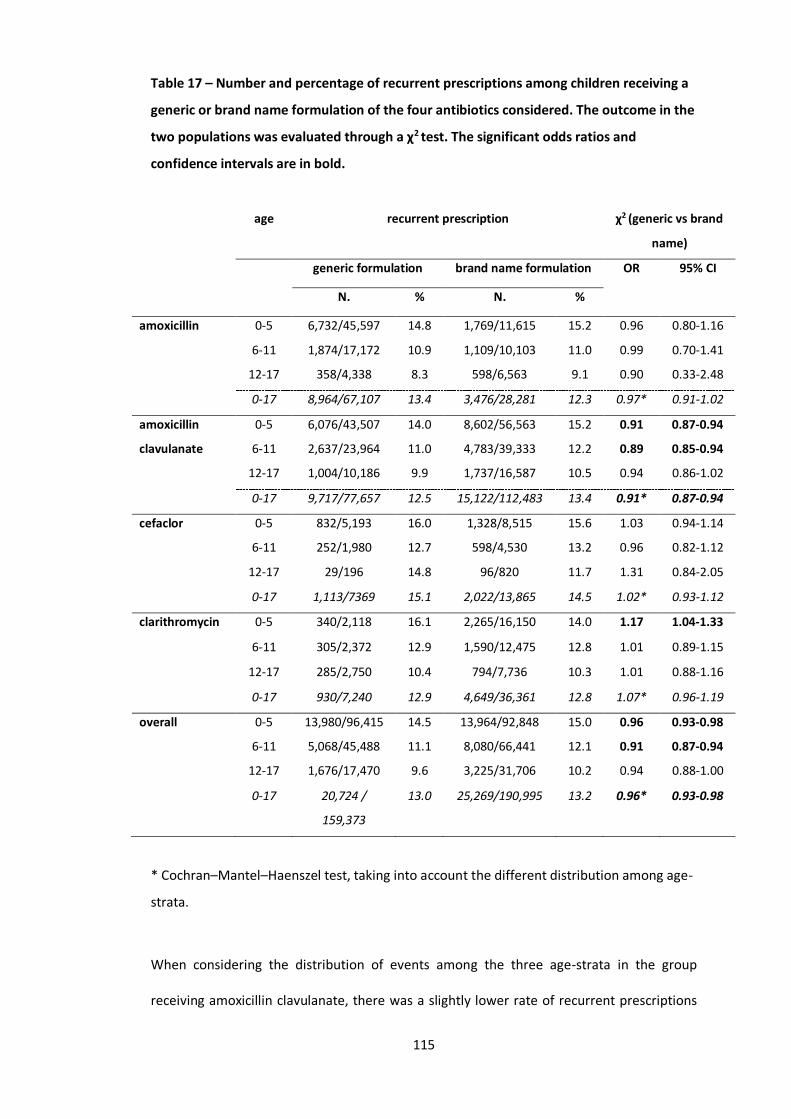
115
Table 17 – Number and percentage of recurrent prescriptions among children receiving a
generic or brand name formulation of the four antibiotics considered. The outcome in the
two populations was evaluated through a χ2 test. The significant odds ratios and
confidence intervals are in bold.
age recurrent prescription χ2 (generic vs brand
name)
generic formulation brand name formulation OR 95% CI
N. % N. %
amoxicillin 0-5 6,732/45,597 14.8 1,769/11,615 15.2 0.96 0.80-1.16
6-11 1,874/17,172 10.9 1,109/10,103 11.0 0.99 0.70-1.41
12-17 358/4,338 8.3 598/6,563 9.1 0.90 0.33-2.48
0-17 8,964/67,107 13.4 3,476/28,281 12.3 0.97* 0.91-1.02
amoxicillin
clavulanate
0-5 6,076/43,507 14.0 8,602/56,563 15.2 0.91 0.87-0.94
6-11 2,637/23,964 11.0 4,783/39,333 12.2 0.89 0.85-0.94
12-17 1,004/10,186 9.9 1,737/16,587 10.5 0.94 0.86-1.02
0-17 9,717/77,657 12.5 15,122/112,483 13.4 0.91* 0.87-0.94
cefaclor 0-5 832/5,193 16.0 1,328/8,515 15.6 1.03 0.94-1.14
6-11 252/1,980 12.7 598/4,530 13.2 0.96 0.82-1.12
12-17 29/196 14.8 96/820 11.7 1.31 0.84-2.05
0-17 1,113/7369 15.1 2,022/13,865 14.5 1.02* 0.93-1.12
clarithromycin 0-5 340/2,118 16.1 2,265/16,150 14.0 1.17 1.04-1.33
6-11 305/2,372 12.9 1,590/12,475 12.8 1.01 0.89-1.15
12-17 285/2,750 10.4 794/7,736 10.3 1.01 0.88-1.16
0-17 930/7,240 12.9 4,649/36,361 12.8 1.07* 0.96-1.19
overall 0-5 13,980/96,415 14.5 13,964/92,848 15.0 0.96 0.93-0.98
6-11 5,068/45,488 11.1 8,080/66,441 12.1 0.91 0.87-0.94
12-17 1,676/17,470 9.6 3,225/31,706 10.2 0.94 0.88-1.00
0-17 20,724 /
159,373
13.0 25,269/190,995 13.2 0.96* 0.93-0.98
* Cochran–Mantel–Haenszel test, taking into account the different distribution among age-
strata.
When considering the distribution of events among the three age-strata in the group
receiving amoxicillin clavulanate, there was a slightly lower rate of recurrent prescriptions
116
in children receiving a generic formulation (OR 0.91; 95% CI 0.87-0.94). A similar, yet not
clinically relevant, result was observed when comparing the children receiving any generic
or brand name antibiotic (OR 0.96; 95% CI 0.93-0.98).
c. Hospital Admission
A total of 3,469 hospital admission occurred within 28 days from an index prescription
during the observational period. Of these 3,077 (88.7%) occurred in children receiving one
of the four selected antibiotics. The percentage of overall hospital admissions occurring in
children treated (as index prescription) with a brand name (1.01%; 95% CI 0.98-1.08%) or a
generic drug (1.03%; 95% CI 0.96-1.06%) did not differ (χ2=0.543; p=0.43). The number and
percentage of hospital admissions for each of the four active substances and for generic vs
brand name formulations is reported in Table 18. When adjusting for events occurring in
the three different age strata (Cochran–Mantel–Haenszel test), the OR was significant
(0.86; 95% CI 0.76-0.96) for amoxicillin clavulanate, with a lower percentage of hospital
admission in patients receiving a generic formulation compared with those receiving a
brand name one (p=0.002), Table 18.
When using a composite endpoint (the percentage of children with either a hospital
admission or a recurrent prescription in both generic and brand name groups) the results
were similar to those already observed.

117
Table 18 – Number and percentage of hospital admissions among children receiving a
generic or brand name formulation of the four antibiotics considered. The outcome in the
two populations was evaluated through a χ2 test. The significant odds ratios and
confidence intervals are in bold.
age hospital admission χ2 (generic vs brand
name)
generic formulation brand name
formulation
OR 95% CI
N. % N. %
amoxicillin 0-5 556/39,931 1.39 132/10,475 1.26 1.11 0.91-1.34
6-11 79/13,872 0.57 40/8,860 0.45 1.26 0.86-1.85
12-17 27/4,041 0.67 28/6,168 0.45 1.48 0.87-2.51
0-17 662/57,844 1.14 200/25,503 0.78 1.16* 0.96-1.41
amoxicillin
clavulanate
0-5 443/35,754 1.24 688/46,043 1.49 0.83 0.73-0.93
6-11 122/19,690 0.62 231/32,280 0.72 0.87 0.69-1.08
12-17 75/9,456 0.79 118/15,184 0.78 1.02 0.76-1.37
0-17 640/64,900 0.99 1,037/93,507 1.11 0.86* 0.76-0.96
cefaclor 0-5 49/4,784 1.02 81/7,800 1.04 0.99 0.69-1.41
6-11 9/1,756 0.51 14/4,030 0.35 1.48 0.64-3.42
12-17 1/170 0.59 3/707 0.42 1.39 0.14-13.4
0-17 59/6,710 0.88 98/12,537 0.78 1.05* 0.74-1.50
clarithromycin 0-5 26/2,109 1.23 224/15,544 1.44 0.85 0.56-1.28
6-11 10/2,262 0.44 74/11,499 0.64 0.69 0.35-1.32
12-17 13/2,622 0.50 34/7,171 0.47 1.05 0.55-1.99
0-17 49/6,993 0.70 332/34,214 0.97 0.85* 0.57-1.26
overall 0-5 1,074/82,578 1.30 1,125/79,862 1.41 0.92 0.85-1.00
6-11 220/37,580 0.59 359/56,669 0.63 0.92 0.78-1.09
12-17 116/16,289 0.71 183/29,230 0.63 1.14 0.90-1.44
0-17 1,410/136,447 1.03 1,667/165,761 1.01 0.94* 0.87-1.02
* Cochran–Mantel–Haenszel test, taking into account the different distribution among age-
strata.

118
4. Discussion
To the best of our knowledge this is the first pharmacoepidemiological study using a
database of health determinants to compare generic and brand name antibiotic
recurrences in children and adolescents.
The findings did not show any substantial differences in the percentage of recurrent
prescriptions in children receiving a generic or a brand name formulation when looking
both at the overall antibiotic prescriptions and the single active substances. In fact, when
looking at specific active substances and age-strata there are statistically significant
differences, but when adjusting for age the differences observed disappear. In the case of
amoxicillin clavulanate the prescription of a brand name formulation seems to be
associated with slightly higher rates of both recurrent prescriptions and hospital
admissions. Nevertheless, the absolute differences observed are very small, and not
clinically significant. In fact, statistical significance is due to a very large sample size,
especially for the amoxicillin clavulanate group, and, consequently, very narrow confidence
intervals. Moreover, it is not possible to exclude the presence of susceptibility bias,
occurring when the treatment regimen selected for a patient depends on the severity of
the patient's condition. In fact if physicians were, at least in part, biased toward the
prescription of a generic, they could have more often prescribed the brand name
amoxicillin clavulanate to patients with the more severe disease at presentation. The
considerations above are valid also for the group of children receiving any generic antibiotic
compared to those receiving any brand name antibiotic.
When taking into account the distribution by age, the number of recurrences and hospital
admissions were not higher in the generic drug group for any of the antibiotics considered,
highlighting the fact that children exposed to generics do not appear to be more prone to
recurrences. The findings are consistent with efficacy outcomes evaluated in previous
clinical trials involving brand name and generic antibiotic formulations [155,156]. In the
literature very scant data are available concerning the effectiveness of generic and brand
119
name antibiotic formulations in the outpatient setting. In fact, most studies evaluated
effectiveness in hospitalised patients, involving carbapenems or piperacillin/tazobactam
[155, 159-161].
The general prescription profile is the same observed in other pharmacoepidemiological
studies that reported data about the same setting and population of patients [20,145].
When a recurrence occurred, the same active substance was prescribed again in most
cases. This finding is not surprising and probably implies that, in most cases, physicians
were convinced that a longer therapy with the same antibiotic would have been successful.
Concerning therapy switches, the findings highlighted the fact that amoxicillin clavulanate
was the most used antibiotic when a recurrence occurred, independently of the active
substance used as the index prescription. In these cases physicians might be convinced that
the previous antibiotic course failure was due to beta-lactamase producing bacteria (when
amoxicillin alone was given).
In about half of the cases, children receiving a generic drug during the index prescription
switched to a brand name formulation when a recurrence occurred: this fact may be due, at
least in part, to the switch in active substance. In fact, different antibiotics have different
rate
s of generic use, e.g. the amoxicillin clavulanate generic prescription rate is lower than that
of amoxicillin. On the contrary, when physicians prescribed the same active substance in
the recurrence, there was a high concordance of use of generic and brand name
formulations in the index and recurring prescriptions. It would seems therefore that
physicians tend not to change their prescribing attitude when the same antibiotic is chosen.
In Italy generic drug prevalenceis particularly low compared to the rest of Europe, with less
than one in three antibiotic prescriptions constituted by generic formulations in the
Lombardy Region, and the percentage is likely to be lower in other regions [162]. Patients’
opinions on generic drugs can influence the likelihood of receiving a generic prescription,
but if their doctor is willing to explain why generic drugs are as effective as the brand name

120
ones the rate of acceptance of drug substitution rises [163]. Unfortunately, in daily clinical
practice, the physician’s main source of information about drugs are pharmaceutical
company representatives, and these representatives can greatly influence their perception
about generic drugs [164]. The literature reports that a significant proportion of physicians,
especially the older ones, have negative perceptions of generic drugs [164], and this is
probably the most relevant deterrent to generic prescriptions, also in Italy [137]. Our
findings are in agreement with most of the literature on generic antibiotics, which states
that they are a safe [149,156] and economic alternative [22,149] to brand name ones.
Despite these facts generic formulations continue to be underused, and the reason is likely
to be biased information on generic drugs [137]. Although the cost analysis of generic vs
brand name antibiotics was not the goal of the present study, the use of generic antibiotics
(also in children) is cost-effective [22, 162].
In order to promote a more rational and cost-effective drug use, new approaches to
physicians’ education and information about drugs should be undertaken by policy makers,
promoting a more correct and less biased vision of the generic market among physicians.
5. Strengths and Limits
This study included a large cohort of children/adolescents, retrospectively followed for 3
months, including all the reimbursed prescriptions filled by FPs and GPs. The cohort of
children/adolescents included the total population of a large Italian region, avoiding
possible selection biases derived from different socio-economic and cultural backgrounds.
Hospital admissions and composite endpoint analyses were included as a proxy of severe
disease and therapy failure, showing results in complete agreement with those observed
during the recurrent prescription analysis.
Some intrinsic limitations are present given that this is a retrospective observational study.
A recurrent prescription within 28 days of an index prescription is used in this study as a

121
proxy of therapy failure, and although this is a quite arbitrary period, this approach was
already used in literature [165]. When looking at recurrent prescriptions, it is possible that
some were actually relapses (second infection with the same organism) or reinfections
(different organism), and we were not able to discriminate between them. The previously
described susceptibility bias could have been adjusted only by knowing the diagnosis and
the clinical anamnesis, which was not the case. Despite this, it is likely that the diseases,
including a number of non-recognized viral infections, were distributed evenly between the
groups of patients receiving a generic or brand name antibiotic, so the results should not be
influenced.
Only antibiotics with paediatric generic formulations marketed for more than two years
were included in this study (amoxicillin, amoxicillin clavulanate, clarithromycin, and
cefaclor). The four drugs covered 87% of the overall antibiotic prescriptions, the use of
other generic antibiotics was uncommon, and the comparison with the group receiving the
brand name alternatives not feasible. We also could not ascertain compliance to treatment
or if the drug was actually consumed by patients: these are limitations common to all
pharmacoepidemiology studies using prescription databases.
6. Conclusions
Findings showed that children initially treated with a generic formulation of the considered
antibiotics had no different safety and effectiveness outcomes compared to those treated
with a brand name formulation. The results of the study are in agreement with most of the
literature on this topic and provide additional evidence on the safety of use of generic
antibiotics in the outpatient setting, an area that is scantly investigated. The anecdotal
reports of non-effectiveness are not justified by the data observed in this study and may be
due to economic interests more than real differences. Policy makers should promote
122
objective information on generic drug use in order to hinder the pressure to prescribe a
brand name formulation exerted by pharmaceutical representatives on physicians.
Finally, even if with a few limitations, this study supports the usefulness of routinely
acquired healthcare data in terms of clinical research potential, even if these results should
be validated against a gold standard.
123
D. Assessing the quality of paediatric antibiotic prescribing by community
paediatricians: a database analysis of prescribing in Lombardy
1. Introduction
The lack of appropriate use of antibiotics and antibiotic resistance have been worldwide
problems for the last few decades [166]. Unnecessary antibiotic prescriptions for viral
diseases, and the use of second choice therapies for certain conditions, can increase
antibiotic resistance also in the community setting (i.e. S.Pneumoniae resistance to
macrolides) [166,167]. Since children are among the most exposed to this drug class,
rational antibiotic prescribing in paediatrics is of paramount importance [1].
Antibiotics are overused in outpatient children in Italy more often compared to other
European countries [4]. Frequent prescriptions of second choice treatments, and wide
heterogeneity in prevalence at different geographic area levels (34.0 to 67.9 % among
healthcare districts) have been identified and described [6,12,122]. Amoxicillin is the first
line treatment for respiratory infections in children in the community setting, and we
previously used it as a proxy of appropriateness in Italy ,with large differences in prevalence
ranging from 8.7% to 28.1% among regions, and from 7.1 to 48.0% among local health units
[6,168]. The percentage of children treated with amoxicillin was later proposed as an
indicator of the quality of prescribing (amoxicillin index) by de Bie et al [169].
The FP’s prescribing attitude has already been identified as one of the main determinants
of differences in antibiotic prevalence at the area level [12]. Despite this, the association
between the amount of antibiotics prescribed and the qualitative profile is a scantly studied
topic. Moreover most epidemiological studies on drug prescription patterns are based on
administrative databases that rarely contain the indication for the prescription. Thus,
evaluating appropriateness on a selected population by developing specific quality
indicators may be a useful proxy for the quality of antibiotic prescribing.
124
The aim of this study was to evaluate the quality of FPs’ antibiotic prescribing through
administrative databases by analysing a selected population of children and by using
indicators at the population level.
2. Methods
a. Data source
The data source was the database of the Lombardy Region, which is routinely updated for
administrative and reimbursement reasons. The region is divided into 8 Local Health Units,
which are further divided into two to seven smaller areas called ASSTs (Social health
territorial units), for a total of 27 ASST. The three ASSTs referring to the city of Milan are
considered as a unique ASST in this study. Only drugs reimbursed by the NHS are included
in the database. Anonymous data were provided by the regional health ministry of the
Lombardy Region. All drugs were classified according to the ATC system (Anatomical
Therapeutic Chemical classification system).
b. Index prescription
An index prescription was defined as the first antibiotic prescription in 2011 that occurred
without: an antibiotic prescription in the previous 60 days, a hospital admission in the
previous 60 days, and an emergency department admission in the previous 14 days.
c. Inclusion criteria
Children and adolescents 1-13 years old, cared for a FP, who received at least one index
prescription during 2011 were included.
d. Exclusion criteria
Children who received 7 or more antibiotic prescriptions (95° percentile of the distribution
of annual prescriptions per children at four years of age, the age with the most antibiotic
prescriptions) in the 365 days either before or after the index prescription were excluded
(31,899; 2.7% of the resident population). This criteria ensured that children included in the

125
study were not patients with chronic infections, or with other conditions requiring
recurrent antibiotic courses.
Children who were not residents in the Lombardy Region from the year before the index
prescription until the end of the follow up period were excluded. Children in the first year
of life were excluded because of possible treatments for bronchiolitis.
Children who were residents in one of two specific ASSTs were excluded because data on
emergency department admissions were not available.
Children who were not cared for by a FP were excluded (59,875; 5.0% of the resident
population), and those who were cared for by FPs with less than 98 patients (10° percentile
of the distribution of the number of children per FP) were excluded in order to have a more
homogeneous population of FPs (1,760 patients; 0.1%).
Of the 1,002,006 resident children, 424,280 (cared for by 1,164 FPs) satisfied the inclusion
and exclusion criteria and were included in the study.
e. Measures
The percentage distribution of antibiotic prescriptions by class and active substance (for
amoxicillin and amoxicillin clavulanate) was investigated.
f. Data analyses
Each child or adolescent, and FP, was followed for one year from the index prescription.
The profile of antibiotic prescriptions was estimated at the population level:
1) at the index prescription;
2) in unrelated infective episodes, identified by a new antibiotic prescription occurring 30
days or more after the index prescription.
g. Quality indicators
- The A indicator was the proportion of children who received amoxicillin by the FP at the
index prescription. From the prospective evaluation of data in paediatric ambulatory care in
Italy it is known that more than half of the systemic antibiotics are prescribed for
pharyngotonsillitis (26.9%) and acute otitis media (AOM; 24.4%) [170]. In case of bacterial

126
AOM and pharyngotonsillitis, amoxicillin is the first line therapy because, respectively, S.
Pyogenes (always sensible)[171-173] and S.Pneumoniae (highly sensible in 90% of cases
[171,174-177]) are the pathogens that are able to cause the most important complications.
Amoxicillin is the first line therapy also in case of scarlet fever caused by S.Pyogenes (3% of
antibiotic prescriptions [170]), uncomplicated pneumonia [178,179], and sinusitis
[170,180]. Hence we estimated that at least 50% of patients treated with an antibiotic
should be initially treated with amoxicillin (target for the A indicator).
- The B indicator was the proportion of children who received cephalosporins or
macrolides, exclusively, by the FP for every unrelated infective episode. The maximum
target percentage was set at 10%. The rationale of this criterion was that self-reported
hypersensitivity to beta-lactams in children varies from 1.7 to 7.9% [181-183]. We are
therefore confident that in no more than 10% of children hypersensitivity can justify the
exclusive prescription of second choice treatments throughout the year.
Number of FPs that reached the target for the A or B indicators has been estimated also at
the ASST level. Number of FPs that reached the target for both indicators was also
estimated.
The geographical distribution of FPs in respect to the quality indicators was represented in
choropletic maps. Clusters and outlier values were calculated by using the Anselin Local
Moran’s I statistic [184].
The FPs were categorised based on the distribution of the average number of antibiotic
prescriptions per patient, considering all their patients ≥1 to 13 years old: low prescriber
corresponded to the arithmetical mean minus the standard deviation (y<�̅� − 𝑠𝑑 , lower
than 0.74), a mean prescriber to �̅� − 𝑠𝑑<y<�̅� + 𝑠𝑑 (0.74 to 1.44), and high prescriber to
y>�̅� + 𝑠𝑑 (higher than 1.44). The same criteria were used for classifying FPs in respect to
age (young ≤44; adult 45-59; and elderly ≥60), and in respect to number of patients (low
≤645; mean 646-1,076; and high≥1,077).The quality of prescription (A and B indicators) was
estimated in the different groups of FPs (low/mean/high prescriber). Cochran-Mantel-
127
Haenszel test for trend was used to test the difference among low, mean, and high
prescribers. A multivariable logistic regression analysis was performed at the FP level on the
likelihood of reaching the target for both A and B indicators. The FPs’ covariates considered
were: sex, age, prescribing pattern in respect to quantity of antibiotic prescriptions, number
of children cared for by each FP, and area of residence. The variables entered the model by
a stepwise selection with a significance α=0.05.
The statistical analyses were performed with SAS 9.5, and the cartographic representations
and spatial analyses with ArcMap 10.5.
3. Results
Of the 1,002,006 children 1 to 13 years old in our sample, 49.9% received at least an
antibiotic prescription. Prevalence decreased with increasing age from 63.9% (1 to 5 years
old) to 30.4% (10 to 12 years old).
Overall 1,164 FPs cared for a median of 857 children (IQR 736-1012). FPs were mostly
females (75.3%), and the median age was 53 years old (IQR 48-56).
a. Prescription profile
Of the 424,280 children included in the study with an index prescription: 146,582 (34.5%)
received one antibiotic prescription, 115,541 (27.2%) received two prescriptions, and
162,157 (38.2%) received three to six prescriptions in the year of follow-up. Penicillins were
prescribed in 68.6%, macrolides in 16.5% and cephalosporins in 13.3% of cases at the index
prescription. The most prescribed active substance was amoxicillin clavulanate at any age,
table 19.

128
Table 19 – Percentage distribution of children at the index prescription by active
substance and age strata
≥1 year 2-5 years 6-9 years 10-13 years Total
n % n % n % n % n %
amoxicillin clavulanate 25,858 41.1 91,630 46.0 51,146 46.3 21,699 42.2 190.333 44.9
amoxicillin 22,350 35.5 46,730 23.4 21,789 19.7 9,696 18.9 100.565 23.7
clarithromycin 3,286 5.2 15,838 7.9 11,136 10.1 6,581 12.8 36.841 8.7
azithromycin 2,577 4.1 13,835 6.9 9,885 8.9 6,298 12.3 32.595 7.7
cefixime 2,499 4.0 8,765 4.4 4,816 4.4 2,368 4.6 18.448 4.3
cefaclor 2,917 4.6 9,087 4.6 3,602 3.3 817 1.6 16.423 3.9
cefpodoxime 1,772 2.8 6,797 3.4 3,863 3.5 1,572 3.1 14.004 3.3
ceftibuten 836 1.3 2,595 1.3 1,237 1.1 423 0.8 5.091 1.2
fosfomycin 47 0.1 862 0.4 837 0.8 389 0.8 2.135 0.5
cefuroxime 195 0.3 782 0.4 531 0.5 311 0.6 1.819 0.4
other 291 0.5 1.087 0.5 786 0.7 711 1.4 2.875 0.7
> one antibiotic 293 0.5 1.392 0.7 951 0.9 515 1.0 3.151 0.7
Total 62,921 100 199,400 100 110,579 100 51,380 100 424,280 100
Amoxicillin was prescribed at the index prescription to 23.6% of children, this indicator
varied widely at the area level ranging from 7.9% to 46.3% among ASSTs. In none of the
ASST the percentage of children receiving amoxicillin at the index prescription reached the
target of the 50%.
A total of 258,681 children (61.0%) had one or more unrelated infection episodes 30 days
or more after the index prescription. The majority of these children (208,768; 80.2%)
received different antibiotics during the year; 12.1% of children (31,192) received
exclusively second choice treatments like macrolides and cephalosporins, and 7.7%
(19,914) exclusively amoxicillin. These percentages varied widely between ASSTs: from
8.2% to 22.0% for the former indicator, and from 1.4% to 21.8% for the latter.
b. Paediatricians
Each FP prescribed amoxicillin at the index prescription to a median of 21.1% (IQR 9%-37%)
of patients, and prescribed only non-penicillin antibiotics in unrelated infective episodes to
9.3% (IQR 6%-14%) of patients.

129
The percentage of FPs who reached the target of having prescribed amoxicillin at the index
prescription to at least 50% of patients (A indicator) was 12.8%. The percentage of FPs who
reached the target of having prescribed exclusively non-penicillin antibiotics in unrelated
infection episodes to less than 10% of patients (B indicator), was 54.0%. Overall, 131 FPs
(11.3%) reached the target for both indicators (covering 11.2% of the regional child
population). On the contrary, 518 FPs (44.5%, covering 44.8% of the regional child
population) showed inadequate quality of antibiotic prescribing, not reaching the target for
either of the two indicators.
Table 20 - Distribution of two quality indicators among the FPs ordered by type of
prescriber
Type of FP
Indicator A1 Indicator B2
Adequate quality according to adherence
to both indicators
No Yes Total % Yes No Yes Total % Yes No Yes Total % Yes
Low prescriber 121 30 151 19.9 43 108 151 71.5 122 29 151 19.2
Mean prescriber 751 107 858 12.5 395 463 858 54.0 765 93 858 10.8
High prescriber 143 12 155 7.7 98 57 155 36.8 146 9 155 5.8
Total 1,015 149 1,164 12.8 536 628 1,164 54.0 1033 131 1,164 11.3
p 3
0.002
<0.001
<0.001
1. FPs who prescribed amoxicillin at the index prescription to at least 50% of their patients
2. FPs who prescribed only non-penicillin antibiotics in unrelated infective episodes to a
maximum of 10% of their patients included in the study.
3. Cochran-Armitage trend test
High prescribers were less likely to prescribe amoxicillin at the index prescription (χ2for
trend p=0.002), and were more likely to prescribe only non-penicillin antibiotics (χ2for trend
p<0.001), table 20. The univariable analysis showed that FPs with an adequate quality of
antibiotic prescribing (reaching the target for both the A and B indicators) were more likely
to be: low prescribers, males, elderly, and resident in a specific cluster of high values
identified by the spatial analyses in a urban area in north of Milan, figure 6 and table 21.

130
Figure 6 - Distribution of the FPs that prescribed amoxicillin alone at the index
prescription to at least 50% of their patients included in the study (A indicator), and of
the percentage of FPs that prescribed exclusively non-penicillin antibiotics in different
infection episodes to more than 10% of their patients included in the study (B indicator).
Spatial cluster analysis of the distribution of the indicators by ASST.
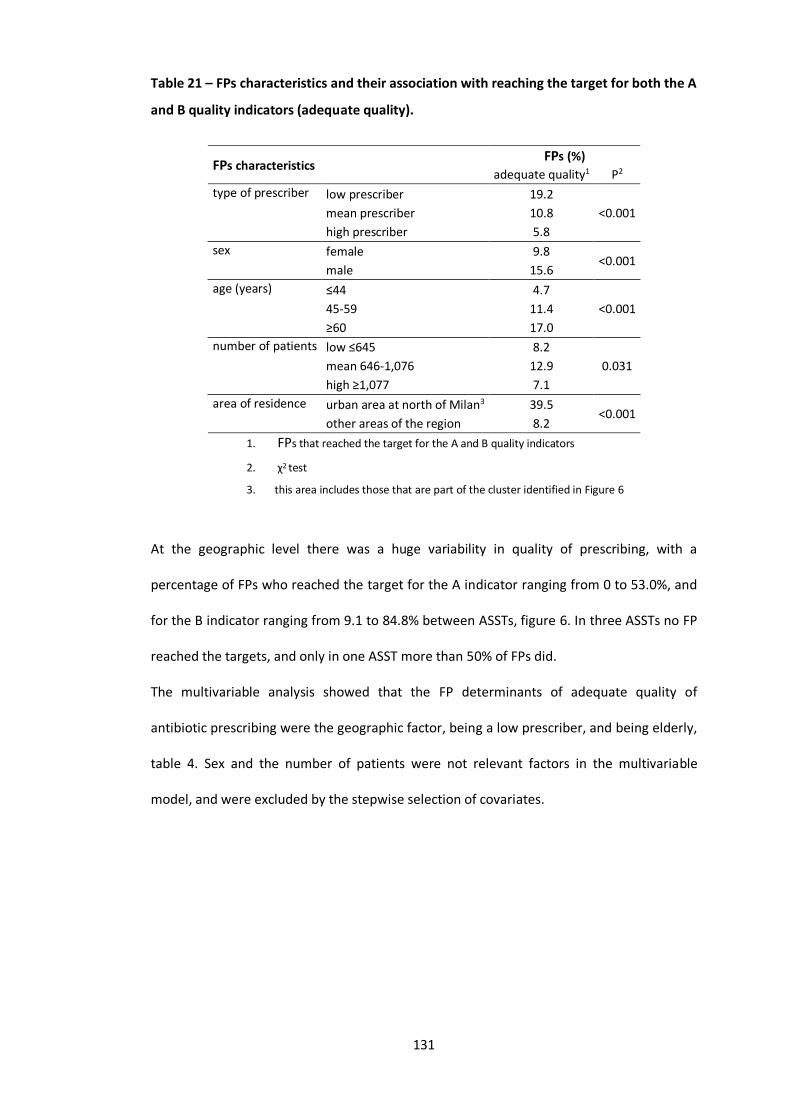
131
Table 21 – FPs characteristics and their association with reaching the target for both the A
and B quality indicators (adequate quality).
FPs characteristics FPs (%)
adequate quality1 P2
type of prescriber low prescriber 19.2
<0.001 mean prescriber 10.8
high prescriber 5.8
sex female 9.8 <0.001
male 15.6
age (years) ≤44 4.7
<0.001 45-59 11.4
≥60 17.0
number of patients low ≤645 8.2
0.031 mean 646-1,076 12.9
high ≥1,077 7.1
area of residence urban area at north of Milan3 39.5 <0.001
other areas of the region 8.2
1. FPs that reached the target for the A and B quality indicators
2. χ2 test
3. this area includes those that are part of the cluster identified in Figure 6
At the geographic level there was a huge variability in quality of prescribing, with a
percentage of FPs who reached the target for the A indicator ranging from 0 to 53.0%, and
for the B indicator ranging from 9.1 to 84.8% between ASSTs, figure 6. In three ASSTs no FP
reached the targets, and only in one ASST more than 50% of FPs did.
The multivariable analysis showed that the FP determinants of adequate quality of
antibiotic prescribing were the geographic factor, being a low prescriber, and being elderly,
table 4. Sex and the number of patients were not relevant factors in the multivariable
model, and were excluded by the stepwise selection of covariates.

132
Table 22 – Logistic multivariable regression model for the likelihood of each FP of
reaching the target for both the A and B quality indicators according to sex, age,
prescribing pattern in respect to quantity of antibiotic prescriptions, number of children
cared for by each FP, and area covered by FPs’ offices.
Covariates OR 1 CI 95%
type of prescriber
low prescriber 4.61 (1.99 – 10.69)
mean prescriber 2.26 (1.08 – 4.75)
high prescriber 1.00 -
age (years) ≤44 1.00
45-59 2.41 (1.07 – 5.46)
≥60 3.98 (1.58 – 10.04)
area covered by FPs’ offices
urban area at north of Milan 2 8.64 (5.47 – 13.66)
other areas of the region 1.00 -
1. sex and number of children cared for by each FP did not enter the model according to the stepwise
selection
2. cluster of high values identified in Figure 6, according to the Anselin Local Moran’s I statistic
4. Discussion
To the best of our knowledge this is the first study evaluating the quality of FPs’ antibiotic
prescribing through an administrative database in Italy.
In order to reach our objective, we selected, and monitored, children who were receiving a
course of treatment not preceded by any antibiotic prescription and/or hospitalization in
the preceding two months. In this regard, we were confident that, at least for the index
prescription, amoxicillin would be prescribed to the majority of children in our sample. At
the population level this was not found, and only 24% of children (less than half of
expected) received amoxicillin as the index prescription. Despite the fact that the Lombardy
Region is among the settings with a relatively low antibiotic prescription rate in Italy, the
above findings reveal a poor average quality of prescriptions.
In other international studies the amoxicillin index was found to be very heterogeneous
[4,169,185,186], ranging from 21.1% in Germany to 46.8% in the Netherlands, even if in
Germany phenoxymethylpenicillin appropriately accounts for a significant additional

133
proportion of prescriptions, differently from Italy. First line penicillins were found to be
scantly prescribed in Italy in a recent study comparing 6 different countries: from 64.8% of
antibiotic prescriptions in Norway, to 24.1% in the Pedianet database (Italy) and 8% in the
Lazio Region (Italy) [187]. We were not able to find studies that evaluated the FPs’ quality
of prescribing at the prescriber level with criteria comparable to those used in our study.
Only one French study investigated the qualitative profile of community paediatricians at
the prescriber level, finding cefpodoxime as the most prescribed antibiotic, and amoxicillin
representing 25% of the antibiotic prescriptions [188]. Other studies evaluated the
appropriateness of antibiotic prescribing at the population level or comparing different
type of prescriber [189,190]. In these studies the first-choice antibiotics were prescribed in
50%-85% of episodes, and there were wide qualitative differences among GPs and FPs
[189,190].
In our study the most prescribed antibiotic was amoxicillin-clavulanate at any age, even
though it is less palatable and tolerable than amoxicillin alone [191,192]. It is very likely that
this happens for fear of infections caused by beta-lactamase producing bacteria. This is
unjustified by the evidence, which shows that beta lactamase producing bacteria in AOM or
sinusitis, for example, are those causing less severe complications and whose infections
most commonly resolve spontaneously [174,176,180].
Different factors (e.g poor education, parental expectation of a prescription), may explain
some of the qualitative and quantitative differences between Italy and other countries.It is
likely that most of the differences observed in our study are due to the FPs’ prescribing
patterns. We already documented that in the areas where antibiotic prevalence is higher,
high prescribing FPs are more frequent [12]. In this regard, the current study adds relevant
findings concerning quality of prescriptions.
The percentage of FPs with adequate quality of antibiotic prescribing was extremely low,
and almost half of the FPs did not reach the target for both the A and B indicators. This
means that almost half of the regional child population was treated with antibiotics that

134
exposed them to greater potential risks. An impressive variability was found between
ASSTs, with only one having more than 50% of FPs with good quality prescribing, and three
ASSTs with no FPs reaching the target . It is quite striking that there were a few FPs who did
not prescribe the recommended treatment at all at the index prescription to any of their
patients.
When looking at the percentage of children receiving second line treatments only
(macrolides and/or cephalosporins, B indicator) in all the infection episodes, the average
value was slightly above the threshold expected on the basis of the frequency of beta-
lactams hypersensitivity. Also in this case a huge variability was found between ASSTs, with
some geographical settings exceeding 20%. Cephalosporins are hardly ever prescribed in
the community setting in most of the north European countries and do not present
significant benefits over amoxicillin in most cases [4]. Macrolides are very susceptible to
developing resistance, and should be used in selected cases, or in hypersensitive patients
[193].
Quantity of antibiotics prescribed was associated with quality. The proportion of FPs
reaching the target for both indicators was almost fourfold higher in the low prescribing
group compared to the high prescribing group. Considering, as an additional criteria of
“good practice”, the limited prescription of antibiotics, only 29 out of 1164 FPs satisfied
both A and B indicators and were also “low prescribers”. Additionally 146 out of 1164 FPs
(12,5%) were high prescribers and did not reach the target for the quality indicators.
Moreover, the Lombardy Region is among the regions with the highest amoxicillin index in
Italy, it is thus expected that in other regions the quality indicators at the FP level will be
worse [4].
The study highlighted a specific cluster of higher quality antibiotic prescriptions in an urban
area slightly north of Milan. This confirms a long term effect of a continuous educational
intervention (in the period 2004-2008) on a group of FPs in this area that was aimed at
enforcing the international guidelines for antibiotic treatment of respiratory infections in

135
clinical practice [12,22]. The educational intervention was mainly based on peer
comparison. The notable persistence is quite remarkable, and is different from the results
that are usually obtained with educational interventions that are limited in time [194].
Other factors may be associated with the quality of prescribing, for example socio-
economic factors. We already showed in a multiregional study that antibiotic prevalence is
higher in low income areas [122]. We compared the amoxicillin index at the ASST level to
the average annual income per resident, and found that the qualitative profile was likely to
be worse in low income areas (not shown). However, since the Italian NHS is universalistic,
being poor or wealthy is unlikely to influence the type of antibiotic prescribed, because
parents of children don’t have to spend money for antibiotics. Income deprivation in this
case may be a proxy of cultural deprivation [67]. This correlation should be investigated
also in countries with private health services. However we believe that prescribing attitude
is the most crucial factor in the heterogeneity found because, even when looking at the
same homogenous geographic context, FPs had very different qualitative profiles of
prescribing. Finally, increasing paediatrician age was one of the factors significantly
associated with a better quality of antibiotic prescribing. This finding is unexpected, since
most studies on the association between quality of care and physician age were
inconclusive or showed that older physician may be at risk of providing lower quality of care
[190,195,196]. This is an important indication of the need for targeting educational
interventions especially at the youngest FPs.
The main weakness of the study is the lack of the diagnoses. We, therefore, were not able
to evaluate the appropriateness of prescriptions. Nevertheless, real world data concerning
the access to primary care ambulatories for respiratory infections were used to identify the
cut-offs for the quality indicators. We were able to analyse only reimbursed prescriptions,
and not private practice paediatricians. However this fact has a negligible influence on the
study, since the aim was to investigate the FPs’ quality of antibiotic prescribing. The
strength of the study is the possibility to compare the results with previous studies in the

136
overall paediatric population in the same region, and to establish the added value of this
approach. The results showed that the quality indicators proposed, if further validated, may
be a promising tool for benchmarking the antibiotic prescribing trend at the paediatrician
level even without knowledge of the diagnoses, and could highlight those prescribing
behaviours that deviate from the guideline indications.
5. Conclusions
The quality indicators proposed were able to identify areas of the region, and FPs, with
inadequate quality of prescriptions. The youngest FPs and those who were not exposed to
educational interventions showed a significantly worse quality of prescribing.
FPs who were part of a continuous educational programme on the improvement of
antibiotic prescribing had a better prescription profile. After further validation, these
quality indicators could be a surrogate benchmarking tool for comparing the quality of FPs’
antibiotic prescriptions, when the diagnosis is unknown, in different settings.

137
VII. Overall discussion and conclusions

138
A. Summary
Quantitative and qualitative differences were found in drug prescribing in children and
adolescents between regions and LHUs. Despite the differences, a prescribing profile
specific to Italy was observed in all the settings, characterised by extensive use of antibiotic
and anti-asthmatic drugs, and limited use of psychotropic drugs compared to other
countries. The differences appear to be mainly related to prescribing attitudes in Italian
physicians but also to other cultural factors and related to the population income.
B. Determinants and relevance
The geographical factor was one of the main determinants of antibiotic and anti-asthmatic
drug prevalence. In particular, both lower latitude and income were associated with an
higher prevalence of antibiotic and anti-asthmatic prescription, but not psychotropic drug
prescription.
As we know, income in Italy is associated with latitude, i.e. in the South income is lower.
However these drugs are fully reimbursed by the NHS, so the reason for this association is
unlikely to be poverty. It is likely that these two factors may be a proxy for other socio-
economic indicators such as educational deprivation, which is known to be higher in the
South of the country. However it is very likely that the true cause of the association
between the increased prevalence in these areas is still unknown since these are ecological
studies with no individual level data, and a limited amount of covariates available.
The study on psychotropic drug prescription is the largest ever conducted in Italy.
Psychotropic drug prescription in paediatric patients is a quite rare event, also strictly
regulated in the case of ADHD drugs. It is likely that the closed surveillance and monitoring,
and the need of a more specific disease knowledge for a parent whose child is in need for a
psychotropic drug, may result in less interference with the physician’s decision of a
pharmacological treatment. This phenomena may mitigate differences among regions.

139
The research area on the quality of drug prescription, including generic drugs, the study
about proxies of clinical effectiveness of generic versus brand game antibiotics, and the
developing of the quality indicators at the paediatrician level is a quite innovative approach
in this field. From the results of the studies the prescriber’s attitude seems to be the main
determinant of drug prescribing. The studies showed that high prescribing physicians tend
to prescribe with a worse qualitative profile, by using less the first line antibiotic
treatments, and by using more second choice treatments. They also tend to use less generic
antibiotics. Also, conversely, we found that younger FPs prescribe less recommended
treatments, and this is quite alarming.
The review of the literature was the first in this field. The review showed that there was
indeed an association between parental and offspring drug prescription, at least for some
kind of drugs, even considering socio-economic and educational confounders which may
come into play. However the topic is scantly studied, and there is need for more studies in
particular investigating the association among different drug classes. The hypothesis that
some authors postulated concerning the possible role of parental stress, anxiety, and other
kind of psychiatric conditions is quite interesting, and deserves ad hoc studies.
C. Possible priority interventions
The wide differences observed in terms of quality and quantity of prescriptions between
and within regions suggest that educational interventions for health care professionals and
parents may be effective in improving rational drug use. In particular more efforts are
needed in certain geographical contexts characterised by a low prevalence, but associated
with inappropriate drug use.
The findings from this thesis demand more attention and efforts by health policy makers in
regards to:
- educational campaigns and local intervention to limit antibiotic prescriptions, especially in
the South of Italy, but also in some particular areas of the North of the country;

140
- promoting the use of amoxicillin among FPs, that too often prefer amoxicillin clavulanate
in Italy for fear of beta-lactamase producing bacteria, or other second line drugs such as
cephalosporins and macrolides;
- promoting the use of rapid-antigen-detection tests (RADT) and other self-help instruments
in paediatric ambulatory in order to reduce diagnostic uncertainty, which the literature
shows to be among the most important factors determining the chance of an antibiotic
prescription;
- progressively reducing, and eradicating, the widespread practice of non-evidence based
treatments such as nebulised steroids for treating symptoms of URTI;
- promoting a working group on an acknowledged shared formulary in paediatrics, which
could help in reducing the incredible number of redundant active substances that is
currently used in the clinical practice;
- more standardised clinical and therapeutical approaches in the field of paediatric mental
health among different geographic areas in the country, which could lead to a decreased
use of off-label active substances in some cases, and an increased use of those treatments
supported by more solid evidence;
- promoting generic drug prescription and use, through educational interventions to
phisycians and citizens stating that they are safe and effective alternatives to brand name
drugs, and provide sustainability of the NHS;
Finally the studies described in this thesis confirm that pharmacoepidemiology is a valuable
tool for monitoring drug prescribing and giving indications to policy makers. Merging
different administrative databases (e.g. prescription, hospitalisation, specialist physician
databases) maypermit to observe determinants related to prescription attitudes.

141
D. Future perspectives
In order to overcome the limitations of administrative databases in the future, the study of
the determinants of drug and other health resources use will continue by setting up a
prospective birth cohort study. The birth cohort will evaluate the role of maternal and
young child determinants on the health status during infancy and development. The cohort
will collect a number of different information concerning birth, familiar characteristics and
anthropometric information that cannot be obtained by administrative databases.
Finally, multinational collaborative studies are warranted, with the aim to collect
representative and comparable data among different countries and different kind of health
services, in order to improve the rational use of drugs and to guarantee safe and effective
drug therapies to children and their families.

142
VIII. References
143
1. Choonara I. Rational prescribing is important in all settings. Arch Dis Child 2013;98:720.
2. World Health Organization. WHO Medicines Strategy 2008-2013, Draft 8
http://www.who.int/medicines/publications/Medicines_Strategy_draft08-13.pdf, 12
February 2013.
3. Clavenna A, Bonati M: Drug prescriptions to outpatient children: a review of the
literature. Eur J Clin Pharmacol 2009; 65:749–755.
4. Clavenna A, Bonati M. Differences in antibiotic prescribing in paediatric outpatients. Arch
Dis Child. 2011; 96:590-5.
5. Bianchi M, Clavenna A, Bonati M. Inter-country variations in anti-asthmatic drug
prescriptions for children. Systematic review of studies published during the 2000-2009
period. Eur J Clin Pharmacol. 2010; 66:929-36.
6. Piovani D, Clavenna A, Cartabia M, Bonati M; Antibiotic Collaborative Group. The regional
profile of antibiotic prescriptions in Italian outpatient children. Eur J Clin Pharmacol. 2012;
68:997-1005.
7. Skinner JS, Fisher ES. Regional disparities in Medicare expenditures: an opportunity for
reform. Nat Tax J 1997;50:413-25.
8. Piovani D, Clavenna A, Bonati M; Interregional Italian Drug Utilisation Group. Drug use
profile in outpatient children and adolescents in different Italian regions. BMC Pediatr.
2013; 13:46. doi: 10.1186/1471-2431-13-46.
9. Sen EF, Verhamme KM, Neubert A, Hsia Y, Murray M, Felisi M, et al: Assessment of
pediatric asthma drug use in three European countries; a TEDDY study. Eur J Pediatr 2011;
170:81–92.
10. Smith LA, Bokhour B, Hohman KH, Miroshnik I, Kleinman KP, Cohn E, et al: Modifiable
risk factors for suboptimal control and controller medication underuse among children with
asthma. Pediatrics 2008; 122:760–769.
11. Stempel DA, McLaughin TP, Stanford RH, Fuhlbrigge AL: Patterns of asthma control: a 3-
year analysis of patient claims. J Allergy Clin Immunol 2005; 115:935–939.

144
12. Cartabia M, Campi R, Clavenna A, Bortolotti A, Fortino I, Merlino L, Bonati M.
Geographical epidemiology of antibacterials in the preschool age. Int J Health Geogr. 2012;
11:52 doi: 10.1186/1476-072X-11-52.
13. Moro ML, Marchi M, Gagliotti C. Why do paediatricians prescribe antibiotics? Results of
an Italian regional project. BMC Pediatr 2009; 6:9–69
14. Ciofi degli Atti ML, Massari M, Bella A, Boccia D, Filia A, Salmaso S. Clinical, social and
relational determinants of paediatric ambulatory drug prescriptions due to respiratory tract
infections in Italy. Eur J Clin Pharmacol 2006; 62:1055–1064
15. de Jong J, Bos JH, de Vries TW, et al. Antibiotic use in children and the use of medicines
by parents. Arch Dis Child. 2012; 97:578-81.
16. Clavenna A, Andretta M, Pilati P, Dusi M, Gangemi M, Gattoni MB, Lombardo G,
Zoccante L, Mezzalira L, Bonati M. Antidepressant and antipsychotic use in an Italian
pediatric population. BMC Pediatr. 2011; 11:40. doi: 10.1186/1471-2431-11-40.
17. Holdø I, Handal M, Skurtveit S, Bramness JG. Association between prescribing hypnotics
for parents and children in Norway. Arch Dis Child. 2013; 98:732-6.
18. Neubert A, Sturkenboom MC, Murray ML, Verhamme KM, Nicolosi A, Giaquinto C, Ceci
A, Wong IC; TEDDY Network of Excellence. Databases for pediatric medicine research in
Europe--assessment and critical appraisal. Pharmacoepidemiol Drug Saf. 2008; 17:1155-67.
19. Jarow JP, LaVange L, Woodcock J. Multidimensional Evidence Generation and FDA
Regulatory Decision Making: Defining and Using "Real-World" Data. JAMA. 2017; 318:703-
704.
20. Clavenna A, Sequi M, Bortolotti A et al. Determinants of the drug utilization profile in
the paediatric population in Italy's Lombardy Region. Br J ClinPharmacol 2009; 67:565-71.
21. Differences in the drug prescriptions to children by Italian paediatricians and general
practitioners. Clavenna A, Sequi M, Bonati M. Eur J Clin Pharmacol. 2010; 66:519-24. doi:
10.1007/s00228-010-0786-5.
145
22. Piovani D, Clavenna A, Sequi M et al. Reducing the costs of paediatric antibiotic
prescribing in the community by implementing guideline recommendations. J Clin Pharm
Ther. 2013; 38:373-8.
23. Bianchi M, Clavenna A, Labate L et al. Anti-asthmatic drug prescriptions to an Italian
paediatric population. Pediatr Allergy Immunol 2009; 20:585-91.
24. Clavenna A, Sequi M, Cartabia M, Fortinguerra F, Borghi M, Bonati M; ENBe Study
Group. Effectiveness of nebulized beclomethasone in preventing viral wheezing: an RCT.
Pediatrics. 2014; 133:e505-12. doi: 10.1542/peds.2013-2404.
25. Bianchi M, Clavenna A, Sequi M, Bonati M. Asthma diagnosis vs. analysis of anti-
asthmatic prescriptions to identify asthma in children. Eur J Clin Pharmacol. 2011; 67:967-8.
doi: 10.1007/s00228-011-1033-4.
26. Bonati M, Clavenna A. The epidemiology of psychotropic drug use in children and
adolescents. Int Rev Psychiatry 2005; 17:181-8.
27. Clavenna A, Cartabia M, Sequi M, et al. Burden of psychiatric disorders in the pediatric
population. Eur Neuropsychopharmacol 2013; 23:98-106.
28. Strom BL (ed) Pharmacoepidemiology, 2005. John Wiley & Sons, West Sussex
29. MacLeod SM Pharmacoepidemiology: a health imperative. J Clin Epidemiol 1991;
44:1285–1286
30. Boots I, Sukhai RN, Klein RH, Holl RA, Wit JM, Cohen AF, Burggraaf J. Stimulation
programs for pediatric drug research do children really benefit? Eur J Pediatr 2007;
166:849–855
31. Hoppu K Paediatric clinical pharmacology: at the beginning of a new era. Eur J Clin
Pharmacol 2008; 64:201–205
32. Olski TM, Lampus SF, Gherarducci G, Saint RA. Three years of paediatric regulation in
the European Union. Eur J Clin Pharmacol 2011; 67:245–252

146
33. Hoppu K, Anabwani G, Garcia-Bournissen F, Gazarian M, KearnsGL, Nakamura H,
Peterson RG, Sri RS, de Wildt SN. The status of paediatric medicines initiatives around the
world-whathas happened and what has not? Eur J Clin Pharmacol 2012; 68:1–10
34. Administrative Data Taskforce. Improving Access for Research and Policy. 2012.
35. Elias P, ESRC Strategic Advisor for Data Resources, editor. The administrative Data
Taskforce: emerging recommentations. Major innovations in the field of administrative
data linkage and analysis; 16/11/2012; London.
36. Bianchi M, Clavenna A, Sequi M, Bortolotti A, Fortino I, Merlino L, Bonati M. Anti-
asthma medication prescribing to children in the Lombardy Region of Italy: chronic versus
new users. BMC Pulm Med. 2011; 11:48.
37. "International Classification of Diseases (ICD)". World Health Organization. Available at:
http://www.who.int/classifications/icd/en/
38. Howie JG, Bigg AR. Family trends in psychotropic and antibiotic prescribing in general
practice. Br Med J. 1980; 280:836-8.
39. Hämeen-Anttila K, Lindell-Osuagwu L, Sepponen K, Vainio K, Halonen P, Ahonen R.
Factors associated with medicine use among children aged under 12 years--a population
survey in Finland. Pharmacoepidemiol Drug Saf. 2010; 19:400-7.
40. Jensen JF, Gottschau M, Siersma VD, Graungaard AH, Holstein BE, Knudsen LE.
Association of maternal self-medication and over-the-counter analgesics for children.
Pediatrics. 2014; 133:e291-8.
41. Log T, Skurtveit S, Selmer R, Tverdal A, Furu K, Hartz I The association between
prescribed opioid use for mothers and children: a record-linkage study. Eur J Clin
Pharmacol. 2013; 69:111-8.
42. Bertoldi AD, Tavares NU, Hallal PC, Araújo CL, Menezes AM. Medicine use among
adolescents: the 11-year follow-up of the 1993 Pelotas (Brazil) birth cohort study. Cad
Saude Publica. 2010; 26:1945-53.
147
43. De Boeck K, Vermeulen F, Meyts I et al. Coprescription of antibiotics and asthma drugs
in children. Pediatrics 2011; 127:1022–6.
44. Petersson C, Håkansson A. High-consulting children indicate illness-prone families. A
study of 38 rural and 38 urban Swedish children’s health and use of medical care. Scand J
Prim Health Care 1996; 14:71–8.
45. André M, Hedin K, Håkansson A, et al. More physician consultations and antibiotic
prescriptions in families with high concern about infectious illness— adequate response to
infection-prone child or self-fulfi lling prophecy? Fam Pract 2007; 24:302–7.
46. Louhi-Pirkanniemi K, Rautava P, Aromaa M, et al. Recurrent antibiotic use in a small
child and the effects on the family. Scand J Prim Health Care 2004; 22:16–21.
47. Kozyrskyj AL, Dahl ME, Chateau DG, et al. Evidence-based prescribing of antibiotics for
children: role of socioeconomic status and physician characteristics. CMAJ 2004; 171:139–
45.
48. Kogan MD, Pappas G, Yu SM, Kotelchuck M. Over-the-counter medication use among
US preschool-age children. JAMA 1994; 272: 1025–1030.
49. Maiman LA, Marshall H, Becker H, Katlic AW. Correlates of mothers’ use of medications
for their children. Soc Sci Med 1986; 22: 41– 51.
50. Clavenna A, Berti A, Gualandi L et al. Drug utilisation profile in the Italian paediatric
population. Eur J Pediatr 2009; 168:173-80.
51. Pandolfini C, Campi R, Clavenna C et al. Italian paediatricians and off-label prescriptions:
Loyal to regulatory or guideline standards? Acta Paediatr 2005; 94:753-7.
52. Strozza S – Standardizzazione diretta e indiretta – available at:
http://www.dipstat.unina.it/insegnamenti0910/demografia/Strozza%20-
%20Standardizzazione%20diretta%20e%20indiretta.pdf
53. Boniol M, Heanue M Chapter 7: Age-standardisation and denominators available at:
http://www.iarc.fr/en/publications/pdfs-online/epi/sp160/CI5vol9-7.pdf

148
54. Jan P. Vandenbroucke. A shortcut method for calculating the 95 per cent confidence
interval of the standardized mortality ratio. Am J Epidemiol 1982; 115:303-304.
55. Clavenna A, Rossi E, Berti A et al. Inappropriate use of anti-asthmatic drugs in the Italian
paediatric population. Eur J ClinPharmacol 2003; 59:565-9.
56. Almqvist C, Wettermark B, Hedlin G et al. Antibiotics and asthma medication in a large
register-based cohort study - confounding, cause and effect. Clin Exp Allergy 2012; 42:104-
11.
57. Paul IM, Maselli JH, Hersh AL, et al. Antibiotic prescribing during pediatric ambulatory
care visits for asthma. Pediatrics 2011; 127:1014-21.
58. Murk W, Risnes KR, Bracken MB. Prenatal or early-life exposure to antibiotics and risk of
childhood asthma: a systematic review. Pediatrics 2011; 127:1125-38.
59. D. Koller, F. Hoffmann, W. Maier et al. Variation in antibiotic prescriptions: is area
deprivation an explanation? Analysis of 1.2 million children in Germany Infection 2013;
41:121-7.
60. Filippini M, Masiero G, Moschetti K. Socioeconomic determinants of regional
differences in outpatient antibiotic consumption: evidence from Switzerland. Health Policy
2006; 78:77–92.
61. Pichichero ME. Understanding antibiotic overuse for respiratory tract infections in
children. Pediatrics 1999; 104:1384–8.
62. Thrane N, Olesen C, Schønheyder HC et al. Socioeconomic factors and prescription of
antibiotics in 0- to 2-year-old Danish children. J Antimicrob Chemother 2003; 51:683–9.
63. Mangrio E, Wremp A, Moghaddassi M et al. Antibiotic use among 8-month-old children
in Malmo¨ , Sweden—in relation to child characteristics and parental sociodemographic,
psychosocial and lifestyle factors. BMC Pediatr 2009; 8;9:31.
64. Cucinotta G, Mazzaglia G, Toscano MA et al. Exploring the variability in antibiotic
prescribing profiles among paediatricians from two different areas of Italy. Pharmacol Res
2002; 45:369–374

149
65. Cazzato T, Pandolfini C, Campi R et al. Drug prescribing in out-patient children in
Southern Italy. Eur J ClinPharmacol 2001; 57:611–616.
66. Caiazzo A, Cardano M, Cois E et al. Inequalities in health in Italy Epidemiol Prev 2004;
28:i-ix, 1-161.
67. Sianesi B. and Van Reenen, "The Returns to Education: Macroeconomics", 2003 Journal
of Economic Surveys Vol. 17, No. 2.
68. Francis NA, Gillespie D, Nuttall J et al. Antibiotics for acute cough: an international
observational study of patient adherence in primary care. Br J Gen Pract. 2012; 62:e429-37.
69. The MTA Cooperative Group. Multimodal Treatment Study of Children with ADHD. A
14-month randomized clinical trial of treatment strategies for attention-
deficit/hyperactivity disorder. Arch Gen Psychiatry 1999; 56: 1073-1086.
70. Tohen M, Kryzhanovskaya L, Carlson G, et al. Olanzapine versus placebo in the
treatment of adolescents with bipolar mania. Am J Psychiatr 2007; 164:1547-1556
71. McCracken, JT, McGough J, Shah B, et al. Research Units on Pediatric
Psychopharmacology Autism Network. Risperidone in children with autism and serious
behavioral problems. N Engl J Med 2002; 347:314-321
72. March J, Silva S, Petrycki S, et al. Fluoxetine, cognitive-behavioral therapy, and their
combination for adolescents with depression: Treatment for Adolescents With Depression
Study (TADS) randomized controlled trial. JAMA 2004; 292:807-820
73. Walkup JT, Albano AM, Piacentini J, et al. Cognitive behavioral therapy, sertraline, or a
combination in childhood anxiety. N Engl J Med 2008; 359:2753-2766
74. Hammad TA, Laughren T, Racoosin J. Suicidality in pediatric patients treated with
antidepressant drugs. Arch Gen Psychiatry 2006; 63:332–339
75. American Diabetes Association, American Psychiatric Association, American Association
of Clinical Endocrinologists, North American Association for the Study of Obesity. Consensus
development conference on antipsychotic drugs and obesity and diabetes. Diabetes Care
2004; 27:596-601.
150
76. McCabe SE, Teter CJ, Boyd CJ, Guthrie SK. Prevalence and correlates of illicit
methylphenidate use among 8th, 10th, and 12th grade students in the United States, 2001.
J Adolesc Health 2004; 35:501-4
77. Stoops WW, Glaser PE, Rush CR. Reinforcing, subject-rated, and physiological effects of
intranasal methylpheni- date in humans: a dose-response analysis. Drug Alcohol Depend
2003; 71:179-86
78. Clavenna A, Rossi E, Derosa M, Bonati M. Use of psychotropic medications in Italian
children and adolescents. Eur J Pediatr 2007; 166:339-47.
79. Zito JM, Safer DJ, de Jong-van den Berg LT et al. A three-country comparison of
psychotropic medication prevalence in youth. Child Adolescent Psychiatry Ment Health
2008; 2:26.
80. Wijlaars LP, Nazareth I, Petersen I. Trends in depression and antidepressant prescribing
in children and adolescents: a cohort study in The Health Improvement Network (THIN).
PLoS One 2012; 7:e33181.
81. Zoega H, Furu K, Halldorsson M, et al. Use of ADHD drugs in the Nordic countries: a
population-based comparison study. Acta Psychiatr Scand 2011; 123:360–367.
82. Mitchell B, Carleton B, Smith A, et al. Trends in psychostimulants and antidepressant
use by children in 2 Canadian provinces. Can J Psychiatry 2008; 53:152–159.
83. Preen DB, Calver J, Sanfilippo FM, et al. Patterns of psychostimulants prescribing to
children with ADHD in Western Australia: variations in age, gender, medication type and
dose prescribed. Aust N Z J Public Health 2007; 31:120–126.
84. Vinker S, Vinker R, Elhayany A. Prevalence of methylphenidate use among Israeli
children:1998–2004. Clin Drug Invest 2006; 26:161–167.
85. Zuvekas SH, Vitiello B. Stimulant medication use in children: a 12 year perspective. Am J
Psychiatry 2012; 169: 160–166.
86. Jensen PS, Goldman E, Offord D, et al. Overlooked and underserved: ‘‘action signs’’ for
identifying children with unmet mental health needs. Pediatrics 2011; 128:970–979.

151
87. Morris J, Belfer M, Daniels A, et al. Treated prevalence of and mental health services
received by children and adolescents in 42 low-and- middle-income countries. J Child
Psychol Psychiatry 2011; 52:1239–1246.
88. Rapoport JL. Pediatric psychopharmacology: too much or too little? World Psychiatry
2013; 12:118-123
89. Taylor E. Pediatric psychopharmacology: Too much and too little. World Psychiatry
2013; 12:124-5.
90. Hoffmann F, Glaeske G, Bachmann CJ. Trends in antidepressant prescriptions for
children and adolescents in Germany from 2005 to 2012. Pharmacoepidemiol Drug Saf.
2014; 23:1268-72.
91. Clavenna A, Andretta M, Pilati P, et al. Antidepressant and antipsychotic use in an Italian
pediatric population. BMC Pediatr 2011; 11:40.
92. L’uso dei farmaci in Italia, Rapporto Osmed 2011 - Osservatorio nazionale sull’impiego
dei medicinali – Italian Medicines Agency; available online at:
http://www.agenziafarmaco.gov.it/sites/default/files/1_-_rapporto_osmed_2011.pdf
93. Blake KV, Devries CS, Arlett P, et al. Increasing scientific standards, independence and
transparency in post-authorisation studies: the role of the European Network of Centres for
Pharmacoepidemiology and Pharmacovigilance. Pharmacoepidemiol Drug Saf 2012;
21:690-696.
94. Steinhausen HC, Bisgaard C. Nationwide time trends in dispensed prescriptions of
psychotropic medication for children and adolescents in Denmark. Acta Psychiatr Scand
2014; 129:221-31.
95. Rani F, Murray ML, Byrne PJ, Wong IC. Epidemiologic features of antipsychotic
prescribing to children and adolescents in primary care in the United Kingdom. Pediatrics
2008; 121:1002-9.
96. McCarthy S, Wilton L, Murray ML, Hodgkins P, Asherson P, Wong IC. The epidemiology
of pharmacologically treated attention deficit hyperactivity disorder (ADHD) in children,

152
adolescents and adults in UK primary care. BMC Pediatr. 2012; 12:78. doi: 10.1186/1471-
2431-12-78.
97. Weinstein SJ, House SA, Chang CH, Wasserman JR, Goodman DC, Morden NE. Small
Geographic Area Variations in Prescription Drug Use. Pediatrics 2014; 134:563-70.
98. Kovess V, Choppin S, Gao F, Pivette M, Husky M, Leray E. Psychotropic Medication Use
in French Children and Adolescents. J Child Adolesc Psychopharmacol. 2015; 25:168-75.
99. Volkers AC, Heerdink ER, van Dijk L. Antidepressant use and off-label prescribing in
children and adolescents in Dutch general practice (2001-2005). Pharmacoepidemiol Drug
Saf 2007; 16:1054-62.
100. Hodgkins P, Sasané R, Meijer WM. Pharmacologic treatment of attention-
deficit/hyperactivity disorder in children: incidence, prevalence, and treatment patterns in
the Netherlands. Clin Ther 2011; 33:188-203.
101. Kalverdijk LJ, Tobi H, van den Berg PB, Buiskool J, Wagenaar L, Minderaa RB, de Jong-
van den Berg LT. Use of antipsychotic drugs among Dutch youths between 1997 and 2005.
Psychiatr Serv 2008; 59:554-60. doi: 10.1176/appi.ps.59.5.554.
102. Bachmann CJ, Lempp T, Glaeske G, Hoffmann F. Antipsychotic prescription in children
and adolescents: an analysis of data from a German statutory health insurance company
from 2005 to 2012. Dtsch Arztebl Int. 2014; 111:25-34.
103. Steffenak AK, Wilde-Larsson B, Nordström G, Skurtveit S, Hartz I. Increase in
psychotropic drug use between 2006 and 2010 among adolescents in Norway: a nationwide
prescription database study. Clin Epidemiol 2012; 4:225-31.
104. Meng X, D'Arcy C, Tempier R. Long-term trend in pediatric antidepressant use, 1983-
2007: a population-based study. Can J Psychiatry 2014; 59:89-97.
105. Alessi-Severini S, Biscontri RG, Collins DM, Sareen J, Enns MW. Ten years of
antipsychotic prescribing to children: a Canadian population-based study. Can J Psychiatry
2012; 57:52-8.

153
106. Brault MC, Lacourse É. Prevalence of prescribed attention-deficit hyperactivity
disorder medications and diagnosis among Canadian preschoolers and school-age children:
1994-2007. Can J Psychiatry. 2012; 57:93-101.
107. Foulon V, Svala A, Koskinen H, Chen TF, Saastamoinen LK, Bell JS. Impact of regulatory
safety warnings on the use of antidepressants among children and adolescents in Finland. J
Child Adolesc Psychopharmacol 2010; 20:145-50.
108. Thomas R, Sanders S, Doust J, Beller E, Glasziou P. Prevalence of Attention-
Deficit/Hyperactivity Disorder: A Systematic Review and Meta-analysis. Pediatrics 2015; pii:
peds.2014-3482.
109. Didoni A, Sequi M, Panei P, Bonati M. Lombardy ADHD Registry Group One-year
prospective follow-up of pharmacological treatment in children with attention-
deficit/hyperactivity disorder. Eur J Clin Pharmacol 2011; 67:1061-7.
110. Bonati M., Reale L Reducing overdiagnosis and disease mongering in ADHD in
Lombardy. BMJ 2013; 347: f7474.
111. Donfrancesco R, Marano A, Calderoni D, Mugnaini D, Thomas F, Di Trani M, Innocenzi
M, Vitiello B. Prevalence of severe ADHD: an epidemiological study in the Italian regions of
Tuscany and Latium. Epidemiol Psychiatr Sci. 2014; 15:1-9.
112. Bianchini R, Postorino V, Grasso R, Santoro B, Migliore S, Burlò C, Tata C, Mazzone L.
Prevalence of ADHD in a sample of Italian students: a population-based study. Res Dev
Disabil 2013; 34:2543-50.
113. European Medicines Agency. European Medicines Agency finalises review of
antidepressants in children and adolescents, 2005. Available online at:
http://www.ema.europa.eu/docs/en_GB/document_library/Referrals_document/SSRI_31/
WC500013082.pdf
114. Wijlaars LP, Nazareth I, Petersen I. Trends in depression and antidepressant
prescribing in children and adolescents: a cohort study in The Health Improvement Network
(THIN). PLoS One 2012; 7:e33181.

154
115. Olfson M, Blanco C, Liu SM, et al. National trends in the office-based treatment of
children, adolescents, and adults with antipsychotics. Arch Gen Psychiatry 2012; 69:1247-
56.
116. Hayes J, Prah P, Nazareth I, et al. Prescribing trends in bipolar disorder: cohort study in
the United Kingdom THIN primary care database 1995-2009. PLoS One 2011; 6:e28725.
117. Pringsheim T, Lam D, Patten SB. The pharmacoepidemiology of antipsychotic
medications for Canadian children and adolescents: 2005-2009. J Child Adolesc
Psychopharmacol 2011; 21:537-43.
118. Karanges EA, Stephenson CP, McGregor IS. Longitudinal trends in the dispensing of
psychotropic medications in Australia from 2009-2012: Focus on children, adolescents and
prescriber specialty. Aust N Z J Psychiatry 2014; 48:917-31.
119. Dörks M, Langner I, Dittmann U, Timmer A, Garbe E. Antidepressant drug use and off-
label prescribing in children and adolescents in Germany: results from a large population-
based cohort study. Eur Child Adolesc Psychiatry. 2013; 22:511-8.
120. Volkers AC, Heerdink ER, van Dijk L. Antidepressant use and off-label prescribing in
children and adolescents in Dutch general practice (2001-2005). Pharmacoepidemiol Drug
Saf. 2007; 16:1054-62.
121. Leslie DL, Rosenheck R. Off-label use of antipsychotic medications in Medicaid. Am J
Manag Care. 2012; 18:e109-17.
122. Piovani D, Clavenna A, Cartabia M, Bonati M. Antibiotic and anti-asthmatic drug
prescriptions in Italy: geographic patterns and socio-economic determinants at the district
level. Eur J Clin Pharmacol 2014; 70:331-7.
123. Clavenna A, Sequi M, Bonati M. Drug prescribing by Italian family paediatricians: an
exception? Acta Paediatr 2010; 99:754-7.
124. Garattini S. Are me-too drugs justified? J Nephrol 1997; 10:283-94.
125. Gagne JJ, Choudhry NK. How many "me-too" drugs is too many? JAMA 2011; 305:711-
2.

155
126. Essential Medicines List for Children, World Health Organization, 4rd edition, 2013
available online at:
http://www.who.int/medicines/publications/essentialmedicines/4th_EMLc_FINAL_web_8J
ul13.pdf
127. Laing R, Waning B, Gray A, Ford N, 't Hoen E. 25 years of the WHO essential medicines
lists: progress and challenges. Lancet 2003; 361:1723-9
128. World Health Organization. WHO Medicines Strategy 2008-2013, Draft 8
http://www.who.int/medicines/publications/Medicines_Strategy_draft08-13.pdf, 12
February 2013.
129. Bjerrum L, Bergman U. Wide variation in the number of different drugs prescribed by
general practitioners. A prescription database study. Scand J Prim Health Care 2000; 18:94-
8.
130. Chinburapa V, Larson LN, Brucks M, Draugalis J, Bootman JL, Puto CP. Physician
prescribing decisions: the effects of situational involvement and task complexity on
information acquisition and decision making. Soc Sci Med 1993; 36:1473-82.
131. Reidenberg MM. Can the selection and use of essential medicines decrease
inappropriate drug use? Clin Pharmacol Ther 2009; 85:581-3.
132. Campi R, Garattini L, Tediosi F, Bonati M. Pharmacoeconomics analysis of prescription
in Italian pediatric general practice. Eur J Health Econ 2002; 3:261-6.
133. Sturkenboom MC, Verhamme KM, Nicolosi A, Murray ML, Neubert A, Caudri D et al;
TEDDY European Network of Excellence Drug use in children: cohort study in three
European countries. BMJ 2008; 337:a2245.
134. The Role of Generic Medicines in Europe; European Generic Medicines Association;
available at: http://198.170.119.137/gen-geneurope.htm
135. Baguley D, Lim E, Bevan A, Pallet A, Faust SN. Prescribing for children - taste and
palatability affect adherence to antibiotics: a review. Arch Dis Child 2012; 97:293-7.

156
136. Fabiano V, Mameli C, Cattaneo D, Delle Fave A, Preziosa A, Mele G. Perceptions and
patterns of use of generic drugs among Italian family pediatricians: first round results of a
web survey. Health Policy 2012; 104:247-52.
137. Constipation in children and young people: NICE guidance available, disponibile online:
http://guidance.nice.org.uk/CG99/NICEGuidance/pdf/English
138. Bacharier LB, Boner A, Carlsen KH, Eigenmann PA, Frischer T, Götz M et al. European
Pediatric Asthma Group. Diagnosis and treatment of asthma in childhood: a PRACTALL
consensus report. Allergy 2008; 63:5–34.
139. van Asperen Peter P, Mellis CM, Sly PD. Thoracic Society of Australia and New Zealand.
The role of corticosteroids in the management of childhood asthma. Med J Aust 2002;
176:168-73.
140. Principi N, Bianchini S, Baggi E, Esposito S. No evidence for the effectiveness of
systemic corticosteroids in acute pharyngitis, community-acquired pneumonia and acute
otitis media. Eur J Clin Microbiol Infect Dis 2013; 32:151-60.
141. Bonati M, Pandolfini C. Is it time for a European formulary of paediatric medicines?
Arch Dis Child 2004; 89:890-1.
142. Generic Medicines in Europe; European Generic Medicines Association;
http://www.egagenerics.com (last date accessed 28/01/2014).
143. Il ruolo del farmaco generico nella gestione della spesa sanitaria pubblica;
http://www.assogenerici. org/2011/centrostudi2.asp?s=2&p=2&modulo=mercato (last
date accessed 28/01/2014).
144. Chen AY, Wu S. Dispensing Pattern of Generic and Brand-Name Drugs in Children.
Ambulatory Pediatrics 2008; 8:189-94.
145. Clavenna A, Marco Sequi M, Bonati M. Differences in the drug prescriptions to
children by Italian paediatricians and general practitioners. Eur J Clin Pharmacol 2009;
66:519-24.

157
146. Guideline on the investigation of bioequivalence, European Medicine Agency,
available at:
http://www.ema.europa.eu/docs/en_GB/document_library/Scientific_guideline/2010/01/
WC500070039.pdf
147. Meredith PA. Potential concerns about generic substitution: bioequivalence versus
therapeutic equivalence of different amlodipine salt forms. Curr Med Res Opin. 2009;
25:2179-89.
148. Kesselheim AS, Stedman MR, Bubrick EJ Seizure outcomes following the use of generic
versus brand-name antiepileptic drugs: a systematic review and meta-analysis. Drugs. 2010;
70:605-21.
149. Tam J. Use of generic antibiotics in children. Pediatr Ann. 1996; 25:614-7.
150. Nightingale CH. A survey of the quality of generic clarithromycin products from 18
countries. Clin Drug Investig. 2005; 25:135-52.
151. Del Tacca M, Pasqualetti G, Di Paolo A et al. Lack of pharmacokinetic bioequivalence
between generic and brand name amoxicillin formulations. A post-marketing clinical study
on healthy volunteers. Br J Clin Pharmacol. 2009; 68:34-42.
152. García-Arieta A. The failure to show bioequivalence is not evidence against generics. Br
J Clin Pharmacol. 2010; 70:452-3.
153. Galan-Herrera JF, Poo JL, Rosales-Sanchez O et al. Bioavailability of two oral
formulations of a single dose of levofloxacin 500 mg: an open-label, randomized, two-
period crossover comparison in healthy Mexican volunteers. Clin Ther. 2009; 31:1796-803.
154. Asiri YA, Al-Hadiya BM, Kadi AA et al. Comparative bioavailability study of cefuroxime
axetil (equivalent to 500 mg cefuroxime/tablet) tablets (Zednad® versus Zinnat®) in healthy
male volunteers. Int J Clin Pharmacol Ther. 2011; 49:571-6.
155. Leelarasamee A, Rongrungruang Y, Trakulsomboon S et al. Bioequivalence,
antibacterial activity and therapeutic outcome of a generic meropenem (Mapenem). J Med
Assoc Thai. 2008; 91:980-8.

158
156. Snyman JR, Schoeman HS, Grobusch MP et al. Generic versus non-generic formulation
of extended-release clarithromycin in patients with community-acquired respiratory tract
infections: a prospective, randomized, comparative, investigator-blind, multicentre study.
Clin Drug Investig. 2009; 29:265-74
157. Cohen R, de La Rocque F, Lécuyer A et al. Study of the acceptability of antibiotic
syrups, suspensions, and oral solutions prescribed to pediatric outpatients. Eur J Pediatr.
2009; 168:851-7.
158. El-Chaar GM, Mardy G, Wehlou K et al. Randomized, double blind comparison of brand
and generic antibiotic suspensions: II. A study of taste and compliance in children. Pediatr
Infect Dis J. 1996; 15:18-22.
159. Piyasirisilp S, Premprawat W, Thamlikitkul V. Therapeutic equivalence of generic
imipenem/cilastatin for therapy of infections at Siriraj Hospital. J Med Assoc Thai. 2010; 93
Suppl 1:S117-25.
160. Punpanich W, Srisarang S, Prachantasen U. Therapeutic effectiveness of the generic
preparation of meropenem (Mapenem) in the treatment of moderate to severe infection in
children. J Med Assoc Thai. 2012; 95:895-902.
161. Charoenpong L, Tongsai S, Thamlikitkul V. Effectiveness and safety of generic
formulation of piperacillin/tazobactam (Astaz-P) for treatment of infected patients at Siriraj
Hospital. J Med Assoc Thai. 2013; 96 Suppl 2:S104-10.
162. Iommarini A, Sequi M, Cartabia M et al. Generic antibiotic prescription to children in
the Lombardy Region Medico e Bambino 2013; 32:173-178
163. Shrank WH, Liberman JN, Fischer MA et al. Physician perceptions about generic drugs.
Ann Pharmacother. 2011; 45:31-8.
164. Quintal C, Mendes P. Underuse of generic medicines in Portugal: an empirical study on
the perceptions and attitudes of patients and pharmacists. Health Policy. 2012; 104:61-8.

159
165. Schneeberger C, Stolk RP, Devries JH et al. Differences in the pattern of antibiotic
prescription profile and recurrence rate for possible urinary tract infections in women with
and without diabetes. Diabetes Care. 2008; 31:1380-5.
166. Belongia EA, Schwartz B. Strategies for promoting judicious use of antibiotics by
doctors and patients. BMJ. 1998; 317:668-71.
167. Pichichero ME, Green JL, Francis AB et al. Outcomes after judicious antibiotic use for
respiratory tract infections seen in a private pediatric practice. Pediatrics. 2000; 105:753-9.
168. L. Mauri, M. Narducci, A. Nova et al. Primary care paediatrician’s antibiotic
prescription and self-help use in respiratory infections. Medico e Bambino 2010; 29:565-
574
169. de Bie S, Kaguelidou F, Verhamme KM. Using Prescription Patterns in Primary Care to
Derive New Quality Indicators for Childhood Community Antibiotic Prescribing. Pediatr
Infect Dis J 2016; 35:1317-1323.
170. Nova A, Narducci M, Zanetto F et al. Systemic antibiotic prescription in family
paediatrics health services Quaderni acp 2008; 15:106-111
171. NICE - National Institute for Health and Clinical Excellence. Centre for Clinical Practice.
Respiratory tract infections - antibiotic prescribing. Prescribing of antibiotics for self-limiting
respiratory tract infections in adults and children in primary care (Clinical guideline, n. 69).
London (UK), 2012.
172. Shaikh N, Leonard E, Martin JM Prevalence of streptococcal pharyngitis and
streptococcal carriage in children: a meta-analysis Pediatrics. 2010; 126:e557-64.
173. Shulman ST, Bisno AL, Clegg HW et al. Clinical practice guideline for the diagnosis and
management of group A streptococcal pharyngitis: 2012 update by the Infectious Diseases
Society of America. Clin Infect Dis. 2012; 55:1279-82.
174. Acute otitis media in childhood. Regional guideline. Agenzia sanitaria e sociale
dell’Emilia-

160
Romagna, May 2015. http://assr.regione.emilia-
romagna.it/it/servizi/pubblicazioni/dossier/doss254/at_download/file (last accessed April
2017)
175. Howie VM, Ploussard JH. Efficacy of fixed combination antibiotics versus separate
components in otitis media. Effectiveness of erythromycin estrolate, triple sulfonamide,
ampicillin, erythromycin estolate- triple sulfonamide, and placebo in 280 patients with
acute otitis media under two and one-half years of age. Clin Pediatr 1972; 11:205–14.
176. AAP - American Academy of Pediatrics; Lieberthal AS, Carroll AE, Chonmaitree T,
Ganiats TG, Hoberman A, Jackson MA, Joffe MD, Miller DT, Rosenfeld RM, Sevilla XD,
Schwartz RH, Thomas PA, Tunkel DE. The diagnosis and management of acute otitis media.
Pediatrics, 131: e964- e999, 2013.
177. Jacobs MR, Dagan R, Appelbaum PC et al. Prevalence of antimicrobial-resistant
pathogens in middle ear fluid: multinational study of 917 children with acute otitis media.
Antimicrob Agents Chemother. 1998; 42:589-95.
178. M Harris, J Clark, N Coote et al. Guidelines for the management of community
acquired pneumonia in children: update 2011 Thorax 2011; 66:ii1eii23.
doi:10.1136/thoraxjnl-2011-200598
179. Esposito S, Cohen R, Javier Domingo JD, et al. Antibiotic therapy for pediatric
community-acquired pneumonia: do we know when, what and for how long to treat?
Pediatric Infect Dis J 2012; 31:e78-85. doi:10.1097/INF.0b013e318255dc5b.
180. Wald ER, Applegate KE, Bordley C et al; American Academy of Pediatrics. Clinical
practice guideline for the diagnosis and management of acute bacterial sinusitis in children
aged 1 to 18 years. Pediatrics. 2013; 132:e262-80.
181. Erkoçoğlu M, Kaya A, Civelek E et al. Prevalence of confirmed immediate type drug
hypersensitivity reactions among school children. Pediatr Allergy Immunol. 2013; 24:160-7.
doi: 10.1111/pai.12047.

161
182. Lange L, Koningsbruggen SV, Rietschel E. Questionnaire-based survey of lifetime-
prevalence and character of allergic drug reactions in German children. Pediatr Allergy
Immunol 2008; 19:634–8.
183. Orhan F, Karakas T, Cakir M et al. Parental-reported drug allergy in 6- to 9-yr-old urban
schoolchildren. Pediatr Allergy Immunol 2008; 19:82–5.
184. Anselin, Luc. "Local Indicators of Spatial Association—LISA" Geographical Analysis
27:93–115,1995.
185. Dik JW, Sinha B, Friedrich AW et al. Cross-border comparison of antibiotic prescriptions
among children and adolescents between the north of the Netherlands and the north-west
of Germany. Antimicrob Resist Infect Control. 2016; 5:14. doi: 10.1186/s13756-016-0113-8.
186. Holstiege J, Garbe E. Systemic antibiotic use among children and adolescents in
Germany: a population-based study. Eur J Pediatr. 2013; 172:787-95.
187. Youngster I, Avorn J, Belleudi V, Cantarutti A, Díez-Domingo J, Kirchmayer U et al.
Antibiotic Use in Children - A Cross-National Analysis of 6 Countries. J Pediatr. 2017;
182:239-244.e1. doi: 10.1016/j.jpeds.2016.11.027.
188. Pulcini C, Lions C, Ventelou B, Verger P Indicators show differences in antibiotic use
between general practitioners and paediatricians. Eur J Clin Microbiol Infect Dis. 2013;
32:929-35.
189. Ivanovska V, Hek K, Mantel Teeuwisse AK, Leufkens HG, Nielen MM, van Dijk L
Antibiotic prescribing for children in primary care and adherence to treatment guidelines. J
Antimicrob Chemother. 2016; 71:1707-14.
190. Tell D, Engström S, Mölstad S. Adherence to guidelines on antibiotic treatment for
respiratory tract infections in various categories of physicians: a retrospective cross-
sectional study of data from electronic patient records. BMJ Open. 2015; 5:e008096.
191. Salvo F, Polimeni G, Moretti U et al. Adverse drug reactions related to amoxicillin alone
and in association with clavulanic acid: data from spontaneous reporting in Italy. J
Antimicrob Chemother. 2007; 60:121-6.

162
192. Baguley D, Lim E, Bevan A et al. Prescribing for children taste and palatability affect
adherence to antibiotics: a review. Arch Dis Child 2012; 97:293–7.
193. Holstiege J, Enders D, Schink T et al. Trends in paediatric macrolide use in five
European countries-a population-based study. Eur J Clin Pharmacol 2015; 71:991-9.
194. Arnold SR, Straus SE. Interventions to improve antibiotic prescribing practices in
ambulatory care. Cochrane Database of Systematic Reviews. 2005 , Issue 4. Art. No.
CD003539. DOI: 10.1002/14651858.CD003539.pub2.
195. Roy-Byrne P, Russo J, Dugdale DC et al. Undertreatment of panic disorder in primary
care: role of patient and physician characteristics. J Am Board Fam Pract. 2002; 15:443-50.
196. Choudhry NK, Fletcher RH, Soumerai SB. Systematic review: the relationship between
clinical experience and quality of health care. Ann Intern Med. 2005; 142:260-73.