terry field, d.sc. meyers primary care institute university of massachusetts medical school, fallon...
TRANSCRIPT

Estimating the ROI for Computerized Clinical Decision Support Systems:
Pieces of the Puzzle
Terry Field, D.Sc.Meyers Primary Care Institute
University of Massachusetts Medical School, Fallon Community Health Plan, Fallon Clinic

Pieces of the PuzzleAdding CDSS to Existing EHR
• Development and implementation costs• Immediate, direct costs and savings• Potential additional savings

Development CostExample 1
• Long-term care setting• CDSS to provide prescribers with patient-
specific maximum dosing recommendations based on renal function
• Added to a commercial EHR with integrated CPOE (Meditech)
• Included 62 drugs; 94 alerts specific to the level of renal insufficiency
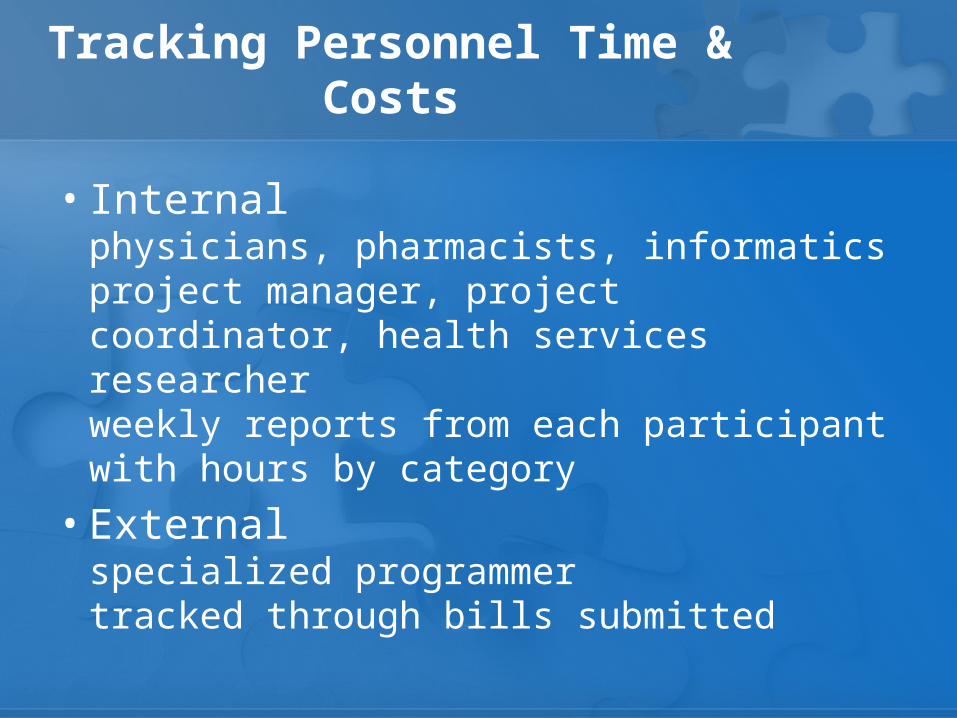
Tracking Personnel Time & Costs
• Internal physicians, pharmacists, informatics project manager, project coordinator, health services researcherweekly reports from each participant with hours by category
• Externalspecialized programmertracked through bills submitted

Cost Analysis
• Reported hours combined with US national average hourly wages for the appropriate personnel categories
• Submitted bills from external programmer

Results – Personnel Time & Costs
Category Hours Cost ($)
% of total time
Physicians 414 25, 902 45
Pharmacist – MS 120 5,307 13
Pharmacist – BS 60 1,814 6
Informatics Project Manager 122 4,987 13
Project Coordinator 80 1,315 9
Researcher 18 529 2
Programmer 110 8,813 12
Total 924 48,668
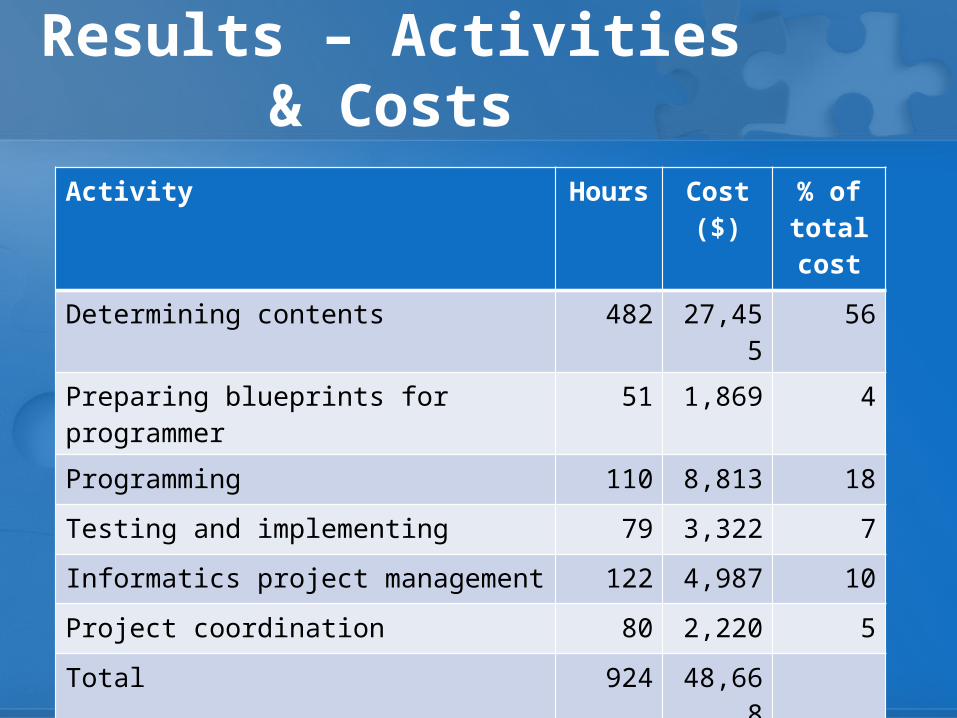
Results – Activities & Costs
Activity Hours Cost ($) % of total cost
Determining contents 482 27,455 56
Preparing blueprints for programmer 51 1,869 4
Programming 110 8,813 18
Testing and implementing 79 3,322 7
Informatics project management 122 4,987 10
Project coordination 80 2,220 5
Total 924 48,668

Alternative Scenarios
1) CPOE system does not require specialized programmerHours: 924, Cost: $43,268
2) Database for renal dosing existsHours: 657, Cost: $34,201
3) CDSS Product existsHours: 475, Cost: $23,695

Development CostExample 2
• Ambulatory setting – large group practice• Automated alert system to provide PCPs with:
- notification of hospital and SNF discharges- new drugs added during hospital stay- recommendations related to dosing and monitoring - reminders to support staff to schedule follow- up visit
• Added to a commercial EHR with CPOE (EpicCare Ambulatory EMR)

Results – Personnel Time & Costs
Category Hours Cost ($) % of total time
Physicians 614 55,340 47
Operations research analyst 370 12,561 28
Research assistant 202 3,885 16
Registered nurse 58 1,873 4
Computer software engineer 40 1,692 3
Database administrator 17 597 1
Pharmacist 7 367 1
Total 1,308 76,314

Results – Activities & Costs
Activity Hours Cost ($) % of total cost
Determining content 169 14,977 20
Designing and preparing HIT application 330 15,847 20
Developing blueprints for programming 325 14,917 20
Programming 273 17,406 23
Testing/revising 164 8,954 11
Project management 22 1983 3
Maintaining 26 2,231 3

Special Issues in Development Costs
• Substantial time required from clinical personnel!- determining contents (or reviewing if purchased)- extensive time spent testing
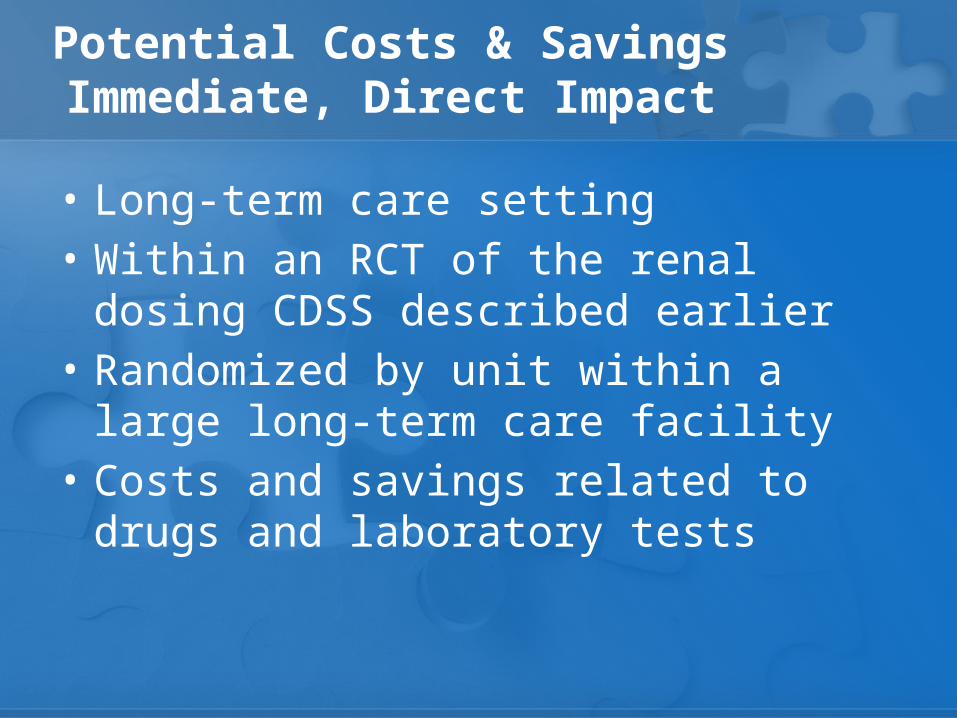
Potential Costs & SavingsImmediate, Direct Impact
• Long-term care setting• Within an RCT of the renal dosing CDSS
described earlier• Randomized by unit within a large long-term
care facility• Costs and savings related to drugs and
laboratory tests

Tracking Costs & Savings
• Drugs that triggered an alert as prescriber began the order vs. drugs actually ordered
• All drug orders for the day of an alert reviewed to identify potential substitutes
• Drug costs based on US wholesale price at the time• Serum creatinine tests ordered within 24 hrs of
alert of missing lab information – costs based on Medicare allowable payments at the time of the order

Analysis
• Within both intervention and control units, we compared costs for initial vs. final submitted drug orders
• Adjusted findings from the intervention units by findings in the control units Note: even in the control units, prescribers changed their minds during an order!
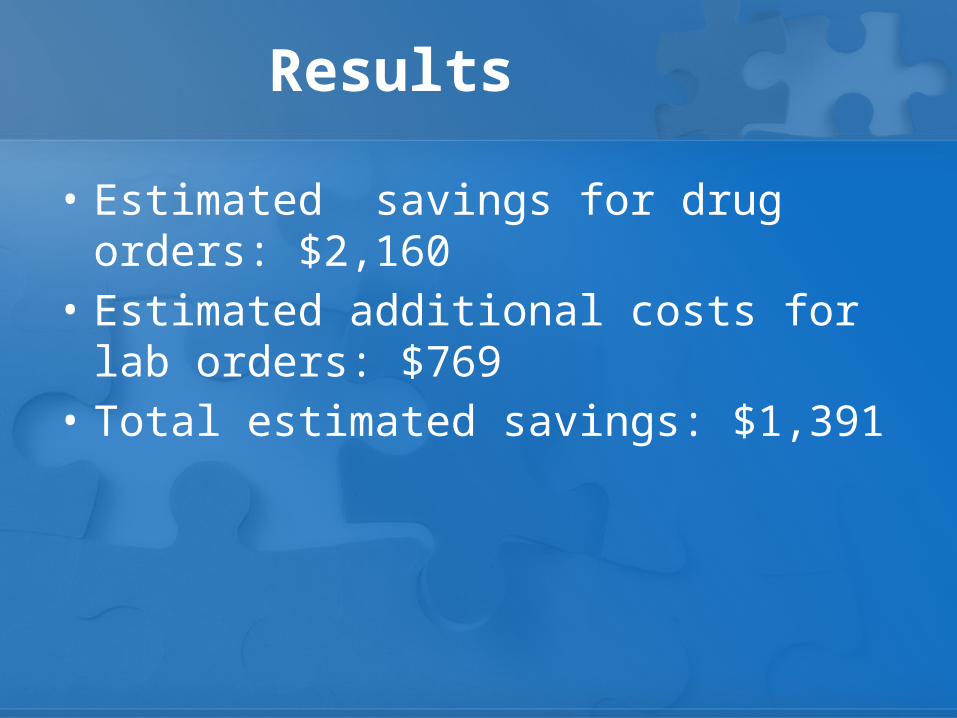
Results
• Estimated savings for drug orders: $2,160• Estimated additional costs for lab orders: $769• Total estimated savings: $1,391

Potential Additional Savings:Reduced ADEs
• Setting: large, multispecialty group practice providing care to >30,000 Medicare enrollees
• Case-control study nested in a cohort study that identified adverse drug events from 7/1/1999 to 6/30/2000
• Control group – for each subject with an event, we randomly selected a control matched by having an encounter and dispensing in the month prior to the event

Determination of Costs
• Outcome measure: costs of medical care from 6 weeks prior to the event through 6 weeks after
• In-patient stays, ED visits – national average of cost-to-charge ratios
• MD visits, dx tests, therapy, lab, ambulance use, home health, DME – Medicare fee schedules
• Pharmaceuticals – average wholesale cost on day dispensed

Analysis
• Average total costs for cases and controls calculated and plotted
• Estimated surge in costs calculated by subtracting pre-event costs from post-event costs for each individual
• MVA with cost surge as outcome and case status as exposure, controlling for confounders
• Analyzed for 1225 case/control pairs and 325 pairs for preventable ADEs

Results
0.00
500.00
1000.00
1500.00
2000.00
2500.00
Total costs in 2-week periods before and after the ADE
Cases
Controls
12-11 10-9 8-7 6-5 4-3 2-1 1-2 3-4 5-6 7-8 9-10 11-12
Pre-Period Post-PeriodDay of the ADE
Weeks Before and After Day of ADE

ResultsComponent of cost Increase in costs after
preventable ADE* (95% confidence interval)
Total 1983 (193, 3773)
In-patient stays 1222 (-320, 2763)
ED visits 111 (17, 205)
Out-patient care 571 (227, 915)
Prescribed meds 79 (24, 134)
*Controlling for age, gender, Charlson comorbidity index, # scheduled meds, hospitalization in pre-period

Extrapolation
• 1,000 enrollees age 65+ for 1 year13.8 preventable ADEs$27,365 (CI $2,663, $52,067) in 2000 dollars
• All Medicare enrollees age 65+ in 2000$887 million for preventable adverse drug events

Summary
• Development costs are significant • Development (or even implementation)
requires extensive time from clinicians• Immediate, direct cost savings may be minor• Savings from reductions in adverse events are
likely to be substantial• Complete, detailed tracking of adverse events
and their associated costs is a large and expensive task!